Abstract
The mechanical behavior and cortical tension of single cells are analyzed using electrodeformation relaxation. Four types of cells, namely, MCF-10A, MCF-7, MDA-MB-231, and GBM, are studied, with pulse durations ranging from 0.01 to 10 s. Mechanical response in the long-pulse regime is characterized by a power-law behavior, consistent with soft glassy rheology resulting from unbinding events within the cortex network. In the subsecond short-pulse regime, a single timescale well describes the process and indicates the naive tensioned (prestressed) state of the cortex with minimal force-induced alteration. A mathematical model is employed and the simple ellipsoidal geometry allows for use of an analytical solution to extract the cortical tension. At the shortest pulse of 0.01 s, tensions for all four cell types are on the order of 10−2 N/m.
I. INTRODUCTION
Cortical tension of cells plays ubiquitous roles in the organization of cell aggregates, tissues, and cell clusters and in biological processes such as mechanotransduction, morphogenesis, cancer metastasis, and wound healing [1–8]. Coactive with adhesion and other mechanisms, they determine the tissue surface tension and cell sorting [9,10], the rigidity transition in a confluent tissue [11], and the translocation behavior of a cluster of circulating tumor cells [12]. They are the key cellular-level properties affecting the collective behavior, especially in regimes where strong bonds between the cells and extracellular matrix are absent or not yet formed.
Quantifying cortical tension, however, is a challenging task, as it is a state variable and subtly different although closely related to other properties such as the apparent moduli. In typical studies using atomic force microscopy or pipetting methods, the force (indentation or suction pressure, respectively) is usually applied for 1–100 s and the cortical tension is extracted via a cortical-shell–liquid-core or elastic-shell model [13–18]. While these approaches indeed provide cues on the cell mechanical behavior, from a quantitative perspective, the properties already deviate from those in the naive undisturbed state due to prolonged force application. For example, Trepat et al. demonstrated that a single transient biaxial stretch of 10% and 4 s can decrease cell stiffness by 50% [19]. This is not surprising; an extensive body of data exists and establishes the mechanically adaptive nature of cells, in part because the cell cortex is a nonpermanent network [20]. Prior studies commonly indicate different regimes of behavior as a function of force application time or frequency [18,20–23]. In the lower-frequency regime, cell deformation follows a well-established power-law behavior with a typical exponent around 0.2–0.4; in the high-frequency regime, the exponent may eventually approach 3/4. From a theoretical perspective, the former is interpreted with soft glassy rheology (SGR) [24,25], characterized by yielding events. In the case of cells, these yielding events are presumably due to unbinding of cross-linked actin filaments [20,22,26–28]. On the other hand, the exponent of 3/4 on the high-frequency side can be readily derived from a wormlike-chain theory in the low-tension limit and the measured properties better reflect the viscoelastic behavior of the actin filaments per se [29]. The demarcating frequency is typically around several hertz, corresponding to an unbinding timescale around 1 s [28,30]. These prior works therefore allude to the possibility that cortical tension in its naive state is best quantified in the moderate- to high-frequency (low force application time) regime where the structure-modifying unbinding events are not or minimally initiated.
This work tackles single-cell mechanical analysis and cortical tension quantification via electrodeformation. Electrodeformation is a contactless method where whole-cell deformation is induced via electrostatic forcing, through the application of an external direct- or alternating-current electric field [31–33]. Forces (known as the Maxwell stress) focus on the membrane or cortex, which is the primary conductance barrier separating the cytoplasm and the surroundings. Both stress and strain distributions are usually simple, an advantage that avoids difficulty in analysis due to complex geometry. Indeed, deformations are typically ellipsoidal, which is the leading-order mode in spherical harmonics [34–36]. This technique is largely implemented in a microfluidic setting and hence has the potential to achieve high throughput [37–42]. On the other hand, these studies all probe the cells in the low-frequency SGR regime, with very long-pulse durations ranging from 25 to 75 s. In contrast, the present work intends to achieve two objectives. First, we will systematically vary pulse duration by three orders of magnitudes to quantify the frequency-dependent behavior of whole-cell deformation in this scheme and to identify regimes of behavior. Second, with particular attention on the short-pulse (high-frequency) regime, we will extract cortical tension based on the deformation relaxation. We achieve this objective by using an analytical solution derived from a rigorous mathematical model describing the viscoelastic behavior of the cortex in a tensioned or prestressed state.
II. MATERIALS AND METHODS
A. Cell culture
MDA-MB-231, MCF-7, and MCF-10A cells were obtained from American Type Culture Collection (Manassas, VA). Glioblastoma multiforme (GBM) cells were provided by one of our laboratories (R.A.F.) and were previously isolated and characterized [43]. Cells were maintained in a cell culture incubator (5% CO2, 37 °C) in Dulbecco’ s Modified Eagle’ s Medium (Sigma-Aldrich, St. Louis, MO) supplemented with 10% fetal bovine serum, 1% Penicillin-Streptomycin, and 1% L-glutamine (Sigma-Aldrich). Cells were trypsinized for 5 min in the incubator using 0.5% trypsin/ethylenediaminetetraacetic acid (Sigma-Aldrich) followed by centrifugation for 2 min at 2000 rpm (Allegra X-21, Beckman Coulter, Brea, CA) in culture media and then twice in electrodeformation isotonic buffer containing 250 mM sucrose. The osmolarity and electrical conductivity were measured with an osmometer (3D3 Osmometer, Advanced Instruments, Norwood, MA) and conductivity meter (CON 6, Oakton Instruments, Vernon Hills, IL) and adjusted to 310 mOsm/kg and 10 μS/cm, respectively. To ensure the cell viability and membrane integrity during the experiment 1% (vol %) 40 μg/ml propidium iodide (Molecular Probes, Inc., Eugene, OR) was added to the electrodeformation buffer.
B. Device fabrication and experimental setup
An indium tin oxide (ITO) (140 nm) coated glass slide was purchased from Structure Probe, Inc. (West Chester, PA). The ITO coated glass slide was soaked in acetone, isopropanol, and deionized water, respectively, for 10 min each, dehydrated in 200 °C for 30 min, and then an S1818 photoresist layer was deposited on top. The electrodes’ gap pattern was developed by a photomask with a 35-μm gap fabricated by CAD Art Services, Inc. (Bandon, OR). The photomask and general design followed prior work [44,45]. The coated glass slide was exposed to UV light through a mask aligner and the parallel microelectrodes were developed on the photoresist. Unprotected ITO regions were etched with 5% hydrochloric acid for 15–20 min and photoresist was removed with acetone. An exemplary image of the chip near the electrode gap is shown in Fig. 1(a).
FIG. 1.
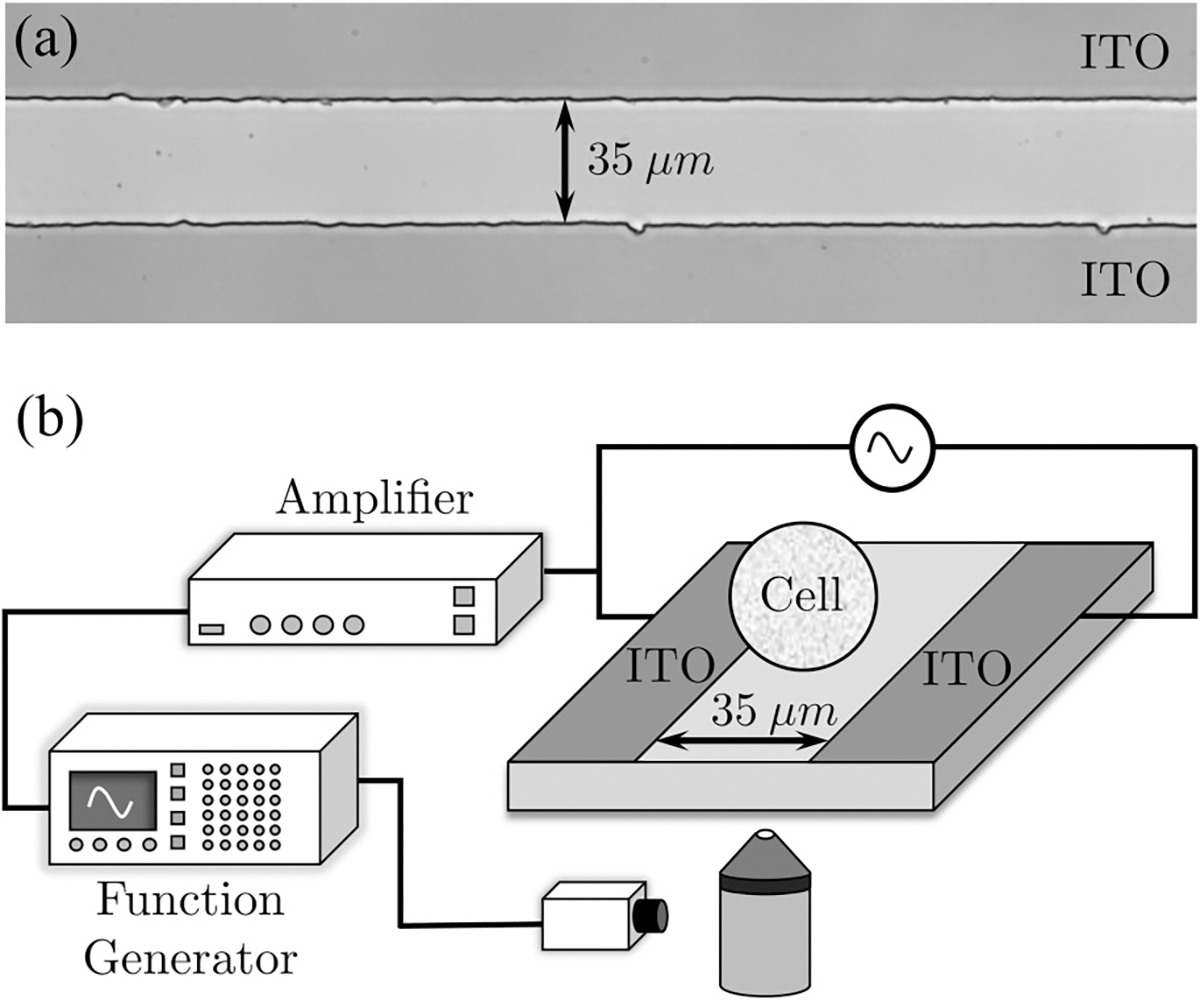
(a) Exemplary image of the etched ITO slide where the conductive coating is separated by a 35-μm gap. (b) Schematic of the experimental setup.
The chip was placed on an inverted microscope (Olympus IX71, Center Valley, PA) with a 40× objective and was connected via conductive tapes to a high-voltage, high-frequency amplifier (Trek Model PZD 350, Lockport, NY), which in turn connected to a function generator [Tektronix AFG3022C, Melrose, MA, Fig. 1(b)]. Pulses were delivered to the chip which resulted in electrodeformation. Images of the cells were recorded with a synchronized high-speed camera (pco.edge sCMOS, PCO AG, Kelheim, Germany) at 20–1000 frames/s.
C. Electrodeformation protocol
Approximately 40 μl of cell solution (200 cells/μl) was dropped on the chip. A coverslip was gently placed on top to contain the drop and to minimize motion due to flow. A small AC voltage ( and ) was first applied to capture the cells near one of the electrode edges via dielectrophoresis. This minimized the translation of cells during deformation relaxation. Subsequently, a high-amplitude, high-frequency AC pulse was applied to deform the cells (1–15 kV/cm, 5–8 MHz, and 0.01–10 s). This pulse range was carefully designed to effectively deform the cells without electroporation; the high-frequency range led to small transmembrane potentials [0.06–0.62 V per calculation using a COMSOL simulation (see Appendix E)]. Upon pulse cessation, the deformed cell shape relaxed to its original shape. Before and after the electrodeformation-relaxation process, cell membrane integrity was assayed by a standard propidium iodide test; cases (around 5% of total) showing membrane permeabilization are not included in the analysis due to the compromised structure. In addition, Joule heating is estimated to cause a temperature rise of 1 °C–3 °C for typical pulse conditions, which we regard as negligible.
Exemplary images of cell deformation relaxation are shown in Fig. 2. A custom-made image-processing code was developed in MATLAB (MathWorks, Natick, MA) to automatically detect the cell boundaries (dashed lines in Fig. 2) and also to automatically identify and with Fourier analysis, following one of our prior works [46].
FIG. 2.
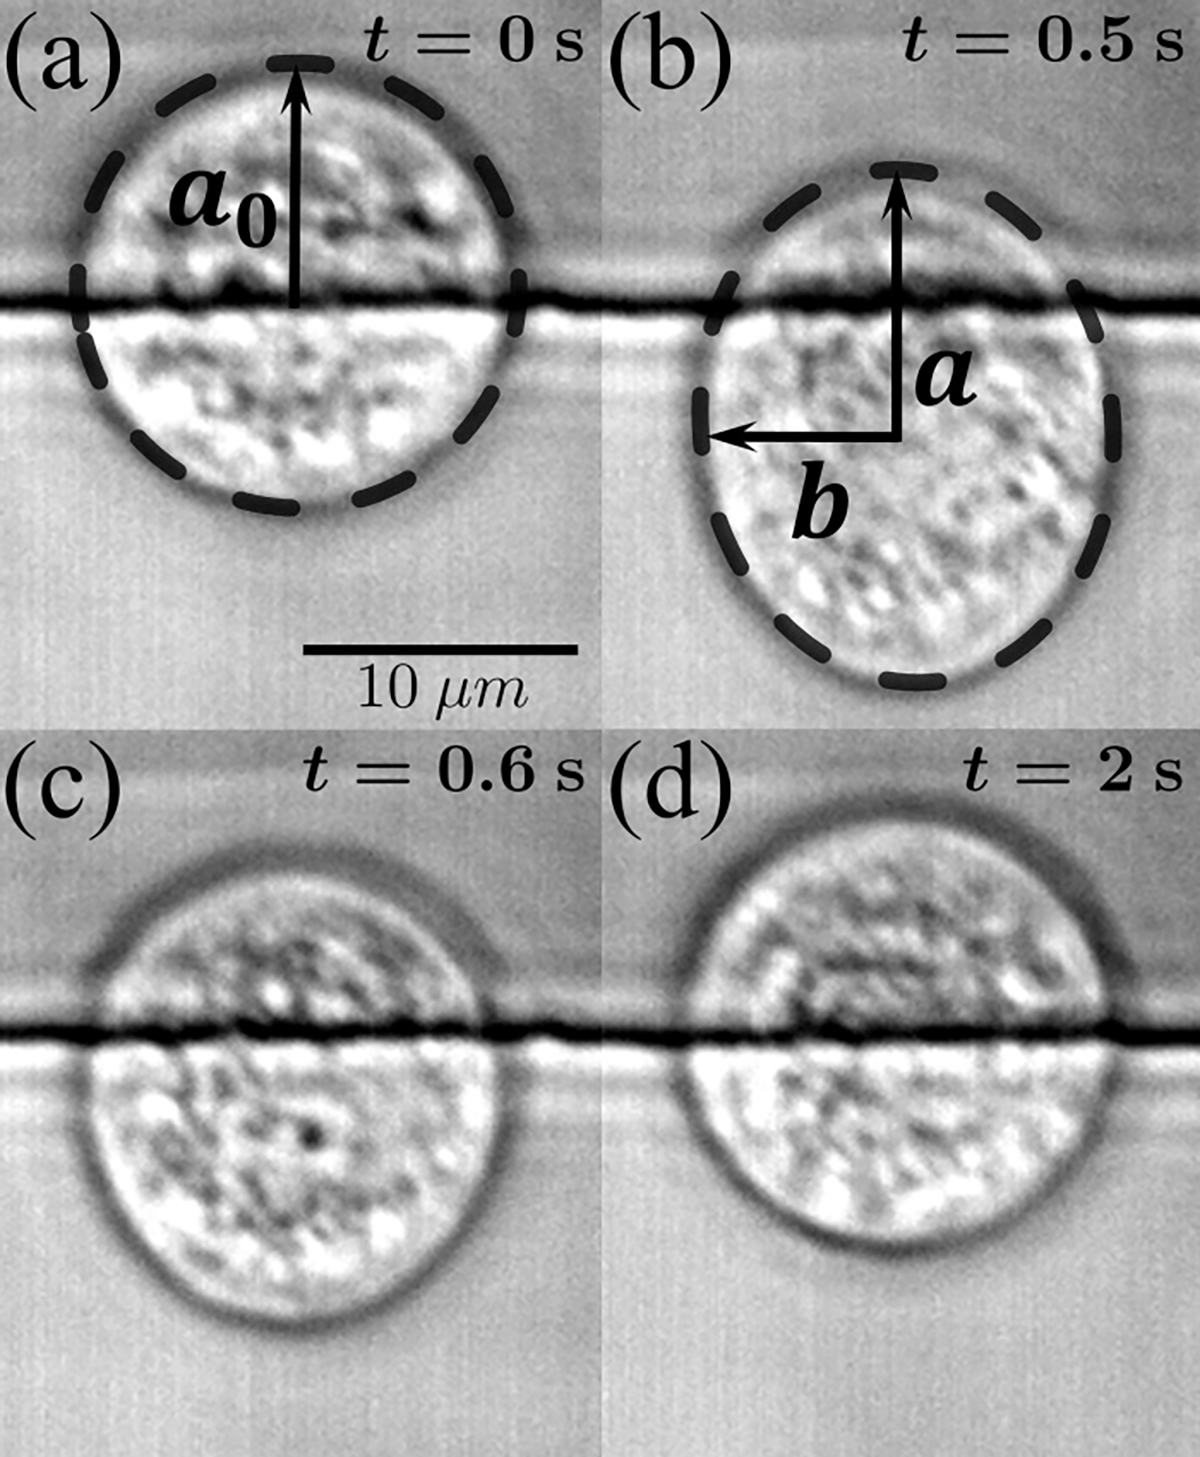
Exemplary images of the cell deformation-relaxation process. (a) An MDA-MB-231 cell at rest prior to the deformation pulse ( and ); the horizontal line is one of the electrode edges. (b) The same cell is deformed with a high-amplitude, high-frequency pulse (, and ). Here and denote the long and short axes of the ellipse, respectively. (c) The cell begins to relax once the pulse ceases ( and ). (d) The cell eventually recovers its shape at the end of relaxation ( and ).
III. RESULTS
A. Data and analysis
Figure 3 demonstrates an exemplary deformation-relaxation process for pulse durations of and 0.5 s, respectively, for MDA-MB-231 cells. The applied voltage was 40 and 25 V (peak to peak, denoted by ), respectively. Here we use a shape factor (see Fig. 2 for definitions of and ) to quantify the degree of deformation, and data from the measurements are shown in green. We apply two different approaches of analysis to all data. The first one accords with a standard power-law model [22,23,41,47–49]
| (1) |
where denotes applied stress, is a modulus, is the Gamma function, is the exponent, and is the Heaviside step function. (For details see Appendix B.) The second is in the form of a single-timescale deformation relaxation
| (2) |
where the coefficients and are force and surface viscosity, respectively, derived from a viscoelastic surface model introduced later, and is the single timescale. (For details see Appendix A.) In both panels, power-law fitting per (1) is shown as a black dashed line and single-exponential fitting per (2) is shown as a red dashed line. The coefficients of determination are also provided. Implications of these two different approaches of analysis are deferred to later. Note that in Fig. 3 and in general, may not begin and/or end in 0 in the process, denoting a deviation from sphericity in the cell’ relaxed shape. This arises due to the combined effects of the cell shape and numerical errors in our imaging and edge detection algorithm. To account for this deviation, we have used an offset value (less than 0.004) in both the power-law and the exponential fittings above.
FIG. 3.
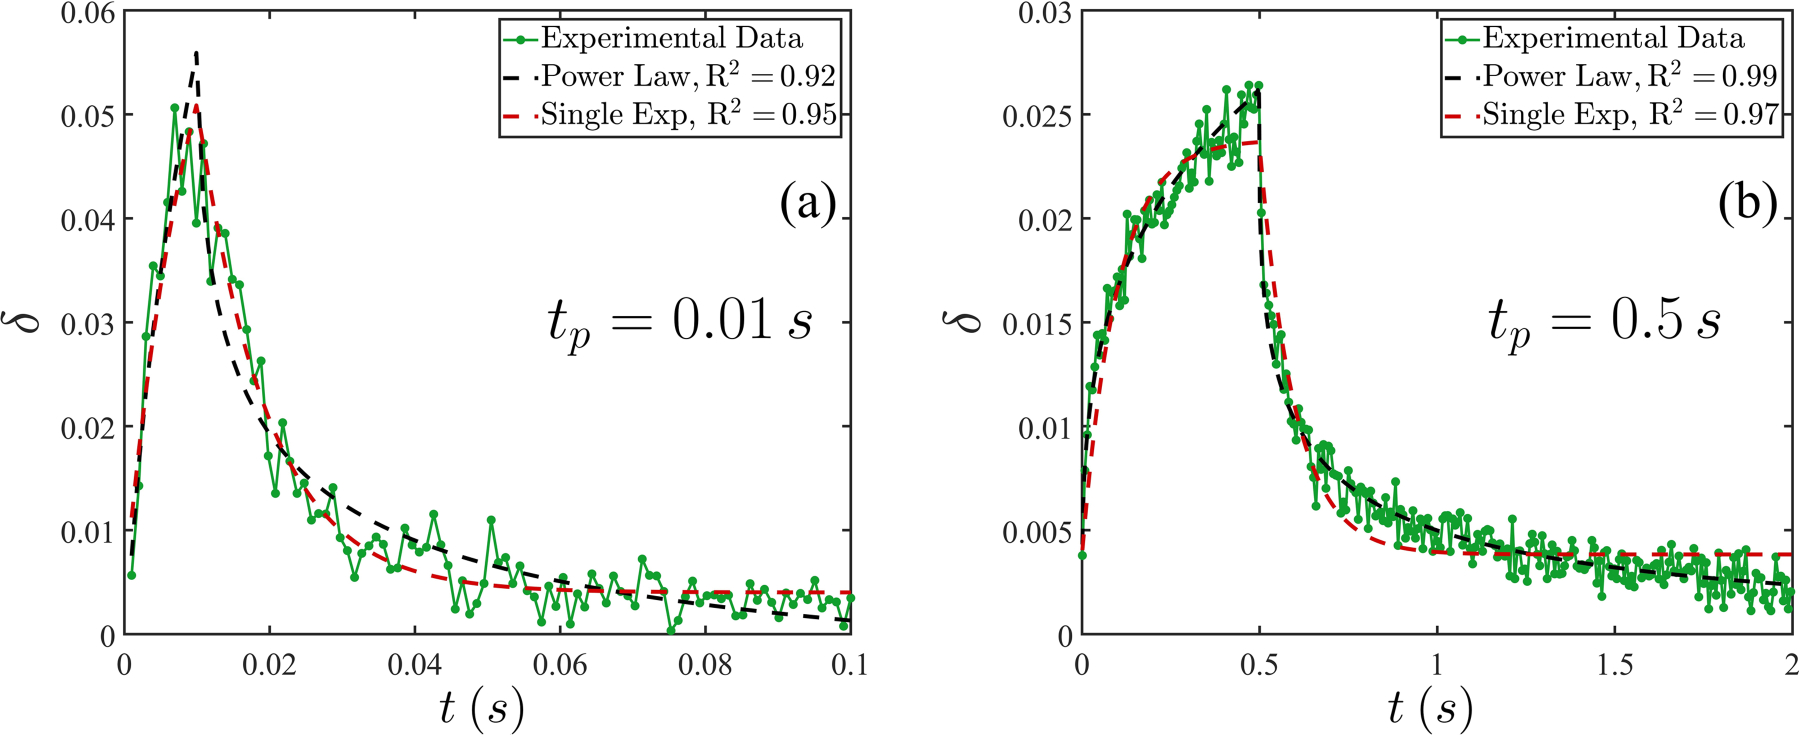
Evolution of the shape factor for two different pulse durations for a single MDA-MB-231 cell. Here (see Fig. 2) and (a) , and and (b) , and . For both cases, two analytical strategies are attempted: a power-law model (black dashed line) and a single-exponential model (red dashed line). The coefficients of determination R2 are provided for both cases.
We investigate a total of four cell types, namely, MCF-10A, MCF-7, MDA-MB-231, and GBM, following the protocol established above. For each case, we vary the pulse duration from 0.01 to 10 s, spanning four orders of magnitude. For MCF-10A, MCF-7, MDA-MB-231, and GBM, the total number of measurements are 42, 47, 52, and 42, respectively. The details on the number of repeats for each pulse duration are tabulated in Table III. For all cases we also vary the amplitude of the applied voltage and find a consistent correlation between the maximum degree of deformations and the electric stress (Appendix D, Fig. 11). However, the key quantity, such as the exponent from the power-law model, depends primarily on the pulse duration , which we demonstrate in Fig. 4(a). Evidently, assumes the highest value for the shortest pulse duration, ranging from 0.48 to 0.58 for all cell types. As increases, decreases to the range of 0.27–0.4 at , but no obvious trend is observed beyond this duration.
FIG. 4.
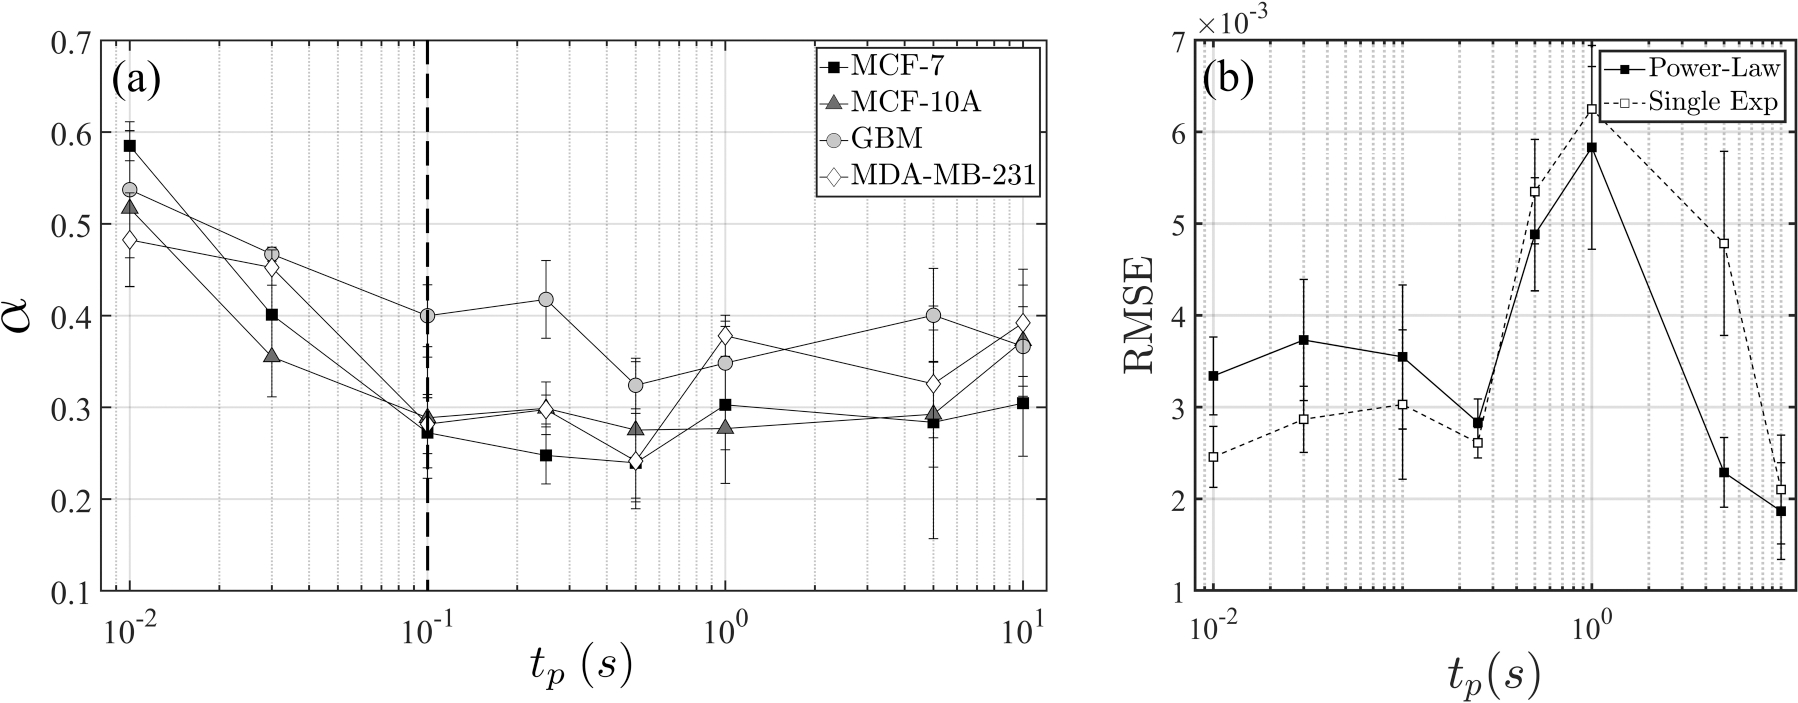
(a) Power-law exponent versus pulse duration . Error bars indicate standard deviation. The number of cells examined in each data point is tabulated in Table III. (b) Error quantification [rms error (RMSE)] for MCF-7. Results for other cell types are found in Fig. 14.
We also quantify the error of fitting for both models. Figure 4(b) shows the rms error differences between the data and the fitting (denoted by RMSE) for MCF-7. In general, the power-law model performs better for longer pulse durations, whereas the single-timescale model demonstrates more accuracy for shorter than 0.1 s. This trend is consistently corroborated in both MDA-MB-231 and GBM cells, shown in Fig. 14. For MCF-10A, the two approaches provide comparable results for , whereas the superiority of the power-law fitting becomes evident only for the longer pulse durations of 5 and 10 s (see Appendix F).
These results corroborate prior work [20–23,28,50] which found that distinguishable regimes exist in the response of cells to external mechanical forcing. In the limit of long timescales, the SGR theory is commonly accepted, which predicts the power-law behavior [24,25]. For this regime (), our power-law exponents are consistent with those reported previously [49,51–53]. On the other hand, for the shorter timescales, the material properties of the cell cytoskeleton are thought to be mediated by the elastic response of the actin filaments in conjunction with thermal fluctuation [21,29,54]. In particular, our data indicate that, in general, a single-timescale fitting outperforms power-law fitting. This timescale reflects the mechanical state of the actin filaments themselves without the structure-modifying unbinding events and is consistent with the behavior predicted by Broedersz et al. [20] for intermediate frequency ranges (further discussed in Sec. IV). The two regimes are demarcated by a value of around a fraction of a second, in agreement with those reported in literature, namely, around 0.1–1 s [27,28,30,50,55–58]. Note, however, that the transition between the regimes is gradual and selection of the threshold value is approximate.
B. Model interpretation
We further elaborate on the two model analyses based on the observation above. Evidence from both data and prior theory indicate that a single-timescale model is more appropriate for the shorter pulse times. We present a spatially resolved analysis assuming that the cell cortex is a viscoelastic “membrane” (in the sense of a mechanical entity) with surface tension (Fig. 9). This model allows us to extract cortical tension in a regime better capturing properties in the naive state without structural modification. For the longer timescales, we use a standard power-law model, in which the power-law behavior derives from the structure-modifying yielding events per standard SGR model. Details are presented below.
FIG. 9.
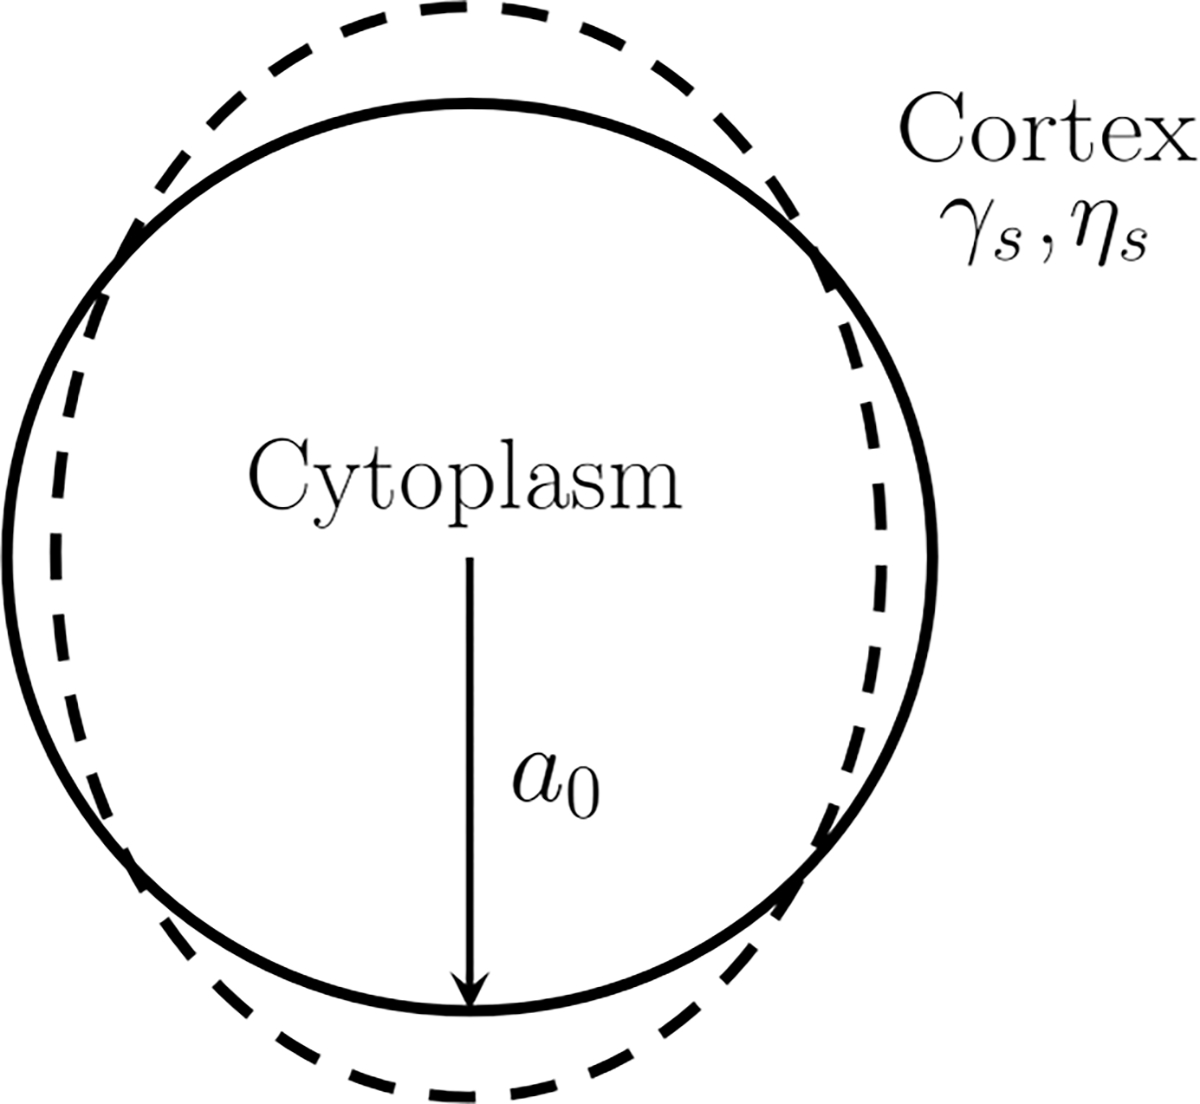
Model schematic. The cell is simplified as an infinitesimally thin, viscoelastic cortex with cortical tension and surface viscosity .
1. Surface tension model
In the first model we focus on the cell cortex, which is assumed to be an infinitesimally thin shell with a surface tension and a surface viscosity (Fig. 9). In the regime of small to moderate deformation, the problem can be solved analytically for the dominant ellipsoidal mode as the leading-order term in a spherical harmonic expansion [34,59]. The full governing equations are reduced to a single ordinary differential equation
| (3) |
where is the coefficient of spherical harmonic model and is related to via
| (4) |
On the right-hand side, corresponds to electrostatic forcing in the mode, which is calculated using a COMSOL simulation capturing the electrode geometry and pulsing conditions realistically (Appendix E). The Heaviside function takes into account that the pulse has a finite duration of . Details on the model and derivation are given in Appendix A as well as our recent work [59]. Solving (3) and considering (4) reveals (2) as the final solution used for fitting, and the timescale is
| (5) |
Figure 5 summarizes results analyzed with this model, in which we temporarily focus on the three shorter pulse durations, namely, , and 0.1 s. More complete results are shown in Fig. 10 in Appendix A and Fig. 7 below. In Fig. 5(a), the timescale is extracted. The values for the first two pulse durations are comparable and do not depend on the applied voltages or electric fields. Appreciable increases are demonstrated at , which we speculate correlates with the onset of actin cross-link unbinding and the transition to the power-law (SGR) regime.
FIG. 5.
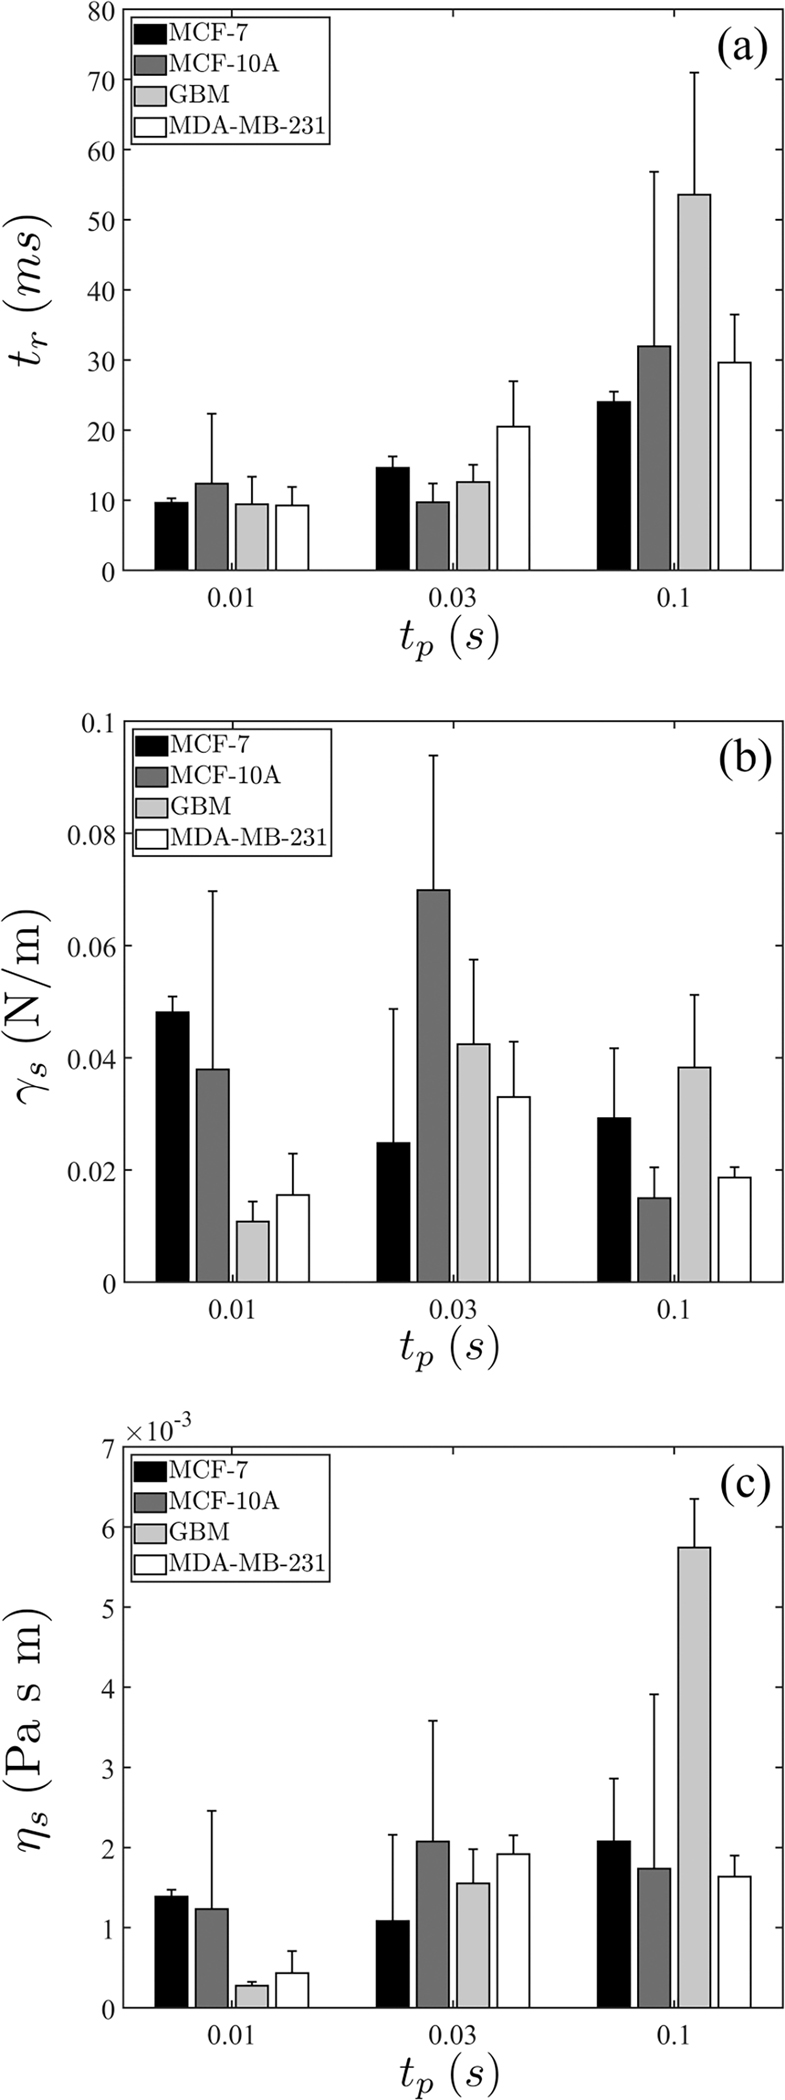
(a) Extracted timescale , (b) surface tension , and (c) surface viscosity . Error bars indicate standard deviation. The number of repeats is provided in Table III.
FIG. 10.
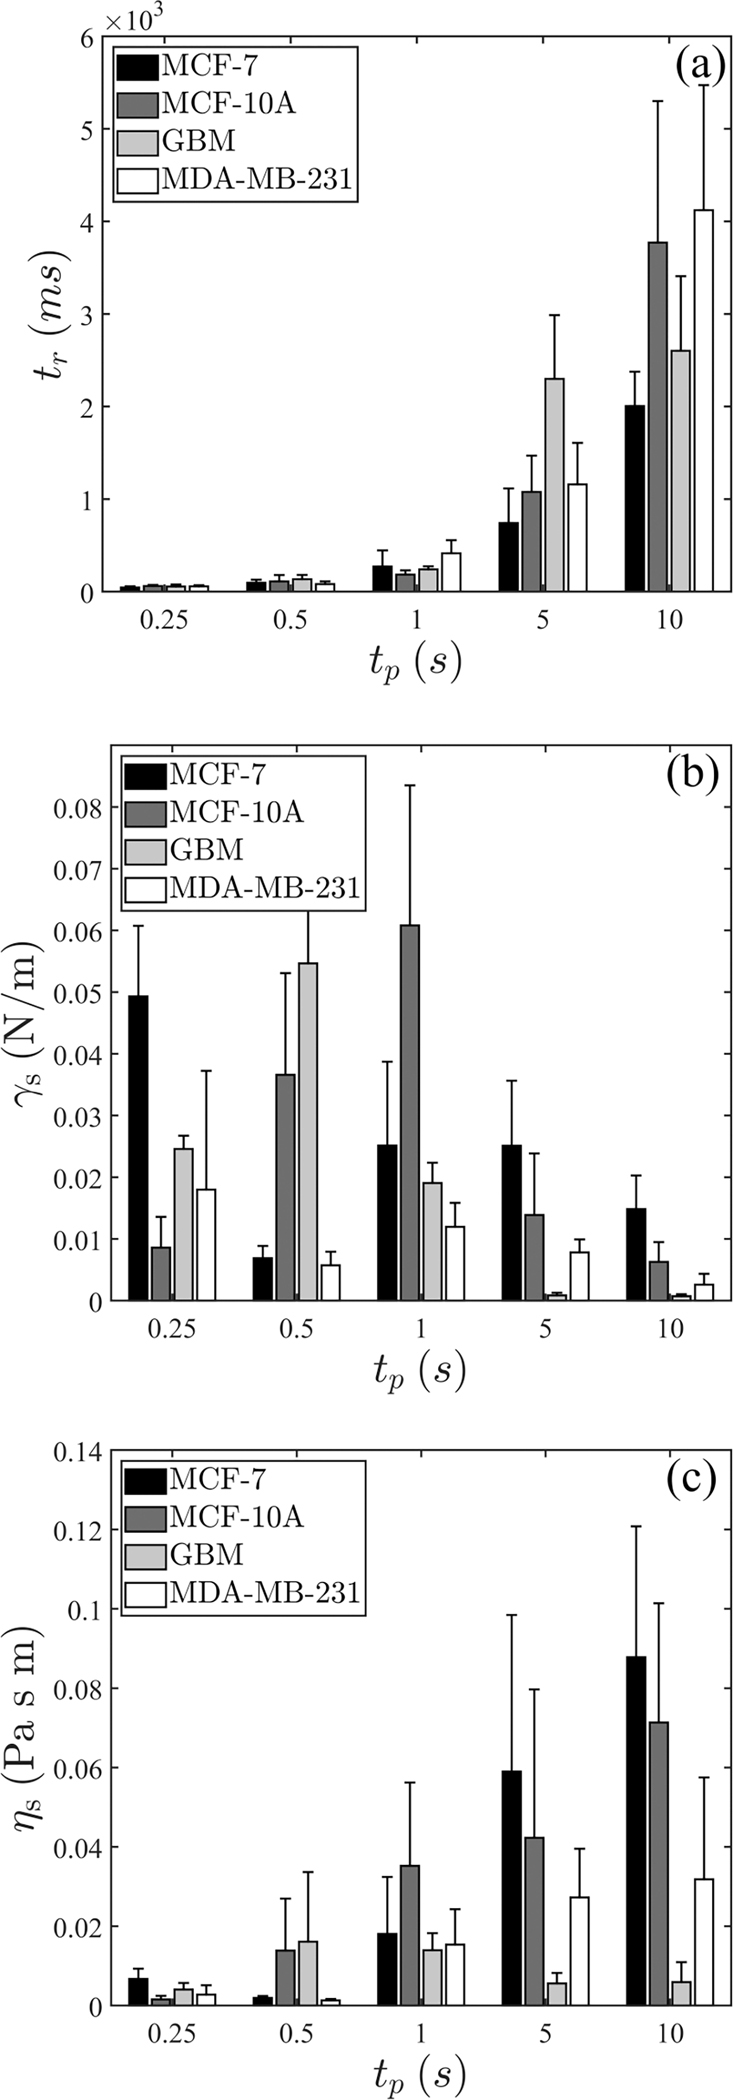
(a) Extracted timescale , (b) surface tension , and (c) surface viscosity for . Error bars indicate standard deviation. The number of repeats is provided in Table III.
FIG. 7.
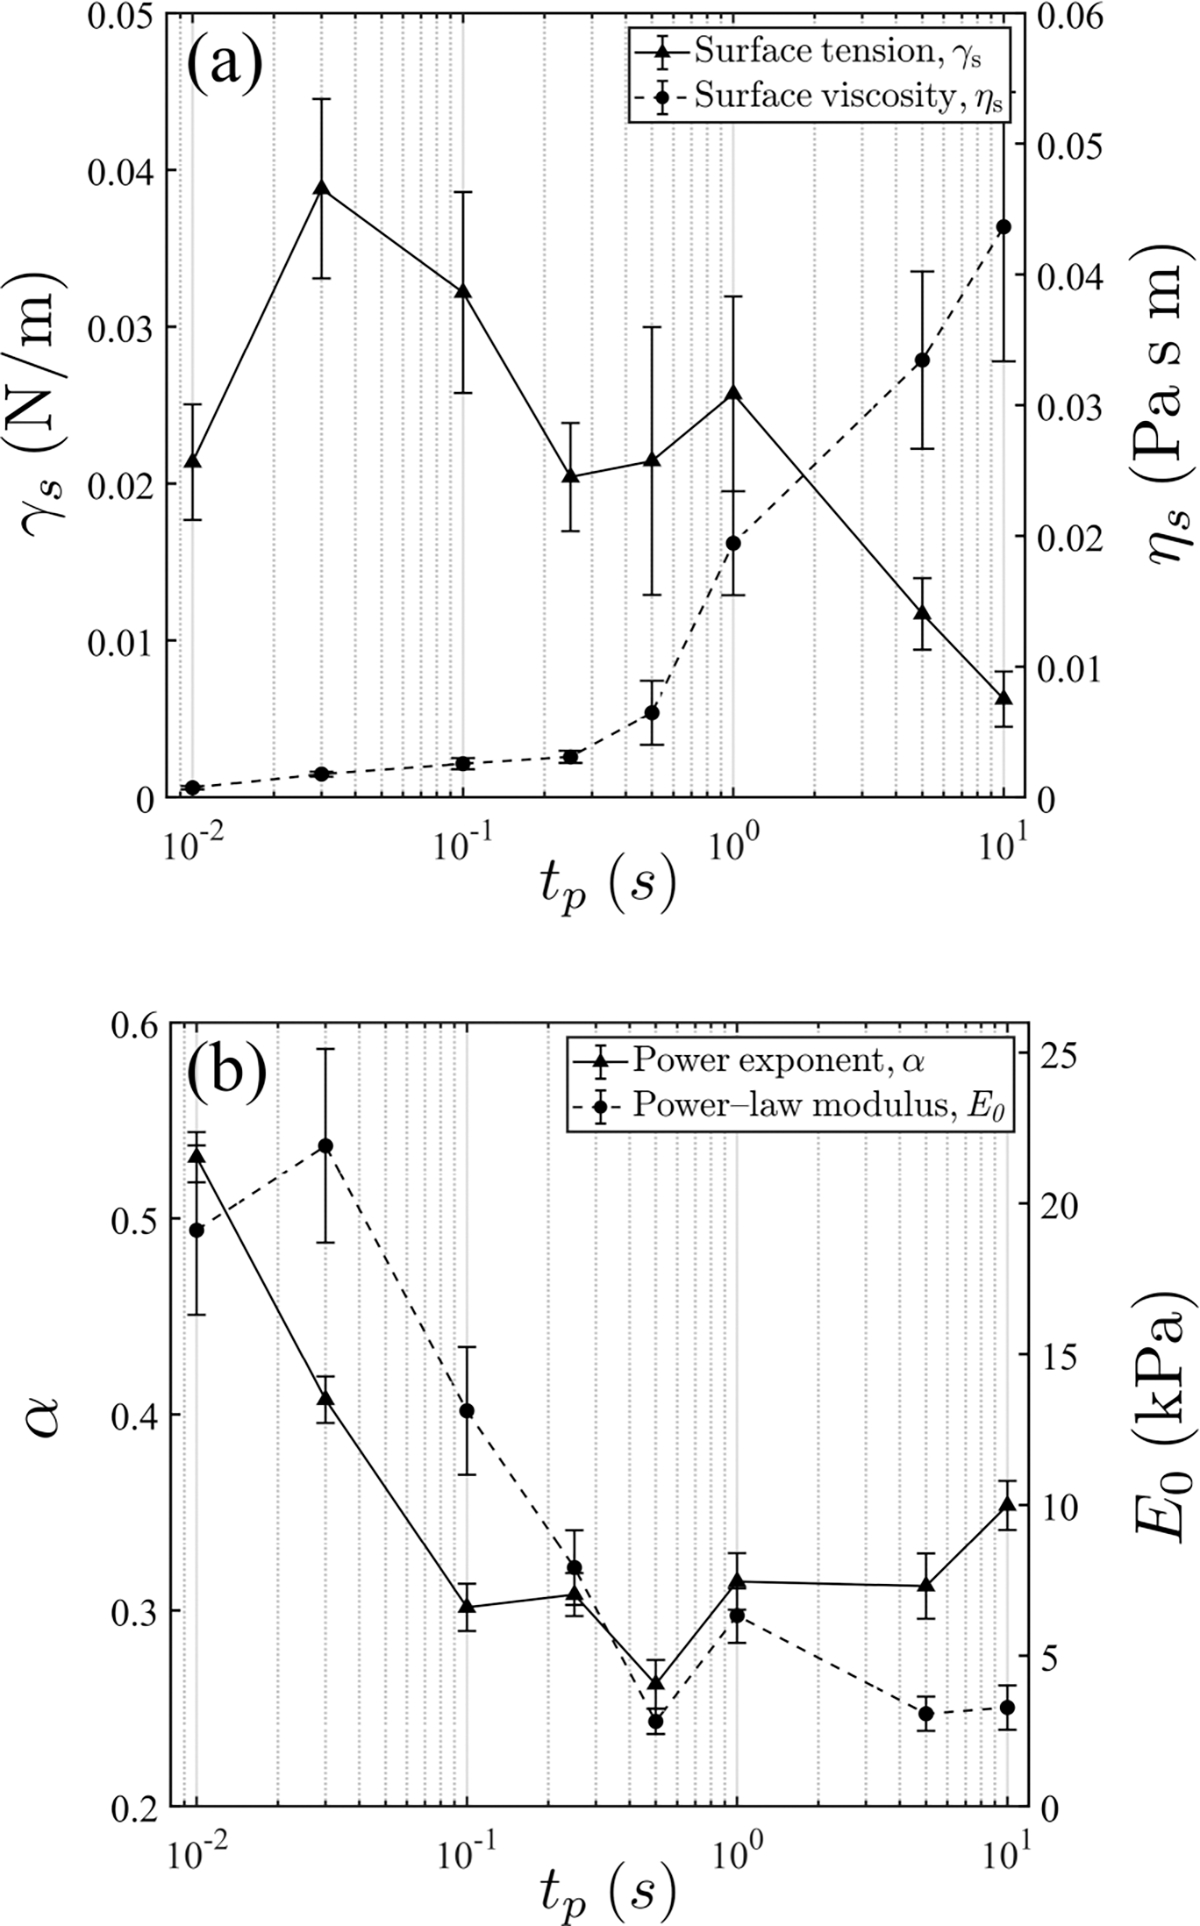
Pooled results for all cell types and pulse durations: (a) and from the surface tension model and (b) and from the power-law damping model. Error bars indicate standard error. The number of repeats is provided in Table III.
The availability of and allows us to extract the mechanical properties and , which are shown in Figs. 5(b) and 5(c), respectively. Using this analysis, cortical tension demonstrates values in the range of 10−2–10−1N/m, whereas surface viscosity is on the order of 10−3Pa sm.
2. Power-law model
We now turn to the power-law model, in which we used a lumped stress-strain relation but with a fractional derivative
where is Riemann’s fractional derivative, is constant applied stress, is strain, is the power exponent, and is the corresponding module in the power-law regime which is constant. Solution using a Laplace transform leads to the creep response (1); details are elaborated in Appendix B. Data analysis leads to the extraction of , shown in Fig. 4(a). The combination can also be determined, but not independently. We thus again can resort to simulation to compute and to subsequently extract the modulus (Appendix E). However, following prior work, we more conveniently transform to the frequency domain so that the storage and loss moduli are
| (6) |
| (7) |
respectively, where the frequency is calculated as , and the magnitude of the complex modulus is
The loss tangent is related to the power exponent via
| (8) |
This is a simple monotonic relationship relating to , and hence we do not show results on the former for brevity. On the other hand, extracted values of for are shown in Fig. 6. Despite more significant variabilities being present in the data in this regime, we observe that values are appreciably greater for and 0.25 s, particularly for MCF-7, and decrease to the 1–10 kPa range when assumes longer durations.
FIG. 6.
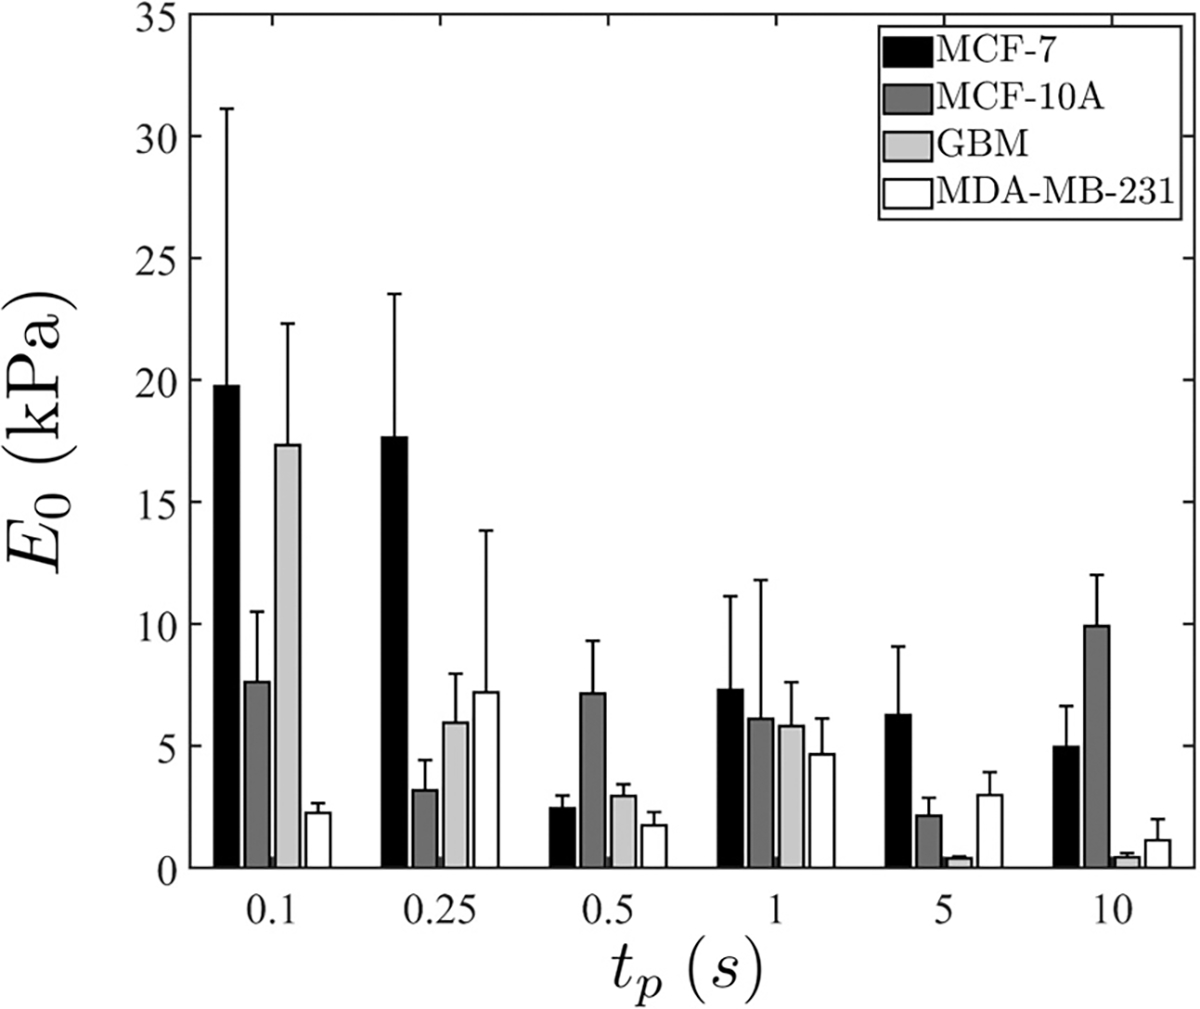
Extracted for . Error bars indicate standard deviation. The number of repeats is provided in Table III.
The above trends become more apparent when we apply the model analysis to all cell types with all pulse durations (regardless of the relative model accuracy and validity in the pulsing regimes). These results are presented in Fig. 7. In general, both and decrease with an increasing while increases. These trends again reflect transitional behavior from the elastic to the SGR regime, where cortical strength weakens and effective viscosity increases. Further discussion of these trends and comparisons with those in the literature are found in the next section.
Finally, it would be of interest to directly compare results from the two models. For this purpose, we first convert surface tension and viscosity to an effective, lumped elastic modulus and viscosity via (Appendix C)
| (9) |
| (10) |
respectively. Note that these quantities are effectively averages over the entire cell, which also facilitate comparison with similar bulk measurements from the literature below. On the other hand, they are different from the effective cortex modulus which is obtained by scaling with cortical thickness [18,60]. The magnitude of the complex modulus is
| (11) |
| (12) |
Results suggest that both total and loss moduli are in good agreement. On the other hand, the power-law model tends to overestimate the elastic modulus by several times, in particular in the short-pulse regime. We thus conclude that the single-timescale, surface-based model (2) is not only appropriate but necessary for valid quantitative mechanical analysis in the intermediately- to high-frequency regime.
IV. DISCUSSION
A. Cortical tension in the short-pulse regime
Above we observed two regimes consistent with the understanding in the literature: an SGR regime that is characterized by a low power exponent for the long-pulse durations (lower frequencies) and a regime for the short-pulse durations (higher frequencies) where the response is characterized by a single timescale. Indeed, an interpretation is provided by prior work that this is because in this regime unbinding is not initiated and modes longer than cross-link spacing are suppressed, so “only small-scale bending fluctuations between cross-links can relax” [20]. Consequently, the theory also predicts a plateau in [20], which is observed in, for example, [61]. In our data [Fig. 8(a)], even though such a plateau is not rigorously seen, we do observe a slight decrease in toward the shortest pulse . It is unclear from the data whether this is due to its intrinsic large variability or this decrease is actually mechanistically driven. We are not observing the high-frequency regime where , even if we force a power-law analysis [Fig. 4(a)]. Similar to [28], we speculate that our shortest-pulse duration is not sufficient to reach that regime, although we do see values are higher around 0.48–0.58. On the other hand, relaxation of the bending fluctuations may be a cause of the weak dependence on the shown in Fig. 7(a) at the short-pulse times.
FIG. 8.
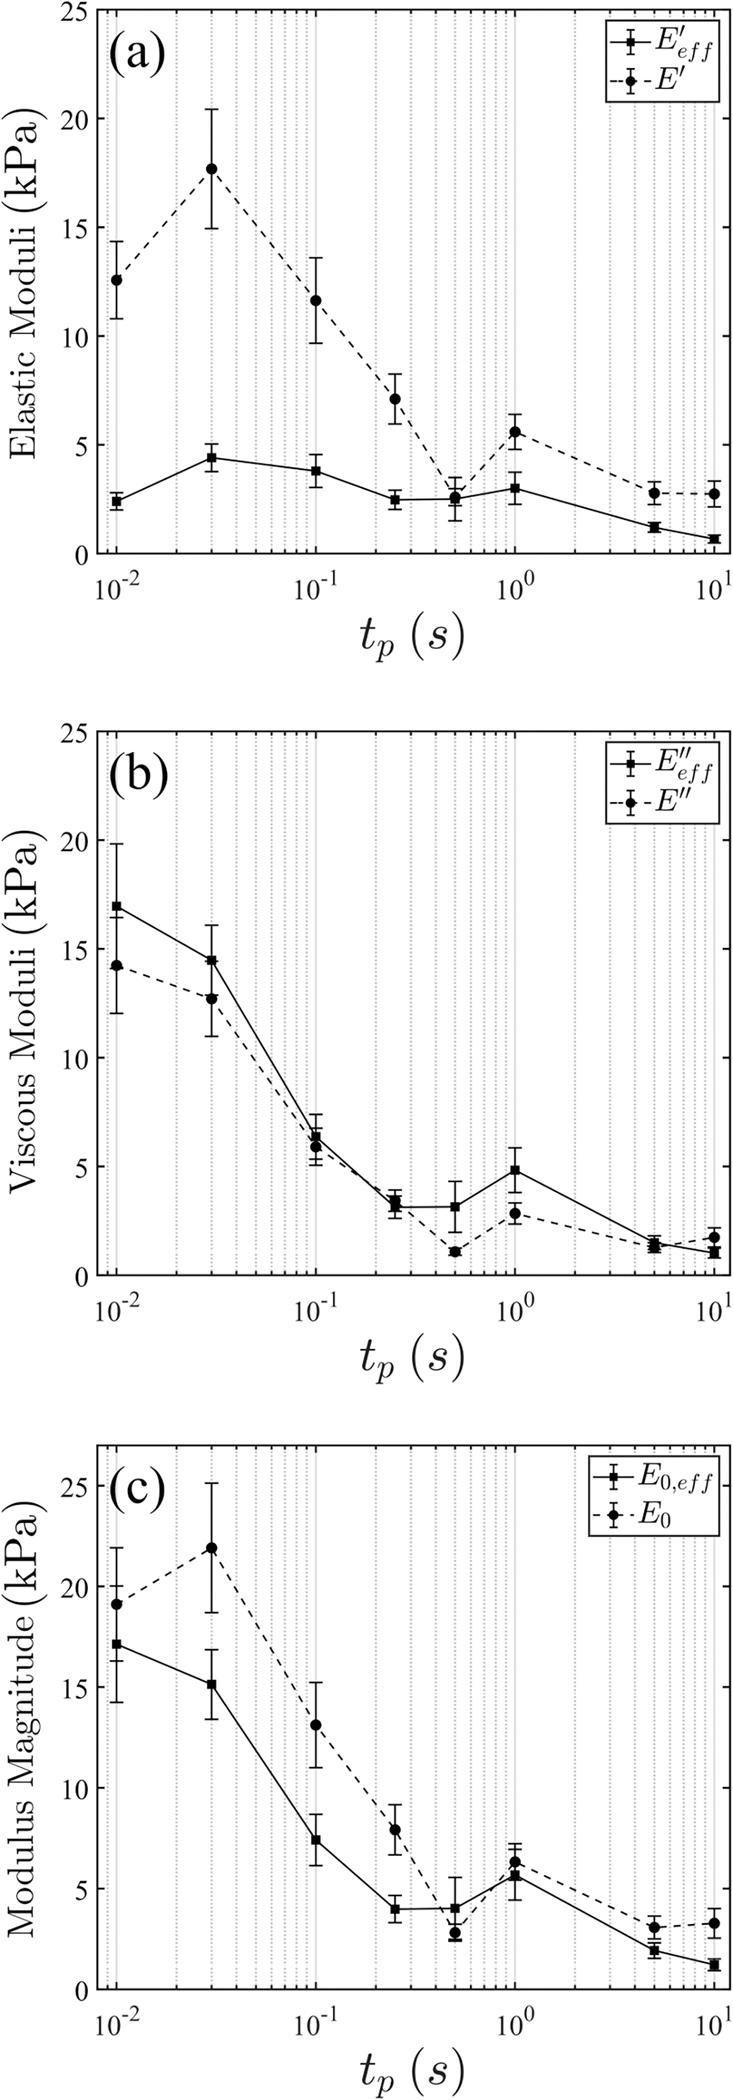
Direct property comparison between the two models. Error bars indicate standard error. The number of repeats is provided in Table III.
One particular thesis of the present work is that cortical tension is more faithfully quantified in the short-pulse regime. The rationale is straightforward, given the above data trend as well as previously established theories. We aim to establish that under short-pulse (~0.01 s), small-amplitude (several percent of strain) electrodeformation, the extracted tension or prestress reflects that in a state where the cortical structure is close to the undisturbed state.
B. Comparison with literature values
A vast body of literature exists on measuring mechanical properties of cells. Importantly, a recent study by Wu et al. systematically examined the properties of MCF-7 with various techniques and observed that moduli vary by as much as three orders of magnitude, depending on the particular method, the state of the cells (attached or suspended), the target (partial membrane, cortex, or whole cell), and interrogation strength and frequency [62]. Indeed, this reflects the very complex and adaptive nature of cells as a living mechanical entity.
In the literature, the cortical tension is commonly measured with the micropipette aspiration technique, which reports values in the range of 30–3000 pN/μm for various cell types [14,60,63,64], which is in general weaker than values extracted by this work. Trends from the present work suggest that this may be due to the much longer force application times, e.g., a few hundred seconds for typical aspiration measurements [16,60,65]. On the other hand, measurements from real-time deformability cytometry do reveal a tension of 0.02 N/m, matching the present results [66]. Note that, interestingly, an upper cutoff time for the power-law regime was also observed in [18].
Against those here we only selectively compare our results on an elastic modulus with the most similarity in configuration, namely, whole-cell measurements in a similar frequency range, and with the same cell types. The results are summarized in Table I and depend on cell type. For MDA-MB-231, our data are in good agreement with prior work measured with different techniques [37,51]. On the other hand, the properties for MCF-7 are greater in value when compared with those from other work, by several times or even an order of magnitude. The cause of this difference is unknown, yet one possible difference lies within the force distribution on the whole-cell level, e.g., when comparing optical stretching and plate rheometry with electrodeformation. In this regard, the latter has a comparative advantage: Both the stress and strain fields have a relatively simple cosinusoidal distribution to the leading order, and hence allow spatially resolved model construction (Appendix A).
TABLE I.
Comparison with prior data in similar frequency ranges. Here timescales refer to force application times in optical stretching or parallel-plate rheometry (first and second rows, respectively) [62], electrodeformation (third and fourth rows) [37], and residence time translocating a constriction (fifth and sixth rows) [51]. For properties, the notation follows that of this work (the last two columns).
| Source | Cell type | Properties (kPa) | Timescale (s) | This work (kPa) | |
|---|---|---|---|---|---|
|
| |||||
| [62] | MCF-7 | = 0.018 ± 0.024 | 8 | 1.87 ± 0.23 | 10 |
| [62] | MCF-7 | = 0.95 ± 0.15 | 1 | 6.38 ± 3.38 | 1 |
| [37] | MCF-7 | = 0.358 ± 0.053 | 25 | 1.87 ± 0.23 | 10 |
| [37] | MDA-MB-231 | = 0.327 ± 0.052 | 25 | 0.35 ± 0.21 | 10 |
| [51] | MCF-7 | = 2.1 ± 0.1 | 0.1 | 7.10 ± 1.52 | 0.1 |
| [51] | MDA-MB-231 | = 0.8 ± 0. 19 | 0.1 | 0.70 ± 0.11 | 0.1 |
Note that, although at each pulse duration we do observe differences in the cell types, a consistent trend is not seen at all pulse times. On the other hand, the variation with respect to provides major variability in the system and such is the rationale of pooling data from all cell types as a function of pulse time in Fig. 7. Further controlled study via various drug treatment such as those following [18,33,51] will help shed light on the biological regulators of cortical tension and genotype similarities and/or differences.
V. CONCLUSION
In this work we have presented an electrodeformation-relaxation assay to probe mechanical properties of whole suspended cells. We vary pulse duration by four orders of magnitudes, from 0.01 to 10 s, which is equivalent to a frequency range of approximately (or ). Expectedly, mechanical properties depend strongly on pulsing time. We observe an SGR regime characterized by a low-exponent power-law behavior in the long-pulse regime, whereas we are able to capture a single-timescale deformation-relaxation behavior with subsecond pulse durations. Within the simplifications and using a rigorous, spatially resolved (versus lumped) mathematical model, we extract cortical tension that closely approximates that in the naive cell state, the state that is the least mechanically disturbed. This work demonstrates that electrodeformation can be developed as a contactless technique to rapidly assay cell mechanical properties in a wide frequency range and to analyze tension statistics using its short-pulse capability.
ACKNOWLEDGMENTS
H.L. acknowledges financial support from NIH, NCI Grant No. 1 R21 CA220202-01A1. L.L. acknowledges financial support from NSF, CMMI, Grant No. 135156 and AFOSR, FA Grant No. 9550-16-1-0181.
S.M. and Y.D. contributed equally to this work. H.L., L.L., R.A.F., J.W.S., J.D.Z., and D.I.S. designed the research. Y.D., S.M., and M.Y. performed the experiments. S.M., Y.D., and M.Y. analyzed the data. S.M., L.L., and H.L. developed the theory. S.M. performed the numerical simulations. All wrote the paper.
APPENDIX A: SURFACE TENSION MODEL
Consider a spherical cell of radius in a fully relaxed state and the displacement is defined by . The elastic energy and the dissipation potential of the cortex are given by
| (A1) |
| (A2) |
where is the surface elasticity tensor which is proportional to surface tension, and represent surface viscosities associated with the cortex (Fig. 9), and is the surface gradient [59]. Moreover, assuming conservation of the cell interior volume and local surface area at the leading order implies the constraints
| (A3) |
In terms of spherical harmonic modes and assuming axisymmetry, and are given by
| (A4) |
| (A5) |
where is the th-mode coefficient of the radial displacement ,
| (A6) |
Let be the surface traction on the cell. The rate of work done by the force is given by
| (A7) |
where and are the th modes in radial and tangential traction, respectively,
| (A8) |
| (A9) |
By neglecting the higher modes of spherical harmonics, the balance of work for the system in the second mode (ellipsoidal) leads to
| (A10) |
or
| (A11) |
where denotes the total electrostatic force exerted on the cell cortex and is the Heaviside step function to capture the effects of a finite pulse time. The following relationship converts between , the shape factor, and :
| (A12) |
In (A11), the traction terms are to be evaluated from the Maxwell stress tensor induced by the applied electric field [67,68],
| (A13) |
where is electrical permittivity. Solving Eq. (A11) with constant traction (applicable to our studies) yields
| (A14) |
where the deformation-relaxation timescale is given by
| (A15) |
FIG. 11.

(a) Shape factor changes of four different MDA-MB-231 cells under consecutively increasing pulsing, each 0.5 s at 7 MHz. (b) The maximum deformation achieved at the end of pulsation shows approximately a linear correlation with .
The calculated values with this model for for each cell type is provided in Fig. 5 in the proper text. However, to provide complete data, we provide the trends of changes for these properties in relatively longer-pulse durations in Fig. 10.
APPENDIX B: POWER-LAW MODEL
In the power-law regime, the lumped stress-strain relation is given by
| (B1) |
where is the Riemann’s fractional derivative, is a constant applied stress, is strain (quantified by in our case), is the power exponent, and is the modulus. The creep response is obtained using a Laplace transform
| (B2) |
| (B3) |
where is determined via
| (B4) |
Rewriting Eq. (B1) in the frequency domain using a Fourier transform provides the storage and loss moduli
| (B5) |
| (B6) |
where is frequency ( for our case). The loss tangent or structural damping coefficient is given by
| (B7) |
The modulus is related to via
| (B8) |
APPENDIX C: EFFECTIVE ELASTIC AND VISCOUS MODULI
Based on a general model in [59], if the cell is to be considered a bulk material with an effective elastic modulus and bulk viscosity the energy functionals are
| (C1) |
| (C2) |
FIG. 12.
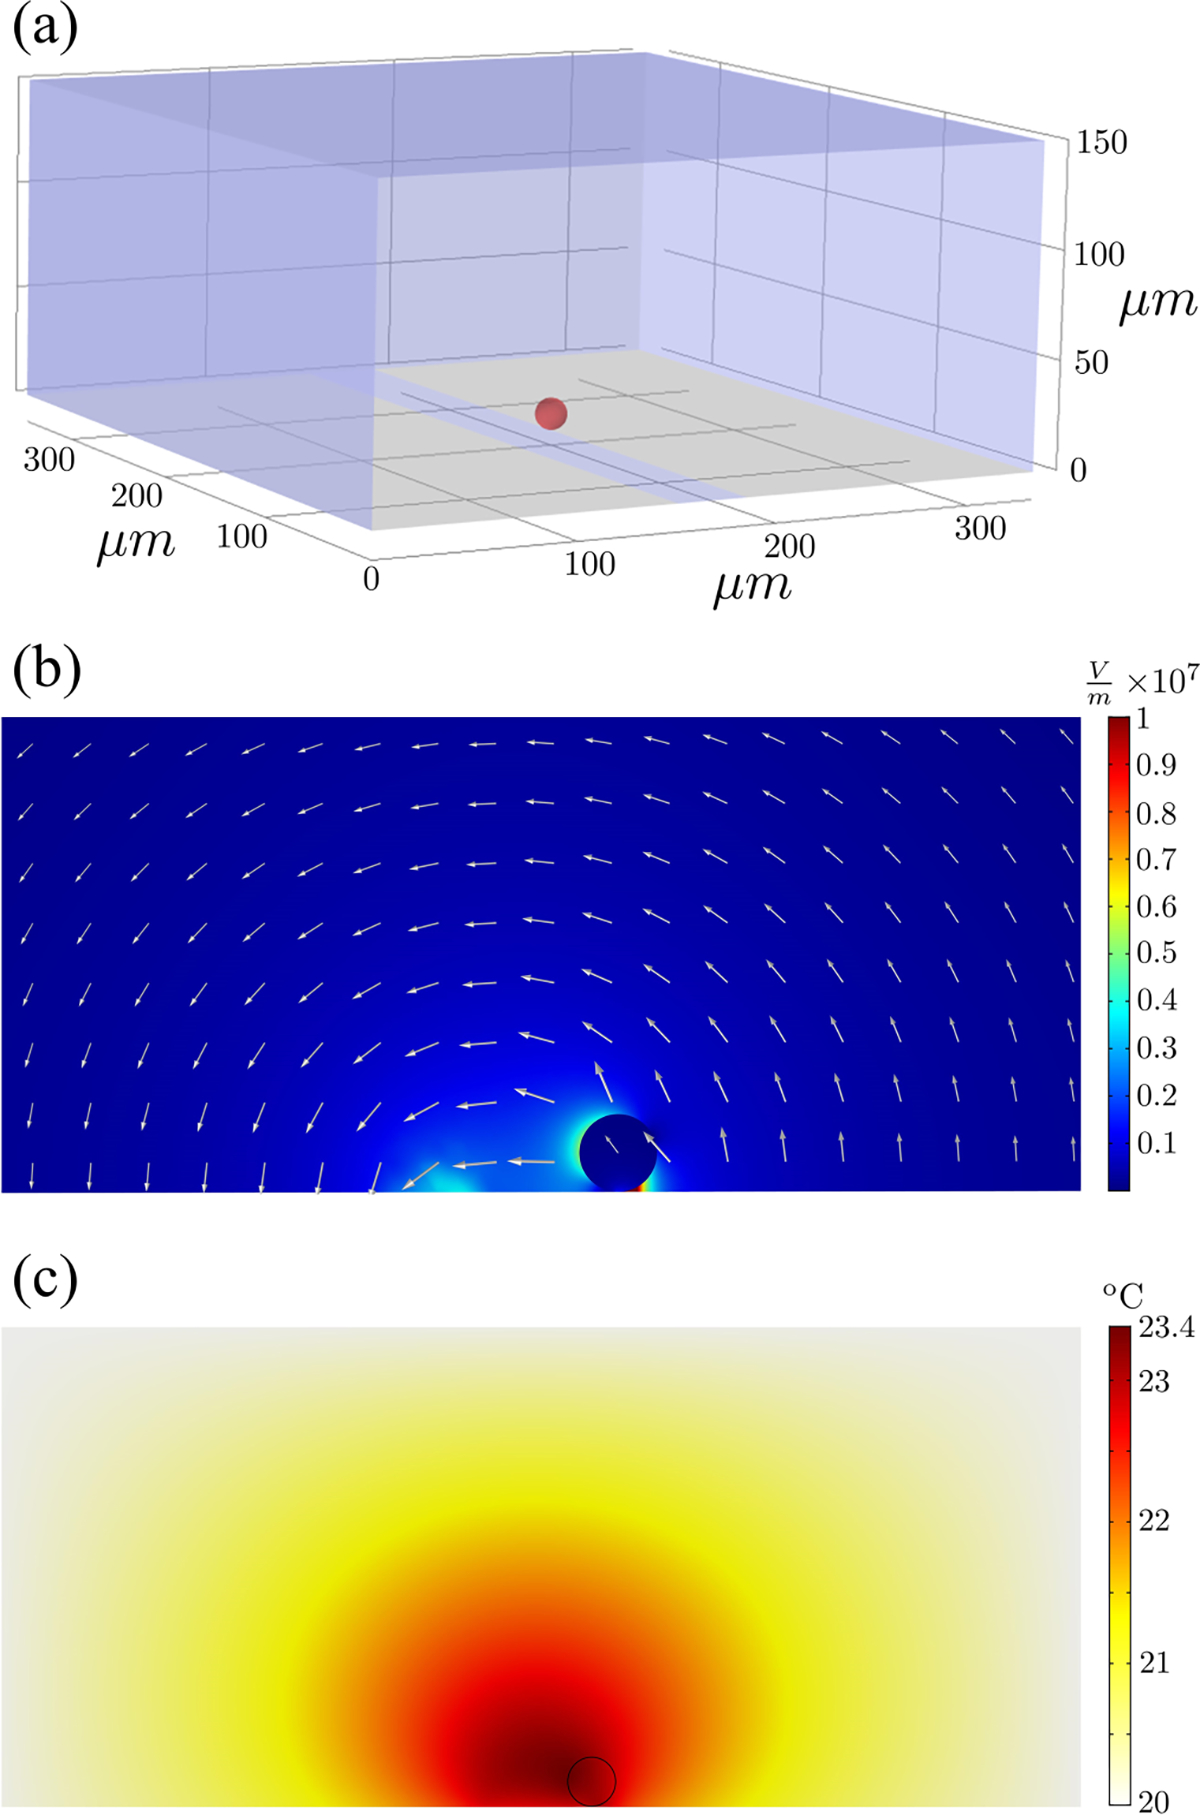
(a) Model geometry. (b) Exemplary electric field distribution. (c) Exemplary heat map due to Joule heating; the ambient temperature is assumed to be 20 °C. The cross section is taken perpendicular to the electrode edges and at the cell equator. The simulation parameters are , and .
TABLE II.
Parameters for simulation.
| Domain | Relative permittivity | Conductivity (S/m) | Thermal conductivity (W/mK) | Heat capacity (J/kgK) |
|---|---|---|---|---|
|
| ||||
| Media | 80 | 10−2 | 0.611 | 4180.9 |
| Cytoplasm | 80 | 0.4 | 0.611 | 4180.9 |
| Membrane | 2 | 5×10⁻⁹ | ||
Comparing the above with (A4) and (A5) for the second mode of spherical harmonics , we have
FIG. 13.
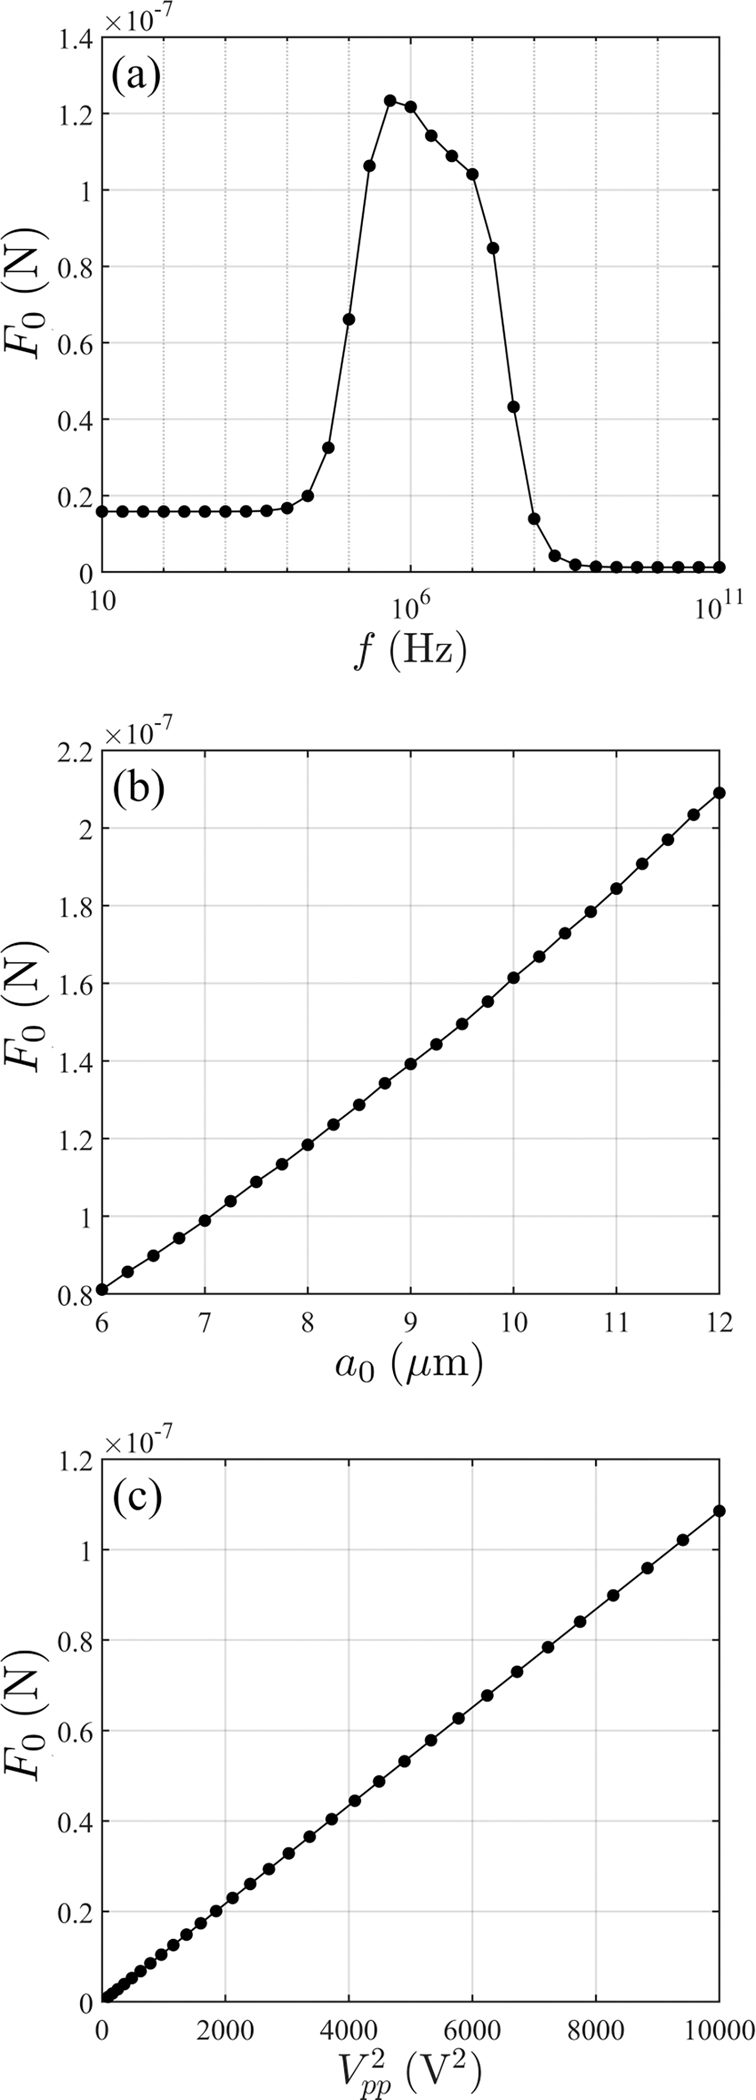
Dependence of on (a) frequency, (b) cell radius, and (c) applied voltage. The reference case is , and .
Note that as the coefficient of is very close to 1, one can conveniently convert between storage modulus and surface tension via a simple estimate .
FIG. 14.

The RMSE for the two analytical approaches. The number of repeats is provided in Table III.
APPENDIX D: DEFORMATION VS APPLIED VOLTAGE
We performed limited experiments to confirm the scaling law of deformation and electrostatic forcing. The Maxwell stress scales with per (A13); therefore, we expect that deformation scales with , although the field distribution is nonuniform (see Appendix E below). Exemplary results are demonstrated with four MDA-MB-231 cells in Fig. 11, where indeed a general correlation between the maximum strain and is observed.
APPENDIX E: NUMERICAL SIMULATION
Simulation is performed with COMSOL MULTIPHYSICS (COMSOL Inc., Burlington, MA) and includes studies of the electric field, Maxwell stress, and Joule heating. Electric currents and heat transfer in fluid modules with both transient and frequency domain studies are employed. A 350×350×150 μm3 size box with electrodes on the bottom surface, spaced 35 μm apart, is used as the geometry to realistically simulate the chip setup (Fig. 12). A spherical cell of given radius is seated on the bottom near one of the electrodes; the location is not arbitrary, but is found as a translational force equilibrium for dielectrophoresis, approximating realistic physics. In the simulation, deformation is not considered; the electric field distribution in ellipsoids with small deformations (a strain of only a few percent, ) presents a negligible deviation [36,69,70].
Properties and parameters are listed in Table II. The electrical conductivity of the suspending media is measured as described in the main text. The membrane and cytoplasmic properties are chosen from the literature [71–76]. Permittivity, density, and thermal properties of the media and cytoplasm are assumed to be that of water.
TABLE III.
Number of cases for each pulse duration.
| MCF-7 | MCF-10A | MDA-MB-231 | GBM | ||
|---|---|---|---|---|---|
|
| |||||
| 0.01 | 6 | 7 | 8 | 9 | 30 |
| 0.03 | 3 | 7 | 6 | 5 | 21 |
| 0.1 | 9 | 6 | 5 | 4 | 24 |
| 0.25 | 6 | 8 | 8 | 7 | 29 |
| 0.5 | 7 | 3 | 6 | 4 | 20 |
| 1 | 5 | 3 | 3 | 3 | 14 |
| 5 | 5 | 5 | 6 | 4 | 20 |
| 10 | 6 | 3 | 10 | 6 | 25 |
The total traction as defined in Eq. (A11) is computed as a function of cell radius, applied voltage, and frequency and the results are shown in Fig. 13. Variations in parameters are based on the reference case of , and . Note that the relationship with respect to radius and are almost linear (this is expected) and the results allow us to use the correlations as a quick lookup table without repeated, additional simulations.
The effect of Joule heating is also evaluated, and an exemplary temperature map for , and is shown. The maximum temperature rise is 3.4 °C, which is considered insignificant in modifying the cortical mechanical response.
APPENDIX F: ERROR QUANTIFICATION
The rms error for MDA-MB-231, MCF-10A, and GBM cells is shown in Fig. 14 to compare the two analytical methods; the numbers of cells measurements were made in are shown in Table III.
References
- [1].Foty RA and Steinberg MS, Differential adhesion in model systems, Wiley Interdiscip. Rev. Dev. Biol. 2, 631 (2013). [DOI] [PubMed] [Google Scholar]
- [2].Lecuit T and Lenne PF, Cell surface mechanics and the control of cell shape, tissue patterns and morphogenesis, Nat. Rev. Mol. Cell. Biol. 8, 633 (2007). [DOI] [PubMed] [Google Scholar]
- [3].Merkel M and Manning ML, Using cell deformation and motion to predict forces and collective behavior in morphogenesis, Semin. Cell Dev. Biol. 67, 161 (2017). [DOI] [PMC free article] [PubMed] [Google Scholar]
- [4].Sugimura K, Lenne PF, and Graner F, Measuring forces and stresses in situ in living tissues, Development 143, 186 (2016). [DOI] [PubMed] [Google Scholar]
- [5].Alenghat FJ and Ingber DE, Mechanotransduction: All signals point to cytoskeleton, matrix, and integrins, Sci. Signal 2002, pe6 (2002). [DOI] [PubMed] [Google Scholar]
- [6].Gossett DR, Tse HTK, Lee SA, Ying Y, Lindgren AG, Yang OO, Rao J, Clark AT, and Di Carlo D, Hydrodynamic stretching of single cells for large population mechanical phenotyping, Proc. Natl. Acad. Sci. USA 109, 7630 (2012). [DOI] [PMC free article] [PubMed] [Google Scholar]
- [7].Wozniak MA and Chen CS, Mechanotransduction in development: A growing role for contractility, Nat. Rev. Mol. Cell Biol. 10, 34 (2009). [DOI] [PMC free article] [PubMed] [Google Scholar]
- [8].Greenberg MJ, Arpağ G, Tüzel E, and Ostap EM, A perspective on the role of myosins as mechanosensors, Biophys. J. 110, 2568 (2016). [DOI] [PMC free article] [PubMed] [Google Scholar]
- [9].Foty RA and Steinberg MS, The differential adhesion hypothesis: A direct evaluation, Dev. Biol. 278, 255 (2005). [DOI] [PubMed] [Google Scholar]
- [10].Manning ML, Foty RA, Steinberg MS, and Schoetz EM, Coaction of intercellular adhesion and cortical tension specifies tissue surface tension, Proc. Natl. Acad. Sci. USA 107, 12517 (2010). [DOI] [PMC free article] [PubMed] [Google Scholar]
- [11].Bi D, Lopez JH, Schwarz JM, and Manning ML, A density-independent rigidity transition in biological tissues, Nat. Phys. 11, 1074 (2015). [Google Scholar]
- [12].Au SH, Storey BD, Moore JC, Tang Q, Chen YL, Javaid S, Sarioglu AF, Sullivan R, Madden MW, O’Keefe R, Haber DA, Maheswaran S, Langenau DM, Stott SL, and Toner M, Clusters of circulating tumor cells traverse capillary-sized vessels, Proc. Natl. Acad. Sci. USA 113, 4947 (2016). [DOI] [PMC free article] [PubMed] [Google Scholar]
- [13].Krieg M, Arboleda-Estudillo Y, Puech PH, Käfer J, Graner F, Müller DJ, and Heisenberg CP, Tensile forces govern germ-layer organization in zebra fish, Nat. Cell Biol. 10, 429 (2008). [DOI] [PubMed] [Google Scholar]
- [14].Dai J, Ting-Beall HP, Hochmuth RM, Sheetz MP, and Titus MA, Myosin I contributes to the generation of resting cortical tension, Biophys. J. 77, 1168 (1999). [DOI] [PMC free article] [PubMed] [Google Scholar]
- [15].Fischer-Friedrich E, Hyman AA, Jülicher F, Müller DJ, and Helenius J, Quantification of surface tension and internal pressure generated by single mitotic cells, Sci. Rep. 4, 6213 (2014). [DOI] [PMC free article] [PubMed] [Google Scholar]
- [16].Maître JL, Niwayama R, Turlier H, Nédélec F, and Hiiragi T, Pulsatile cell-autonomous contractility drives compaction in the mouse embryo, Nat. Cell Biol. 17, 849 (2015). [DOI] [PubMed] [Google Scholar]
- [17].Evans E and Yeung A, Apparent viscosity and cortical tension of blood granulocytes determined by micropipet aspiration, Biophys. J. 56, 151 (1989). [DOI] [PMC free article] [PubMed] [Google Scholar]
- [18].Fischer-Friedrich E, Toyoda Y, Cattin CJ, Müller DJ, Hyman AA, and Jülicher F, Rheology of the active cell cortex in mitosis, Biophys. J. 111, 589 (2016). [DOI] [PMC free article] [PubMed] [Google Scholar]
- [19].Trepat X, Deng L, An SS, Navajas D, Tschumperlin DJ, Gerthoffer WT, Butler JP, and Fredberg JJ, Universal physical responses to stretch in the living cell, Nature (London) 447, 592 (2007). [DOI] [PMC free article] [PubMed] [Google Scholar]
- [20].Broedersz CP, Depken M, Yao NY, Pollak MR, Weitz DA, and MacKintosh FC, Cross-Link-Governed Dynamics of Biopolymer Networks, Phys. Rev. Lett. 105, 238101 (2010). [DOI] [PubMed] [Google Scholar]
- [21].Gardel ML, Shin JH, MacKintosh FC, Mahadevan L, Matsudaira PA, and Weitz DA, Scaling of F-actin Network Rheology to Probe Single Filament Elasticity and Dynamics, Phys. Rev. Lett. 93, 188102 (2004). [DOI] [PubMed] [Google Scholar]
- [22].Kollmannsberger P and Fabry B, Linear and nonlinear rheology of living cells, Annu. Rev. Mater. Res. 41, 75 (2011). [Google Scholar]
- [23].Deng L, Trepat X, Butler JP, Millet E, Morgan KG, Weitz DA, and Fredberg JJ, Fast and slow dynamics of the cytoskeleton, Nat. Mater. 5, 636 (2006). [DOI] [PubMed] [Google Scholar]
- [24].Sollich P, Lequeux F, Hébraud P, and Cates ME, Rheology of Soft Glassy Materials, Phys. Rev. Lett. 78, 2020 (1997). [Google Scholar]
- [25].Sollich P, Rheological constitutive equation for a model of soft glassy materials, Phys. Rev. E 58, 738 (1998). [Google Scholar]
- [26].Lieleg O, Kayser J, Brambilla G, Cipelletti L, and Bausch AR, Slow dynamics and internal stress relaxation in bundled cytoskeletal networks, Nat. Mater. 10, 236 (2011). [DOI] [PubMed] [Google Scholar]
- [27].Fabry B, Maksym GN, Butler JP, Glogauer M, Navajas D, Taback NA, Millet EJ, and Fredberg JJ, Time scale and other invariants of integrative mechanical behavior in living cells, Phys. Rev. E 68, 041914 (2003). [DOI] [PubMed] [Google Scholar]
- [28].Ward SMV, Weins A, Pollak MR, and Weitz DA, Dynamic viscoelasticity of actin cross-linked with wild-type and disease-causing mutant α-actinin-4, Biophys. J. 95, 4915 (2008). [DOI] [PMC free article] [PubMed] [Google Scholar]
- [29].Broedersz CP and MacKintosh FC, Modeling semiflexible polymer networks, Rev. Mod. Phys. 86, 995 (2014). [Google Scholar]
- [30].Kuhn JR and Pollard TD, Real-time measurements of actin filament polymerization by total internal reflection fluorescence microscopy, Biophys. J. 88, 1387 (2005). [DOI] [PMC free article] [PubMed] [Google Scholar]
- [31].Kummrow M and Helfrich W, Deformation of giant lipid vesicles by electric fields, Phys. Rev. A 44, 8356 (1991). [DOI] [PubMed] [Google Scholar]
- [32].Niggemann G, Kummrow M, and Helfrich W, The bending rigidity of phosphatidylcholine bilayers: Dependences on experimental method, sample cell sealing and temperature, J. Phys. (France) II 5, 413 (1995). [Google Scholar]
- [33].Wong PK, Tan W, and Ho CM, Cell relaxation after electrodeformation: Effect of latrunculin A on cytoskeletal actin, Biomech. J. 38, 529 (2005). [DOI] [PubMed] [Google Scholar]
- [34].Yu M, Lira RB, Riske KA, Dimova R, and Lin H, Ellipsoidal Relaxation of Deformed Vesicles, Phys. Rev. Lett. 115, 128303 (2015). [DOI] [PubMed] [Google Scholar]
- [35].Sadik MM, Li J, Shan JW, Shreiber DI, and Lin H, Vesicle deformation and poration under strong dc electric fields, Phys. Rev. E 83, 066316 (2011). [DOI] [PubMed] [Google Scholar]
- [36].Zhang J, Zahn JD, Tan W, and Lin H, A transient solution for vesicle electrodeformation and relaxation, Phys. Fluids 25, 071903 (2013). [Google Scholar]
- [37].Teng Y, Pang M, Huang J, and Xiong C, Mechanical characterization of cancer cells during TGF-β1-induced epithelial-mesenchymal transition using an electrodeformation-based microchip, Sens. Actuat. B Chem. 240, 158 (2017). [Google Scholar]
- [38].Teng Y, Zhu K, Xiong C, and Huang J, Electrodeformation-based biomechanical chip for quantifying global viscoelasticity of cancer cells regulated by cell cycle, Anal. Chem. 90, 8370 (2018). [DOI] [PubMed] [Google Scholar]
- [39].Urbano RL and Clyne AM, An inverted dielectrophoretic device for analysis of attached single cell mechanics, Lab Chip 16, 561 (2016). [DOI] [PMC free article] [PubMed] [Google Scholar]
- [40].MacQueen LA, Buschmann MD, and Wertheimer MR, Mechanical properties of mammalian cells in suspension measured by electro-deformation, J. Micromech. Microeng. 20, 065007 (2010). [Google Scholar]
- [41].MacQueen LA, Thibault M, Buschmann MD, and Wertheimer MR, Electromechanical deformation of mammalian cells in suspension depends on their cortical actin thicknesses, J. Biomech. 45, 2797 (2012). [DOI] [PubMed] [Google Scholar]
- [42].Chen J, Abdelgawad M, Yu L, Shakiba N, Chien WY, Lu Z, Geddie WR, Jewett MAS, and Sun Y, Electrodeformation for single cell mechanical characterization, J. Micromech. Microeng. 21, 054012 (2011). [Google Scholar]
- [43].Shannon S, Jia D, Entersz I, Beelen P, Yu M, Carcione C, Carcione J, Mahtabfar A, Vaca C, Weaver M, Shreiber D, Zahn JD, Liu L, Lin H, and Foty RA, Inhibition of glioblastoma dispersal by the MEK inhibitor PD0325901, BMC Cancer 17, 121 (2017). [DOI] [PMC free article] [PubMed] [Google Scholar]
- [44].Guido I, Jaeger MS, and Duschl C, Influence of medium consumption on cell elasticity, Cytotechnology 62, 257 (2010). [DOI] [PMC free article] [PubMed] [Google Scholar]
- [45].Guido I, Jaeger MS, and Duschl C, Dielectrophoretic stretching of cells allows for characterization of their mechanical properties, Eur. Biophys. J. 40, 281 (2011). [DOI] [PubMed] [Google Scholar]
- [46].Yu M, Mahtabfar A, Beelen P, Demiryurek Y, Shreiber DI, Zahn JD, Foty RA, Liu L, and Lin H, Coherent timescales and mechanical structure of multicellular aggregates, Biophys. J. 114, 2703 (2018). [DOI] [PMC free article] [PubMed] [Google Scholar]
- [47].Desprat N, Richert A, Simeon J, and Asnacios A, Creep function of a single living cell, Biophys. J. 88, 2224 (2005). [DOI] [PMC free article] [PubMed] [Google Scholar]
- [48].Alcaraz J, Buscemi L, Grabulosa M, Trepat X, Fabry B, Farré R, and Navajas D, Microrheology of human lung epithelial cells measured by atomic force microscopy, Biophys. J. 84, 2071 (2003). [DOI] [PMC free article] [PubMed] [Google Scholar]
- [49].Rother J, Nöding H, Mey I, and Janshoff A, Atomic force microscopy-based microrheology reveals significant differences in the viscoelastic response between malign and benign cell lines, Open Biol. 4, 140046 (2014). [DOI] [PMC free article] [PubMed] [Google Scholar]
- [50].Kroy K and Glaser J, The glassy wormlike chain, New J. Phys. 9, 416 (2007). [Google Scholar]
- [51].Nyberg KD, Hu KH, Kleinman SH, Khismatullin DB, Butte MJ, and Rowat AC, Quantitative deformability cytometry: Rapid, calibrated measurements of cell mechanical properties, Biophys. J. 113, 1574 (2017). [DOI] [PMC free article] [PubMed] [Google Scholar]
- [52].Efremov YM, Wang WH, Hardy SD, Geahlen RL, and Raman A, Measuring nanoscale viscoelastic parameters of cells directly from AFM force-displacement curves, Sci. Rep. 7, 1541 (2017). [DOI] [PMC free article] [PubMed] [Google Scholar]
- [53].Lim CT, Zhou EH, and Quek ST, Mechanical models for living cells—A review, J. Biomech. 39, 195 (2006). [DOI] [PubMed] [Google Scholar]
- [54].Granek R, From semi-flexible polymers to membranes: Anomalous diffusion and reptation, J. Phys. (France) II 7, 1761 (1997). [Google Scholar]
- [55].Hoffman BD, Massiera G, Van Citters KM, and Crocker JC, The consensus mechanics of cultured mammalian cells, Proc. Natl. Acad. Sci. USA 103, 10259 (2006). [DOI] [PMC free article] [PubMed] [Google Scholar]
- [56].Moeendarbary E and Harris AR, Cell mechanics: Principles, practices, and prospects, Wiley Interdiscip. Rev. Syst. Biol. Med. 6, 371 (2014). [DOI] [PMC free article] [PubMed] [Google Scholar]
- [57].Lim CT, Zhou EH, Li A, Vedula SRK, and Fu HX, Experimental techniques for single cell and single molecule biomechanics, Mater. Sci. Eng. C 26, 1278 (2006). [Google Scholar]
- [58].Stamenović D, Rosenblatt N, Montoya-Zavala M, Matthews BD, Hu S, Suki B, Wang N, and Ingber DE, Rheological behavior of living cells is timescale-dependent, Biophys. J. 93, L39 (2007). [DOI] [PMC free article] [PubMed] [Google Scholar]
- [59].Liu L, Yu M, Lin H, and Foty RA, Deformation and relaxation of an incompressible viscoelastic body with surface viscoelasticity, J. Mech. Phys. Solids 98, 309 (2017). [Google Scholar]
- [60].Tinevez JY, Schulze U, Salbreux G, Roensch J, Joanny J, and Paluch E, Role of cortical tension in bleb growth, Proc. Natl. Acad. Sci. USA 106, 18581 (2009). [DOI] [PMC free article] [PubMed] [Google Scholar]
- [61].Wottawah F, Schinkinger S, Lincoln B, Ananthakrishnan R, Romeyke M, Guck J, and Käs J, Optical Rheology of Biological Cells, Phys. Rev. Lett. 94, 098103 (2005). [DOI] [PubMed] [Google Scholar]
- [62].Wu P-H, Aroush DR-B, Asnacios A, Chen W-C, Dokukin ME, Doss BL, Durand-Smet P, Ekpenyong A, Guck J, Guz NV et al. , A comparison of methods to assess cell mechanical properties, Nat. Methods 15, 491 (2018). [DOI] [PMC free article] [PubMed] [Google Scholar]
- [63].Hochmuth RM, Micropipette aspiration of living cells, J. Biomech. 33, 15 (2000). [DOI] [PubMed] [Google Scholar]
- [64].Guo Q, Park S, and Ma H, Microfluidic micropipette aspiration for measuring the deformability of single cells, Lab Chip 12, 2687 (2012). [DOI] [PubMed] [Google Scholar]
- [65].Sit PS, Spector AA, Lue AJ, Popel AS, and Brownell WE, Micropipette aspiration on the outer hair cell lateral wall, Biophys. J. 72, 2812 (1997). [DOI] [PMC free article] [PubMed] [Google Scholar]
- [66].Mietke A, Otto O, Girardo S, Rosendahl P, Taubenberger A, Golfier S, Ulbricht E, Aland S, Guck J, and Fischer-Friedrich E, Extracting cell stiffness from real-time deformability cytometry: Theory and experiment, Biophys. J. 109, 2023 (2015). [DOI] [PMC free article] [PubMed] [Google Scholar]
- [67].Wang X, Wang XB, and Gascoyne PR, General expressions for dielectrophoretic force and electrorotational torque derived using the maxwell stress tensor method, J. Electrostat 39, 277 (1997). [Google Scholar]
- [68].Jones TB and Jones TB, Electromechanics of Particles (Cambridge University Press, Cambridge, 2005). [Google Scholar]
- [69].Zhang J, Zahn JD, and Lin H, Transient solution for droplet deformation under electric fields, Phys. Rev. E 87, 043008 (2013). [DOI] [PubMed] [Google Scholar]
- [70].Vlahovska PM, Gracia RS, Aranda-Espinoza S, and Dimova R, Electrohydrodynamic model of vesicle deformation in alternating electric fields, Biophys. J. 96, 4789 (2009). [DOI] [PMC free article] [PubMed] [Google Scholar]
- [71].Kürschner M, Nielsen K, Andersen C, Sukhorukov VL, Schenk WA, Benz R, and Zimmermann U, Interaction of lipophilic ions with the plasma membrane of mammalian cells studied by electrorotation, Biophys. J. 74, 3031 (1998). [DOI] [PMC free article] [PubMed] [Google Scholar]
- [72].Qiao G, Duan W, Chatwin C, Sinclair A, and Wang W, Electrical properties of breast cancer cells from impedance measurement of cell suspensions, J. Phys.: Conf. Ser. 224, 012081 (2010). [Google Scholar]
- [73].Becker FF, Wang XB, Huang Y, Pethig R, Vykoukal J, and Gascoyne PR, Separation of human breast cancer cells from blood by differential dielectric affinity, Proc. Natl. Acad. Sci. USA 92, 860 (1995). [DOI] [PMC free article] [PubMed] [Google Scholar]
- [74].Bordi F, Cametti C, Rosi A, and Calcabrini A, Frequency domain electrical conductivity measurements of the passive electrical properties of human lymphocytes, Biochim. Biophys. Acta. Biomembr. 1153, 77 (1993). [DOI] [PubMed] [Google Scholar]
- [75].Di Biasio A and Cametti C, On the dielectric relaxation of biological cell suspensions: The effect of the membrane electrical conductivity, Colloid. Surf. B 84, 433 (2011). [DOI] [PubMed] [Google Scholar]
- [76].Li J and Lin H, The current-voltage relation for electropores with conductivity gradients, Biomicrofluidics 4, 013206 (2010). [DOI] [PMC free article] [PubMed] [Google Scholar]


