. 2023 Oct 10;309(1):e231092. doi: 10.1148/radiol.231092

Figure 4:

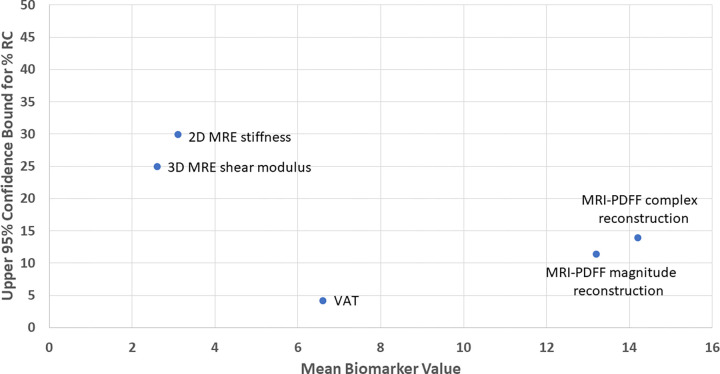
Point estimate graph of the upper 95% confidence bounds for different-day repeatability coefficient percentages (%RC) for all imaging biomarkers shows the relative spread between biomarkers. MRE = MR elastography, PDFF = proton density fat fraction, 3D = three-dimensional, 2D = two-dimensional, VAT = visceral adipose tissue.

Point estimate graph of the upper 95% confidence bounds for different-day repeatability coefficient percentages (%RC) for all imaging biomarkers shows the relative spread between biomarkers. MRE = MR elastography, PDFF = proton density fat fraction, 3D = three-dimensional, 2D = two-dimensional, VAT = visceral adipose tissue.