. 2023 Oct 10;309(1):e231092. doi: 10.1148/radiol.231092

Figure 5:

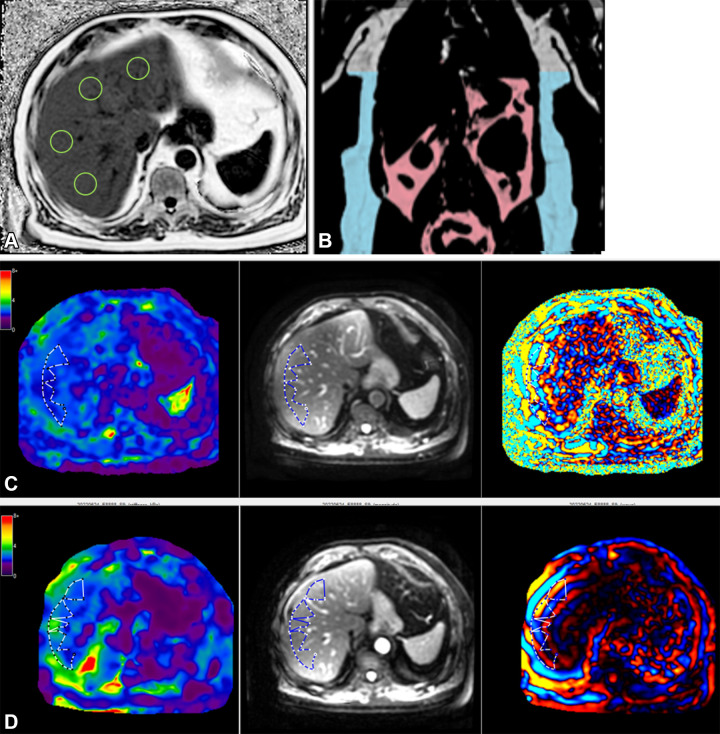
MRI in a 65-year-old male participant with low likelihood of advanced fibrosis according to the fibrosis based on four factors (FIB-4) index. (A) Axial MRI proton density fat fraction map shows regions of interest (green circles) drawn in each Couinaud segment while avoiding any vessels or lesions, as per the study protocol. (B) Coronal image shows body composition with autosegmented visceral (pink) and subcutaneous (blue) adipose tissue. (C) Left to right: Axial elastogram, magnitude, and wave images obtained at two-dimensional MR elastography (MRE) show placement of the region of interest (dotted outline) in the region of parallel wave propagation, avoiding the outer edge of the liver. (D) Left to right: Axial elastogram, magnitude, and wave images obtained at three-dimensional MRE similarly show the region of interest (dotted outline) in a region of parallel wave propagation, avoiding the outer margin of the liver. Color bars alongside elastograms indicate a range of kilopascals from low (purple) to high (red).

MRI in a 65-year-old male participant with low likelihood of advanced fibrosis according to the fibrosis based on four factors (FIB-4) index. (A) Axial MRI proton density fat fraction map shows regions of interest (green circles) drawn in each Couinaud segment while avoiding any vessels or lesions, as per the study protocol. (B) Coronal image shows body composition with autosegmented visceral (pink) and subcutaneous (blue) adipose tissue. (C) Left to right: Axial elastogram, magnitude, and wave images obtained at two-dimensional MR elastography (MRE) show placement of the region of interest (dotted outline) in the region of parallel wave propagation, avoiding the outer edge of the liver. (D) Left to right: Axial elastogram, magnitude, and wave images obtained at three-dimensional MRE similarly show the region of interest (dotted outline) in a region of parallel wave propagation, avoiding the outer margin of the liver. Color bars alongside elastograms indicate a range of kilopascals from low (purple) to high (red).