Abstract
Fate determination of primordial germ cells (PGCs) is regulated in a multi‐layered manner, involving signaling pathways, epigenetic mechanisms, and transcriptional control. Chemical modification of macromolecules, including epigenetics, is expected to be closely related with metabolic mechanisms but the detailed molecular machinery linking these two layers remains poorly understood. Here, we show that the hexosamine biosynthetic pathway controls PGC fate determination via O‐linked β‐N‐acetylglucosamine (O‐GlcNAc) modification. Consistent with this model, reduction of carbohydrate metabolism via a maternal ketogenic diet that decreases O‐GlcNAcylation levels causes repression of PGC formation in vivo. Moreover, maternal ketogenic diet intake until mid‐gestation affects the number of ovarian germ cells in newborn pups. Taken together, we show that nutritional and metabolic mechanisms play a previously unappreciated role in PGC fate determination.
Keywords: germ cells, glucose metabolism, ketogenic diet, maternal nutrition, O‐GlcNAcylation
Subject Categories: Development, Metabolism, Post-translational Modifications & Proteolysis
The hexosamine biosynthetic pathway and protein O‐GlcNAcylation play a role in PGC specification. Reduction of carbohydrate metabolism via a maternal ketogenic diet also controls fetal PGC development through this pathway, suggesting the possibility that nutritional status in early pregnancy regulates fetal germ cell formation and differentiation.

Introduction
In mice, primordial germ cells (PGCs), the precursors of both spermatozoa and oocytes, are determined from pluripotent epiblast cells at approximately embryonic day (E) 6.5 (Ginsburg et al, 1990; Saitou & Yamaji, 2012). Several signaling pathways and transcriptional regulators involved in this process have been identified. For instance, bone morphogenetic protein (BMP) 4 and the Wingless/Integrated (WNT) 3 signals result in increased levels of the transcripts of B lymphocyte‐induced maturation protein 1 (Blimp1/Prdm1) and Prdm14, two genes encoding PR/SET histone methyltransferase domain‐containing transcriptional regulators essential for PGC formation (Lawson et al, 1999; Ohinata et al, 2009; Aramaki et al, 2013). PGC fate determination also is accompanied by epigenetic remodeling, including large‐scale reorganization of chromatin signatures like histone H3 lysine 4 tri‐methylation (H3K4me3), H3K27me3, H3K9 di‐methylation (H3K9me2), and demethylation of 5‐methylcytosine (5mC) (Seki et al, 2005; Seisenberger et al, 2012; Kurimoto et al, 2015). In addition, multiple epigenetic factors are required for the induction of PGC‐like cells (PGCLCs) (Mochizuki et al, 2018a, 2018b).
Intriguingly, chemical modification of macromolecules (including epigenetic modification of histones and DNA) and metabolic regulation are thought to be closely related (Hayashi & Matsui, 2022; Matsui & Hayashi, 2022), but reports describing metabolic control of PGC fate determination is limited. We previously performed integrated metabolomic and proteomic analyses of PGCs (Hayashi et al, 2017, 2020; Tanaka et al, 2021), and found that sequential conversion of the major energy metabolic pathway from glycolysis to oxidative phosphorylation (OXPHOS) occurs during PGC differentiation and that this conversion plays an important role in reprogramming, survival, and induction of PGCs from pluripotent stem cells. In addition, a more recent study reported that an intermediate metabolite involved in the tricarboxylic acid (TCA) cycle, alpha‐ketoglutarate (α‐KG), plays a role in PGC fate determination via preservation of low H3K9me2 and high H3K27me3 in epiblast like cells (EpiLCs) (Tischler et al, 2019). These studies therefore suggest the importance of a crosstalk between the regulation of modification and metabolism in PGC formation.
Of note, nutritional conditions in the culture medium and in the gestational mother are known to affect the modification status of macromolecules in fetal germ cell formation and differentiation (Nassan et al, 2018; Verdikt & Allard, 2021). In human PGCLCs (Irie et al, 2015), vitamin C supplementation enhances the activities of Jumonji (Jmj) C histone demethylases and Ten‐eleven translocation (TET) proteins (Lee Chong et al, 2019), in turn increasing the levels of 5‐hydroxymethylcytosine (5hmC) that facilitates the expression of key genes involved in early germ cell development (Li et al, 2019). Consistent with this notion, maternal vitamin C deficiency leads to defects in DNA demethylation through reduced TET1 activity and impaired development of fetal germ cells, resulting in reduced fecundity in adult offspring (DiTroia et al, 2019). Although these findings suggest that the maternal nutritional state affects the differentiation of fetal germ cells, no reports to our knowledge has yet clearly shown the contribution of maternal nutrition and its relation with metabolic control for PGC specification.
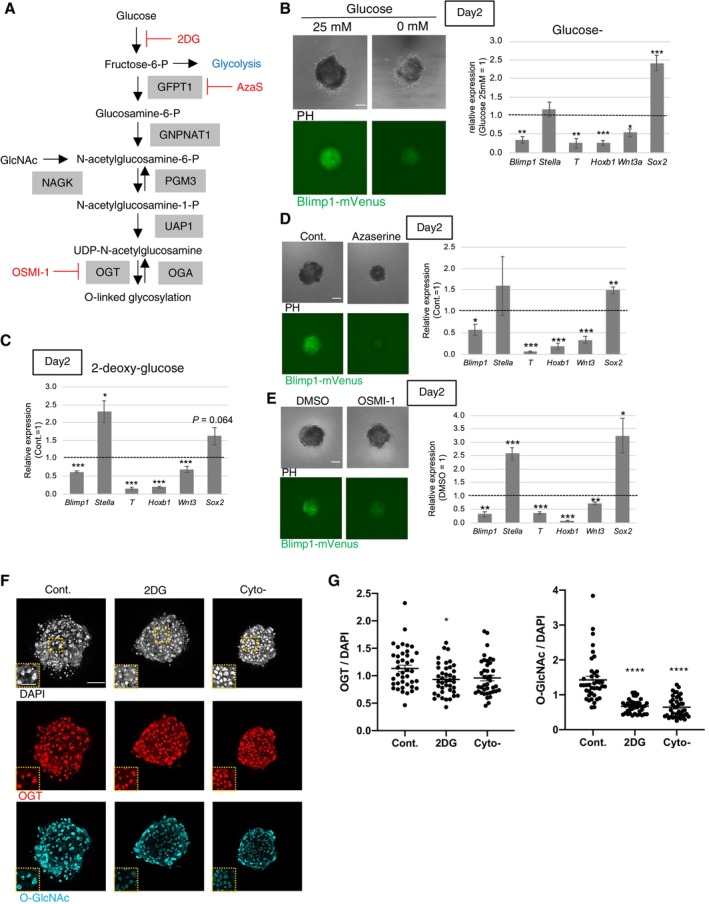
Related to the nutritional and metabolic regulation of germ cell fate, we have previously demonstrated that glucose depletion or inhibition of glucose metabolism represses PGCLC formation (Hayashi et al, 2017), indicating an important role of carbohydrates and their metabolism in germ cell fate determination. However, the downstream metabolic pathway that utilize glucose to regulate PGC specification remains unclear. Extending our previous findings, in the present study, we elucidate that the hexosamine biosynthetic pathway (HBP), a branched metabolic pathway of glycolysis involved in production of uridine diphosphate N‐acetylglucosamine (UDP‐GlcNAc) (Fig 1A), is responsible metabolic pathway for the glucose‐mediated PGC specification. UDP‐GlcNAc‐based protein O‐linked β‐N‐acetylglucosaminylation (O‐GlcNAcylation) functions as a nutrient sensor in cells and regulates various cellular processes including cell signaling, transcription, and epigenetic regulation via posttranslational modification of proteins (Wells et al, 2001). Based on the idea, we reveal a link between maternal nutrition, carbohydrate metabolism, and protein O‐GlcNAcylation for PGC specification.
Figure 1. Roles of hexosamine biosynthetic pathway and O‐GlcNAcylation in PGCLC induction.
-
AA schematic diagram of hexosamine biosynthetic pathway (HBP) and O‐linked β‐N‐acetylglucosaminylation (O‐GlcNAcylation) of proteins. Red indicates drugs used in this study.
-
BEffect of glucose depletion on BV fluorescence (left), and gene expression (right) in the PGCLC‐containing aggregates at day 2.
-
CEffect of glycolytic inhibition by 2‐deoxy‐glucose (2DG) on gene expression. Values are plotted as mean ± SE of three independent experiments.
-
D, EEffect of HBP inhibition by azaserine (D), and O‐GlcNAc inhibition by an OGT inhibitor, OSMI‐1 (E) on BV fluorescence (left) and gene expression (right) in the PGCLC‐containing aggregates at Day 2.
-
F, GEffect of a glycolytic inhibitor, 2‐deoxy glucose (2DG) on the expression of OGT and O‐GlcNAcylation in the PGCLC‐containing aggregates at Day 2 examined by immunostaining (F). PGCLC induced without cytokines (Cyto−) is also shown. Rectangular areas shown in the DAPI images correspond to the enlarged images in the insets. Quantification of relative signal intensities of OGT and O‐GlcNAcylation (G) of each cell in aggregates compared with cells in the control aggregates (total 40 cells from three biological replicates).
Data information: Values are plotted as mean ± SE of three (B, C, D, G), and four (E) independent experiments. *P < 0.05, **P < 0.01, ***P < 0.001 (Student's t‐test (B, C, D, E) or one‐way ANOVA (G)). P < 0.1 is also indicated by actual values to show difference tendency. Scale bar: 100 μm (B, D, E), 50 and 25 μm (insets) (F). See also Figs EV1, EV2, EV3.
Source data are available online for this figure.
Results and Discussion
Effects of glycolytic inhibition on gene expression in PGCLCs
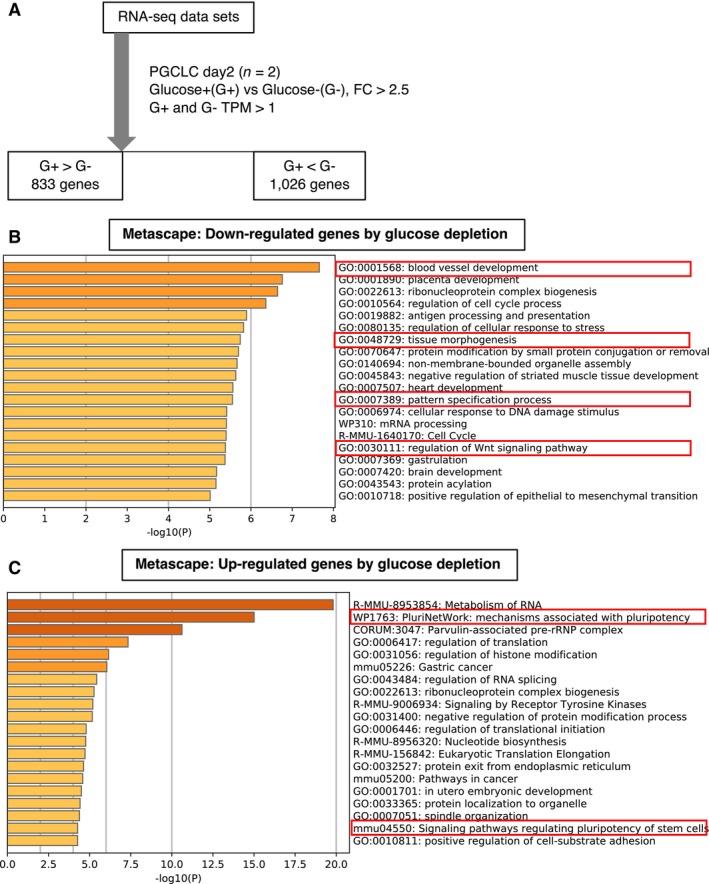
We previously observed that glucose depletion affects PGC specification (Hayashi et al, 2017). In the present study, we found that glucose depletion causes changes in the expression of Blimp1‐mVenus (BV: expressing a membrane‐targeted Venus (mVenus) protein under the control of the Blimp1 regulatory element) and representative markers of PGC specification, pluripotency, and mesodermal cells in cell aggregates 2 days after induction of PGCLCs (Fig 1B) (Hayashi et al, 2011). Notably, genes involved in WNT3 signaling pathways and downstream targets of WNT3 and BMP4 for PGC specification (Wnt3, T, Blimp1, and Homeobox b1 (Hoxb1)) showed decreased transcription, whereas the pluripotent marker SRY (sex determining region Y)‐box 2 (Sox2) showed increased transcription upon glucose depletion. The same patterns were seen upon glycolytic inhibition induced by the addition of 2‐deoxy‐glucose (2DG), a non‐metabolizable glucose analog (Fig 1C) except for Stella. The expression of Stella, a pluripotency and germ cell‐related genes, was unchanged in glucose‐depleted condition and up‐regulated in 2DG‐mediated glycolysis inhibition, indicating the ambiguous relationship between its expression and the glucose metabolism. RNA‐sequencing (RNA‐seq) analysis of PGCLC‐containing aggregates at day 2 of growth in culture medium with or without glucose also confirmed the tendency of the gene expression changes (Fig EV1A–C). Metascape analysis revealed that genes with reduced transcription after glucose deprivation were involved in WNT signaling pathway, blood vessel development, tissue morphogenesis and pattern specification (Fig EV1B; Dataset EV1). Upregulated genes were enriched for terms associated with signaling pathways regulating pluripotency (Fig EV1C; Dataset EV1). Glucose and related metabolic pathways, therefore, play an important role in maintaining correct gene expression pattern for PGC specification.
Figure EV1. RNA‐seq analysis of PGCLC‐containing aggregates cultured with or without glucose.
-
AA scheme of RNA‐seq analysis of the PGCLC‐containing aggregates at day 2 cultured with and without glucose.
-
B, CFunctional annotation analysis of differentially expressed genes (DEGs). Metascape analysis of down‐ (B) and up‐regulated (C) genes by glucose depletion. Focused terms are highlighted by red.
Glycolysis‐related metabolic pathways responsible for PGCLC specification
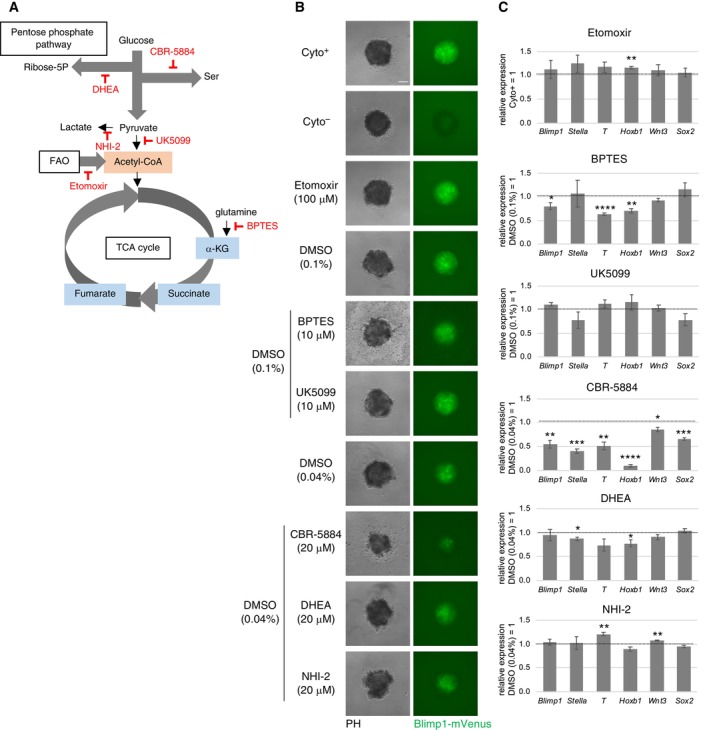
We next performed a screening of glycolysis‐related metabolic pathways to find candidates responsible for PGCLC specification. Among these metabolic pathways (Fig EV2A), inhibition of serine metabolism using the compound CBR‐5844 severely decreased BV expression at day 2 (Fig EV2B). In the presence of CBR‐5844, the levels of the transcripts of examined PGC specification‐related genes decreased at day 2 (Fig EV2C), although the observed pattern was distinct from the changes following glucose depletion (Fig 1B). These results suggested that glucose depletion primarily influences pathways downstream to glycolysis other than serine metabolism (Hayashi et al, 2017). Inhibition of glutamine metabolism (using bis‐2‐(5‐phenylacetamido‐1, 2, 4‐thiadiazol‐2‐yl) ethyl sulfide 3, BPTES) resulted in gene expression changes similar to those after glucose depletion, although in a weaker level. This suggested a potential relationship between glutamine metabolism and glucose usage in PGCLCs. Inhibition of fatty acid oxidation (using etomoxir), pyruvate uptake into mitochondria (using UK‐5099), the pentose phosphate pathway (using dehydroepiandrosterone, DHEA), or lactate synthesis (using NHI‐2) did not significantly alter gene expression nor BV accumulation (Fig EV2A–C). On the other hand, inhibition of glutamine fructose‐6‐phosphate transaminase 1 (GFPT1), the first and rate‐limiting enzyme of HBP, by azaserine (AzaS) resulted in decreased BV levels and gene expression changes similar to inhibition of glycolysis (Fig 1A and D). Taken together, these results indicated that the HBP pathway, downstream of glycolysis, could be responsible for activating the appropriate transcriptional program for PGC specification.
Figure EV2. The effects of inhibition of glycolysis‐related metabolic pathways during PGCLC induction.
-
AA schematic representation of glycolysis‐related metabolic pathways. Inhibitors used in this study are highlighted by red.
-
B, CThe effects of various inhibitors for glycolysis‐related pathways on BV fluorescence (B) and gene expression (C) in the PGCLC‐containing aggregates at Day 2. Scale bar: 100 μm. Values are plotted as mean ± SE of three independent experiments. *P < 0.05, **P < 0.01, ***P < 0.001 (Student's t‐test).
The final product of HBP, UDP‐GlcNAc, is used as a substrate for the O‐GlcNAc modification of various proteins. O‐GlcNAc transferase (OGT) and O‐GlcNAcase (OGA) catalyze the addition and removal of O‐GlcNAc, respectively (Fig 1A). Exposure of PGCLCs to OSMI‐1, a specific inhibitor of OGT, resulted in changes of gene expression similar to those observed by the inhibition of glycolysis or of HBP (Fig 1E). Therefore, we next investigated whether the inhibition of glycolysis during PGCLC induction causes a change in O‐GlcNAcylation; specifically, we performed immunostaining of day‐2 aggregates containing PGCLCs following exposure to 2DG (Fig 1F). Although the level of OGT staining was decreased only nominally by inhibition of glycolysis, O‐GlcNAcylation levels significantly decreased under this condition (Fig 1G). These results suggested that O‐GlcNAcylation of proteins plays an important role in maintaining the appropriate transcriptional program in PGCLCs.
O‐GlcNAcylation mediates transcriptomic changes in PGCLCs
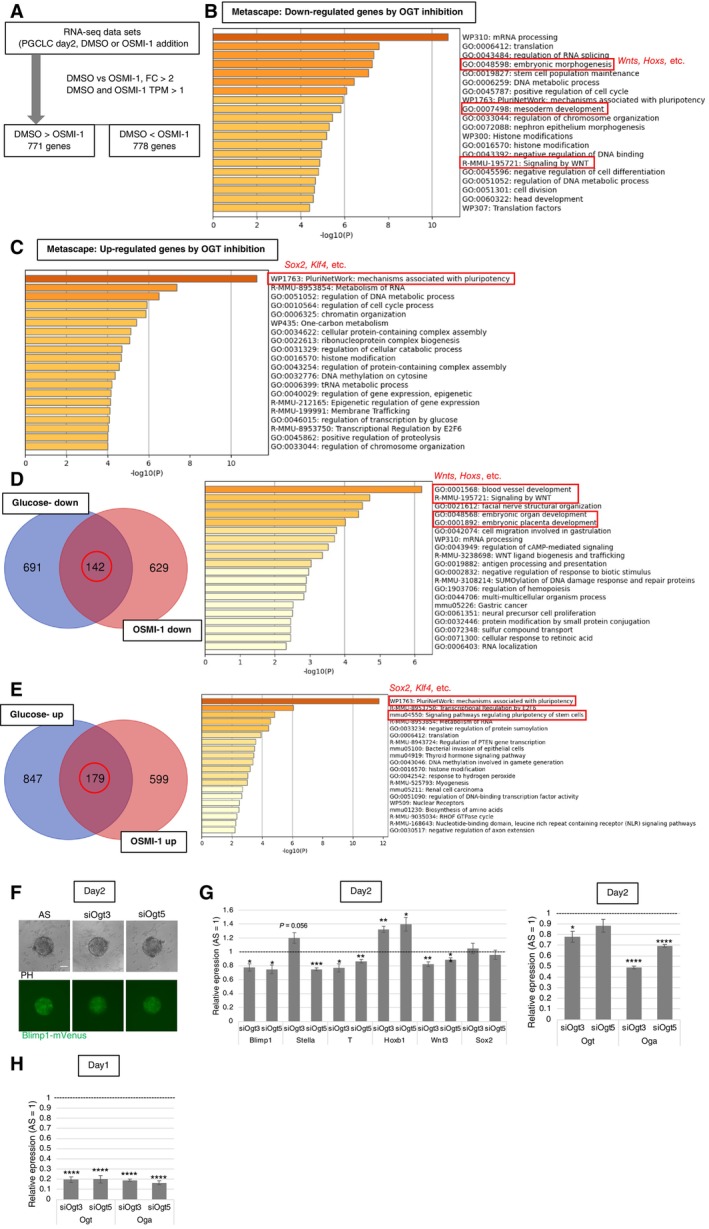
To clarify the effect of O‐GlcNAcylation on transcriptional regulation in PGC specification, we performed RNA‐seq analysis in PGCLC‐containing aggregates grown in culture medium supplemented with OSMI‐1 (Fig EV3A). Downregulated transcripts were enriched in terms related to early development, while upregulated transcripts were enriched in pluripotency‐related terms (Fig EV3B and C; Dataset EV2), consistent with the results obtained under glucose deprivation (Fig EV1B and C). Moreover, the related terms also were enriched for the differentially expressed genes (DEGs) shared between the conditions of OGT inhibition and glucose deprivation (Fig EV3D and E). Transcripts downregulated under both conditions were associated with development, including Wnt‐ and Hox‐related genes (Fig EV3D; Dataset EV3). Transcripts upregulated under both conditions were associated with genes related to pluripotency, such as Sox2 and Kruppel‐like factor 4 (Klf4) (Fig EV3E; Dataset EV3), as observed by RT–qPCR (Fig 1E). Regulation of O‐GlcNAcylation through glucose metabolism, therefore, regulates genes crucial for PGC specification.
Figure EV3. Gene expression changes in PGCLC‐containing aggregates with OGT inhibition by OSMI‐1 or siRNA.
-
AA scheme of the RNA‐seq analysis.
-
B, CFunctional annotation analysis of DEGs. Metascape analysis of down‐regulated (B) and up‐regulated (C) genes by OGT inhibition. Focused terms are highlighted by red.
-
D, EVenn diagram showing the overlap between genes down‐ (D) or up‐regulated (E) by glucose depletion and those down‐ or up‐regulated, by OSMI‐1, respectively (left). Metascape analysis of the overlapped genes (right). Focused terms are highlighted by red.
-
F, GThe effect of Ogt knockdown using siRNAs (siOgt3 and 5) on BV fluorescence (F), and gene expression (G) in the PGCLC‐containing aggregates at day 2. AS: AllStars negative control siRNA.
-
HOgt knockdown efficiency and influence on Oga expression in the aggregates at day 1.
Data information: Values are plotted as mean ± SE of three biological replicates (three technical replicates for each biological replicate sample in G and H). *P < 0.05, **P < 0.01, ***P < 0.001, ****P < 0.0001 (Student's t‐test). P < 0.1 is also indicated by actual values to show difference tendency. Scale bar: 100 μm (F).
Source data are available online for this figure.
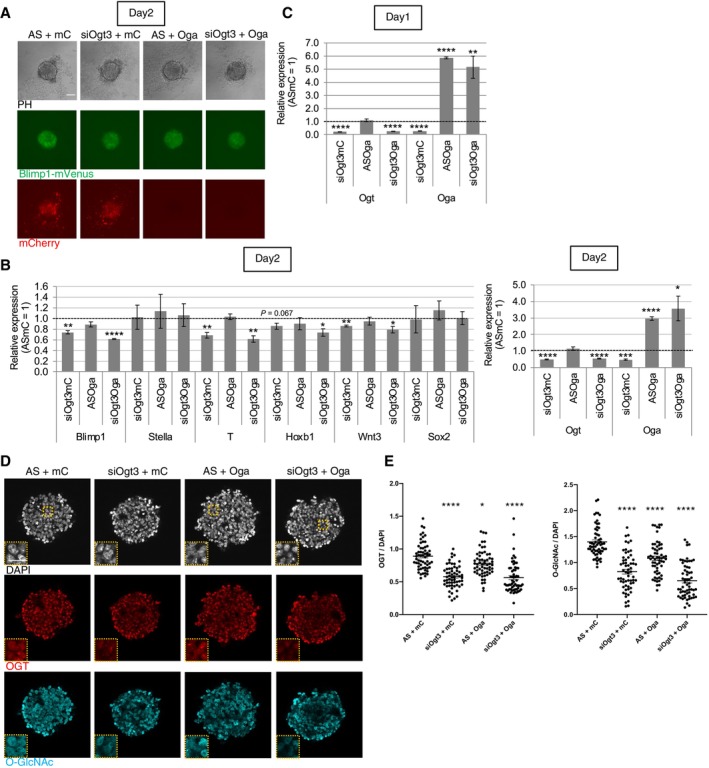
We further checked the effects of manipulation of Ogt and Oga (also known as Mgea5) expression to confirm that the reduction in PGCLC induction is due to changes in O‐GlcNAcylation rather than a side effect of OSMI‐1. Ogt knockdown (KD) using small interfering RNAs (siRNAs) resulted in a slight decrease in BV expression and decreased expression of Blimp1 and T genes compared to their expression with AllStars (AS) negative control siRNA (Fig EV3F and G). The reason for the milder changes of their expression compared to OSMI‐1 treatment is likely due to recovered expression of Ogt and downregulation of Oga by the day2 after Ogt KD (Fig EV3G and H), which is probably caused by the known mutual compensation of OGT and OGA levels to maintain O‐GlcNAc homeostasis (Ong et al, 2018). To overcome the problem, we applied the overexpression of Oga using lentiviral vectors with siOgt‐based KD. As a result, BV fluorescence compared to the control group introducing AS siRNA and mCherry (mC) over‐expression vector was more effectively reduced in PGCLCs induced with simultaneous addition of siOgt3 and Oga over‐expression vector than that by the siRNA alone (Fig 2A). Under this condition, a continuous decrease in Ogt expression and an increase in Oga expression were observed up to day 2 after induction (Fig 2B and C). In this condition, the expression of not only Blimp1 and T but also Hoxb1 and Wnt3 genes was more significantly decreased compared with their expression in the single‐gene manipulation condition, though the expression of Sox2 was still not increased (Fig 2B). Unlike the addition of siRNA alone, the siOgt‐induced decrease in Ogt expression was maintained until day2 in the siRNA and lentiviral vector coadministration for unknown reasons, which may cause downregulation of Hoxb1 expression as that by OSMI‐1 (Figs 2B and EV3G). OGT and O‐GlcNAc immunostaining of day‐2 aggregates containing PGCLCs (Fig 2D) revealed the decreased OGT level in the siOgt3 knockdown condition, and the decreased O‐GlcNAc level in siOgt3 knockdown and/or OGA overexpression conditions (Fig 2E). The most severe reduction in the O‐GlcNAc level was shown in aggregates with both siOgt addition and OGA overexpression, as expected. These results suggest that O‐GlcNAcylation plays an important role in PGC formation, at least through regulation of PGC‐related genes and mesodermal genes.
Figure 2. The effects of manipulation of Ogt and Oga gene expression in PGCLC induction.
-
A, BThe effect of Ogt knockdown using siOgt3 and Oga over‐expression using lentiviral vectors on BV fluorescence (A), and gene expression (B) in the PGCLC‐containing aggregates at day 2. AS: AllStars negative control siRNA, mC: mCherry over‐expression vector.
-
COgt knockdown and Oga over‐expression efficiency in the aggregates at day 1.
-
D, EThe effect of Ogt knockdown and Oga over‐expression on the expression of OGT and O‐GlcNAcylation in the PGCLC‐containing aggregates at Day 2 examined by immunostaining (D). Rectangular areas shown in the DAPI images correspond to the enlarged images in the insets. Quantification of relative signal intensities of OGT and O‐GlcNAcylation (E) of each cell in aggregates compared with cells in the AS+mC aggregates (total 60 cells from three biological replicates).
Data information: Values are plotted as mean ± SE of three biological replicates (three technical replicates for each biological replicate sample in B and C). *P < 0.05, **P < 0.01, ***P < 0.001, ****P < 0.0001 (Student's t‐test (B, C) or one‐way ANOVA (E)). P < 0.1 is also indicated by actual values to show difference tendency. Scale bar: 100 μm (A), 50 and 25 μm (insets) (D). See also Fig EV3.
Source data are available online for this figure.
PGC specification in Ogt‐conditional KO mice
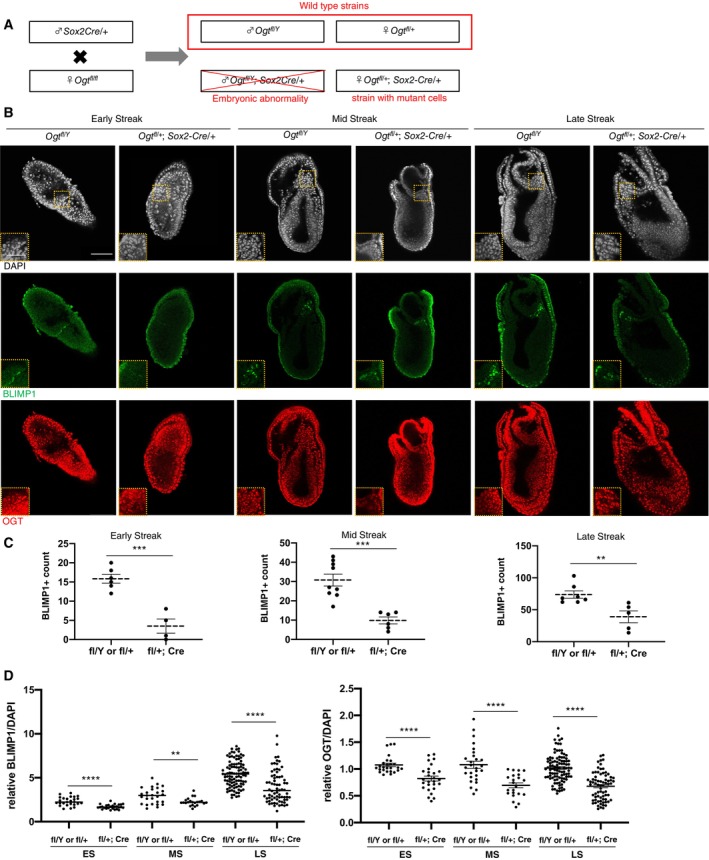
To genetically determine whether O‐GlcNAcylation affects PGC specification in vivo, we analyzed PGC formation using Ogt‐KO mice. Given that OGT is required for the viability of pluripotent stem cells (Shafi et al, 2000), Ogt‐KO results in embryonic lethality at the blastocyst stage. Therefore, we used conditional KO mice harboring “floxed” Ogt (i.e., flanked by loxP sites) and a Sox2Cre transgene that activates Cre recombinase production in epiblast cells by E6.5 (Hayashi et al, 2002). As Ogt is X‐linked, female mice bear two copies, while males carry only one (Fig 3A). We found that complete deletion of Ogt (male Ogt fl/Y ; Sox2Cre) resulted in severe embryonic abnormality shortly after implantation, and as a result, the embryonic stage was difficult to determine. Instead, we analyzed PGC formation in heterozygous KO embryos (female Ogt fl/+ ; Sox2Cre) using embryos lacking Sox2Cre (female Ogt fl/+ or male Ogt fl/Y ) as controls.
Figure 3. PGC formation in Ogt‐conditional knockout mice.
-
AA scheme of the epiblast specific Ogt knockout mice.
-
BBLIMP1 and OGT immunostaining of embryos of wild type (Ogt fl/Y ) and those with OGT‐deficient cells (Ogt fl/+ ; Sox2Cre) at around E7.0. Rectangular areas shown in the DAPI images correspond to the enlarged images in the insets. Scale bar: 50 and 25 μm (insets).
-
C, DQuantification of the number of BLIMP1‐positive cells (C), relative fluorescent intensities of BLIMP1 and OGT normalized with DAPI signal (D) in PGCs compared to neighboring epiblasts in the embryos with indicated genotypes. ES: early‐streak (wild type (Ogt fl/Y or Ogt fl/+ ), n = 6; mutant (Ogt fl/+ ; Sox2Cre), n = 4); MS: mid‐streak (wild type, n = 9; mutant, n = 6); LS: late streak (wild type, n = 7; mutant, n = 5) in (C). Total 26–101 cells from three biological replicates in (D).
Data information: Values are plotted as mean ± SE. **P < 0.01, ***P < 0.001, ****P < 0.0001 (Student's t‐test). See also Fig EV4.
Source data are available online for this figure.
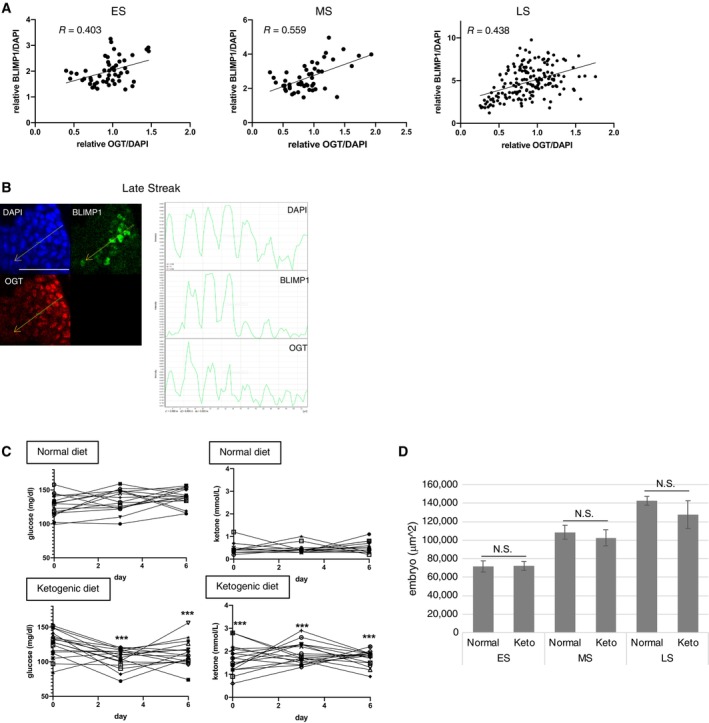
We used embryos with Ogt‐KO cells to examine the effect of Ogt KO on BLIMP1‐positive cells from the early streak to late streak stages (Fig 3B). In heterozygous Ogt‐KO embryos, the number of BLIMP1‐positive PGCs (exhibiting BLIMP1 fluorescence intensity > 2‐fold that of surrounding epiblast cells) was lower than the wild‐type at all stages tested (Fig 3C). The mean fluorescence intensity of BLIMP1 and OGT in BLIMP1‐positive cells was found also suppressed in KO embryos (Fig 3D). In addition, there was a positive correlation between the fluorescence intensity of OGT and BLIMP1 in epiblast cells of embryos at all stages tested (Fig EV4A and B). Together, these results suggested that OGT and O‐GlcNAcylation regulate PGC formation in vivo.
Figure EV4. Characterization of Ogt‐conditional knockout mice and ketogenic mice.
-
A, BCorrelation between DAPI‐normalized BLIMP1 and OGT signal intensity in regions existing PGCs in the embryos at early to late streak stages (n = 3 each). Plotted fluorescent intensity of BLIMP1 and OGT (A), and line‐scan histograms of the regions (B). The orange dotted lines shown in (B) for the line‐scan. Scale bar: 75 μm.
-
CBlood glucose and BHB levels in the pregnant mice fed with normal and ketogenic diets. Measurement of blood glucose (left) and BHB (right) levels in the pregnant mice fed with normal (top) and ketogenic (bottom) diets on days 0, 3, and 6 after mating. Each line shows individual pregnant mice. normal, n = 15; ketogenic, n = 17. Significance of differences between normal and ketogenic diets were estimated by Student's t‐test. ***P < 0.001.
-
DThe size of embryos used for immunostaining, calculated by the area of DAPI‐stained images of the largest part of embryos. Values are plotted as mean ± SE. ES (normal, n = 9; ketogenic, n = 7), MS (normal, n = 6; ketogenic, n = 6), LS (normal, n = 6; ketogenic, n = 5). N.S.: not significant (Student's t‐test).
Effect of glucose metabolism modulation on PGC formation
We further examined maternal carbohydrate restriction, which could affect the glucose metabolism and O‐GlcNAcylation level, influences fetal PGC formation in vivo. For this purpose, we maintained pregnant mice on a ketogenic diet with no carbohydrates and high fat. This diet was expected to shift primary energy production in peripheral organs from carbohydrate metabolism to ketone metabolism (Paoli, 2014), and thereby permit examination of the effects of carbohydrate restriction on fetal PGC formation via modulation of glucose metabolism and O‐GlcNAcylation.
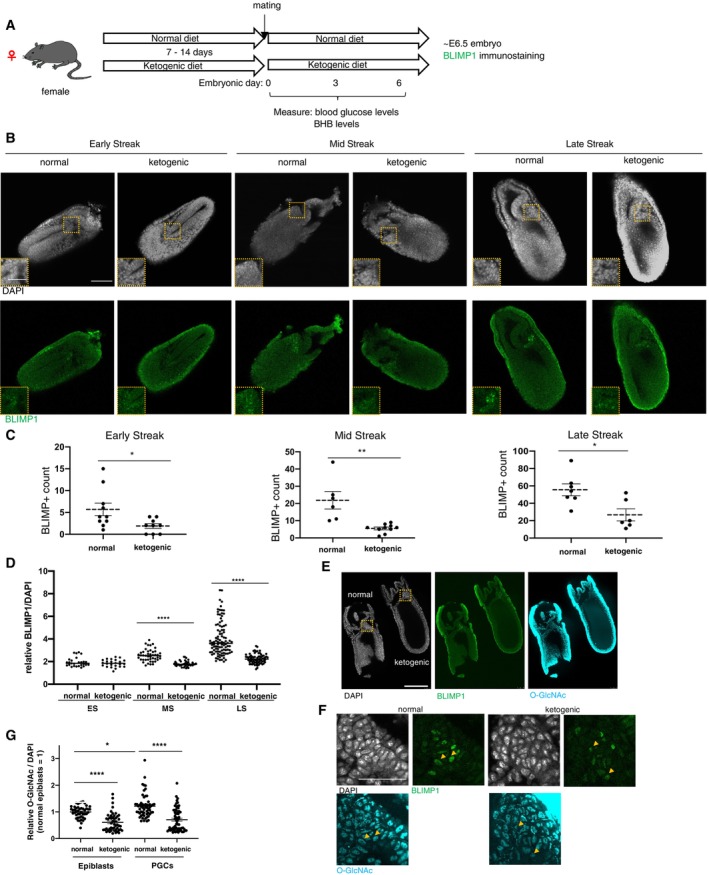
Consistent with this notion, pregnant mice on the ketogenic diet exhibited a decrease in blood glucose levels and an increase in one of ketone bodies, β‐hydroxybutyrate (BHB) levels (Figs 4A and EV4C), indicating successful induction of ketosis. There were no statistically significant changes in size in the ketogenic embryos (Fig EV4D). As noted for the Ogt‐KO embryos, lower numbers of BLIMP1‐positive PGCs were seen in embryos from pregnant mice under ketogenic diet, a pattern that we could confirm in all stages tested (Fig 4B and C). The mean fluorescence intensity for BLIMP1 in BLIMP1‐positive cells also decreased in embryos from pregnant mice under ketogenic diet (Fig 4D), as seen under the Ogt‐deficient condition (Fig 3D). These results suggested that maternal ketosis negatively affects fetal PGC formation in mice. We further investigated whether similar reduction of O‐GlcNAcylation to that observed in OGT‐inhibited PGCLCs occur in the embryos from pregnant mice under ketogenic diet. Immunostaining of E7.0 embryos revealed that BLIMP1‐positive PGCs and surrounding epiblast cells from pregnant mice under ketogenic diet exhibited decreased level of O‐GlcNAc (Fig 4E–G). Taken together, these results suggested that the decline of nascent PGCs in embryos in pregnant mice under ketogenic diet occurs via a mechanism involving the reduced glucose metabolism and O‐GlcNAcylation.
Figure 4. Effect of maternal ketogenic diet during PGC formation.
-
AA scheme of ketogenic diet feeding experiment on mice.
-
BEffects of maternal ketogenic diets on BLIMP1‐expressing nascent PGCs at around E7.0 examined by immunostaining. Rectangular areas shown in the DAPI images correspond to the enlarged images in the insets.
-
C, DQuantification of the number of BLIMP1‐positive cells (C), and relative fluorescent intensities of BLIMP1 normalized with DAPI signal in PGCs compared to neighboring epiblasts (D). ES: early‐streak (normal, n = 10; ketogenic, n = 9); MS: mid‐streak (normal, n = 6; ketogenic, n = 10); LS: late streak (normal, n = 7; ketogenic, n = 6) in (C). Total 27–78 cells from three biological replicates in (D).
-
E, FEffect of maternal ketogenic diets on the expression of O‐GlcNAcylation in the embryos at around E7.0 examined by immunostaining. Rectangular areas shown in the DAPI images in (E) correspond to (F). The yellow arrowheads in (F) indicate representative BLIMP1‐positive PGCs.
-
GQuantification of relative fluorescent signal intensities of O‐GlcNAcylation normalized with DAPI signal in BLIMP1‐expressing PGC and surrounding epiblast cells in the embryos with or without maternal ketogenic diet (Total 46–62 cells from five biological replicates, from late streak to late streak early bud stage).
Data information: Values are plotted as mean ± SE. **P < 0.01, ****P < 0.0001 (Student's t‐test; C, D) and one‐way ANOVA (G). Scale bar: 50 μm, and 25 μm (insets) (B), 250 μm (E), and 75 μm (F). See also Fig EV4.
Source data are available online for this figure.
Effect of glucose metabolism on fetal germ cell development
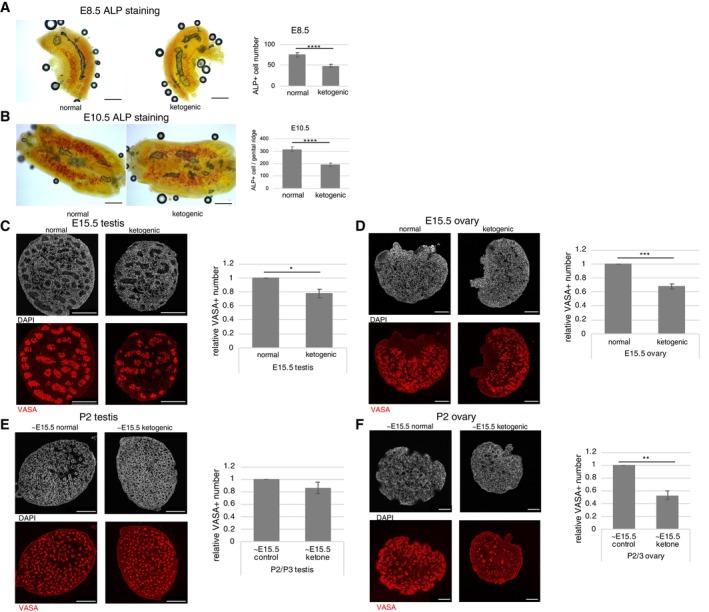
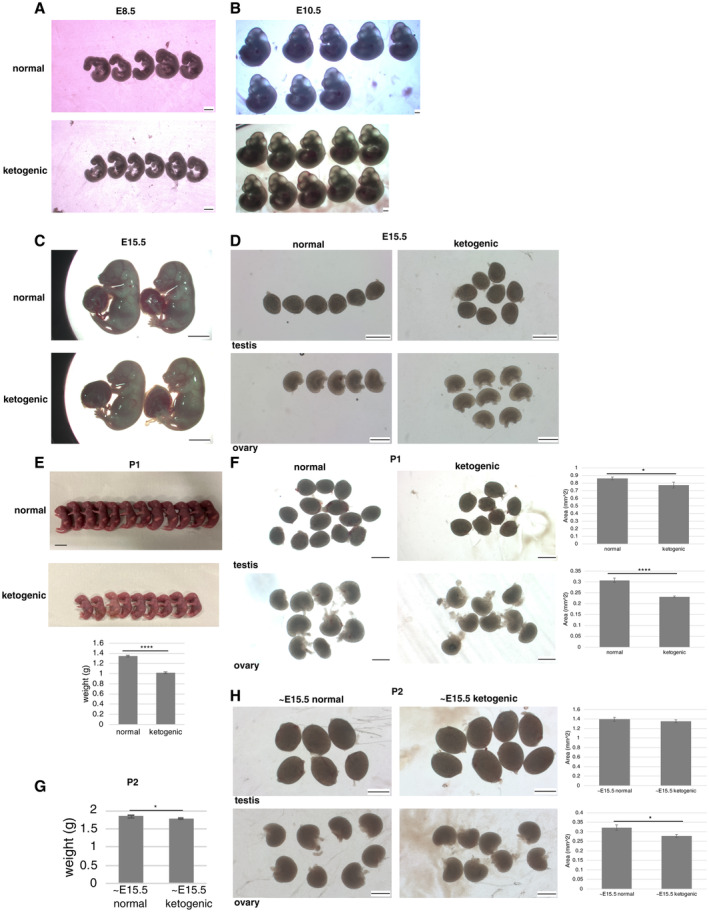
Finally, we investigated the effects of maternal ketogenic diet intake on fetal germ cell development. In E8.5 and E10.5 embryos, the number of PGCs in migration or in forming genital ridges, respectively, were decreased by maternal ketogenic diet intake, though there were no clear effects on fetal size and morphology (Figs 5A and B, and EV5A and B). The same was true for continued maternal ketogenic diet intake up to E15.5, with a decrease in the number of VASA‐positive germ cells in the male and female fetal gonads and no changes in fetal and gonad size and morphology (Figs 5C and D, and EV5C and D). We then examined newborn pups from mothers under the ketogenic diet and found that body weight and size of gonads were apparently reduced (Fig EV5E and F), suggesting that continuous maternal ketogenic diet until birth systemically affects pups. We therefore tested influence of maternal ketogenic diet up to E15.5 and normal diet afterwards. In this condition, the newborn pups had noticeably smaller ovaries while testes were normal in size, and there was no significant difference in body weight (Fig EV5G and H). In addition, they showed a decrease in VASA‐positive germ cell number, especially in the ovaries (Fig 5E and F). In summary, the results suggest that maternal ketogenic diet reduces germ cell numbers in fetus and newborn female pups even after switching to normal diet at mid‐gestation.
Figure 5. Effect of glucose metabolism modulation on fetal germ cell development.
-
A, BAlkaline phosphatase (ALP) staining of allantois in E8.5 embryos (A), and genital ridges of E10.5 embryos (B). The number of ALP‐positive cells was counted and compared in embryos derived from mothers fed a normal or ketogenic diet. E8.5 (normal, n = 12; ketogenic, n = 10), E10.5 (normal, n = 14; ketogenic, n = 14).
-
C–FEffects of maternal ketogenic diets on VASA‐positive germ cells at E15.5 (C, D) or newborn (E, F) gonads examined by immunostaining (testis, C, E; ovary, D, F). Germ cell counts were evaluated by counting VASA‐positive cells in serial sections and were showed as relative to the normal diet group (three biological replicates for each sample).
Data information: Values are plotted as mean ± SEM. *P < 0.05, **P < 0.01, ***P < 0.001, ****P < 0.0001 (Student's t‐test). Scale bar: 200 μm (A, B), 250 μm (C, E), 100 μm (D, F). See also Fig EV5.
Source data are available online for this figure.
Figure EV5. Embryos and newborn pups from mothers fed a normal or ketogenic diet.
-
A–CE8.5 (A), E10.5 (B), and E15.5 (C) embryos from mothers fed a normal or ketogenic diet.
-
DGonads in E15.5 embryos from mothers fed a normal or ketogenic diet.
-
EP1 pups from mothers fed a normal or ketogenic diet. Weight was measured (normal, n = 25; ketogenic, n = 21).
-
FGonads in P1 pups, testes (normal, n = 14; ketogenic, n = 8), ovaries (normal, n = 9; ketogenic, n = 8). Gonad size was measured as the area value of each gonad quantified in Image J.
-
GWeight of P2 pups from mothers fed a normal or ketogenic diet until E15.5 and normal diet afterwards (normal, n = 12; ketogenic, n = 13).
-
HGonads in P2 pups after switching to a normal diet at E15.5, testes (normal, n = 6; ketogenic, n = 8), ovaries (normal, n = 8; ketogenic, n = 8). Gonad size was measured as the area value of each gonad quantified in ImageJ.
Data information: Values are plotted as mean ± SE. *P < 0.05, **** P < 0.0001 (Student's t‐test). Scale bar: 500 μm (A, B, ovaries in D, F, and H), 5 mm (C), 1 mm (testes in D, F, and H), 1 cm (E).
We showed that HBP inhibition in PGCs repressed PGC development via impaired O‐GlcNAcylation. How O‐GlcNAcylation regulates PGC formation is unclear, but it has been reported, for example, that in regulatory T cells, OGT upregulates Blimp1 expression through FOXP3 O‐GlcNAcylation and maintains cell identity (Liu et al, 2019). Similarly, PGC formation may be regulated via O‐GlcNAcylation of master regulators upstream of BLIMP1. Meanwhile, inhibition of O‐GlcNAcylation showed a relatively mild effect on PGC specification, and we cannot rule out the possibility that the observed PGC‐related phenotypes may be partly due to general influences of O‐GlcNAc inhibition on embryonic cells.
We also showed that the ketogenic diet caused decreased O‐GlcNAcylation in nascent PGCs, in turn leading to impaired PGC formation (Fig 4). Previous studies have shown that ketogenic diet alters the O‐GlcNAcylation status in several tissues including liver and brain, although the functional implications of these changes remain poorly understood (Newell et al, 2017; Zuliani et al, 2021). Given that ketogenic diet induces low blood glucose in the pregnant mother, and resulted in decreased O‐GlcNAcylation in the embryos in our experiments (Fig 4), maternal ketogenic diet may affect both maternal and fetal glycolytic activity and thereby lead to decreased O‐GlcNAcylation in the embryos. In addition, glucose depletion in PGCLCs in culture affects PGCLC formation similar to O‐GlcNAcylation inhibition. We hypothesize that maternal ketogenic diet may directly result in impaired glucose metabolism and subsequent defects in O‐GlcNAcylation in the embryo. At the same time, the ketogenic diet also induces ketosis, a condition whereby fat is converted into ketones such as BHB in the liver and blood BHB levels increase. Ketones such as BHB then are converted to acetyl‐CoA and function as an energy source in peripheral tissues. Given that BHB is a substrate for the β‐hydroxybutyrylation of the lysine residues of histones (Xie et al, 2016; Dąbek et al, 2020), and that H3K9 β‐hydroxybutyrylation results in increased expression of the Forkhead box O1 (Foxo1) and Peroxisome proliferator‐activated receptor gamma, coactivator 1 alpha (Ppargc1a) genes in CD8+ memory T cells (Zhang et al, 2020), ketone bodies also may influence PGC formation via epigenetic regulation. Therefore, future studies will need to investigate the role of ketone bodies, including effects on histone β‐hydroxybutyrylation, during PGC specification. In addition, the effect of the ketogenic diet on systemic maternal and fetal metabolism will need to be investigated, including whether those changes lead to decreased O‐GlcNAcylation in embryonic cells other than PGCs.
Another remaining question is whether the effects induced by the ketogenic diet influence germ cells at later gestational stages. In this regard, we found that maternal ketogenic diet up to E15.5 leads to lower germ cell counts in fetal gonads at E15.5, and that the effect continues in ovarian germ cells to newborn pups even after switching to a normal diet (Fig 5). This suggests that transient maternal ketogenic diet until mid‐gestation affects reproductive potential in newborn female pups. Because size of ovary was decreased with normal body weight of the pups in this condition, maternal ketogenic diet until E15.5 likely influences development of ovary as well as germ cells after E15.5. On the other hand, little effect of maternal ketogenic diet intake until E15.5 was observed on testicular germ cells in newborn pups (Fig 5). This suggests that influences of maternal ketogenic diet in PGC specification and fetal germ cell differentiation are rescued by the time of birth in male mice.
The influences of nutrition, including glucose depletion and ketone bodies and of OGT inhibition, on human PGCs will also be an important subject of future research. Human PGCLC culture models should facilitate such studies (Irie et al, 2015). Furthermore, future progress in multigenerational genomic cohort may also provide insights into the possible relationship between maternal carbohydrate and/or ketogenic nutritional status and the reproductive capacity of infants.
Materials and Methods
Cell culture
Murine EpiLC‐PGCLC induction was performed essentially as described previously (Hayashi et al, 2011). Briefly, mouse BVSC ESCs (Material Management Center #14M014) were adapted to chemically defined N2B27 medium supplemented with PD0325901, CHIR99021, and leukemia inhibitory factor (i.e., 2i/LIF medium) and grown under feeder‐free culture conditions. The EpiLCs were induced by plating ESCs in a well coated with human plasma fibronectin (Millipore) in N2B27 medium containing activin A (PeproTech), basic fibroblast growth factor (bFGF; Gibco), and KnockOut Serum Replacement (KSR; Gibco). The PGCLCs were induced under floating aggregation culture conditions by plating EpiLCs in the wells of low‐cell‐binding U‐bottom 96‐well plates (Nunc) in Glasgow Minimum Essential Medium (GMEM)‐based serum‐free medium in the presence of the cytokines (Cyto+) BMP4 (R&D), BMP8a (R&D), LIF (ESGRO; Chemicon), SCF (R&D), and EGF (R&D) or without cytokines (Cyto−). For glucose‐depleted cultures, Dulbecco's Modified Eagle Medium (DMEM) lacking glucose, glutamine, and phenol red (Gibco) was used instead of GMEM. Human embryonic kidney (HEK) 293T cells were cultured with DMEM (Gibco) supplemented with 10% fetal bovine serum (FBS). The drugs used in cultures are listed in Table EV1.
siRNA transfection
siRNAs were transfected into cells using Lipofectamine RNAiMAX (Thermo Fisher Scientific) according to the manufacturer's reverse transfection protocol. Briefly, Lipofectamine RNAiMAX (1.2 μl) and siRNA (28.8 pmol) were diluted with 60 μl of OptiMEM and incubated for 10 min. An aliquot of 3,000 BVSC EpiLCs in 300 μl of the PGCLC induction medium was added to each Lipofectamine/siRNA mixture and mixed briefly. The EpiLCs/siRNA mixtures were seeded into three wells (technical triplicates) of low‐cell‐binding U‐bottom 96‐well plates; cells were cultured in a conventional 5% CO2 incubator at 37°C. Two independent predesigned siRNAs for Ogt gene were purchased from QIAGEN (Mm_Ogt_3 FlexiTube siRNA‐SI00235172, and Mm_Ogt_5 FlexiTube siRNA‐ SI02676814). AllStars negative control siRNA (QIAGEN, Control siRNA‐SI03650318) were used as a negative control (for no change of Blimp1::Venus reporter fluorescence).
Mice
C57BL/6J (B6) and Multi Cross Hybrid (MCH) mice were purchased from Japan SLC, Inc. The B6.129‐Ogt tm1Gwh /J (Ogt‐flox) mouse was obtained from The Jackson Laboratory (Strain #004860) (Shafi et al, 2000; Ono et al, 2017). Epiblast‐specific Ogt‐KO mice were generated by crossbreeding Ogt‐flox mice with Sox2Cre mice (Hayashi et al, 2002). In the ketone diet experiment, female MCH mice were maintained on a ketogenic diet (Research Diets, Inc., No. D10070801) or normal diet (Research Diets, Inc., No. D10070802) for 1–2 weeks prior to mating. After mating with male B6 or MCH mice, the female mice were maintained on a ketogenic diet until euthanized and dissected at E6.5 – E7.5. The blood glucose and blood BHB levels of the pregnant mice were determined using tail‐derived blood (obtained at E0.5, E3.5, and E6.5) and a Freestyle Precision Neo Glucometer (Abbott). Mice were housed and bred in the Animal Unit of the Institute of Development, Aging, and Cancer (Tohoku University), an environmentally controlled and specific‐pathogen‐free facility. All of the animal experiments described in this study were performed under the ethical guidelines of Tohoku University, and the relevant animal protocols were reviewed and approved by the Tohoku University Animal Studies Committee (approval number: 2019AcA‐026‐01).
RT–qPCR analysis
Total RNA was extracted from cultured cells and purified using the RNeasy Micro Kit (QIAGEN) or the RNeasy Plus Mini Kit (QIAGEN). Total RNA was reverse transcribed using Superscript III (Thermo Fisher Scientific), and the cDNAs were used for quantitative PCR with the Power SYBR Green PCR Master Mix (Applied Biosystems). PCR signals were detected using a CFX Connect Real‐Time PCR Detection System (BioRad). The sequences of the PCR primers are listed in Table EV2.
RNA‐seq
RNA‐seq libraries were prepared from two biological replicates of each of PGCLC‐containing cell aggregates at day 2 after induction; each library was constructed using a TruSeq RNA Library Preparation Kit (Illumina), starting from 100 ng of total RNA. Libraries were sequenced on an Illumina HiSeq 2500 instrument. Reads were generated by 50‐bp single‐end sequencing. Sequenced reads then were trimmed using fastp software. For gene expression analysis, reads were mapped to the mouse genome (UCSC mm10 genome assembly and NCBI RefSeq database) using kallisto software with an estimated average fragment length of 50, followed by calculation of read counts and TPM (transcripts per million). The following public databases were used: BSgenome.Mmusculus.UCSC.mm10 (https://bioconductor.org/packages/release/data/annotation/html/BSgenome.Mmusculus.UCSC.mm10.html), TxDb.Mmusculus.UCSC.mm10.knownGene (https://bioconductor.org/packages/release/data/annotation/html/TxDb.Mmusculus.UCSC.mm10.knownGene.html). For analyses of differentially expressed genes (DEGs), only genes with a mean TPM exceeding 1 were analyzed. Functional enrichment analysis of DEGs was performed using the Metascape (https://metascape.org/gp/index.html#/main/step1) (Zhou et al, 2019). Calculation and drawing of Venn diagrams were performed on the website of Bioinformatics & Evolutionary Genomics (https://bioinformatics.psb.ugent.be/webtools/Venn/).
Immunohistochemistry
For immunohistochemical analysis, isolated PGCLC aggregates or embryos were fixed in 4% paraformaldehyde (PFA) in phosphate‐buffered saline (PBS) for 30 min, washed three times with PBS‐0.1% Triton‐X (PBT), permeabilized with PBS‐0.5% Triton‐X, incubated with 1 M glycine in PBT, and incubated overnight in blocking solution (PBT containing 1% bovine serum albumin and 3% donkey serum). Embryos then were incubated 3–4 overnight with primary antibodies diluted in the blocking solution; washed four times with PBT; incubated 3–4 overnight with secondary antibodies and 4,6‐diamidino‐2‐phenylindole (DAPI) diluted in blocking solution; washed three times with PBT; incubated in 10, 25, and 50% 2,2′‐thiodiethanol (Sigma‐Aldrich); and mounted on glass slides in 50% 2,2′‐thiodiethanol. The primary antibodies used were as follows: anti‐BLIMP1 (rat monoclonal; Santa Cruz sc‐47732), anti‐OGT (rabbit polyclonal; abcam ab96718), anti‐O‐GlcNAc (mouse monoclonal; abcam ab2739). The secondary antibodies used were as follows: AlexaFluor 488‐conjugated anti‐rat immunoglobulin G (IgG), AlexaFluor 568‐conjugated anti‐rabbit IgG, and AlexaFluor 647‐conjugated anti‐mouse IgG (Thermo Fisher Scientific). Immunofluorescence was imaged using a SP8 confocal microscope (Leica). The fluorescence intensity of each single cell was measured from two images of two optical sections with enough number of germ cells and somatic cells in each embryo and normalized with DAPI signal intensity of each cell using the histogram option of LAS X software (Leica), and the average intensity for somatic cells was then calculated. Relative signal intensity in germ cells was standardized by the average values of the fluorescence intensity of ~20 surrounding somatic cells in each section. The total estimated numbers of cells in each staining experiment were as follows: 40 cells for PGCLC‐containing aggregates, 22–102 cells in Ogt KO embryos, and 24–78 cells in the ketogenic diet embryos.
Immunostaining of gonadal sections was performed using gonads from MCH mice fixed with 4% paraformaldehyde for 3 h at 4°C and embedded with Optimum Cutting Temperature (O.C.T.) compound (Sakura Finetek 4583) as described previously (Hayashi et al, 2017). Briefly, the embedded samples were sectioned using a CM3050S cryomicrotome (Leica) to a thickness of 10 μm. The sections were permeabilized, blocked, incubated with primary antibody (anti‐VASA, goat polyclonal, R&D systems, AF2030) overnight at 4°C and then incubated with secondary antibodies with 5 μg/ml DAPI for 2 h at 4°C. The sections were washed after primary and secondary antibody treatments. Samples were mounted using Vectashield (Vector H‐1000) and observed under a TCS SP8 confocal laser scanning microscope (Leica). Germ cells were detected as VASA–positive cells with anti‐VASA antibody (goat polyclonal Novus Biologicals AF2030). Number of VASA‐positive germ cells in gonads was counted by making serial sections at 10 μm (for E15.5 testes, ovaries and newborn ovaries) or 20 μm (for newborn testes) intervals and summed up. Quantification of VASA‐positive cells was performed using Analyze particles tool of the ImageJ software.
Alkaline phosphatase (ALP) staining of embryos
ALP staining of E8.5 and E10.5 embryos was performed as described previously (Lawson et al, 1999). Embryos were dissected from the decidua and Reichert's membrane. The yolk sac was separated from the ectoplacental cone of embryos. Allantois and body parts with genital ridges were dissected and used for ALP staining for E8.5 (Theiler Stage (TS) 14) (Theiler, 2013) and E10.5 (TS18) embryos, respectively. These fragments were fixed in 4% paraformaldehyde in PBS for 2 h at 4°C, and washed three times in PBS. All fragments were treated with 70% ethanol for at least 1 h at 4°C. After washing three times with distilled water, they were stained with α‐naphthyl phosphate/fast red TR (Ginsburg et al, 1990) for 13 min at room temperature. They were then rinsed in water and cleared in 70% glycerol. The stained pieces were slightly flattened in 70% glycerol under a coverslip and the PGCs were identified and counted using a 20–40× objective lens in Leica DMRE microscope.
Plasmids
The pCS2‐EF‐Oga vectors and the pCS2‐EF‐mCherry reporter vector were prepared for overexpression and as a negative control, respectively. Plasmids encoding FLAG‐tagged mCherry or OGA, expressed under the control of an EF1a promoter, were generated as follows. The respective open reading frames (ORFs; mCherry, Oga) were amplified from mouse genomic DNA using gene‐specific primers. The primers were designed to include FLAG‐tag‐encoding sequences in‐frame at the upstream ends of the ORFs. The resulting amplicons then were subcloned (via flanking multi‐cloning sites) into the multiple cloning site of pCS2‐EF‐MCS (RIKEN BRC, http://cfm.brc.riken.jp/lentiviral‐vectors/plasmid‐list/) (Miyoshi et al, 1998). Sequences of the inserts were confirmed by DNA sequencing.
Lentiviral transfection
Lentiviral particles were produced by transfection into HEK293T cells with pCMV‐VSV‐G‐RSV‐Rev and pCAG‐HIVgp (RIKEN BRC, http://cfm.brc.riken.jp/lentiviral‐vectors/plasmid‐list/) (Miyoshi et al, 1998), as described previously. These lentiviral vectors were transduced into EpiLCs at multiplicities of infection of 4. These over‐expression (OE) EpiLCs were cultured for 2 days under PGCLC induction conditions. Following growth, OE cells were harvested and lysed for total RNA extraction; the resulting RNA then was subjected to RT–qPCR as described above. All lentiviral experiments were performed under the ethical guidelines of Tohoku University, and lentiviral protocols were reviewed and approved by the Tohoku University Center for Gene Research.
Quantification and statistical analysis
The statistical tests performed on the data are indicated in the figure legends along with sample size (n) indicating the number of biological replicates used. For RNA‐seq, two samples from each group were analyzed. For all other experiments, at least three samples from each group were analyzed. To determine the significance between two groups, comparisons were made using unpaired two‐tailed Student's t tests. One‐way analysis of variance (ANOVA) was used for statistical analysis of three or more groups. P values of < 0.05 were considered statistically significant. The following symbols are used throughout the figures to indicate statistical significance: *P < 0.05, **P < 0.01, ***P < 0.001, and ****P < 0.0001. All values are plotted as mean ± SEM.
Author contributions
Yohei Hayashi: Conceptualization; funding acquisition; investigation; visualization; methodology; writing – original draft; project administration. Yukiko Tando: Investigation; methodology. Yumi Ito‐Matsuoka: Investigation; methodology. Kaho Ikuta: Investigation. Asuka Takehara: Methodology. Katsutaro Morino: Resources; methodology. Hiroshi Maegawa: Supervision. Yasuhisa Matsui: Conceptualization; supervision; funding acquisition; validation; project administration; writing – review and editing.
Disclosure and competing interests statement
The authors declare that they have no conflict of interest.
Supporting information
Expanded View Figures PDF
Table EV1
Table EV2
Dataset EV1
Dataset EV2
Dataset EV3
Source Data for Expanded View
PDF+
Source Data for Figure 1
Source Data for Figure 2
Source Data for Figure 3
Source Data for Figure 4
Source Data for Figure 5
Acknowledgements
We thank Drs. Kentaro Mochizuki, Daiji Okamura, Jafar Sharif, and all members of Cell Resource Center for Biomedical Research for helpful discussions, and the Center of Research Instruments of Institute of Development, Aging and Cancer (IDAC), Tohoku University, for use of instruments and technical support. For part of this work, YH was supported by Grant‐in‐Aid for Scientific Research (KAKENHI) (C) (grant 22K06245), KAKENHI in the Innovative Areas, “Sex Spectrum” (grant 20H04917), “Ensuring integrity in gametogenesis” (grant 19H05238), “Program of totipotency” (grant 22H04662), and Grant‐in‐Aid for Transformative Research Areas (A) (grant 23H04950) from the Ministry of Education, Culture, Sports, Science and Technology of Japan (MEXT) and Japan Society for the Promotion of Science (JSPS), Takeda Science Foundation, Kato Memorial Bioscience Foundation, Mishima Kaiun Memorial Foundation, the Inamori Foundation, and Astellas Foundation for Research on Metabolic Disorders. YM was supported by KAKENHI (B) (grant 19H03231) from MEXT and JSPS and The Uehara Memorial Foundation.
EMBO reports (2023) 24: e56845
Contributor Information
Yohei Hayashi, Email: yohei.hayashi.e2@tohoku.ac.jp.
Yasuhisa Matsui, Email: yasuhisa.matsui.d3@tohoku.ac.jp.
Data availability
All RNA‐seq fastq files generated in this study have been uploaded to the Gene Expression Omnibus (GEO) under accession number GSE234794 (https://www.ncbi.nlm.nih.gov/geo/query/acc.cgi?acc=GSE234794).
References
- Aramaki S, Hayashi K, Kurimoto K, Ohta H, Yabuta Y, Iwanari H, Mochizuki Y, Hamakubo T, Kato Y, Shirahige K et al (2013) A mesodermal factor, T, specifies mouse germ cell fate by directly activating germline determinants. Dev Cell 27: 516–529 [DOI] [PubMed] [Google Scholar]
- Dąbek A, Wojtala M, Pirola L, Balcerczyk A (2020) Modulation of cellular biochemistry, epigenetics and metabolomics by ketone bodies. implications of the ketogenic diet in the physiology of the organism and pathological states. Nutrients 12: 788 [DOI] [PMC free article] [PubMed] [Google Scholar]
- DiTroia SP, Percharde M, Guerquin MJ, Wall E, Collignon E, Ebata KT, Mesh K, Mahesula S, Agathocleous M, Laird DJ et al (2019) Maternal vitamin C regulates reprogramming of DNA methylation and germline development. Nature 573: 271–275 [DOI] [PMC free article] [PubMed] [Google Scholar]
- Ginsburg M, Snow MH, McLaren A (1990) Primordial germ cells in the mouse embryo during gastrulation. Development 110: 521–528 [DOI] [PubMed] [Google Scholar]
- Hayashi Y, Matsui Y (2022) Metabolic control of germline formation and differentiation in mammal. Sex Dev 27: 1–16 [DOI] [PMC free article] [PubMed] [Google Scholar]
- Hayashi S, Lewis P, Pevny L, McMahon AP (2002) Efficient gene modulation in mouse epiblast using a Sox2Cre transgenic mouse strain. Mech Dev 119: S97–S101 [DOI] [PubMed] [Google Scholar]
- Hayashi K, Ohta H, Kurimoto K, Aramaki S, Saitou M (2011) Reconstitution of the mouse germ cell specification pathway in culture by pluripotent stem cells. Cell 146: 519–532 [DOI] [PubMed] [Google Scholar]
- Hayashi Y, Otsuka K, Ebina M, Igarashi K, Takehara A, Matsumoto M, Kanai A, Igarashi K, Soga T, Matsui Y (2017) Distinct requirements for energy metabolism in mouse primordial germ cells and their reprogramming to embryonic germ cells. Proc Natl Acad Sci U S A 114: 8289–8294 [DOI] [PMC free article] [PubMed] [Google Scholar]
- Hayashi Y, Mori M, Igarashi K, Tanaka K, Takehara A, Ito‐Matsuoka Y, Kanai A, Yaegashi N, Soga T, Matsui Y (2020) Proteomic and metabolomic analyses uncover sex‐specific regulatory pathways in mouse fetal germline differentiation. Biol Reprod 103: 717–735 [DOI] [PubMed] [Google Scholar]
- Irie N, Weinberger L, Tang WW, Kobayashi T, Viukov S, Manor YS, Dietmann S, Hanna JH, Surani MA (2015) SOX17 is a critical specifier of human primordial germ cell fate. Cell 160: 253–268 [DOI] [PMC free article] [PubMed] [Google Scholar]
- Kurimoto K, Yabuta Y, Hayashi K, Ohta H, Kiyonari H, Mitani T, Moritoki Y, Kohri K, Kimura H, Yamamoto T et al (2015) Quantitative dynamics of chromatin remodeling during germ cell specification from mouse embryonic stem cells. Cell Stem Cell 16: 517–532 [DOI] [PubMed] [Google Scholar]
- Lawson KA, Dunn NR, Roelen BA, Zeinstra LM, Davis AM, Wright CV, Korving JP, Hogan BL (1999) Bmp4 is required for the generation of primordial germ cells in the mouse embryo. Genes Dev 13: 424–436 [DOI] [PMC free article] [PubMed] [Google Scholar]
- Lee Chong T, Ahearn EL, Cimmino L (2019) Reprogramming the epigenome with vitamin C. Front Cell Dev Biol 7: 128 [DOI] [PMC free article] [PubMed] [Google Scholar]
- Li Z, Fang F, Zhao Q, Li H, Xiong C (2019) Supplementation of vitamin C promotes early germ cell specification from human embryonic stem cells. Stem Cell Res Ther 10: 324 [DOI] [PMC free article] [PubMed] [Google Scholar]
- Liu B, Salgado OC, Singh S, Hippen KL, Maynard JC, Burlingame AL, Ball LE, Blazar BR, Farrar MA, Hogquist KA et al (2019) The lineage stability and suppressive program of regulatory T cells require protein O‐GlcNAcylation. Nat Commun 10: 354 [DOI] [PMC free article] [PubMed] [Google Scholar]
- Matsui Y, Hayashi Y (2022) Metabolic pathways regulating the development and non‐genomic heritable traits of germ cells. J Reprod Dev 68: 96–103 [DOI] [PMC free article] [PubMed] [Google Scholar]
- Miyoshi H, Blömer U, Takahashi M, Gage FH, Verma IM (1998) Development of a self‐inactivating lentivirus vector. J Virol 72: 8150–8157 [DOI] [PMC free article] [PubMed] [Google Scholar]
- Mochizuki K, Hayashi Y, Sekinaka T, Otsuka K, Ito‐Matsuoka Y, Kobayashi H, Oki S, Takehara A, Kono T, Osumi N et al (2018a) Repression of somatic genes by selective recruitment of HDAC3 by BLIMP1 is essential for mouse primordial germ cell fate determination. Cell Rep 24: 2682–2693 [DOI] [PubMed] [Google Scholar]
- Mochizuki K, Tando Y, Sekinaka T, Otsuka K, Hayashi Y, Kobayashi H, Kamio A, Ito‐Matsuoka Y, Takehara A, Kono T et al (2018b) SETDB1 is essential for mouse primordial germ cell fate determination by ensuring BMP signaling. Development 145: dev164160 [DOI] [PubMed] [Google Scholar]
- Nassan FL, Chavarro JE, Tanrikut C (2018) Diet and men's fertility: does diet affect sperm quality? Fertil Steril 110: 570–577 [DOI] [PubMed] [Google Scholar]
- Newell C, Johnsen VL, Yee NC, Xu WJ, Klein MS, Khan A, Rho JM, Shearer J (2017) Ketogenic diet leads to O‐GlcNAc modification in the BTBRT+tf/j mouse model of autism. Biochim Biophys Acta Mol Basis Dis 1863: 2274–2281 [DOI] [PubMed] [Google Scholar]
- Ohinata Y, Ohta H, Shigeta M, Yamanaka K, Wakayama T, Saitou M (2009) A signaling principle for the specification of the germ cell lineage in mice. Cell 137: 571–584 [DOI] [PubMed] [Google Scholar]
- Ong Q, Han W, Yang X (2018) O‐GlcNAc as an Integrator of Signaling Pathways. Front Endocrinol (Lausanne) 9: 599 [DOI] [PMC free article] [PubMed] [Google Scholar]
- Ono S, Kume S, Yasuda‐Yamahara M, Yamahara K, Takeda N, Chin‐Kanasaki M, Araki H, Sekine O, Yokoi H, Mukoyama M et al (2017) O‐linked β‐N‐acetylglucosamine modification of proteins is essential for foot process maturation and survival in podocytes. Nephrol Dial Transplant 32: 1477–1487 [DOI] [PubMed] [Google Scholar]
- Paoli A (2014) Ketogenic diet for obesity: friend or foe? Int J Environ Res Public Health 11: 2092–2107 [DOI] [PMC free article] [PubMed] [Google Scholar]
- Saitou M, Yamaji M (2012) Primordial germ cells in mice. Cold Spring Harb Perspect Biol 4: a008375 [DOI] [PMC free article] [PubMed] [Google Scholar]
- Seisenberger S, Andrews S, Krueger F, Arand J, Walter J, Santos F, Popp C, Thienpont B, Dean W, Reik W (2012) The dynamics of genome‐wide DNA methylation reprogramming in mouse primordial germ cells. Mol Cell 48: 849–862 [DOI] [PMC free article] [PubMed] [Google Scholar]
- Seki Y, Hayashi K, Itoh K, Mizugaki M, Saitou M, Matsui Y (2005) Extensive and orderly reprogramming of genome‐wide chromatin modifications associated with specification and early development of germ cells in mice. Dev Biol 278: 440–458 [DOI] [PubMed] [Google Scholar]
- Shafi R, Iyer SP, Ellies LG, O'Donnell N, Marek KW, Chui D, Hart GW, Marth JD (2000) The O‐GlcNAc transferase gene resides on the X chromosome and is essential for embryonic stem cell viability and mouse ontogeny. Proc Natl Acad Sci U S A 97: 5735–5739 [DOI] [PMC free article] [PubMed] [Google Scholar]
- Tanaka K, Hayashi Y, Takehara A, Ito‐Matsuoka Y, Tachibana M, Yaegashi N, Matsui Y (2021) Abnormal early folliculogenesis due to impeded pyruvate metabolism in mouse oocytes. Biol Reprod 105: 64–75 [DOI] [PubMed] [Google Scholar]
- Theiler K (2013) The house mouse: atlas of embryonic development. Cham: Springer Science & Business Media; [Google Scholar]
- Tischler J, Gruhn WH, Reid J, Allgeyer E, Buettner F, Marr C, Theis F, Simons BD, Wernisch L, Surani MA (2019) Metabolic regulation of pluripotency and germ cell fate through α‐ketoglutarate. EMBO J 38: e99518 [DOI] [PMC free article] [PubMed] [Google Scholar]
- Verdikt R, Allard P (2021) Metabolo‐epigenetics: the interplay of metabolism and epigenetics during early germ cells development. Biol Reprod 105: 616–624 [DOI] [PMC free article] [PubMed] [Google Scholar]
- Wells L, Vosseller K, Hart GW (2001) Glycosylation of nucleocytoplasmic proteins: signal transduction and O‐GlcNAc. Science 291: 2376–2378 [DOI] [PubMed] [Google Scholar]
- Xie Z, Zhang D, Chung D, Tang Z, Huang H, Dai L, Qi S, Li J, Colak G, Chen Y et al (2016) Metabolic regulation of gene expression by histone lysine β‐hydroxybutyrylation. Mol Cell 62: 194–206 [DOI] [PMC free article] [PubMed] [Google Scholar]
- Zhang H, Tang K, Ma J, Zhou L, Liu J, Zeng L, Zhu L, Xu P, Chen J, Wei K et al (2020) Ketogenesis‐generated β‐hydroxybutyrate is an epigenetic regulator of CD8+ T‐cell memory development. Nat Cell Biol 22: 18–25 [DOI] [PubMed] [Google Scholar]
- Zhou Y, Zhou B, Pache L, Chang M, Khodabakhshi AH, Tanaseichuk O, Benner C, Chanda SK (2019) Metascape provides a biologist‐oriented resource for the analysis of systems‐level datasets. Nat Commun 10: 1523 [DOI] [PMC free article] [PubMed] [Google Scholar]
- Zuliani I, Lanzillotta C, Tramutola A, Barone E, Perluigi M, Rinaldo S, Paone A, Cutruzzolà F, Bellanti F, Spinelli M et al (2021) High‐fat diet leads to reduced protein O‐GlcNAcylation and mitochondrial defects promoting the development of Alzheimer's disease signatures. Int J Mol Sci 22: 3746 [DOI] [PMC free article] [PubMed] [Google Scholar]


