

Abstract
Omics technologies have rapidly evolved with the unprecedented potential to shape precision medicine. Novel omics approaches that allow rapid and accurate data collection, and integration with clinical information are imperative to enable a new era of healthcare. In this comprehensive review, we highlight the utility of Raman spectroscopy (RS) as an emerging omics technology for clinically-relevant applications using clinically significant samples and models. We discuss the use of RS both as a label-free approach for probing the intrinsic metabolites of biological materials, and as a labeled-approach where signal from Raman reporters conjugated to nanoparticles serve as an indirect measure for tracking protein biomarkers in vivo and for high throughout proteomics. We summarize the use of machine learning algorithms for processing RS data to allow accurate detection and evaluation of treatment response specifically focusing on cancer, cardiac, gastrointestinal, and neurodegenerative diseases. We also highlight the integration of RS with established omics approaches for holistic diagnostic information. Further, we elaborate on metal-free NPs that leverage the biological Raman-silent region overcoming the challenges of traditional metal NPs. We conclude the review with an outlook on future directions that will ultimately allow the adaptation of RS as a clinical approach and revolutionize precision medicine.
Graphical Abstract
1. Introduction
Precision medicine or personalized medicine, refers to treatment approaches tailored to individual patients or subgroups of patients, based on the molecular understanding of each patient’s disease phenotype.1–4 While precision medicine customizes healthcare specific to each patient, the decision-making is leveraged from multi-omics data retrieved from a larger population of patients.5 In this effort, in 2015, the National Institutes of Health, USA (NIH) formed the Precision Medicine Initiative working group All of Us Research Program, intending to shift away from the traditional “one size fits all” healthcare approach to the emerging era of individualized care.6 In 2016, the White House supported this historic effort to engage and retain one million United States residents in a ten-year study to collect their broad-spectrum health information and biospecimens for multi-omics analysis. Omics approaches involve the generation of large biological datasets in a high-throughput manner involving genome, proteome, metabolome, epigenome, transcriptome, and exposome among others. Multi-omics knowledge is therefore critical to achieving precision medicine and accounting for individual variability and population characteristics.7, 8 Indeed, the phenotypic outcome of most human diseases emerges from a complex interplay of genetic predisposition, age, diet, lifestyle, environmental exposure, and gut microbiome that directly impacts the genome, metabolome, and proteome.9 The global human metabolic network has already shown that dysregulated metabolites are linked to respective gene expression, which manifests as alterations in protein signaling pathways; these proteins are then identified as biomarkers of the disease phenotype.10 Further, phenotyping with multi-omics technologies generate a massive scale of data, including metabolic data, biomarker data, general physiology data, radiology data, and biometric data obtained from wearable, implantable, and at-home monitoring devices. Traditional data analysis methodologies then fail to process such “big data” while accounting for diversity in the patient population, including age, gender, race, ethnicity, socioeconomic status, etc.11 Therefore, to envision a future where precision medicine entirely drives a new era of healthcare, two critical unmet needs must be addressed: (1) innovative technologies that enable a rapid, accurate, highly sensitive, and high-throughput measure of omics data, and (2) development of advanced machine learning (ML) algorithms for sorting and deconvolution of individual data, and for integrating and harmonizing the collective omics and patient data.12, 13
In this comprehensive review we discuss the emerging role of Raman spectroscopy (RS) with the combination of ML algorithms as a novel omics technology to address this critical need in precision medicine. We highlight the use of RS, a vibrational spectroscopic technique, in metabolic profiling and protein biomarker detection from cellular level to in vivo in patients. RS, which was first described by C. V. Raman and K. S. Krishnan (C.V. Raman won the Nobel Prize in 1928), optically probes the molecular changes in materials that emerge from the inelastic scattering of incident photons.14 If the scattered photons have a lower frequency than the incident light, this is known as Stokes-Raman scattering that arise from a change in the vibrational state of the sample. RS measurement is governed by multiple components, including the type of incident light sources, the type of probes used, such as handheld or benchtop, the type of sample and substrates used for signal enhancement, and the spectrometers/detectors used for data collection (Figure 1a). RS's relevant instrumentational design parameters vary significantly based on the specific biomedical application, whether the Raman signal is measured ex vivo in cells, tissues and biofluids, or directly in vivo in living subjects. This review will primarily focus on the utility of spontaneous Raman scattering, stimulated Raman scattering (SRS), coherent anti-Stokes Raman scattering (CARS), spatially offset Raman scattering (SORS), and surface-enhanced Raman scattering (SERS). We will briefly define these techniques in relevance to their use as an Omics approach, but readers are encouraged to refer to more in-depth reviews that cover the fundamentals of these RS methods.15–19
Figure 1.
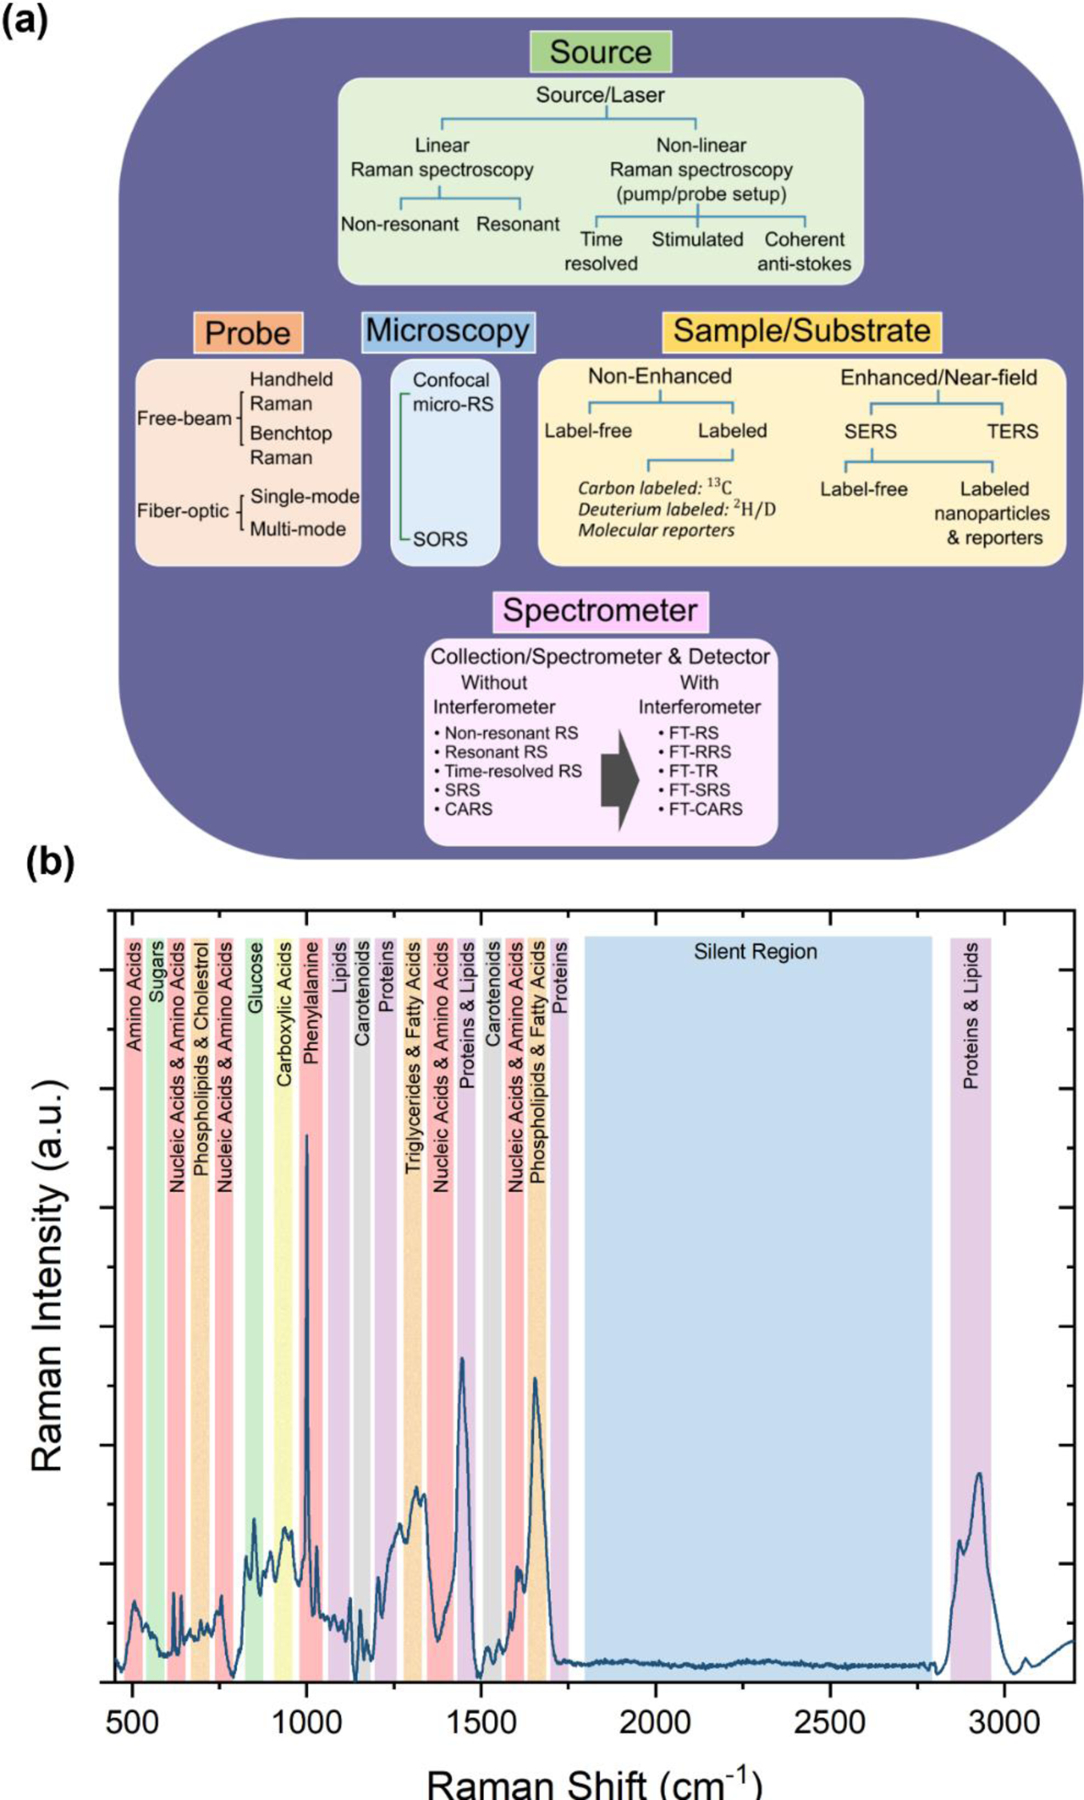
(a) Overview of Raman spectroscopy (RS) includes types of laser sources and probes used for data collection, microscopy methods, samples and substrates used for enhanced or non-enhanced RS, and spectrometers/detectors. SORS: Spatially offset Raman spectroscopy; SERS: Surface-enhanced Raman spectroscopy; TERS: Tip-enhanced Raman spectroscopy; CARS: Coherent anti-Stokes Raman spectroscopy; SRS: Stimulated Raman spectroscopy. FT: Fourier transform. (b) Raman spectra of human serum from a healthy donor highlighting the peak assignment for various metabolic groups, and the Raman silent-region that has been leveraged for bioanalyte detection without overlap with endogenous biomolecules.
Conventional, or what is commonly (and redundantly) referred to as “spontaneous” RS is the most prevalent Raman spectral technique given its straightforward use with commercially available instruments. In conventional RS, the scattering intensity of the molecules probes has a linear relationship with laser intensity. For biological applications, background autofluorescence from endogenous fluorophores such as collagen, elastin, nicotinamide adenine dinucleotide (NAD), and flavin adenine dinucleotide (FAD) among others poses a major challenge.20 While many of the laser wavelengths used in Raman measurements including 532 nm and 633 nm do lead to the fluorescence of these key biological fluorophores, this fluorescence background can be overcome to some degree with the use of near-infrared lasers such as 785 nm and 1064 nm. Although for biofluids (serum, nasal swabs, urine, fecal matter) from human, mice, and other species additional measures such as signal enhancement or data processing to remove background fluorescence are necessary. Therefore, conventional RS is often considered slow due to the limited Raman scattering cross section of molecules and the consequent long acquisition times necessary to generate high signal-to-noise ratio (SNR) data. Typically signal enhancement approaches such as SERS, as discussed below, are necessary to improve SNR and enable in vivo applications. In contrast to conventional RS where linear light sources are used, CARS and SRS are coherent and non-linear light scattering processes where multiple incident photons simultaneously interact with the analyte molecule. The interaction leads to coherent vibration, locking in the phase of molecular vibration based on the frequency difference of the two incident beams.17 This coherently driven scattering gives rise to much stronger SNR relative to spontaneous RS at significantly shorter acquisition time, allowing quality data to be collected in microseconds instead of seconds.21 In SRS two lasers, a pump laser and a Stokes laser, are used. When the frequency difference between the lasers matches the molecular vibration, stimulated Raman scattering occurs and photons are transferred from the pump beam to the Stokes beam. This change in intensity constitutes an SRS signal.22, 23 SRS spectra can then be constructed by the variation of narrowband Stokes laser wavelengths or the use of a broadband pulse. Signal enhancement strategies are not necessary for SRS and this approach enables time-resolved vibrational spectra of cells and tissues at the sub-cellular level in single cells.24, 25 Like SRS, CARS is also based on nonlinear light-scattering (see Fig. 1a) that leverages coherent amplification from the molecular oscillators resulting in high SNR using a third laser pulse that probes the oscillation produced by the pump and Stokes beams. CARS can generate high-fidelity images with short acquisition times.17 Further, since CARS takes advantage of the anti-Stokes wave, the signal appears shorter than the laser wavelength. This process spectrally separates the Raman signal from the fluorescence background minimizing any interference from the background.18 While both SRS and CARS are desirable for faster acquisition and high SNR, they can only probe a few vibrational modes at a time determined by the frequencies of the pump and Stokes beams which limits multiplexing abilities. Broadband CARS, which uses a broadband Stokes laser to capture a wider frequency spectrum, has seen some use in probing biological samples.26–28 Further exploration of this technique in biomedical application could improve the flexibility of coherently driven RS clinical applications. Further, the instrumentation for these nonlinear processes can be complex and costly, and applications have been limited to in vitro and ex vivo. SORS is a unique configuration where the combination of spatial offset with Raman scattering allows depth sensitivity during measurements, expanding RS's capability to collect signals from underlying layers of the tissue.16 At zero spatial offset, the spectral data is contributed from both the superficial and underlying layers, but as the spatial offset increases, the intensity of the Raman signal is dominated by the deeper layers. SORS has the potential to significantly advance in vivo protein and metabolite detection allowing deep tissue imaging and treatment response, yet only some researchers have adopted this approach due to the limited availability of commercial instrumentation and difficulty in building custom home-built setups. A few studies have applied commercial handheld SORS devices to the analysis of biological samples and SERS NPs.29, 30 Whereas it is exciting to see this development, the sensitivity of these commercial SORS microscopy products is not comparable to the home-built setups in terms of SNR, and would be key in furthering the potential of this methodology for biological and clinical samples.
The SERS effect, discovered in the late 1970’s, has propelled spontaneous RS as an Omics approach for clinically significant in vivo molecular imaging and ex vivo detection of metabolites and protein biomarkers.31–34 SERS leverages metal nanoparticles (NPs) mediated Raman scattering enhancement of molecules near the NP surface. When metal NPs interact with incident resonant light, this leads to electron delocalization and oscillation of the conduction electrons, known as localized surface plasmon resonances (SPR).19 These plasmon resonances give rise to intense electromagnetic fields near the metal surface with intensities several orders of magnitude higher than the incidence field. The electromagnetic fields can significantly enhance the Raman signal of proximal molecules. In addition to electromagnetic enhancement, direct chemical adsorption of Raman-active molecules on the NP enhances the Raman signal based on dynamic charge transfer. Photoexcitation of the NP and subsequent decay of the SPR wave through various mechanisms gives rise to “hot” or highly energetic carriers in the metal referred to as “hot electron-hole pair”.35, 36 The hot electron can then transfer to the lowest unoccupied molecular orbital of a proximal molecule. The subsequent electron return to the metal alters the molecule's internal molecular vibrations, resulting in the chemical enhancement of SERS. Collectively, both enhancement mechanisms contribute to Raman signal amplification.
Through these RS techniques, Raman spectral characteristics can be obtained either label-free i.e., the intrinsic Raman scattering of biological materials is directly probed, or labeled i.e., a Raman reporter is conjugated to NPs or other surfaces, and the signal of the reporter serves as an indirect measure of relevant proteins. Label-free RS is rising as an optical omics approach where the biochemical profile of biological molecules corresponds to various metabolites (Fig. 1b) including amino acids, phospholipids, sugars, steroids, fatty acids and lipids, carboxylates etc. These metabolites ultimately correspond to the foundational metabolic pathways including glycolysis, lipogenesis, fatty acid synthesis, and tricarboxylic acid (TCA) cycle among others. Whereas discussion of each these metabolic pathways is beyond the scope of this review, readers are encouraged to read these informative reviews on metabolism.37, 38 Activation and deactivation of these metabolic pathways differ for each disease type and are highlighted within each topic discussed in this review. Both spontaneous RS and SRS/CARS have been employed to measure these metabolites with each approach presenting both merits and challenges. The ability of spontaneous RS to capture a range of molecular vibrational modes simultaneously has allowed multiplexed detection of multiple metabolites simultaneously. Alterations in the metabolome and the associated metabolic pathways are then inferred from the change of different Raman bands. Raman spectral data is then combined with ML algorithms and multivariate analysis to enable accurate diagnostics of disease progression and discrimination between disease subtypes. By probing these metabolites, RS has characterized tissue,39–47 cells,48–60 and biofluids61, 62 including tears,63–71 urine,72 saliva,73–76 serum,77–81 and plasma.82–84 However, a limitation of spontaneous RS is the time required for a reasonable SNR, which limits both the ability for subcellular imaging and to monitor processes in real time. Both of these characteristics are necessary to understand the mechanistic pathway of metabolic changes. As mentioned above, SRS and CARS address this challenge with a strong SNR permitting faster measurements with minimal autofluorescence necessary for high resolution sub-cellular metabolite measurements.85, 86
In this review article, we have highlighted impactful findings in the past ten years in the utility of RS for biomedical applications, both as a label-free approach for metabolic profiling (as shown in Fig. 1b) and as a labeled approach for protein biomarker detection. We summarize literature findings where the role of RS as an emerging omics approach has been highlighted both for directly measuring large number of metabolites as well as indirectly measuring proteins via Raman reporters in a similar manner as the current established omics approaches 25, 87, 88 We have primarily discussed clinically relevant and patient-oriented research and captured work where patient biospecimens were probed, or a clinical technique was combined with RS, or an assay was used with strong clinical significance. Through this comprehensive review, our goal is to include a broad range of topics that is easy to follow to enable cross-cutting discussions between experts and non-experts in RS. Further, we also aim to encourage researchers in clinical sciences to appreciate RS as a valuable technique for clinical applications enabling precision medicine in near future. The review is divided into multiple sections. Section 2 provides a brief overview of ML algorithms and multivariate analysis methods to introduce readers to these topics and highlight the relevance of these methods specific to the literature examples we have covered in the review. This is followed by the discussion of label-free RS for profiling metabolites ex vivo in various diseases, including cancer (section 3.1), cardiac, gastrointestinal, and neurodegenerative disorders (section 3.2), the direct measure of metabolites in vivo (section 3.3), and integration of RS with established omics techniques including metabolomics and transcriptomics (section 3.4). We summarize the utility of labeled SERS with NPs as a rapidly emerging clinically-relevant approach for biomarker detection and treatment response in vivo (section 4.1) and the integration of SERS with clinical imaging techniques for comprehensive molecular diagnostics (section 4.2). We also discuss the role of labeled SERS as a high throughput approach for ex vivo proteomics (section 4.3). Many examples discussed in sections 3 and 4 focus on the Raman fingerprint region (400 – 1700 cm−1) where the intrinsic Raman peaks of cells, tissues, and biofluids are prevalent, and small molecule Raman reporters also have peaks. Therefore, in section 5, we also highlight a new era of metal-free NPs that leverages Raman reporters in the biological Raman-silent region (1740–2800 cm−1, see Fig. 1b) for high SNR, and surpassing the limitations of traditional metal NPs. We conclude the review with an outlook on future directions in how RS can advance the existing in vivo and in vitro methods, how to address challenges that have limited the adaptation of RS as a clinical omics approach, and expansion of RS in unconventional applications such as Raman based holographic imaging to enable innovative directions that will revolutionize precision medicine. We hope that the collection of these topics within a single comprehensive review will enable researchers new to this field to learn about the versatility of RS in multiple biomedical and biosensing applications. Readers are also encouraged to read more focused reviews on SERS, SORS, Raman instrumentation, and machine learning in RS if interested in these specific topics.15, 16, 19, 89, 90
2. Multivariate Analysis and Machine Learning Approaches used in Raman Spectroscopy
Raman spectral characteristics of biomolecules are highly complex, with multiple spectral peaks that pose a significant challenge to extracting accurate and meaningful information. In the past decade, multivariate analysis and ML methodologies have been leveraged to analyze these spectral datasets. ML techniques can be categorized into unsupervised algorithms, which can identify any differentiation of data within a dataset, and supervised algorithms where the assigned class label of the data is taken into consideration (Fig. 2). Unsupervised methods include principal component analysis (PCA), t-distributed stochastic neighbor embedding (t-SNE), and K-means clustering.89 These methods have been extensively used to (i) simplify high-dimension data obtained with RS and visualize with only a few dimensions (i.e., principal components), and (ii) to highlight the natural clustering of data points in a multi-dimensional space and reduce dimensionality data can be fit to regression to enable classification and quantification. Supervised methods use the information of pre-labeled data to identify distinguishing features between different classes or to match features of a complex spectrum with known references. Traditional supervised models include partial least squares (PLS), support vector machines (SVM), k-nearest neighbor algorithms (KNN), and decision tree-based models like random forest (RF) and classification and regression trees (CRT).91 Deep learning approaches differ from traditional approaches via the implementation of artificial neural networks that use complex architectures of artificial neurons enabling advanced feature and pattern recognition.13 While supervised methods are useful for improving discrimination between groups, care must be taken to avoid overfitting the model to the training data set. When a model overfits it can effectively memorize the outputs corresponding to the training data and thus loss applicability to new data.89 Ideally, ML models should be evaluated using a hitherto unseen test to ensure that the model is both accurate and robust. In omics studies where sample sizes are insufficient for a substantial test set, cross-validation can allow for an estimation of model performance by leaving out a validation set during training and using multiple permutations of training and validation sets. 92, 93Even with cross-validation, care must be taken to not overestimate performance via errors in feature selection or models that have a complexity disproportionate to the sample size.94
Figure 2.
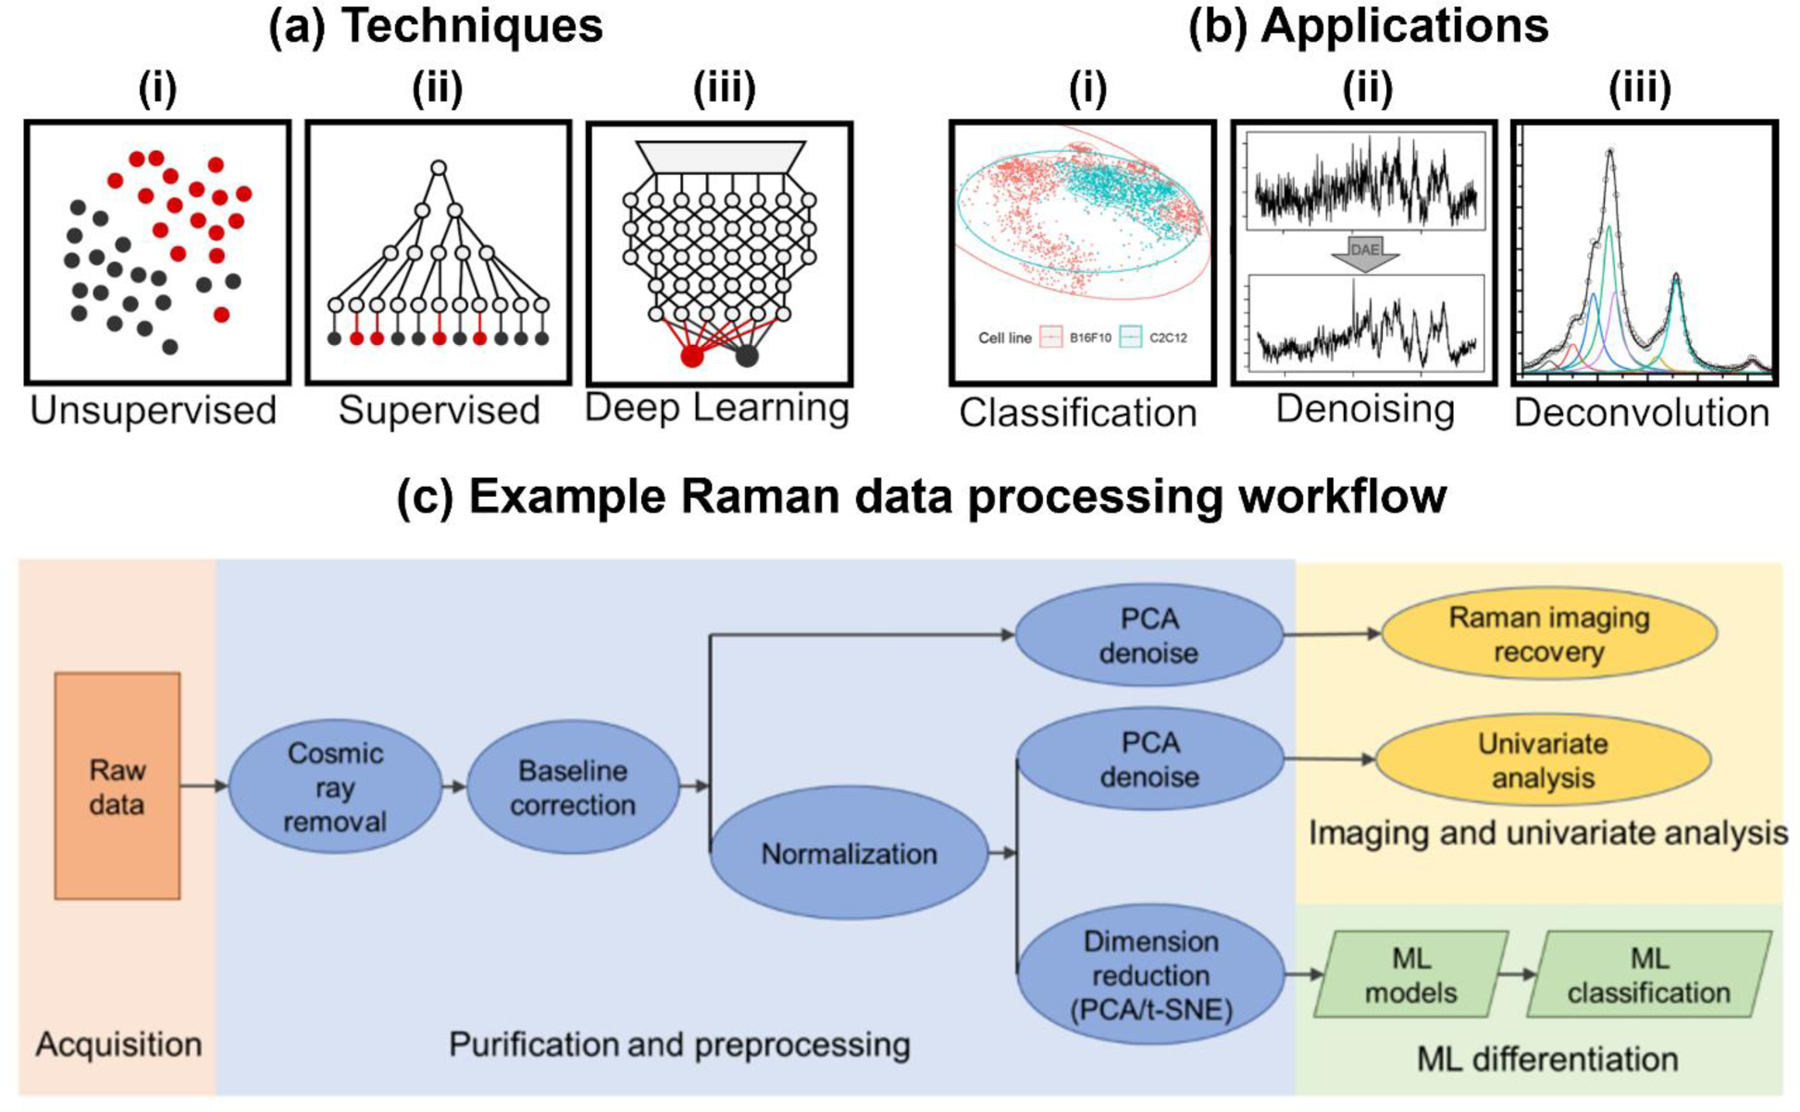
(a) Different approaches for multivariate analysis and machine learning algorithms that can be divided into (i) unsupervised methods, (ii) traditional and (iii) deep learning supervised methods. (b) All three of these methods can be applied to (i) data classification; example shown is t-SNE classification of cancer cells. Adapted from ref 96. Copyright 2022 MDPI under CC BY 4.0 license (https://creativecommons.org/licenses/by/4.0/). (ii) spectral denoising; example shown is denoising of bacterial spectra signals using a deep-learning autoencoder. Adapted with permission from ref 100. Copyright 2022 American Chemical Society. And (iii) spectral deconvolution; example shown is the deconvolution of nanotag signals using MCR. Adapted with permission from ref 102. Copyright 2021 American Chemical Society. (c) An example data processing workflow shows how raw Raman spectral data is processed and further denoising, dimension reduction, and classification is used. Adapted from ref 96. Copyright 2022 MDPI under CC BY 4.0 license (https://creativecommons.org/licenses/by/4.0/).
Each ML model has its merits and limitations; therefore a wide array of models have been leveraged to improve accuracy of RS data for different biological applications.89 For example, data classification tasks for biological samples can make use of ML models to distinguish diseased and healthy specimens or classify treated and untreated groups. As changes in multiple RS features can characterize these differences, simple linear regressions are limited in successfully classifying the data. Unsupervised ML approaches such as PCA have been the most prevalent in the literature to reduce the dimensionality of RS data and enable simplified analysis via discriminant algorithms such as linear discriminant analysis (LDA) and quadratic discriminant analysis (QDA) among others.91 While they are less likely to overfit the data, unsupervised methods describe overall variations between samples instead of specific variations between classes, and thus can be limited in their ability to distinguish between groups accurately. These limitations have been addressed by supervised ML approaches that include traditional methods (PLS-DA, SVM, RF) as well as deep learning methodologies.95 For example, in a comprehensive approach He et al. applied ten different supervised learning models for discriminating between cancerous and healthy model cell lines.96 They achieved the highest accuracy of 94.2% with a neural network model, although traditional methods such as QDA and SVM-radial basis function also achieved high classification accuracy of 93.2% and 92.9%, respectively. However, the RS features that determined these classification decisions were not well defined in neural network-based models, which can limit feature discovery. In examples that will be discussed in greater detail in Section 3.1 Milligan et al. and Paidi et al. both used RF to classify cancer treatment response for radiation treatment 97 and immunotherapy 98 respectively. These approaches were highly accurate, giving Milligan et al. a 99.8% accuracy rate and Paidi et al. a 2% error rate. With this traditional ML model, they were able to identify spectral biomarkers that were the most significant to enable this classification.
In addition to classification, ML approaches are excellent for denoising RS data. In such denoising applications, ML is leveraged to improve the SNR of spectra to enable the use of RS in samples with an inherent high background such as biological tissues. Denoising of data can enable a reduction in the laser exposure time required to achieve a high-quality spectrum and can thereby minimize sample destruction from high laser power.99 In ML-based denoising, an appropriate ML technique is used to reconstruct a higher quality spectrum from the collected Raman data to enable accurate classification of groups and quantification of data. This can be accomplished through PCA by identifying the key principal components and discarding extraneous components that consist of noise, or through supervised ML methods by training an appropriate model.96 For example, Xu et al. trained a deep learning autoencoder (DAE) with pairs of low-acquisition time and high-acquisition time spectrum which allowed them to remove the noise in rapid scans and accurately classify their data.100 In another work, He. et al utilized a variational autoencoder (VAE) to enhance tumor subtype classification that facilitated simultaneous clustering and denoising via encoding the high-dimension Raman data into 2D latent space.101 These denoising approaches are useful for enhancing the speed and accuracy of Raman imaging while enabling low laser light exposure, an ideal for preventing photodamage in biological samples.
ML approaches in RS also involve deconvolution or decomposition to clearly separate multiple overlapping spectra. If the spectral characteristics and peak identities of a specific biospecies is known, the regression identifies the biospecies, removes noise such as fluorescence background, and reduces signal from contaminants like embedding materials.102 Regression can be accomplished via direct classical least squares (DCLS) that treat a signal as a weighted composition of known reference spectra.103 This approach is highly applicable for decomposing spectral features with known components, such as distinguishing SERS molecular probes in multiplexed molecular imaging applications. More advanced methods are necessary to account for background and spectral shifts for deconvoluting signals in complex media such as biological tissues. Multivariate analysis, such as PCA, PLS,104 and multivariate curve resolution (MCR) 105, 106 are ideal for deconvoluting spectra without the necessity of a precise reference spectrum. First described in 1971, MCR algorithms seek to solve this additive mixing problem through a linear decomposition of the continuous spectral peak.107, 108 In a work by Samuel et al., the authors imaged P. chrysogenum and used multivariate curve resolution-alternating least squares (MCR-ALS) to decompose these Raman signals.100 MCR-ALS uses an alternating least squares solution to decompose the data matrix (the Raman signal) and solve for the concentration and spectral profiles matrices under set constraints.109, 110 They were able to detect penicillin G within fungal cells, overcoming the high degree of overlap with various other biomolecules.111 Their use of MCR-ALS separated the Raman signal into multiple components, including penicillin, polysaccharides, lipids, proteins, and the glass background, thereby identifying the species of interest. Deep learning networks are also highly applicable for spectral deconvolution. For example, Chen et al. trained a residual neural network model to decode 15 SERS probes with overlapping peaks.112 They achieved 100% accuracy when validated against 5 datasets surpassing the metrics of traditional ML methods (up to 95.7% accuracy with k-nearest neighbor) and other convolutional neural network architectures (up to 99.7% accuracy). These examples demonstrate that appropriate ML approaches are essential for classification, denoising, and deconvolution of RS data, which is specifically important when RS is probed in complex media such as serum or other biofluids. Further, if RS data in patient samples is combined with matched clinical information, a robust ML approach would be required to ultimately facilitate a generalizable validation approach that can be extended to several in vitro and in vivo applications.
3. Label-free Raman Spectroscopy for Metabolic Profiling
In this section we will discuss the utility of label-free RS for understanding changes in various metabolites resulting either from disease progression or from treatment response. We will specifically focus on recent progress in metabolic profiling in cancer, gastrointestinal (GI) diseases, cardiac disorders, and neurodegenerative diseases, as well as the use of label-free RS directly in vivo to probe metabolic changes in real time. This section also builds upon the previous section on the use of ML approaches with RS data for data classification and feature discovery. We conclude the section with the integration of RS with emerging Omics techniques enabling a powerful multimodal platform that provides a comprehensive milieu of the disease landscape.
3.1. Metabolism in Cancer
The most comprehensive use of label-free RS has been realized in cancer diagnosis and differentiation between cell types to characterize different metabolites.46, 48, 51, 54, 55, 60, 78, 113–118 Cancer cells are known to dynamically reprogram their metabolic processes to proliferate and migrate. Cancer cells metabolize copious amounts of glucose and convert to lactate via aerobic glycolysis through the well-established Warburg effect (Fig. 3a).119, 120 In addition to glycolysis, the TCA cycle and other anabolic pathways also plays a role in cancer cell proliferation where amino acids and other nutrients contribute towards energy metabolism, protein synthesis, lipogenesis etc.121, 122 Therefore, the biochemical signature obtained with label-free RS has served as a robust approach in understanding metabolic transformation in cancer.21, 52 RS is also a viable alternative to colorimetric and fluorescence assays such as ELISA (Enzyme Linked Immunosorbent Assay) and FISH (Fluorescence In Situ Hybridization) that often have slow readout, have time- and labor-intensive procedures, and are typically specific to a single marker i.e., multiplexing requires multiple kits adding to high costs.123–126 In a work by Duan et al. the authors applied label-free SERS combined with PCA and CRT to differentiate between acute (177 myeloid leukemia and healthy patient sera samples.78 The healthy and leukemia classes were easily distinguished with PCA but partial cluster overlap was observed among the different subtypes of leukemia. Nucleic acids were the main contributor that discriminated the two sample cohorts, but changes were also observed in other significant metabolites including amino acids (phenylalanine, tryptophan, and tyrosine), nucleic acids, proteins and derivatives, and glucose and other sugars. The higher levels of glucose in sera of leukemia patients were consistent with the enhanced glycolysis seen in leukemia cells i.e., the Warburg effect.127 RS-measured metabolites were used in pathway analysis that showed energy metabolisms like glycolysis, pyruvate metabolism, metabolism of nucleic acid bases, and some amino acid pathways are altered in the progression of leukemia (Fig. 3b). Indeed, amino acids play a crucial role in the etiology of a range of cancers. Contorno et al. demonstrated that Raman signature of aromatic amino acids, specifically tryptophan, phenylalanine and tyrosine, are key markers of breast cancer progression.113 The authors re-analyzed Raman spectra of breast cancer tissue and cell lines from recent literature and found that aromatic amino acids were overexpressed in all of these findings. Amino acids also contribute to the etiology of other cancers including colon,128, 129 pancreatic,130 and lung cancer.131 In another work, Bendau et al. accurately discriminated metastatic breast cancer 4T1 and nonmetastatic 67NR tumors using resonant RS and aided with ML algorithms including non-negative matrix factorization (NMF) and SVM.114 In this comprehensive multiplexed metabolic study, the key Raman peaks that distinguished the two tumor tissues included tyrosine/collagen (859 cm−1), lipids (1339 cm−1, 1441 cm−1), proteins (1358 cm−1), amide II (1557 cm−1), cytosine at (1608 cm−1), Amide I (1640 and 1658 cm−1), and phenylalanine (1607 cm−1). Changes in lipid and collagen modes were the main contributors of metastasis consistent with the well-established hallmarks of cancer that include altered lipogenesis and changed collagen structure.132, 133 Metabolic changes in lipids are correlated to the pathophysiology of many types of cancer, contributing to poor prognosis, rapid proliferation, metastasis and resistance to therapy.50, 56, 59, 134 This increased lipid metabolism leads to lipid accumulation in endoplasmic reticulum of cells and formation of cytoplasmic lipid droplets.135 These droplets have been recognized as an early biomarker of cancer.136, 137 Since several Raman vibrational modes are contributed by lipids, RS studies have extensively focused on lipidomic analysis in a multitude of cancers. Ben et al. explored multiplexed CARS (MCARS) to track lipid droplets by probing the 2850 cm−1 lipid peak and 2930 cm−1 protein peak in colorectal cancer cell lines expressing neurotrophin receptor TrkB.54 The overexpression of TrkB subsequently activates the PI3K/Akt signaling pathway and phosphorylation of Akt (P-Akt) leading to lipid droplet formation in cells. MCARS tracked the changes in lipid metabolism in both TrkB high expressing HT29 cells and low expressing HEK293 cells following treatment with brain-derived neurotrophic factor (BDNF). Their approach showed BDNF-induced TrkB activation leads to lipid droplet formation in HT29 cells. Through MCARS the authors concluded that (i) the accumulation of lipids in endoplasmic reticulum and the formation of lipid droplets in the cytoplasm occurs as a function of time (Fig. 3c) and (ii) the number of lipid droplets is associated with TrkB expression level and its activation. On a clinical point of view, the fundamental underpinnings of lipidomic changes probed in this study could enable oncologists to understand the association of lipids with key signaling pathways that exacerbate highly aggressive cancer.47 These findings could be leveraged to recommend therapeutic drugs that specifically target lipogenesis and other associated metabolic pathways.
Figure 3.
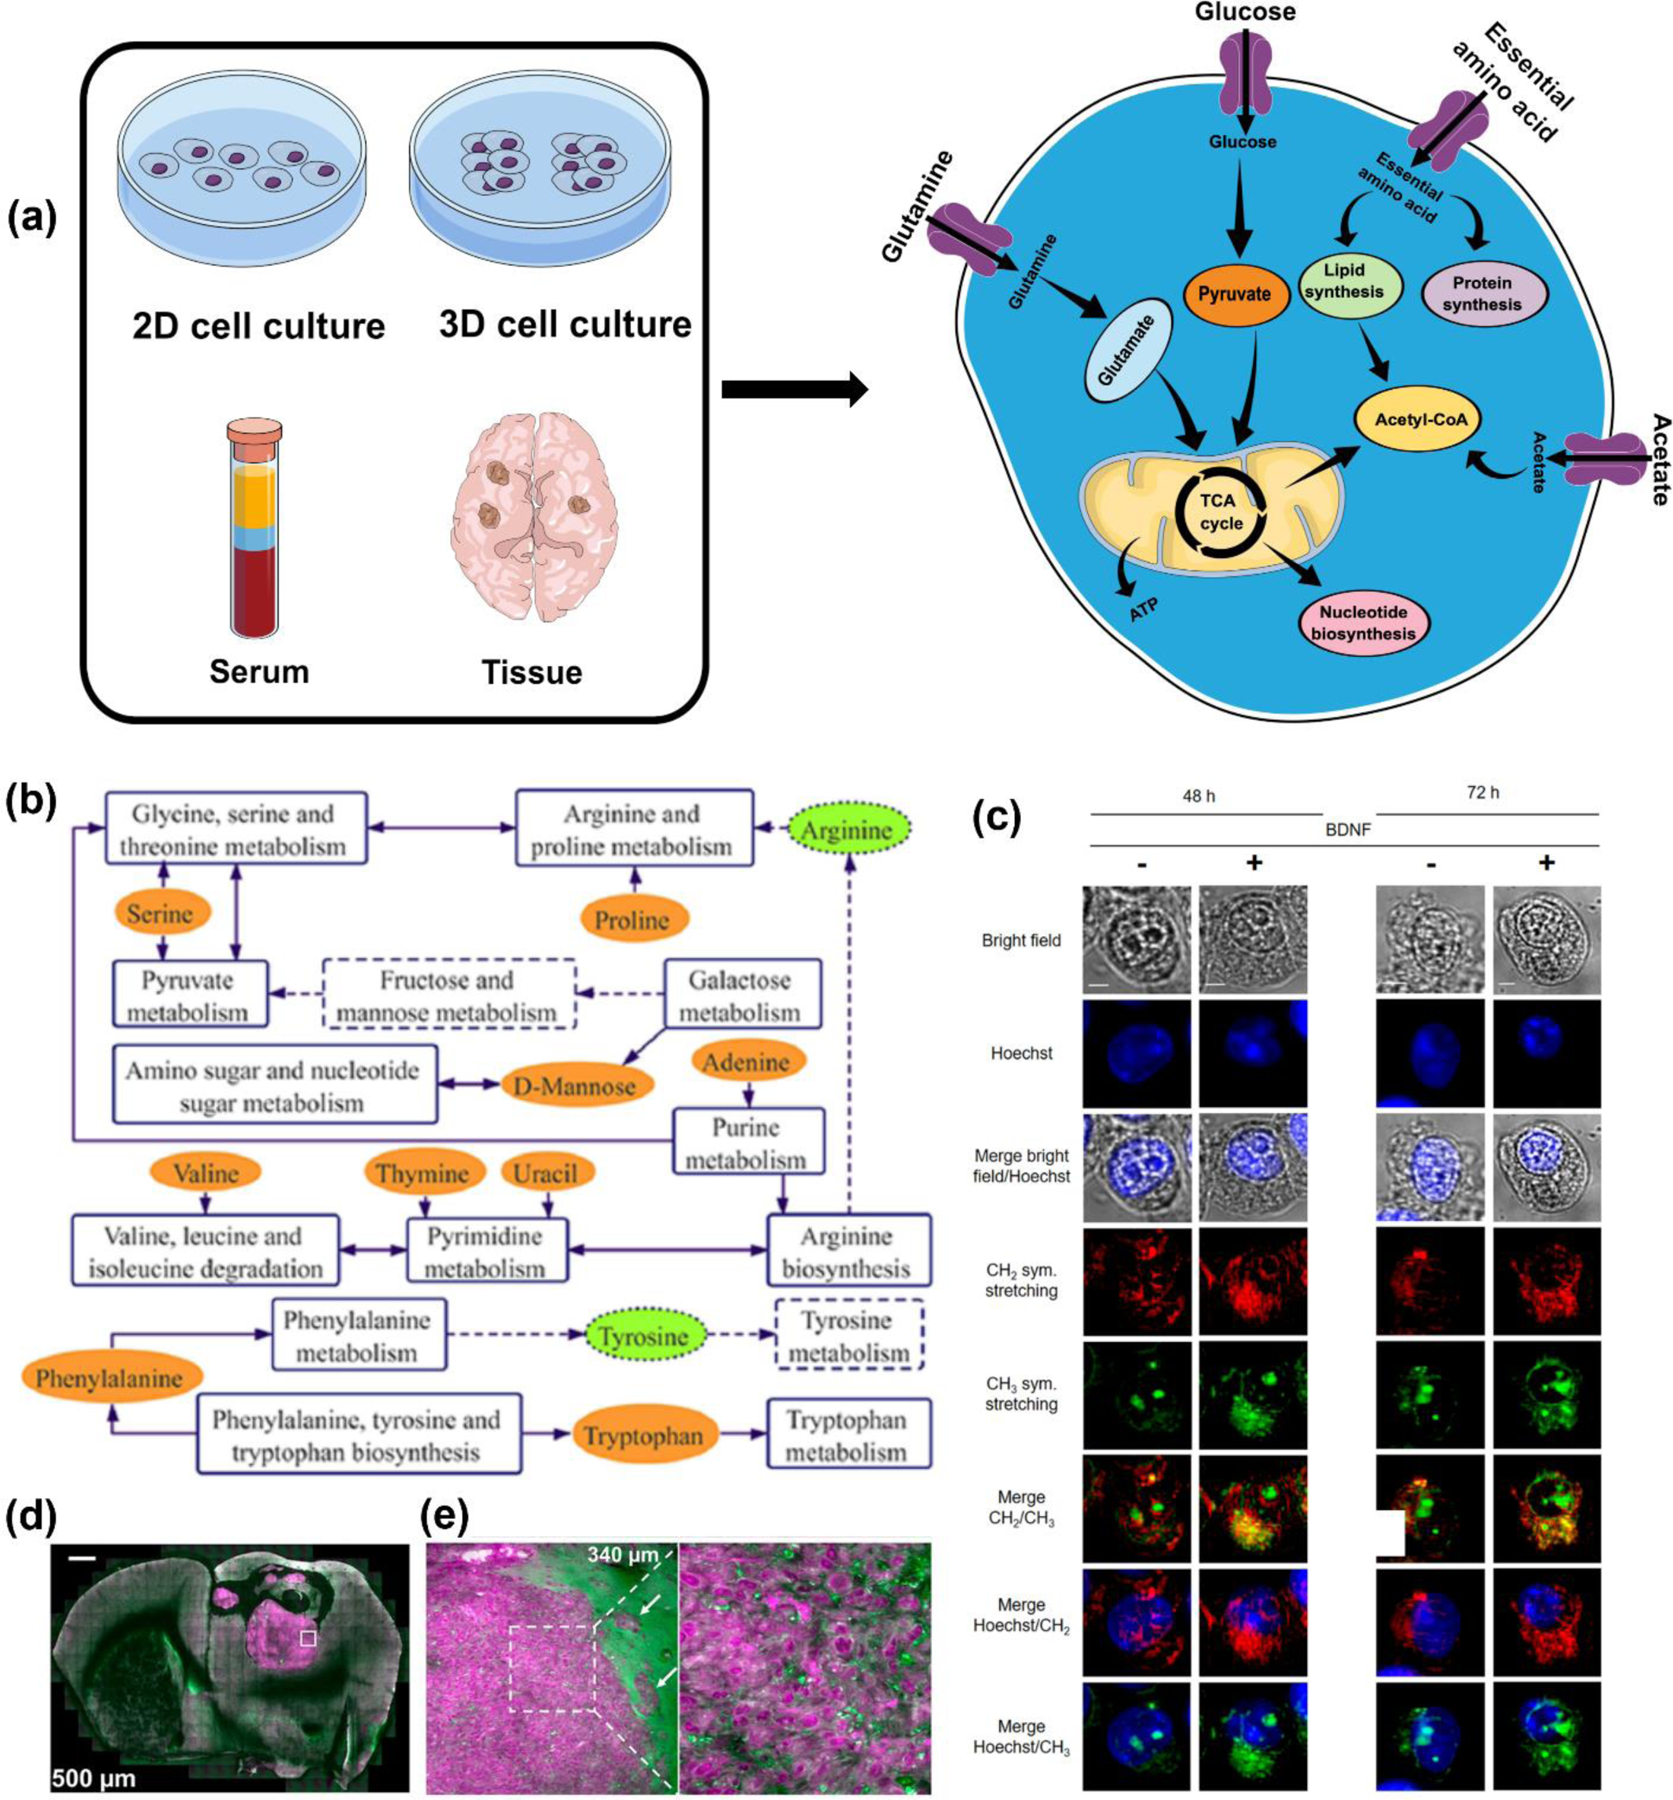
(a) Schematic illustration showing sample types in cancer including cells, spheroids and organoids, serum, and tissues that have been probed with RS to measure various metabolites relevant in cancer metabolism. (b) Metabolic network of acute myeloid leukemia discrimination based on SERS bands/metabolite; dashed lines and boxes show metabolites and pathways involved. Adapted with permission from ref 78. Copyright 2022 John Wiley and Sons. (c) MCARS spectroscopy of HEK-Clone2 after BDNF-induced TrkB activation where cells were incubated with or without BDNF for 48h and 72 h. Bright-field, fluorescence (Hoechst 33342), and MCARS images reconstructed from signal integration at 2850 cm−1 and 2930 cm−1 is shown. Scale bar, 5 µm. Adapted from ref 54. Copyright 2020 Springer Nature under CC BY 4.0 license (https://creativecommons.org/licenses/by/4.0/). (e) Clearing-enhanced volumetric chemical imaging of glioblastoma in mouse brain. (e) Left: Representative 2D images of the tumor in the whole coronal slice at increasing imaging depths. Right: Zoomed-in Cells 2D images of the white-boxed region in (e) at increasing imaging depths. Adapted with permission from ref 141. Copyright 2019 Proceedings of National Academy of Sciences.
In addition to lipid metabolism, other pathologies of tumor progression including the effect of hypoxia, and epithelial to mesenchymal transition (EMT) of cancer cells have also been studied with RS. For example, Samoylenko et al. used time-gated RS (TG-RS) to study how hypoxia in renal adenocarcinoma solid tumors change the chemical profile of extracellular vesicles (EVs).115 EVs have emerged as critical mediators of cell-cell communication between tumor cells and neighboring cells in the tumor microenvironment (TME) orchestrating systemic pathophysiological processes that ultimately lead to metastasis.138 During this process, protein, miRNA, and metabolite levels are reprogrammed in the TME; these changes can be probed by analyzing tumor-derived EVs. In their finding, the authors observed the Raman peaks corresponding to lipids and cholesterol (1405, 1440 and 1455 cm–1) discriminated the EVs incubated in hypoxic conditions relative to those incubated under normoxia. This study suggests metabolic analysis of EVs with rapid RS may allow both early disease diagnosis and understand cancer progression. In another example of metabolic changes linked to pathophysiology of cancer, Sabtu et al. used spontaneous RS to study metabolites linked to EMT in human breast cancer tissue.46 During EMT, epithelial cells lose their epithelial features, i.e. cell-cell junctions and epithelial markers, and gain mesenchymal phenotypes enabling a spindle shape and higher cell motility to migrate to other sites.139, 140 Thus, EMT is a key driver of tumor cells invasiveness leading to metastasis, recurrence, and drug resistance. In this work, the authors compared three patient tissue types including normal without lesions, non-EMT, and EMT breast cancer tissue. Multiple ML approaches were leveraged to discriminate between the tissue types including PCA, independent component analysis, and non-negative least square regression. In their comprehensive study, Raman modes of phospholipids, lipid C–C stretching modes, and peaks correlated to protein CH group and Amide III had higher intensities in EMT tissue indicating higher abundance compared to normal and non-EMT tissue. Their conclusions agreed well with literature findings that also used RS.43, 45, 50, 56 Metabolic characterization in cells were also extended to three-dimensional (3D) spheroids and glioblastoma tumors by Wei et al.141 They developed a Raman-tailored tissue-clearing strategy and coupled it with SRS microscopy. Through this approach they showed that high concentration of urea rendered tissues substantially less opaque by partially denaturing proteins and hydrating the hydrophobic core of high-refractive index proteins. SRS imaging of brain tissues cleared with urea showed high quality images with minimal background interference. They performed large-area mosaic imaging up to 700 µm into the glioblastoma xenograft in mouse brain (Fig. 3d) revealing distinct features of normal tissues that are lipid-rich vs. dense glioma which are high in proteins and low in lipids. Infiltrating glioma at the tumor margins (Fig. 3e) showed lipid-rich areas of brain parenchyma with clusters of infiltrating cells.
Most studies utilizing metabolic analysis with RS for cancer have focused on cancer detection, distinction between tumor tissue types, and cellular transformations such as EMT. The utility of RS to probe therapeutic response and distinguish responders from nonresponders of treatment is imperative for drug discovery and drug screening (Fig. 4a). In a clinical setting, treatment response based on assessment of tumor size is both slow and low throughput. As an example, CT scans of tumors are often employed to identify nonresponders in the neoadjuvant setting, or every 8 weeks during treatment to assess response. But due to poor sensitivity, specificity, and low spatiotemporal resolution, CT imaging has high variability and low accuracy as a diagnostic tool.142, 143 On a clinical point of view, metabolic analysis with RS for treatment response addresses these clinical challenges enabling a rapid, non-destructive, and efficient method to probe therapeutic response which will ultimately improve treatment efficacy, decrease relapse, and reduce mortality due to ineffective therapies. Further, metabolic changes from treatment response occur much earlier (within days) than any macroscopic changes in tumor size (weeks to months) allowing an early and accurate measure of response.144 Our group showed spontaneous RS in conjunction with PCA enables treatment response in breast cancer cells MDA-MB-231 and MCF-7 as a function of drug type and cell type.145 In this work, Wen et al. demonstrated that MDA-MB-231 cells respond to treatment with trametinib (Fig. 4b), an inhibitor of the extracellular-signal-regulated kinase (ERK) pathway but is nonresponsive to alpelisib, an inhibitor of the mammalian target of rapamycin (mTOR) pathway, indicating drug resistance (Fig. 4c). In response to Trametinib, the cells showed changes in multiple metabolic peaks (Fig. 4d) including a decrease in DNA bands (782, 1094 and 1575 cm−1), amide III (1239 cm−1), phenylalanine (1000 and 1582 cm−1) and lipids/fatty acids (1310 cm−1) signaling reduced DNA replication, protein synthesis, and alteration in lipid metabolism. The study also identified Raman peaks that increased with treatment including tyrosine (830 cm−1), sphingomyelin (875 cm−1), and lipids (1057 cm−1) which were attributable to dephosphorylation of tyrosine kinase with treatment, increased apoptosis likely through sphingomyelinase enzyme activity, and a complex role of various lipids. The results also showed estrogen receptor positive MCF-7 cells were nonresponsive to Trametinib with minimal metabolic activity. Collectively these findings suggest that oncometabolite profiling with RS could ultimately be translated in a clinical setting and applied to liquid biopsies that is routinely obtained from patients. In another example of treatment response, Namor et al. studied the impact of calix[4]arene derivative on colorectal cancer Caco-2 cells using spontaneous RS.146 The authors found that cell membrane phospholipids (1338 cm−1) increased after treatment, but lipids (1440 cm−1, 3055–2882 cm−1), Amide I (1650 cm−1), polysaccharides (939 cm−1) and nucleic acids (789 cm−1) were downregulated post treatment. Recent findings in RS have also focused on the role of cholesterol and its synthesis on therapy resistance. Kanmalar et al. conducted a review on bladder cancer comparing previous work that applied RS on tissue, blood, serum, and urine.147 The study focused on the classification of chemosensitivity status based on Raman features associated with cholesterol metabolism. They identified Farnesyl-diphosphate farnesyltransferase 1 (FDFT1) expression and its effect on cholesterol biosynthesis as a potential driver of cholesterol-linked chemoresistance.
Figure 4.
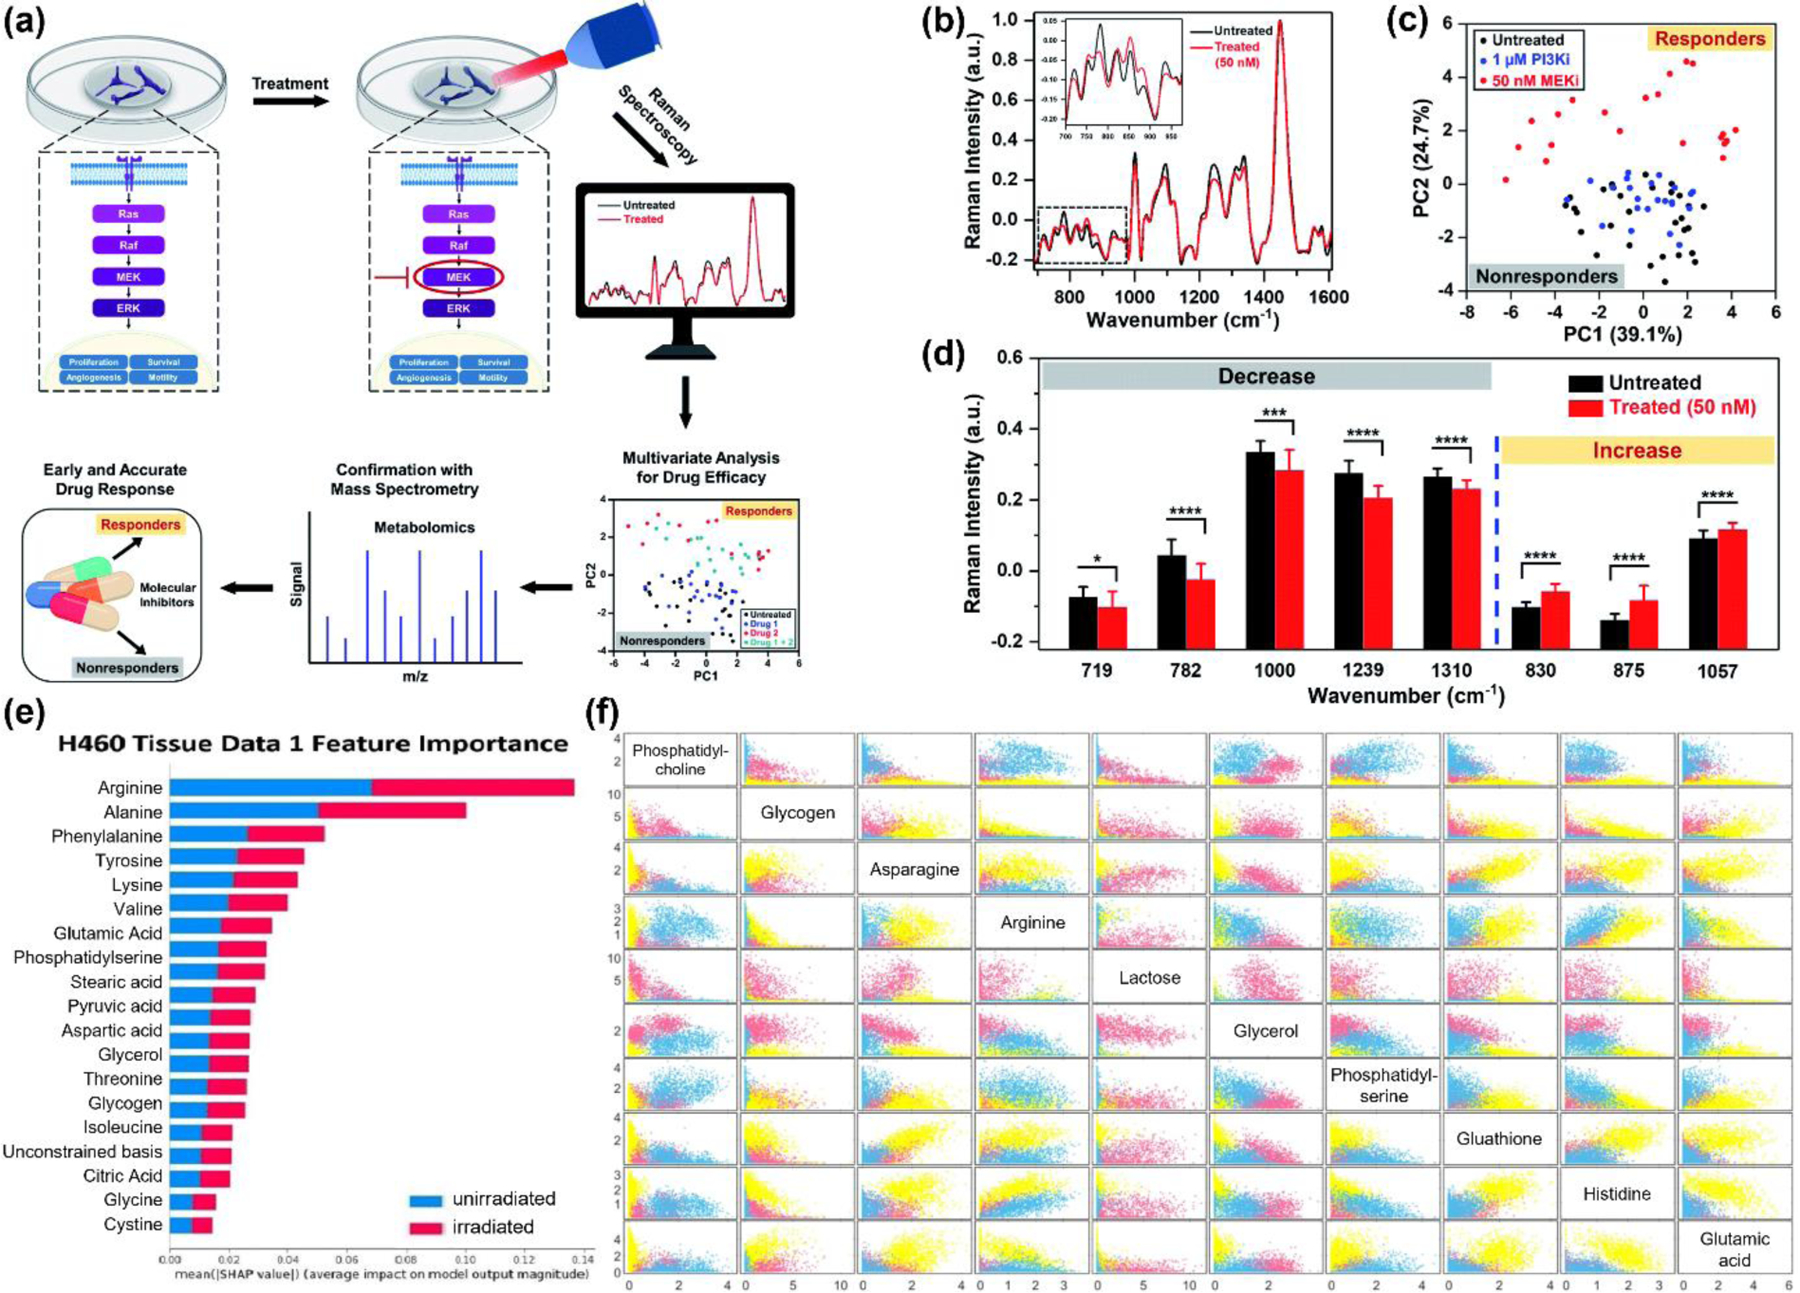
(a) Schematic showing experimental setup to probe metabolic changes in breast cancer confirmed with mass spectrometry provide an early prediction to treatment. (b) Raman spectra of treated (50 nM MEK inhibitor) and untreated control. (c) PCA distinguishes responders (MEK inhibitor treated) and nonresponders (PI3K inhibitor treated, and untreated control). (d) Raman peaks that decreased or increased after treatment Adapted with permission from ref 145. Copyright 2020 Royal Society of Chemistry. (e) Feature importance summarized for H460 tissue data sets. The bars are produced stacked bars for outputs of SHAP (SHapley Additive exPlanations) values from different classes (blue: unirradiated, red: irradiated). Adapted from ref 151. Copyright 2022 Royal Society of Chemistry under CC BY 3.0 license (https://creativecommons.org/licenses/by/3.0/). (f) Scatter plot depicting scores for each cell line H460 (pink), MCF7 (yellow) and LNCaP (blue) on the 10 most important chemicals obtained from random forest decision modelling (Fig 4A), as labelled in the diagonal. Adapted from ref 97. Copyright 2021 Springer Nature under CC BY 4.0 license (https://creativecommons.org/licenses/by/4.0/).
In addition to to spectral information, Raman imaging has also mapped cellular metabolism in response to drug uptake due its ability to characterize spatial distribution of metabolites elucidating heterogeneities within single cells or tissues. Larion et al. leveraged spontaneous Raman imaging of live oligoastrocytomas (BT142) and fibrosarcoma (HT1080) cells expressing isocitrate dehydrogenase 1 (IDH1) mutations, and dissected tissues from mouse models of cancer to probe the action of FK866, an inhibitor of nicotinamide adenine dinucleotide salvage pathway.148 They found a decrease in proteins and lipids, especially those involved in cell membrane formation, in response to the drug in live cells. Surprisingly, the drug was less effective in tissues with an abundance in lipids in treated mice, a trend that was opposite to that observed in cells. These opposing trends may be attributable to the limitations of spontaneous Raman imaging due to lower sensitivity and may need SERS (section 4) or SRS 149 to improve SNR. Further, the Raman bands of the drug overlapped with the cell’s fingerprint region rendering it difficult to accurately map treatment response. However, this latter limitation was addressed by Aljakouch et al. by probing the uptake of neratinib, a tyrosine kinase inhibitor that binds to both EGFR and HER2 receptors, within cells.150 The Raman features of neratinib, a strong C≡N stretching vibration at 2208 cm−1, falls within the “cell silent” region (discussed in section 5) enabling straightforward tracking of the drug within cells. Their findings show neratinib binds to both EGFR and HER2 receptors, and new metabolites accumulated in lysosomes of breast cancer and non-small cell lung cancer cells. Whereas most of these studies are focused on immortal cells in vitro, the fundamental knowledge gained could be leveraged for future studies on patient-derived primary cells or patient tissues to understand why patients with the same phenotype of cancer respond differently to clinical drugs.
RS has also been applied to understand response in clinically-relevant treatment modalities including radiation therapy and immunotherapy. In a recent work, Deng et al. performed RS in human lung cancer cells (H460) and in xenografts from mouse models exposed to radiation and correlated metabolic changes to radiation response and hypoxia (Fig. 4e).151 They found the top 20 contributing metabolites included alanine, citric acid, glycogen, stearic acid, threonine, and valine in both cells and xenografts. In the tissue data set arginine, phenylalanine, phosphatidylserine, tyrosine, and unconstrained bases showed high contributions. They used group and basis restricted non-negative matrix factorization (GBR-NMF) to track changes in metabolites. GBR-NMF involves the deconvolution of Raman spectra into its individual metabolite bases using a library of Raman spectra of biochemicals present in cells. They also used a RF classifier and shapley additive exPlanations (SHAP), a feature importance calculation technique, to classify cells and tissue into irradiated and untreated cohorts. Their findings show a positive correlation of hypoxia to glycogen and alanine (higher score is hypoxic regions) and a negative correlation of hypoxia to arginine indicating metabolic profiling is highly effective to map the response to clinical therapies. In another work, Milligan et al. utilized single-cell RS and also combined with GBR-NMF to detect metabolite variations associated with radiation treatment in three human cancer cell lines derived from lung (H460), breast (MCF7) and prostate (LNCaP) tissue.97 Raman spectra were collected from each cell line at ionizing radiation 0 Gy (control) and 2–10 Gy on days 1, 2 and 3 post-treatment. The authors were able to classify the cell lines as radiation sensitive or radiation-resistant based on metabolites estimated by the GBR-NMF and RF algorithm (Fig. 4f). The most important metabolites that contributed to the classification were phosphatidylcholine and glucose, followed by asparagine, arginine, and lactose. These findings of altered lipid metabolism and glucose uptake as hallmarks of cancer agree with the literature. In another study, Paidi et al. demonstrated response to checkpoint blockade immunotherapies in tumors with RS in immunogenic CT26 tumor model.98 Immunotherapies have transformed the landscape of cancer treatment where blockade of immune checkpoint receptors cytotoxic T-lymphocyte-associated protein 4 (CTLA4) and programmed cell death ligand 1 (PD-L1) have been particularly effective in a broad array of cancer patients.152 Whereas the impact of immunotherapies at the genomic and proteomic levels are being studied, the metabolic impact of this new class of treatment in tumors remains largely unexplored.153, 154 Therefore, the authors examined the metabolic impact of antiCTLA4 and antiPD-L1 on CT26 tumors with RS and incorporated a five-component multivariate curve resolution (MCR) alternating least squares decomposition where three components corresponding to lipids, nucleic acids, and collagen were studied. The MCR analysis generated scores that showed a decrease in lipids, a decrease in nucleic acids, and a minimal change in collagen for antiPD-L1 treatment. The antiCTLA4 treatment showed contrary trends, with lipids increased, nucleic acids decreased, and collagen significantly decreased compared to control. Through this impactful study the authors show that RS is a clinically-relevant contender for noninvasive assessment of tumor response of novel treatments, such as immunotherapies, that are already being applied in clinic, as well as combinatorial immunotherapy regimen that are currently in clinical trials.
3.2. Metabolism in Other Diseases
Whereas label-free RS has been most prevalent in cancer diagnostics and treatment response, RS has also been used to understand metabolic changes in other disorders including GI diseases, 40, 49, 155–160 cardiac disorders,161–164 and neurodegenerative diseases,64, 73, 82–84, 165, 166 included in this section. We have specifically discussed literature findings where clinical samples were probed to highlight the clinical relevance of RS in the context of these diseases.
The utility of RS in early diagnosis of GI diseases has risen in the past decade specifically for inflammatory bowel diseases (IBDs) that include Crohn’s disease (CD) and ulcerative colitis (UC). IBDs are chronic disorders characterized by intestinal inflammation and dysregulated gut immune response with loss of intestinal barrier function.167, 168 IBDs currently have no cure, and there are limited treatment options for patients. Recent studies have found that in IBDs, microbially-derived metabolites impact multiple processes in patients including immune function and mucosal barrier integrity,169 and IBD pathogenesis is often driven by alteration of the gut microbiota.170 Micrbiota-derived metabolites (Fig. 5a) that have been implicated in IBDs in both mouse models171 and patients172 include short chain fatty acids, phospholipids and sphingolipids, bile acids, indole derivatives, and branched chain amino acids (valine, leucine, isoleucine) among others. Therefore, early diagnosis and understanding how the luminal metabolic profile contributes to gut immune homeostasis is imperative for long-term control of IBD flare-ups. To achieve this goal, RS has been used to probe metabolic changes in IBDs ex vivo in various biofluids including urine, blood components, fecal samples, and tissues. Such ex vivo measurements are often preferred over direct in vivo measurements (discussed in next section) since these sample types are easily available from patients as part of routine clinical evaluation and are ideal for patients who cannot have endoscopic procedures. In a work by Acri et al. they performed spontaneous RS on fecal matter from IBDs and healthy patients to detect pediatric onset of IBDs and reliably differentiate between the different patient cohorts.155 The authors primarily focused on the broad amide I band at 1650 cm−1, which through deconvolution and curve fitting revealed four sub-peaks at 1617 cm−1, 1634 cm−1, 1663 cm−1, and 1694 cm−1 corresponding to different conformations of the polypeptide backbone/proteins. The authors defined a crosslinking ratio which was the ratio of area under 1663 cm−1 peak (disordered secondary protein structure) to that at 1694 cm−1 (antiparallel β-sheet configuration). Their findings showed that active inflammation is associated with a significant increase in the crosslinking ratio and was crucial in distinguishing healthy from diseased samples. In another study, Addis et al. analyzed 60 colon tissue biopsies from UC patients before and after treatment to probe whether mucosal healing was achieved with treatment.156 They found that RS in combination with Mann Whitney U statistics and multivariate analysis could distinguish between quiescent and inflamed colon tissue. RS also accurately discriminated between healed (after treatment) and inflamed tissues (before treatment) where carotenoid peaks (1155 cm−1, and 1518 cm−1) were significantly enhanced in inflamed tissue, attributable to the antioxidant properties of carotenoids that serve as a defense mechanism against inflammation. Further, phospholipids (peaks at 1440 cm−1 and 2762 cm−1), a major component of cell membrane, were downregulated in inflamed tissues implying that inflammation compromises the integrity of mucosa, and the RS findings was validated with histological studies. In a similar study by Smith et al. RS differentiated inflammation pre-treatment from mucosal healing post-treatment in IBD patient tissues.158 In this work, a supervised ML artificial neural network, specifically a self-optimizing Kohonen index network (SKiNET), was leveraged to distinguish between the two tissue types. They achieved a sensitivity, specificity, and accuracy of 96.29%, 95.03% and 95.65% respectively in UC patients, and 96.19%, 88% and 91.6% in CD patients. The authors found that phenylalanine and amide III peaks decreased in intensity while phospholipids increased in treated and healthy controls relative to active inflammation samples. These pre-clinical studies show that biochemical profiling with RS is highly promising for detecting early markers of IBDs before the onset of macroscopic damage to GI tissues, suggesting that RS has the potential to compete as a reliable point-of-care diagnostic and complement other clinically-established diagnostic tests.
Figure 5.
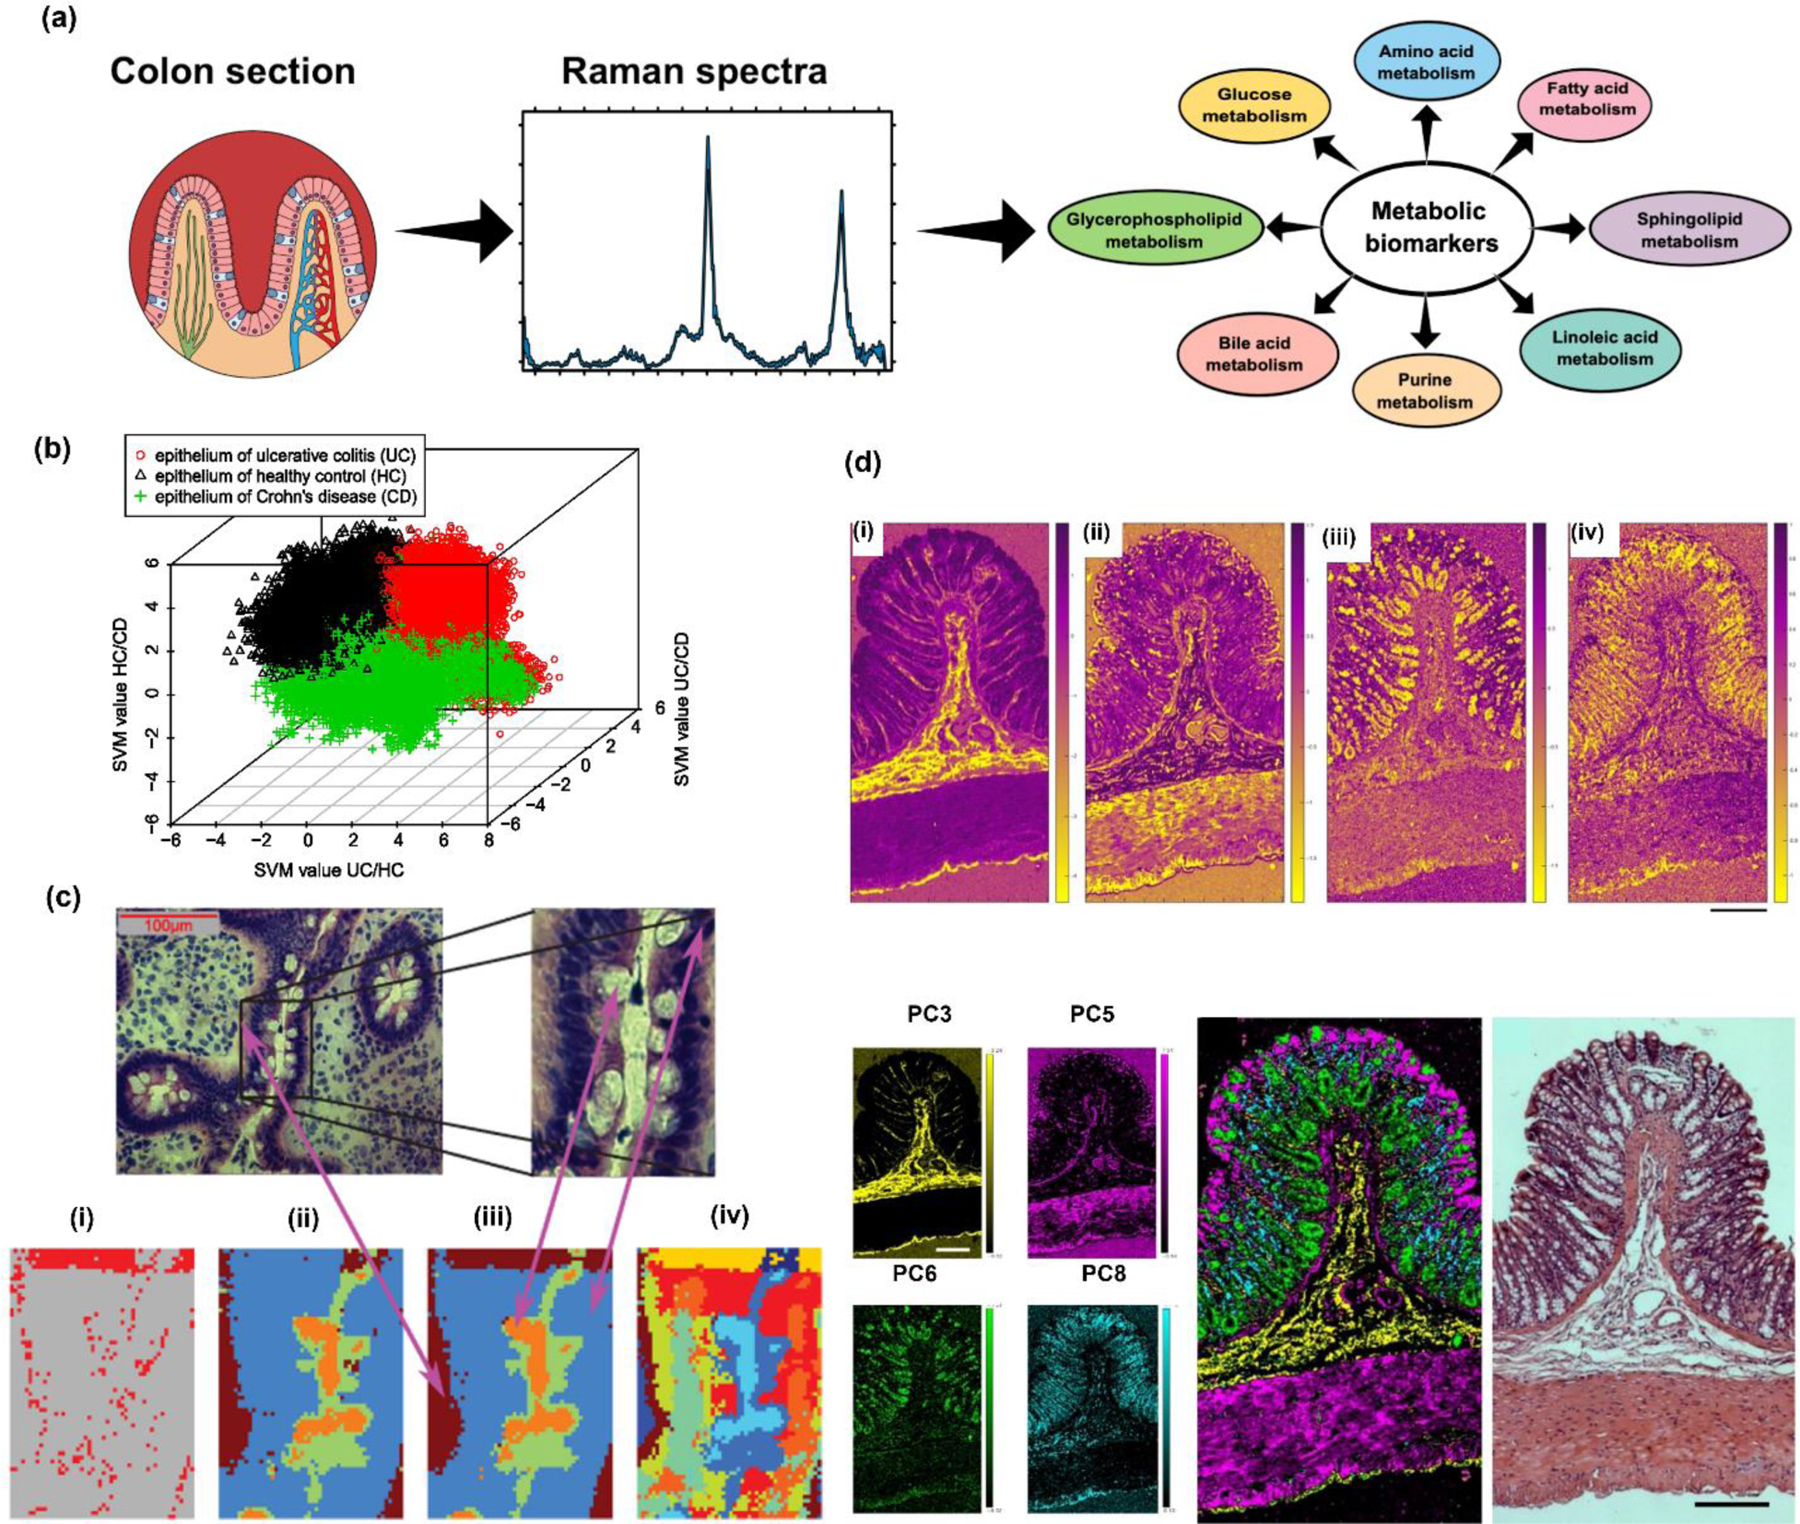
(a) Schematic illustration showing how metabolites are probed in a colon tissue section using Raman microscopy; these metabolites activate or deactivate various metabolic pathways that characterize IBDs. (b) Disease recognition where decision values of the second level classification shows the separation of three groups. (c) Top: H&E-stained image of tissue from the UC group (top) where Raman scanned region is marked by a rectangle. Bottom (i) difference of SVM and morphological notations based on Raman scan data, (ii) SVM based notation, (iii) morphological notation by a pathologist, (iv) False-color-plot of a k-means-cluster-analysis of the Raman map. Adapted with permission from ref 49. 2012 Society of Photo-Optical Instrumentation Engineers (SPIE). (d) Top: Raman false-colored images color coded by the associated PC loadings: (i) PC3: submucosa, lamina propria and serosa, (ii) PC5: muscle, (iii) PC6: mucin in goblet cells and (iv) PC8: nuclei. Bottom: Left Comparison between PCA score image generated based on Raman datasets (left) and H&E-stained rat colon section (right) (scale: 200 µm). Adapted from ref 40. Copyright 2016 John Wiley and Sons under CC BY 4.0 license (https://creativecommons.org/licenses/by/4.0/).
Whereas most studies have leveraged RS to discern chemical information and classify samples with chemometric analysis, Raman imaging has also been explored to study tissue morphology as a RS-based histopathology approach. Bielecki et al. applied spontaneous Raman microspectroscopy to visualize the morphology of human colon tissue from healthy and IBD patients.49 The Raman images were then analyzed by k-means clustering analysis to differentiate the various components of the colon including the epithelium, mucus, connective tissue, blood, and “not notable” features (Fig. 5b). A supervised ML SVM model was for trained with the RS images of the tissue. The study then focused on the epithelium component to classify tissue into healthy control, UC (Fig. 5c), and CD. The SVM classifier achieved a correct classification rate of 98.9%, with sensitivity and specificity of 99.07% and 98.81% respectively. In another study with a similar approach, Gaifulina et al. used Raman microspectroscopy to image excised healthy rat colon tissue and demonstrated the advantages of Raman imaging over H&E staining (Fig. 5d).40 Using spectra of reference material that make up the chemical profile of tissues, the authors performed a detailed biochemical characterization of the anatomical layers within healthy colon tissue. In both of these studies, Raman images were validated with histology images establishing that RS can serve as a powerful technique to analyze tissues on both a morphological and metabolic level. While brief, in this section we have captured key findings where RS was used in IBD patient samples to highlight the clinical significance of RS in GI disorders. Readers are also encouraged to explore more in-depth reviews focused on RS in IBDs.173
In addition to IBDs, RS has also been applied to cardiac disorders for diagnosis of atherosclerosis in vivo, characterization of the atherosclerotic plaque, evaluation of aortic aneurysm, and calcific aortic stenosis. Here we will give a glimpse of some of the key studies where RS has been applied to patient samples and discuss the versatility of RS in cardiovascular diseases. In these cardiovascular diseases, calcification occurs in the blood vessels and cardiac valves, where low density lipids can accelerate local inflammation and often serve as precursor to mineralization. Indeed, lipids and fatty acids have been strongly correlated to the pathogenesis and progression of cardiac valve calcification .174 As represented in Figure 6a, damage in the valve leaflet endothelium allows for the infiltration of lipoproteins such as low-density lipoproteins and lipoprotein.174 These lipoproteins transport and undergo oxidation, producing oxidized phospholipids. Oxidized phospholipids and further byproducts such as lysophosphatidic acid lead to inflammation and recruitment of immune cells.175 Inflammatory cytokines produced by recruited immune cells induce changes to the gene and protein expression in local valve interstitial cells (VICs), leading to a transformation into an osteoblastic phenotype.176 Osteoblastic VICs contribute to calcification through the secretion of mineral complexes like hydroxyapatite and osteogenic proteins. Raman spectra can capture both the involved metabolites and biominerals that enables the evaluation of valve calcification at different stages of the disease. In a recent investigation by Tanoren et al., RS and scanning acoustic microscopy (SAM) were combined to characterize the dilated segments of the aorta from male and female patients with aortic aneurysm.177 Aortic aneurysm is a life-threatening disorder associated with high morbidity where the breakdown of elastin and collagen in the aortic wall ruptures the wall of the artery. Early detection is key to determining therapeutic options for patients with this serious condition.178 SAM characterizes the morphological and mechanical properties of tissues where a focused high-frequency ultrasound is applied to samples to obtain acoustic impedance signals. Their findings suggest that older female patients have a stiffer aortic wall with a higher acoustic impedance correlated to aging and lower estrogen levels. Samples with the highest correlation to disease state i.e., with the stiffest tissues measured by SAM, showed high peak intensities for amino acids and proteins (tyrosine, proline, amide III) in RS. Further, peaks corresponding to lipids and fatty acids (1300 cm−1), phospholipids and collagen (1454 cm−1), and oxidative stress products (NADH, 1621 cm−1) had reduced intensities. Their findings also showed a linear correlation between SAM and RS measurements for the female patients suggesting that tissue elasticity and metabolic changes simultaneously define the phenotype of aortic aneurysm and could be considered as early markers to enable rapid diagnosis in patients. In a compelling work by You et al., the authors showed the relationship between medial aortic calcification and atherosclerosis, which is the thickening or hardening of the arteries caused by a buildup of plaque.163 The authors measured the distributions of minerals and biochemicals in aortic tissue cross sections such as apatite and whitlockite using RS (Fig. 6b). They compared atherosclerotic tissue to healthy tissue, and compared tissues from different age groups. By combining Raman imaging with univariate, multivariate, and vertex component analysis methods, they developed high resolution Raman images indicating the biochemical differences between atherosclerotic and nonatherosclerotic aortic tissues. Apatite and whitlockite were identified by their phosphate bands at 960 cm−1 and 970 cm−1 respectively. They found that apatite, cholesterol, and triglyceride increased in atherosclerosis with a significant increase in apatite relative to whitlockite suggesting its critical role in atherosclerosis development. In a patient-centered diagnostic study, Yang et al. examined the urine of coronary heart disease (CHD) patients using label-free SERS.161 Urine samples from 20 healthy patients, and 87 patients with CHD including patients with and without percutaneous coronary intervention (PCI) signifying disease severity were collected and mixed with silver colloid solution before measurements. Raman analysis was combined with PCA-LDA to classify samples into different cohorts with classification sensitivity and specificity of 90% and 78.9% respectively. The authors also tested healthy urine mixed with platelet-derived growth factor-BB (PDGF-BB), a protein overexpressed in CHD, at various concentrations and consistently found that the RS peak at 1509 cm−1, assigned to PDGF-BB, correlates well with coronary angiography tests for PCI patients. Their findings suggest PDGF-BB with RS analysis could serve as a key biomarker to distinguish PCI from non-PCI patients. In another work by Kaczor and co-workers, RS was applied to study the biochemical profile of aortic valve tissues from patients with severe calcific aortic valve stenosis (AS) undergoing elective valve replacement surgery.179 A combination of Raman spectral characteristics, Raman imaging, and K-means cluster analysis of stenotic valves revealed peaks corresponding to lipids and calcification (Fig. 6c). The authors observed strong lipid/fatty acid peaks at 1444 and 1304 cm−1, a peak at 1740 cm−1 corresponding to cholesteryl esters, and peaks in the fingerprint region at 428, 548, and 704 cm−1 also correlated to cholesterol and its esters. The authors concluded that while cholesterol and its esters increase in the stenotic valve tissues, lipid components (fatty acids and triacylglycerols) decrease. Their analysis also showed peaks corresponding to hydroxyapatite at 432, 591, and 964 cm−1 corresponding to P–O stretching vibrations of the phosphate anion increased. These examples demonstrate the general role of lipids and fatty acids in cardiac disorders and the importance of metabolic testing for early assessment of atherosclerosis and other heart diseases in patients. Readers are also encouraged to explore other in-depth reviews focused entirely on RS in cardiovascular diseases.180, 181
Figure 6.
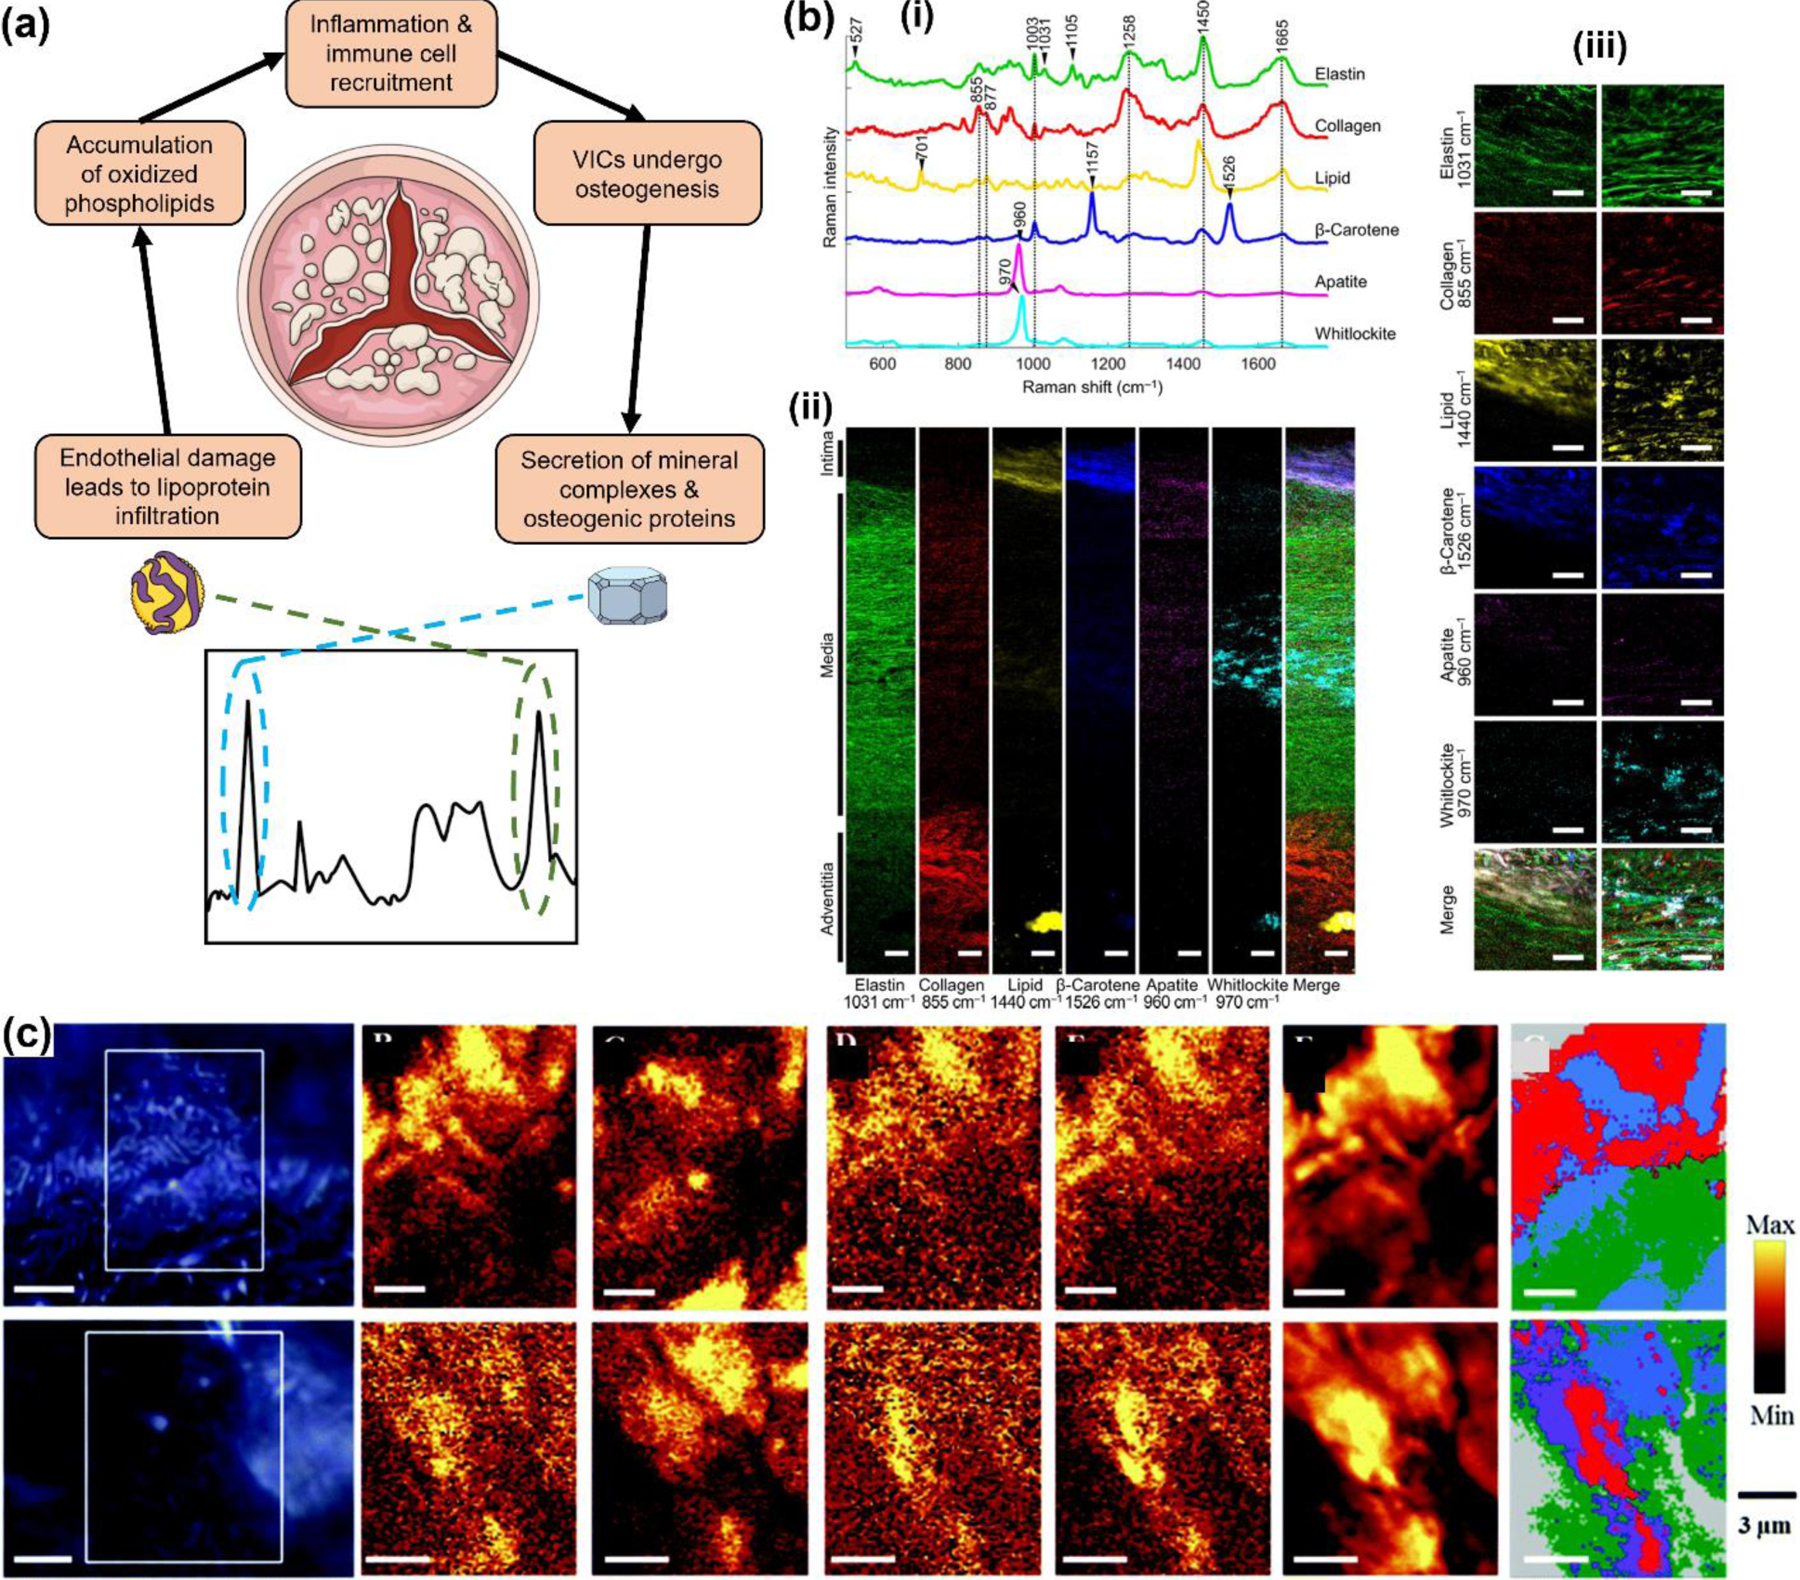
(a) Schematic representation of the metabolic pathway in calcific aortic stenosis. Here phospholipids and lipoproteins lead to inflammation and ultimately contribute to calcification through the secretion of mineral complexes. Raman spectroscopy measures both the involved metabolites and the biominerals for evaluation of valve calcification. (b) (i) Raman spectra rich in specific aortic components of a nonatherosclerotic aorta (65 years old). (ii) Univariate heat maps of the entire cross section of a nonatherosclerotic aorta plotted according to the signature peaks listed. (iii) High-resolution maps at the intima-media interface (left) and within the media (right). Scale bars, 100 μm (ii) and 50 μm (iii). Adapted from ref 163. Copyright 2017 American Association for the Advancement of Science under CC BY 4.0 license (https://creativecommons.org/licenses/by/4.0/). (c) Images of stenotic valves: microscope light images of valve tissue at 100× magnification (left) and Raman images of lipid components obtained by the integration of specific Raman bands (middle). (Right) The corresponding cluster map composed of lipids (red and violet areas), calcium salts (blue) and other components (green). Adapted with permission from ref 179. Copyright 2015 Royal Society of Chemistry.
RS has also been explored in diseases of the brain and neurodegenerative disorders. Neurodegenerative/neuromuscular disorders including Alzheimer’s disease (AD), amyotrophic lateral sclerosis (ALS), and Parkinson’s disease (PD) have poor prognosis, and debilitating to a patients’ quality of life. Further, these disorders are difficult to diagnose with clinicians taking a diagnosis-by-elimination approach rather than a definitive biomarker test or diagnostic imaging methodology. The lack of technologies for accurate and early detection has led to significant delays in achieving accurate diagnoses and appropriate treatments for patients. Since metabolic changes occur earlier than macroscopic transformation of disease, RS has shown tremendous promise in probing the biochemical profiles in patient samples and identify metabolic markers that enable mechanistic understanding of the disease mechanisms. Below we particularly highlight the utility of RS in detection and classification of ALS in patient biofluids and other clinically relevant samples aided with ML methods, and in combination with other spectral/imaging modalities.
In a work by Ami et al., the authors combined FTIR with RS to test tear samples, which contain proteins involved in ALS, from both healthy and ALS patients (Fig. 7a).64 By leveraging a multitude of ML methods including multivariate analysis, PLS-DA, neural networks, and extreme gradient boosting, the authors characterized the Raman spectra of tears from ALS patients with specificity and sensitivity of 100%. The authors found that phenylalanine bands had significantly lower intensity in ALS patient samples relative to the healthy cohort suggesting amino acid metabolism is rewired in ALS. Peaks associated with protein β-sheet structures at ∼1670 cm–1 and C=O stretching of lipids 1770 cm–1 had higher intensity in ALS patients likely attributable to alterations in protein conformation that supports earlier evidence of the role of protein misfolding and aggregation in neurodegenerative diseases. Given the low SNR of spontaneous RS, the Raman signal of ALS patient samples have been enhanced with label-free SERS using metallic NPs to allow rapid and accurate measure of metabolic changes. Whereas a detailed discussion of labeled SERS i.e., metal NPs labeled with Raman reporters is discussed in section 4, here we will showcase specific examples of label-free SERS that has benefited ALS diagnosis. Zhang et al. used SERS with PCA and CRT ML algorithm to distinguish Raman spectral data between 182 ALS and 60 healthy patient plasma samples that were mixed with colloidal Ag NPs.83 The authors identified adenine and coenzyme A (722 cm−1) thymine and uracil (739 cm−1), and the ratio of tyrosine peak at 635 cm−1 to the aforementioned peaks as the most significant in distinguishing the two cohorts. The SERS bands for nucleic acids were higher in ALS patients confirming well-established literature evidence of altered DNA/RNA metabolism that contribute to genetic mutations in ALS.182 Multiple metabolic pathways were enriched in ALS including phenylalanine-tyrosine-tryptophan biosynthesis, pantothenate and CoA biosynthesis, aminoacyl-tRNA biosynthesis, and phenylalanine metabolism among others. These pathways analyses confirmed that aberrations in amino acid metabolism and involvement of protein aggregation is evident in ALS. In another study, the same authors explored SERS for ALS prognosis by identifying factors that contribute to short survival of ALS patients.84 They studied plasma of 138 sporadic ALS patients including 62 patients having the disease for ≤3 years (short-duration group) and 76 patients diagnosed for more than 3 years (long-duration group). By applying ML algorithms and statistical methods (Wilcoxon rank sum test) on SERS data, the two patient cohorts were well separated. A ratiometric analysis showed that ratios of glycogen to d-mannose was smaller in short-duration group while ratio of lactose to d-mannose was larger suggesting dysregulated glucose metabolism in ALS progression that aligns well with literature findings.183–185 The authors also found nucleic acids including the ratio of thymine to adenine was significantly lower in short duration group implying that pyrimidine and purine metabolism are altered. In another study, Carlomagno et al. assessed the effectiveness of RS in differentiating between different neurodegenerative diseases and understand the pathogenesis by examining saliva from 10 healthy controls, 19 pALS, 10 Parkinson’s, and 10 Alzheimer’s patients (Fig. 7b).73 SERS combined with PCA-LDA was successful in showing significant difference between groups specifically between ALS and healthy where RS peaks corresponding to phosphatidylinositol, phospholipids, nucleic acids, glycogen, and glucose differentiated them. Their findings suggested involvement of carbohydrate metabolism, protein aggregation and misfolding, damage to membrane lipids, and alterations in DNA/RNA in ALS. The authors also found that membrane phospholipids have a significant role in differentiating between pALS, AD, and PD where phosphatidylinositol (500 and 576 cm−1) peaks had higher intensity in pALS samples attributable to increased activity of phosphatidylinositol 3-kinase enzyme.186 Further, bands associated with phospholipids and cholesterol (430 cm−1) also differentiated these neurodegenerative disorders aligning with previous work that identified cholesterol buildup in ALS, and decrease in low-density lipoprotein cholesterol in PD.187
Figure 7.
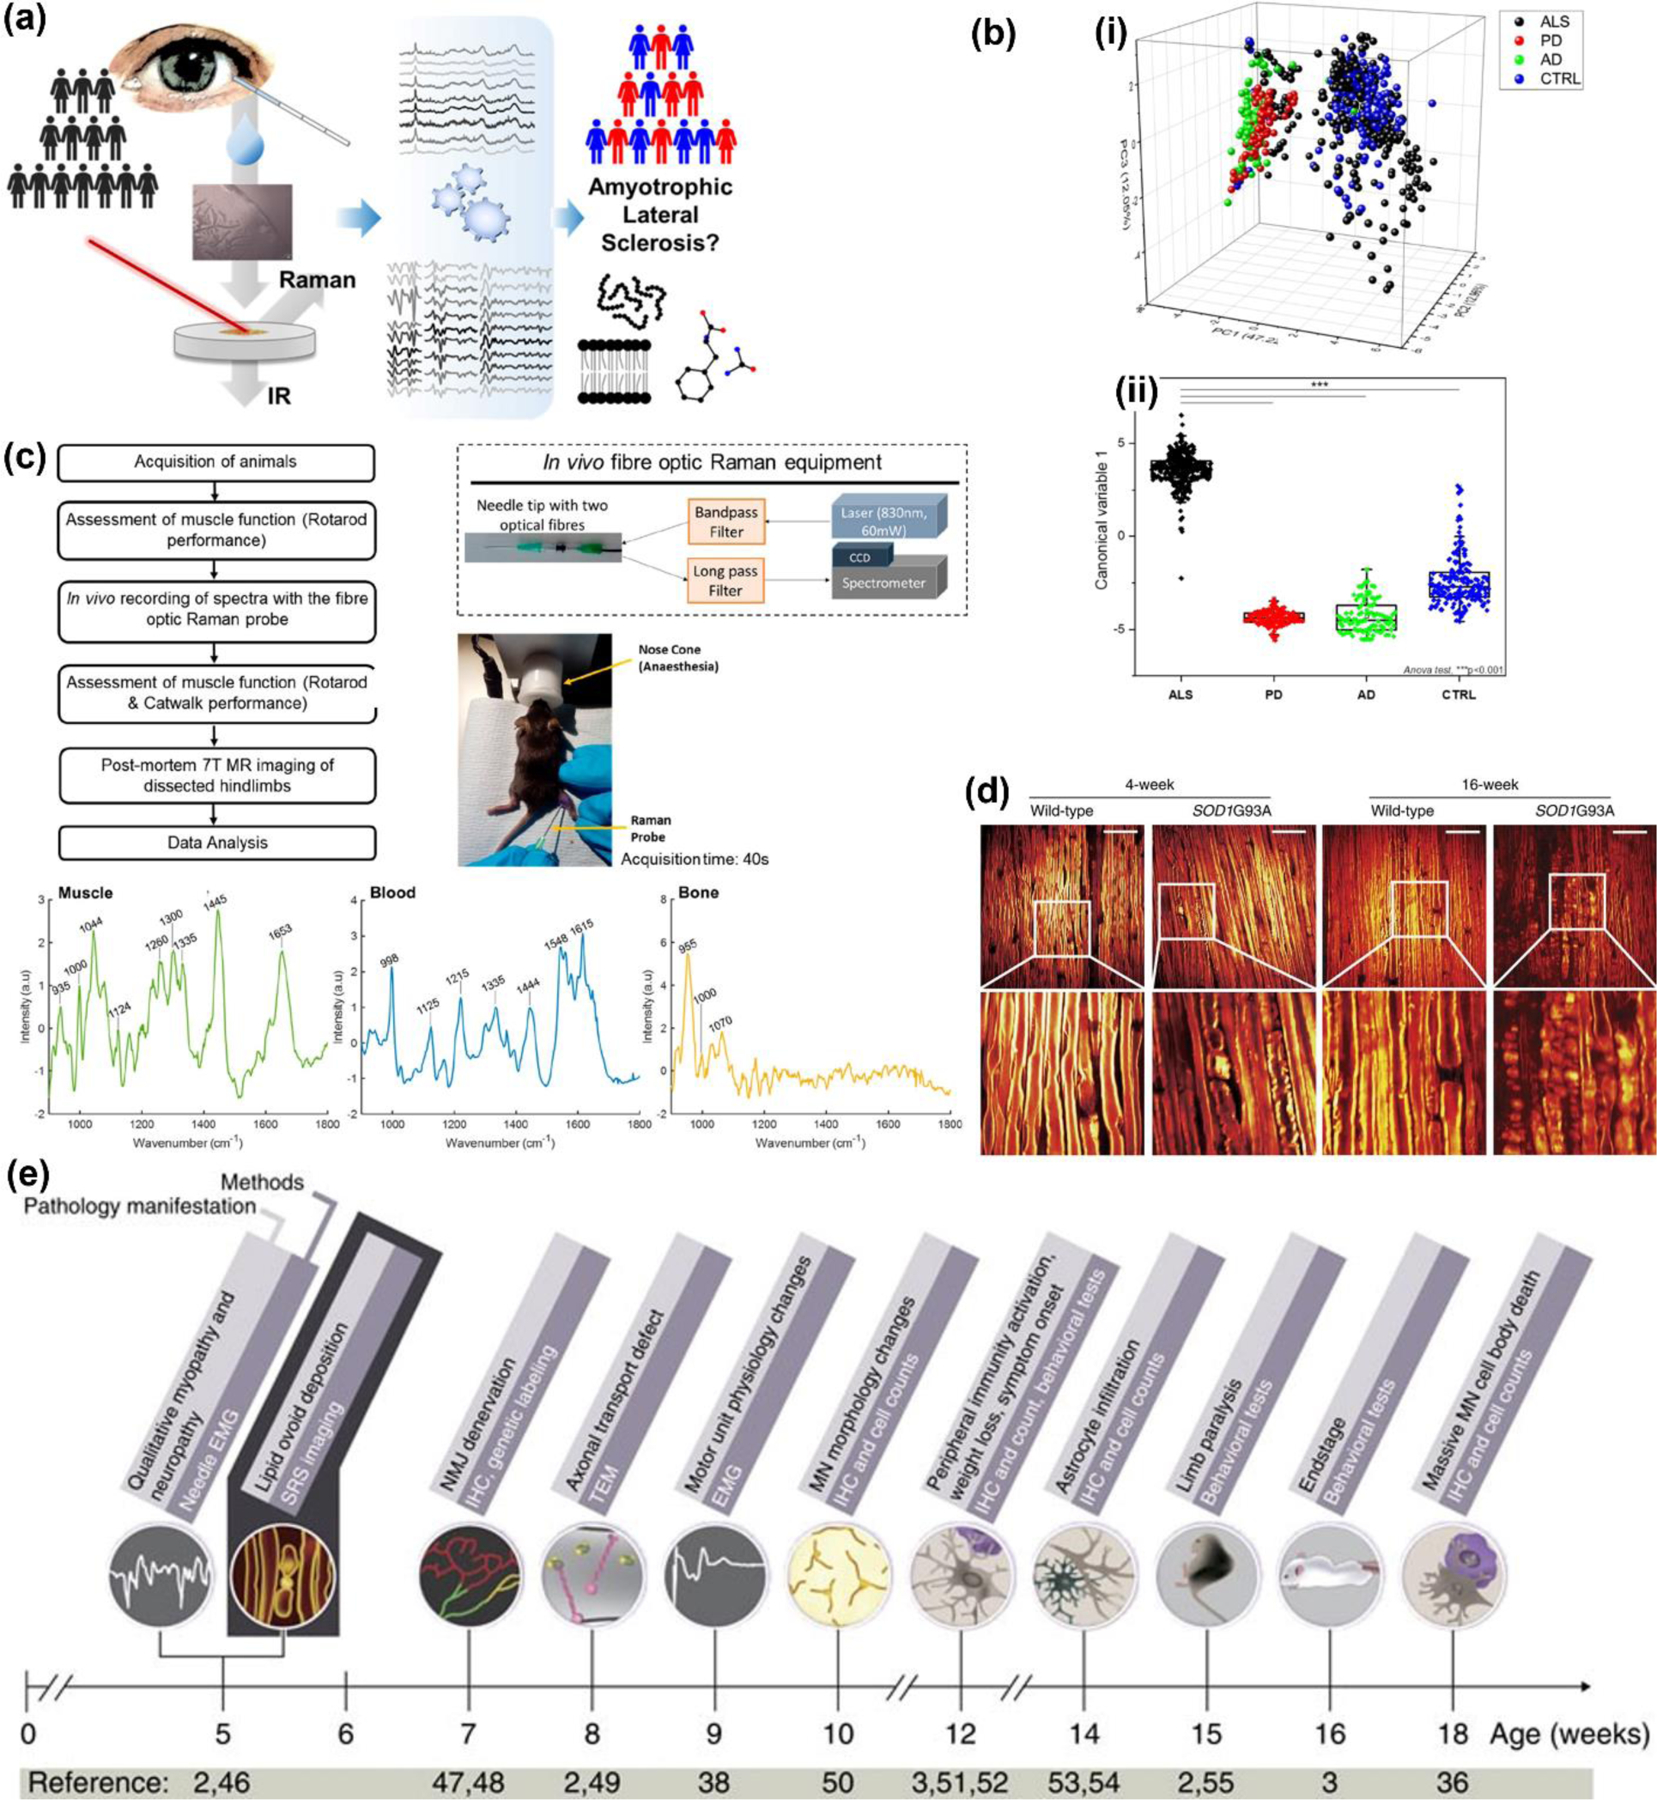
(a) Schematic representation of tear sample collection from amyotrophic lateral sclerosis (ALS) patients for Raman data acquisition and analysis. Adapted with permission from ref 64. Copyright 2021 American Chemical Society. (b) Raman analysis of clinical saliva samples differentiating Parkinson’s disease (PD), Alzheimer’s disease (AD), ALS, and healthy control (CTRL). (i) 3-axis PCA distribution: x = PC1; z = PC2; y = PC3. (ii) Linear discriminant analysis showing distribution of canonical variable values for the ALS, PD, AD, and CTRL group; ***p <0.001. Adapted from ref 73. Copyright 2020 Springer Nature under CC BY 4.0 license (https://creativecommons.org/licenses/by/4.0/). (c) Left: A flowchart of the experiments using fiber optic RS for intramuscular analysis in vivo. Right: A schematic of the fiber optic Raman system, and a mouse undergoing the procedure. Bottom: Raman spectra obtained from muscle, blood, and bone Adapted with permission from ref 165. Copyright 2021 American Chemical Society. (d) Ex vivo SRS images of sciatic nerve from SOD1G93A transgenic mice versus wild type non-transgenic mice. Scale bar, 50 µm. (e) Timeline of ALS associated pathological changes and the appropriate diagnostic methods. EMG: electromyography; IHC: immunohistochemistry; MN: motor neuron; NMJ: neural muscular junction; SRS: stimulated Raman scattering; TEM: transmission electron microscope. (d – e) Adapted from ref 166. Copyright 2016 Springer Nature under CC BY 4.0 license (https://creativecommons.org/licenses/by/4.0/).
In section 3.1 we had discussed the role of EVs as an excellent metabolic target in cancer diagnosis; EVs are also a potentially useful diagnostic test bed for RS analysis of ALS. Morasso et al. probed changes in small EVs (sEVs), large EVs (lEVs), and plasma of sporadic ALS (sALS) patients compared to healthy controls to assess if EVs or plasma could be established as a diagnostic test based for RS based diagnosis.82 Their findings showed that the biochemical profile of lEVs of sALS patients was significantly different from that of healthy control where lipids, aromatic amino acids, and amid I differentiated the two cohorts. sALS samples were rich in lipids indicated by higher intensity of bands at 1063, 1298, and 1437 cm−1 and diminished aromatic amino acids (621, 1002, and 1604 cm−1) consistent with other literature findings. But such differences were not observable in plasma or sEVs for these metabolite groups suggesting that the type of EVs extracted for metabolic profiling is critical in diagnostic assays.
The examples discussed in this section demonstrate that RS has the potential to address the current clinical challenges in accurate diagnosis of neurodegenerative diseases and the importance of appropriate ML models to enable this goal. Patients identified as high risk through genetic testing or those with early symptoms could therefore be recommended to have a serum metabolic analysis that would complement current clinical measures. Readers specifically interested in the utility of RS in Alzheimer’s and Parkinson’s disease are encouraged to read focused reviews on this topic.188–190
3.3. Metabolites and biochemical changes measured directly in vivo.
The previous sections have focused on the utility of RS ex vivo or in in vitro settings to understand disease progression and evaluate therapeutic response, as well as integrate RS with other clinical tests for use as a diagnostic tool. This section will focus on the use of RS in vivo and its potential for use in surgeries, endoscopies, or in measuring biochemical changes directly in patients. Whereas most of the examples discussed in this section are based on mouse models, the RS measurement approach use has the potential to be adapted in clinical use. For in vivo Raman measurements, a number of distinct RS tools have been leveraged including traditional microscopes, fiber optic Raman probes, and portable Raman systems. Both SRS and spontaneous RS have enabled versatility in these in vivo measurements and SERS has allowed signal enhancement. Here we discuss several examples where the utility of RS in vivo has led to successful biomedical applications in both clinical and research settings.
In the previous section, we extensively discussed the use of RS in neurodegenerative and neuromuscular disorders (NMDs) including ALS. NMDs are fatal and very challenging to diagnose in patients, and animal models fail to highlight disease pathophysiology due to the lack of specific biomarkers.166 Therefore, diagnosis of NMDs is often based on muscle force studies in animal models that are clinically-relevant but not straightforward to recapitulate, and often performed after euthanizing the animals.165, 191 These shortcomings have hindered the ability to pursue in vivo studies that are necessary to understand disease progression in live animals, and recent progress in RS has successfully addressed this unmet need. Plesia et al. developed a minimally invasive in vivo intramuscular method using fiber optic RS to study muscle pathology in two mouse models of human NMDs (Fig. 7c) - ALS (SOD1G93A mice) and Duchenne muscular dystrophy (mdx mice).165 They used multiple multivariate techniques to differentiate between diseased and healthy mice. In their innovative design, a fiber optic probe was housed inside a 21-gauge hypodermic needle to collect RS data. This fiber optic needle probe was inserted into the medial and lateral heads of both gastrocnemius muscles in mice and spectra were collected in real-time. RS data was collected longitudinally and at the 30-day time point there was no difference between healthy and SOD1 mice but mdx mice showed acute disease onset with good classification accuracy relative to healthy (AUC-ROC ≥ 0.76). At the 90-day time point, both healthy and SOD 1 pair and healthy and mdx pair were discriminated with high accuracies (AUC-ROC ≥ 0.86 and AUC-ROC ≥ 0.91 respectively). The mdx and SOD1 mice were also differentiated with high accuracy (AUC-ROC ≥ 0.89) at both time points. They found that metabolites including phenylalanine, proteins, and amide I saw significant reductions in diseased mice corresponding well to previous studies that upregulation of genes linked to protein degradation may promote ALS in SOD1 mouse models.192, 193 This study is an excellent example of the utility of a minimally invasive Raman probe that caused no impairment of motor function after the procedure and could be highly useful in a clinical setting. In another study, Tian et al. employed SRS to image sciatic nerve and lipid ovoids in an invasive procedure where a small incision was made on the right leg exposing the sciatic nerve of the mouse.166 SRS imaging was performed in vivo in SOD1G93A mouse models of ALS and age-matched non-transgenic mice with the objective to study peripheral nerve degeneration by generating 3D images of pre-symptomatic SOD1 mice (Fig. 7d). In their approach the authors showed several advantages of SRS imaging over conventional diagnostics methods such as electromyography (EMG): (i) The authors employed correlation-based algorithm to highlight the ability of SRS to detect early pathological signs of ALS before any detectable signs of motor function impairment, which achieved sensitivities on par with EMG (Fig. 7e). (ii) SRS provided more information about structural changes in peripheral nerves not achieved with EMG. (iii) SRS imaging tracked lipid ovoids directly in vivo at different time points to identify disease progression in SOD1G93A mice before signs of denervation by EMG. Lipid ovoids were likely derived from myelinating cells as they have similar chemical composition to myelin but with an abundance of lipids. (iv) Finally, SRS imaging demonstrated therapeutic response where the authors showed that administering minocycline significantly slowed peripheral nerve degeneration in the treated SOD1 mice. These findings show that RS can potentially serve as a complimentary technique to EMG in diagnostics and ultimately be a game changer in early diagnosis of neurodegenerative disease and evaluating experimental therapies.
In vivo RS has also shown promise as an intradermal measurement for detection of skin diseases, drug development, and for diabetes screening. Diabetic patients, for example, monitor blood glucose levels via fingerstick devices multiple times a day. This can be both painful and inconvenient for diabetic individuals, especially for geriatric and pediatric patients.194 This challenge has been addressed with RS based detection in vivo where Ju et al. developed an innovative SERS sensor based on poly(methyl methacrylate) (PMMA) microneedle array for in situ intradermal glucose detection.195 Their design approach had several merits: first, PMMA offered high optical transmittance; second, silver nanoparticles (Ag NPs) coated on the microneedles enhanced Raman signals; and third, 1-decanethiol functionalized on the sensor surface allowed to capture glucose. In their study, BL6 mice were fed a high-fat diet and were injected with 30 mg/kg of streptozotocin (STZ) to destroy β cells and induce diabetes. The microneedles were then pressed on the mouse skin to measure glucose levels in the subcutaneous interstitial fluid (ISF), a thin layer of fluid in the interstitial spaces around cells containing glucose and other metabolites. Within 15 min of the microneedle patch application on the skin, a portable Raman microspectroscopy system enabled SERS data collection through each single needle tips of the array. Using a Clarke error grid method with reference results from the commercial glucometer, the authors concluded that glucose levels measured by SERS-based microneedle arrays were on par with conventional glucometers. This study is an excellent example of using RS in a point-of-care diagnostic setting in a minimally invasive and painless procedure with no bleeding from the microneedle arrays.
In the previous section, we discussed the use of RS for diagnostics in IBDs where measurements were performed ex vivo in patient samples. Here we will focus on expanding the use of RS in GI disorders in vivo by integrating Raman spectrometers with endoscopic probes to enable real-time disease evaluation focused on IBDs. IBDs are difficult to diagnose in the early stages, necessitating a biochemically specific characterization tool, such as RS, that will allow rapid and direct in vivo evaluation of the early pathological symptoms before any macroscopic tissue changes could be detected video endoscopy. Pence et al. used a fiber optic probe-based Raman spectroscopy coupled to a standard clinical endoscope as a minimally invasive real-time diagnostic tool for IBDs (including UC and CD).160 Their system consisted of a portable RS with a 785 nm diode laser coupled to a fiber optic probe such that the probe was integrated and incorporated through the endoscope accessory channel. The study included 8 UC patients, 15 CD patients, and 8 control patients and RS measurements were taken in both the colon (by placing the probe against the mucosal surface) and the rectum. In their approach, post-processing on RS spectra was performed in real-time during the procedure. The spectral disease markers were identified, and spectra were classified between healthy and IBD subtypes using sparse multinomial logistic regression with a Bayesian ML algorithm enabling 86.2 % sensitivity and 39.7% specificity. The classification was weaker when distinguishing between IBD subtypes or distinguishing between inactive and active diseased states. However, the authors found that diagnostic accuracy can be improved when both colon segment and inflammation severity index are included into the discrimination algorithm. This clinically relevant work demonstrates the importance of in vivo fiber-optic based RS to improve real-time and automated IBD diagnosis during colonoscopy, and we envision that a larger cohort study in future would be beneficial in advancing RS to clinical use.
3.4. Integrating Raman with Multi-Omics Techniques
In sections 3.1 – 3.3 we discuss literature findings where RS has been used as a standalone approach to understand biochemical changes in biological systems. Emerging research in multi-omics technologies allows us to map alterations in the genome, proteome, and metabolome of biological materials enabling a comprehensive assessment of the pathophysiology of diseases and potential treatment strategies.196, 197 The combination of multiple omics technologies to enable precision medicine is also a core aim of the All of Us research program. Therefore, integration of RS with such omics techniques is desirable to leverage the merits of both approaches (Scheme 1). These include high sensitivity, multiplexing, rapid analysis, non-destructive approach, and high spatiotemporal information of RS with high specificity and expansive information achievable in ensemble of cells/tissues of traditional omics technologies. Such multimodal approaches provide a powerful and holistic interpretation of a disease phenotype by not only advancing the capabilities of each approach but also overcoming their limitations to understand disease heterogeneity. For example, RS has been combined with metabolomics that profiles a wide-range of endogenous metabolites to ultimately link metabolic function to overall biological functions as described in this section. Mass spectrometry (MS) is a gold standard in metabolomics due to its high selectivity and all-inclusive measure of metabolites.198 However, the metabolite extraction process for MS is time and labor intensive and vulnerable to user errors.199 Further, the inherently destructive nature of MS neither allows in vivo measurement of metabolites nor provide spatial distributions of a metabolite at the subcellular level. In addition, depending on the databases used to identify the metabolite’s, often misrepresented molecules are identified that can add unnecessary ambiguity to the findings.198, 200 Therefore, the combination of RS and metabolomics is highly complementary, enabling reliable detection, quantification, sample archiving and repeated measurements, and identify the key metabolic pathways enriched in a variety of sample types as will be discussed in details below.
Scheme 1.
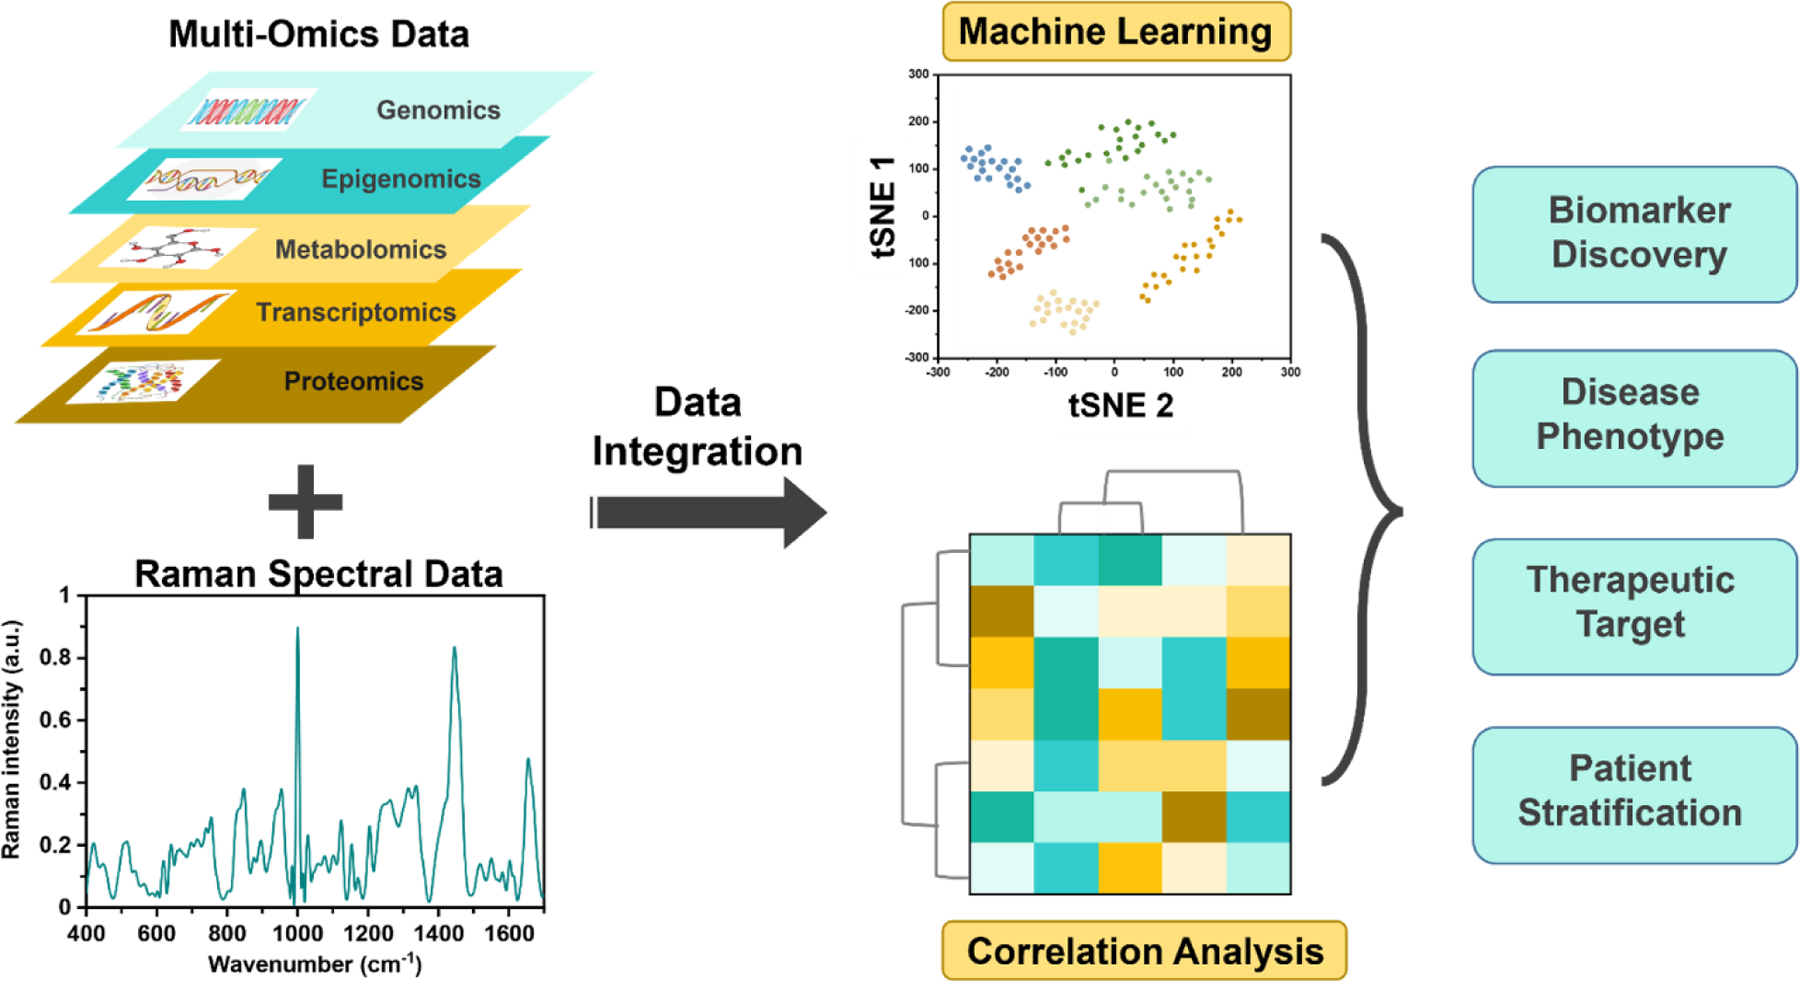
Schematic representation showing integration of Raman spectroscopy with existing Omics approaches aided with machine learning and statistical methods. This multimodal approach could significantly advance our understanding of various disease phenotype, and enable discovery of biomarkers and therapeutic targets for patient stratification.
In section 3.1 (Fig. 4a–d) we highlighted work from our group where RS was used to probe metabolic reprogramming in breast cancer cells and provide treatment response to MEK and PI3K inhibitors. In this study, Wen et al. also combined RS measurements with MS metabolomics and concluded that phospholipids, amino acids, lipids, and fatty acids are the major contributors to metabolic changes in cells post treatment with small molecule inhibitors.145 Specifically the study found in RS a few lipid peaks increased while others decreased, a trend that was corroborated by MS suggesting the complex crosstalk between lipogenesis and pro-oncogenic downstream signaling pathways. In another work Kirchberger-Tolstik et al. demonstrated that RS on its own showed a good capability to identify hepatocellular carcinoma (HCC) tumors but when combined with MS could also accurately distinguish the subtypes of HCC including well, moderately, and poorly differentiated disease.201 Their findings show that the subtypes of HCC are discriminated by significant differences in the expression of glycerophospholipids and fatty acyls during HCC progression. These studies highlight the benefit of integrating MS with RS with the ability to spatially resolve quantitative distribution of metabolites in cells/tissues that can be ultimately harnessed to enable personalized medicine for patients. Whereas most metabolomics studies focus on ensemble measurements, single cell analysis is necessary to understand the fundamental underpinnings that give rise to phenotypic heterogeneity among individual cells.202 Since each cell’s metabolome is highly dynamic and alters rapidly upon cellular activity and environmental changes, single cell metabolic analysis could determine why subpopulations of seemingly similar cells are responsive while others are resistant to treatment. In this effort, Ali et al. screened hepatocellular carcinoma (HepG2) cells with RS to study response to tamoxifen, a clinically-approved drug readily metabolized by liver cells, and correlated the intercellular abundance of tamoxifen and its pharmacologically active metabolite (4-Hydroxytamoxifen, 4-OHT) with MS at the single-cell level.203 Cells cultured with tamoxifen showed increases in the RS intensity of cytochrome bands at 752 cm–1, amino acids at 1001 cm–1, protein peaks at 1651 cm–1, and saturated lipids at 1296 cm–1 and 1445 cm–1. Their combined RS-MS study suggested that metabolism of cytochrome, glycolysis activity, and lipid metabolism is altered in HepG2 cells with tamoxifen treatment.
In addition to metabolomics, RS has also been integrated with transcriptomics to assess a complete set of RNA transcripts leveraging the ability of RS to measure the phenotypic expression of the RNA transcripts. Since alterations in many RNA transcripts is often co-dependent, these correlations between transcripts can be captured by multiplexed Raman signals.204 The correlation between RS and transcriptomics do not imply that RS directly measures the expression levels of the transcripts. Rather RS quantifies how changes to expression levels of large groups of genes subsequently alter the biochemical composition of the cells. In an impactful study, Du et al. employed a series of patient-derived BRAF mutant melanoma cell lines with varying levels of cancer cell differentiation phenotypes ranging from melanocytic (differentiated) to mesenchymal (de-differentiated).25 The metabolic heterogeneity within each single live-cell was effectively captured by RS and used to explore phenotype-dependent druggable metabolic susceptibilities. Specifically, fatty acid synthesis was identified as a pathway that could be targeted for differentiated melanocytic cells. For de-differentiated mesenchymal cells, which have innate resistance to BRAF inhibition, lipid mono-unsaturation was discovered as a druggable susceptibility. RS was integrated with transcriptomics to validate their findings, which showed metabolic genes had a phenotype-dependent expression trend with corresponding functions that span different metabolic pathways (Fig. 8a,b). These examples show that each individual cell’s phenotypic characteristics can be captured by its metabolic transformation that ultimately modulates cellular signaling and disease progression. Le Reste et al. applied RS to stratify different groups in glioblastoma multiforme (GBM), an aggressive form of primary brain tumor, and identified a RS-based signature that correlated well with transcriptomic profiles of GBM and predicted specific tumor features associated with aggressiveness (Fig. 8c,d).205 An interesting finding in their study was the occurrence of strong carotenoid peaks in Raman spectra which were correlated to two genes related to carotenoid metabolism (out of 36 genes signature). This study supports that RS-based transcriptomic profiles may enable intraoperative characteristics of tumors in real-time during surgeries and provide a measure of its aggressiveness allowing rapid clinical decisions with an affordable and timely tool. In another example of RS combined with transcriptomics, Morrish et al. evaluated the subcellular chromatin and transcriptional changes in non-activated and activated B-lymphocytes thereby linking chemical and conformational modifications to biological outcomes.206 In their finding the 786 cm−1 nucleic acid peak in RS distinguished the two cellular cohorts and by leveraging both unsupervised ML (PCA) and supervised ML (LDA), the authors identified non-activated and activated B cells. Further with PLS regression analysis the authors correlated RS findings to transcriptomic profiles and identified the top pathways related to B cell activation that include chemokine signaling pathway, leukocyte activation, and immune cell differentiation among others.
Figure 8.
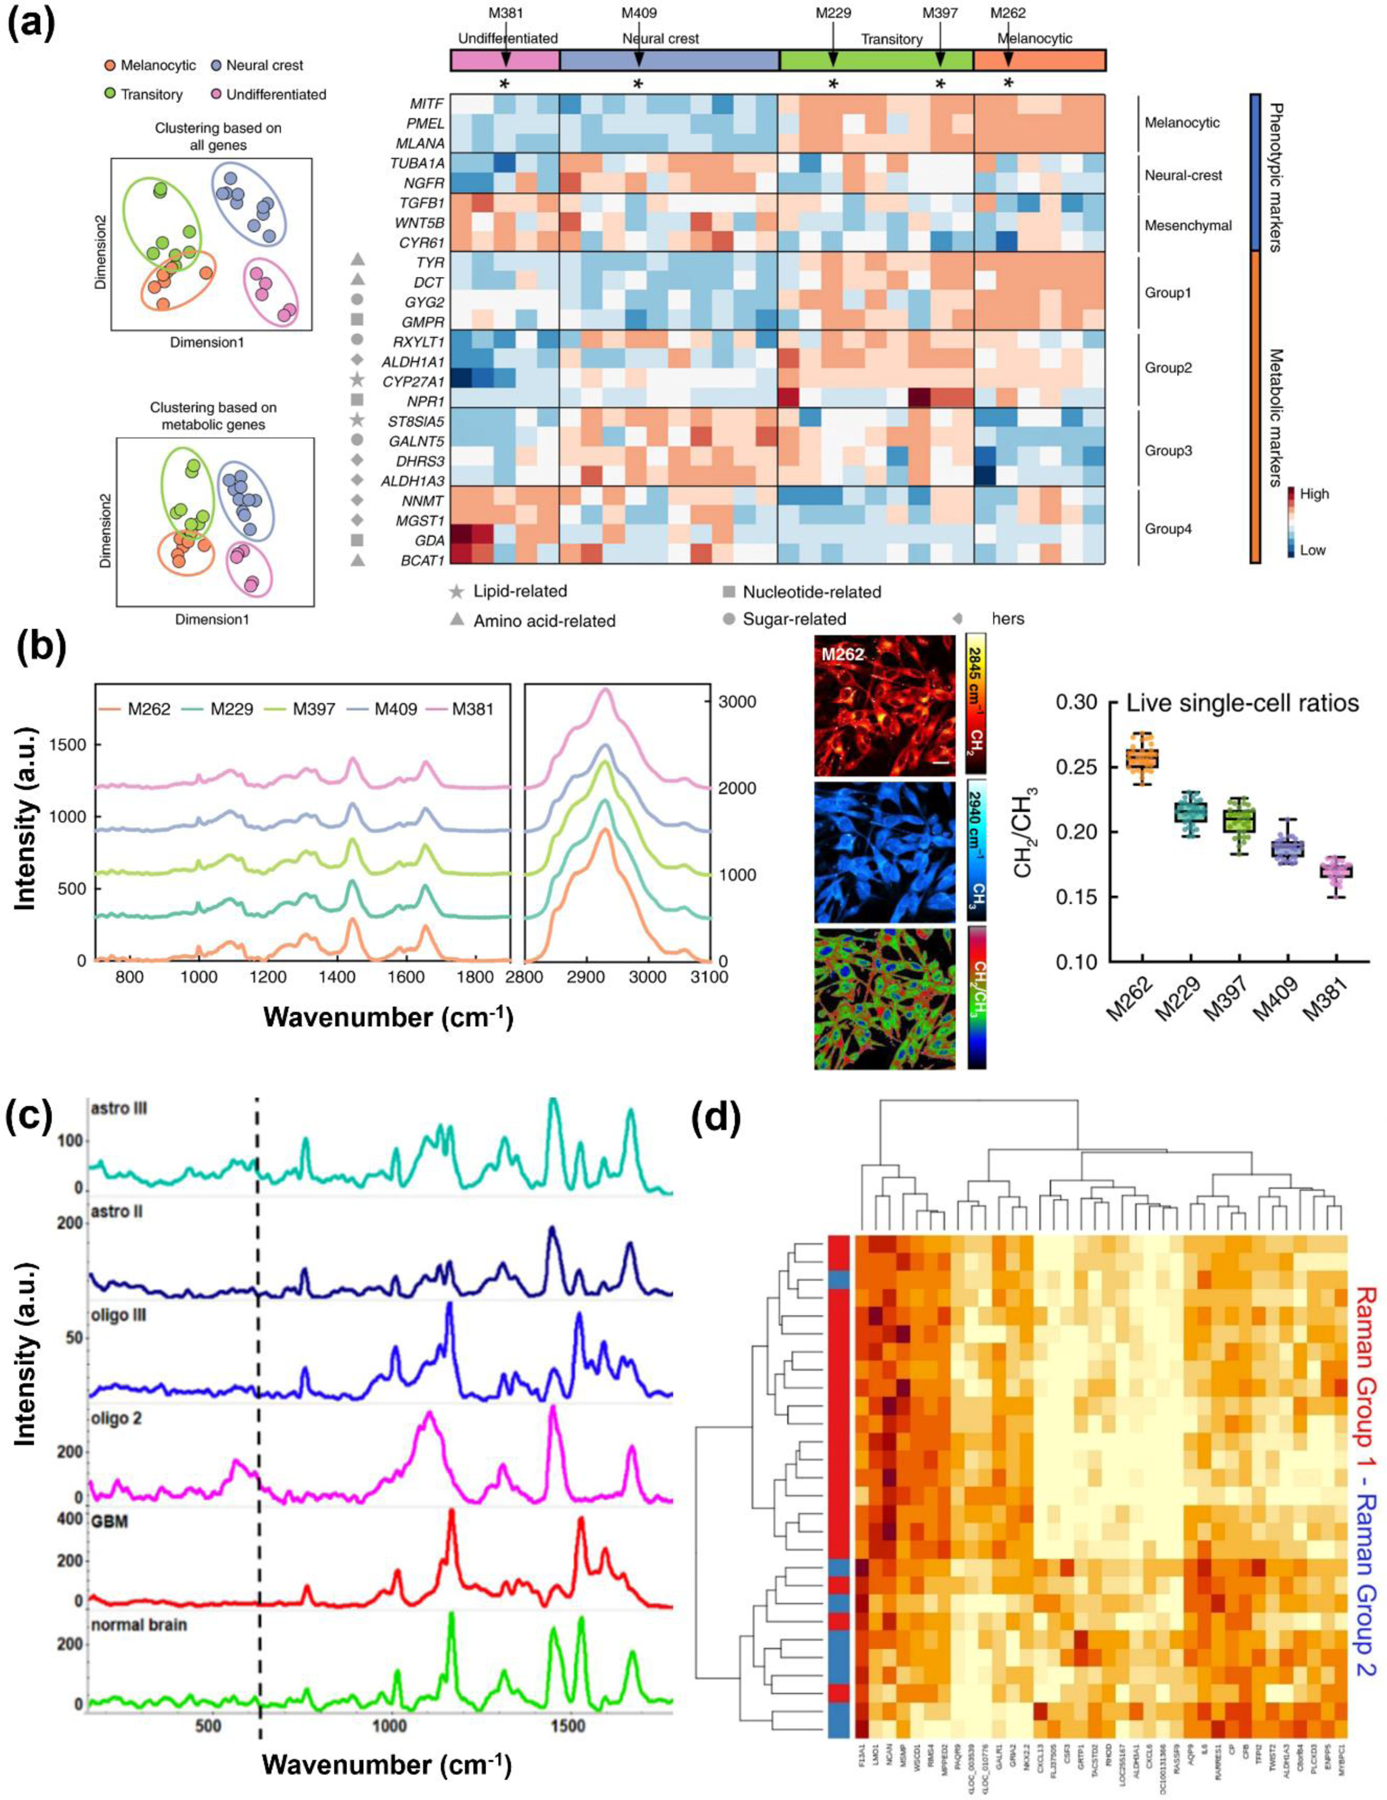
(a) Left: Dimensional reduction of bulk transcriptomics data of 30 melanoma cell lines yields a clear separation of four different melanoma phenotypes, based on either the expression of all genes (top panel) or ~1600 metabolic genes (bottom panel). Right: A heatmap of gene expression levels for representative genes involved in defining the cellular and metabolic phenotypes. The color-coded bars at the top of the heat map indicate the different cellular phenotypes for each cell line, while the arrows point to the five representative cell lines selected for Raman analysis. (b) Left: Raman spectra of five selected cell lines (averaged over 50 spectra from 10 cells per cell line). Each spectrum is offset apart in y-axis with no changes of absolute intensities. Right: Representative live-cell SRS images targeted on the CH2 (top, 2845 cm−1) and CH3 (middle, 2940 cm−1) channels and the CH2:CH3 ratio (bottom) for M262 cell line, and corresponding average live single-cell CH2/CH3 values from the SRS ratio images for each cell line (n = 30 cells per cell line). Adapted from ref 25. Copyright 2020 Springer Nature under CC BY 4.0 license (https://creativecommons.org/licenses/by/4.0/). (c) Raman spectra of brain tumor type: grade III astrocytoma (cyan), grade II astrocytoma (dark blue), grade III oligodendroglioma (blue), grade II oligodendroglioma (pink), GBM (red) and normal brain (green) (d) The heat map representation of gene expression profiles matches the groups formed based on Raman spectra. Gene profiles corresponding to the blue and red groups are indicated. Adapted from ref 205. Copyright 2021 John Wiley and Sons under CC BY 4.0 license (https://creativecommons.org/licenses/by/4.0/).
Raman integrated with omics technologies has also been applied to bacterial cells to understand antibiotic resistance, and in yeast cells to understand impact of environmental exposure. Germond et al. monitored the type of resistance and the mode of action of acquired resistance in a bacterial population of E. coli and found a correlation between Raman signatures and expression levels of antibiotic resistance contributing genes.207 Importantly, this work was conducted without antibiotics indicating that transcriptional profiles of bacteria are impacted upon environmental exposure rather than their phenotypic response to the presence of antibiotics. These changes in transcripts primarily contributed to the Raman spectral changes. This correlation between RS and transcriptomics was further explored in both yeast and bacterial cells where Kobayashi-Kirschvink et al. introduced a linear transformation matrix to predict an environment-specific Raman spectrum based on transcriptomic data at the single-cell level.204 In the yeast study, 17 transcripts were determined to be sufficient for illustrating a linear correlation with the Raman data. The transcripts responsible for the linear correspondence were further evaluated by calculating the variable importance in projection (VIP) score for each transcript. The top transcripts with the highest VIP scores were mainly noncoding RNAs in yeast and ribosome-related transcripts in bacteria.
The examples discussed in this section collectively highlight that RS combined with omics approaches have advanced our understanding of key metabolic and transcriptomic changes that impact the biochemical profile and corresponding cellular pathways in various disease models. However, much of the examples discussed in this section focused on in vitro studies rather than patient samples as the use of RS-omics combined technologies remains nascent. Innovative approaches are imperative that combine RS with less explored omics techniques, as well as thoughtfully designed experiments and advanced ML algorithms are necessary to ultimately leverage the strengths of both RS and omics to dynamically probe disease progression and therapeutic response. In Table 1 we have provided a comprehensive list of papers corresponding to sections 3.1–3.4 where label-free RS based metabolic and biochemical profiling was used for disease diagnostics and treatment response.
Table 1.
Use of label-free Raman spectroscopy (RS) which include spontaneous RS, surface-enhanced RS, stimulated RS, and coherent anti-Stokes RS for metabolic profiling in various diseases.
| Year | Author | Pathology | Sample Type | Raman Type | Reference |
|---|---|---|---|---|---|
| 2022 | Duan et al. | Cancer, AML | Serum | SERS | 78 |
| 2022 | Kanmalar et al. | Cancer, bladder | Tissue, blood, serum, & urine | Raman | 147 |
| 2015 | Jermyn et al. | Cancer, brain | In vivo (human brain tissue) | Spontaneous RS | 304 |
| 2013 | Ji et al. | Cancer, brain | In vivo (mouse brain tissue) | SRS | A |
| 2021 | Contorno et al. | Cancer, breast | Tissue & cells | Spontaneous RS | 113 |
| 2020 | Bendau et al. | Cancer, breast | Tissue | Resonant RS | 114 |
| 2021 | Sabtu et al. | Cancer, breast | Tissue | Spontaneous Raman | 46 |
| 2020 | Wen et al. | Cancer, breast | Cells | Spontaneous RS | 145 |
| 2018 | Aljakouch et al. | Cancer, breast & non-small lung carcinoma | Cells | Spontaneous RS | 150 |
| 2021 | Paidi et al. | Cancer, colon carcinoma | Tissue | Spontaneous RS | 98 |
| 2020 | Guerenne-Del Ben et al. | Cancer, colorectal | Cells | Multiplexed CARS | 54 |
| 2022 | Danil de Namor et al. | Cancer, colorectal | Cells | Spontaneous RS | 146 |
| 2018 | Larion et al. | Cancer, fibrosarcoma & oligoastrocytomas | Tissue & cells | Spontaneous RS | 148 |
| 2019 | Wei et al. | Cancer, glioblastoma | Tissue | Stimulated Raman scattering microscopy | 141 |
| 2019 | Ali et al. | Cancer, hepatocellular carcinoma | Cells | Spontaneous RS | 203 |
| 2022 | Deng et al. | Cancer, lung | Tissue & cells | Spontaneous RS | 151 |
| 2021 | Milligan et al. | Cancer, lung, breast & prostate | Cells | Spontaneous RS | 97 |
| 2021 | Samoylenko et al. | Cancer, renal adenocarcinoma | Extracellular vesicles | Time-gated RS | 115 |
| 2021 | Tanoren et al. | Cardiovascular diseases, aortic aneurysm | Aortic tissue | Spontaneous RS | 177 |
| 2017 | You et al. | Cardiovascular diseases, aortic calcification and atherosclerosis | Aortic tissue | Spontaneous RS | 163 |
| 2016 | Czamara et al. | Cardiovascular diseases, calcific aortic stenosis | Aortic valve tissues | Spontaneous RS | 179 |
| 2018 | Yang et al. | Cardiovascular diseases, coronary heart disease | Urine | SERS | 161 |
| 2017 | Pandey et al. | Diabetes | In vivo | Spontaneous RS and SERS | B |
| 2020 | Ju et al. | Diabetes | In vivo (skin) | SERS | 195 |
| 2012 | Bielecki et al. | GI diseases, inflammatory bowel diseases | Colon tissue | Spontaneous RS | 49 |
| 2020 | Acri et al. | GI diseases, pediatric onset inflammatory bowel diseases | Fecal matter | Spontaneous RS | 155 |
| 2016 | Addis et al. | GI diseases, ulcerative colitis | Colon tissue biopsies | Spontaneous RS | 156 |
| 2021 | Smith et al. | GI diseases, ulcerative colitis and Crohn's disease | Colon tissue biopsies | Spontaneous RS | 158 |
| 2017 | Pence et al. | GI diseases, ulcerative colitis and Crohn's disease | In vivo (endoscopy of colon and rectum) | Spontaneous RS | 160 |
| 2021 | Plesia et al. | Neurodegenerative disorders, ALS & Duchenne muscular dystrophy | In vivo (intramuscular) | Spontaneous RS | 165 |
| 2020 | Carlomagno et al. | neurodegenerative disorders, pALS, Parkinson’s & Alzheimer’s | Saliva | SERS | 73 |
| 2020 | Morasso et al. | neurodegenerative disorders, SALS | Blood, small EVs (sEVs), large EVs (lEVs), and plasma | Spontaneous RS | 82 |
| 2021 | Ami et al. | Neurodegenerative disorders, ALS | Tear samples | Spontaneous RS | 64 |
| 2020 | Zhang et al. | Neurodegenerative disorders, ALS | Plasma | SERS | 83 |
| 2019 | Zhang et al. | Neurodegenerative disorders, ALS | Plasma | SERS | 268 |
| 2016 | Tian et al. | Neurodegenerative disorders, ALS | In vivo (sciatic nerve) | SRS | 166 |
| 2021 | Zhang et al. | Skin studies | In vivo | Spontaneous RS | C |
| 2020 | Yakimov et al. | Skin studies | In vivo | Spontaneous RS | D |
Ji, M.; Orringer, D. A.; Freudiger, C. W.; Ramkissoon, S.; Liu, X.; Lau, D.; Golby, A. J.; Norton, I.; Hayashi, M.; Agar, N. Y.; et al. Rapid, Label-Free Detection of Brain Tumors with Stimulated Raman Scattering Microscopy. Sci. Transl. Med. 2013, 5, 201ra119.
Pandey, R.; Paidi, S. K.; Valdez, T. A.; Zhang, C.; Spegazzini, N.; Dasari, R. R.; Barman, I. Noninvasive Monitoring of Blood Glucose with Raman Spectroscopy. Acc. Chem. Res. 2017, 50, 264–272.
Zhang, R.; Bi, R.; Ho Jun Hui, C.; Rajarahm, P.; Dinish, U. S.; Olivo, M. A Portable Ultrawideband Confocal Raman Spectroscopy System with a Handheld Probe for Skin Studies. ACS Sens. 2021, 6, 2960–2966.
Yakimov, B. P.; Shirshin, E. A.; Schleusener, J.; Allenova, A. S.; Fadeev, V. V.; Darvin, M. E. Melanin Distribution from the Dermal-Epidermal Junction to the Stratum Corneum: Non-Invasive in Vivo Assessment by Fluorescence and Raman Microspectroscopy. Sci. Rep. 2020, 10, 14374.
4. Labeled Surface-enhanced Raman Nanoprobes for Proteomics
4.1. Metal nanoprobe mediated SERS for biomarker detection and treatment response
In the previous section, we discussed the abilities of RS in label-free measurement of metabolites in biological media. This section highlights the abilities of SERS as a molecular imaging technique in protein biomarker detection both in vivo and ex vivo leveraged with monodisperse metal NPs. Molecular imaging in vivo offers multiple advantages relative to traditional clinical pathology and histology approaches that are often limited by poor sensitivity.208, 209 Molecular imaging enables spatially resolved images that allows one to capture dynamic changes in molecular biomarkers in real time in vivo.210, 211 This has been accomplished with conventional clinical imaging modalities such as magnetic resonance imaging (MRI) and nuclear imaging, as well as emerging pre-clinical imaging techniques such as SERS.210 The utility of SERS in vivo has been motivated by its high sensitivity, ability to multiplex in vivo owing to narrow spectral linewidths of Raman reporters, and low interference from tissue auto fluorescence (Fig. 9). These characteristics of SERS are controlled by (i) the properties of the Raman reporter used which include conventional NIR dyes and aromatic small molecule thiols.212 (ii) SERS signal is also governed by the composition of the metal that include both gold and silver NPs, and their morphology such as nanospheres, nanoshells, nanorods, sharp-edge particles like nanocubes and nanocrystals, and multi-branched structures such as nanostars.213, 214 The shape and size of the NPs allows to tune their plasmon resonances in the near-infrared region (700–1400 nm) enabling deep tissue high resolution imaging, and minimizes tissue autofluorescence.215 (iii) SERS efficiency is also controlled by the protective ligands on the NP surface such as silica, polyethylene glycol (PEG), and lipids among others to improve particle stability and biocompatibility, protect Raman reporters from enzymatic degradation, and enhances overall SERS signal.216, 217 (iv) Finally, targeting moieties on the NP surface are key to specific biomarker detection, multiplexing, and to reduce non-specific binding. Antibodies are the most conventional choice for receptor targeting due to their ease of availability, and high selectivity for a given molecular target. Aptamers, peptides, and receptor agonists such as folate, hyaluronic acid, or transferrin are also desirable targeting moieties albeit with less selectivity than antibodies.218, 219 Collectively, the aforementioned features of SERS nanoprobes have catalyzed innovative clinically-relevant applications in diagnosis pushing the detection limits and enabling functionalities not achievable by conventional imaging techniques.
Figure 9.
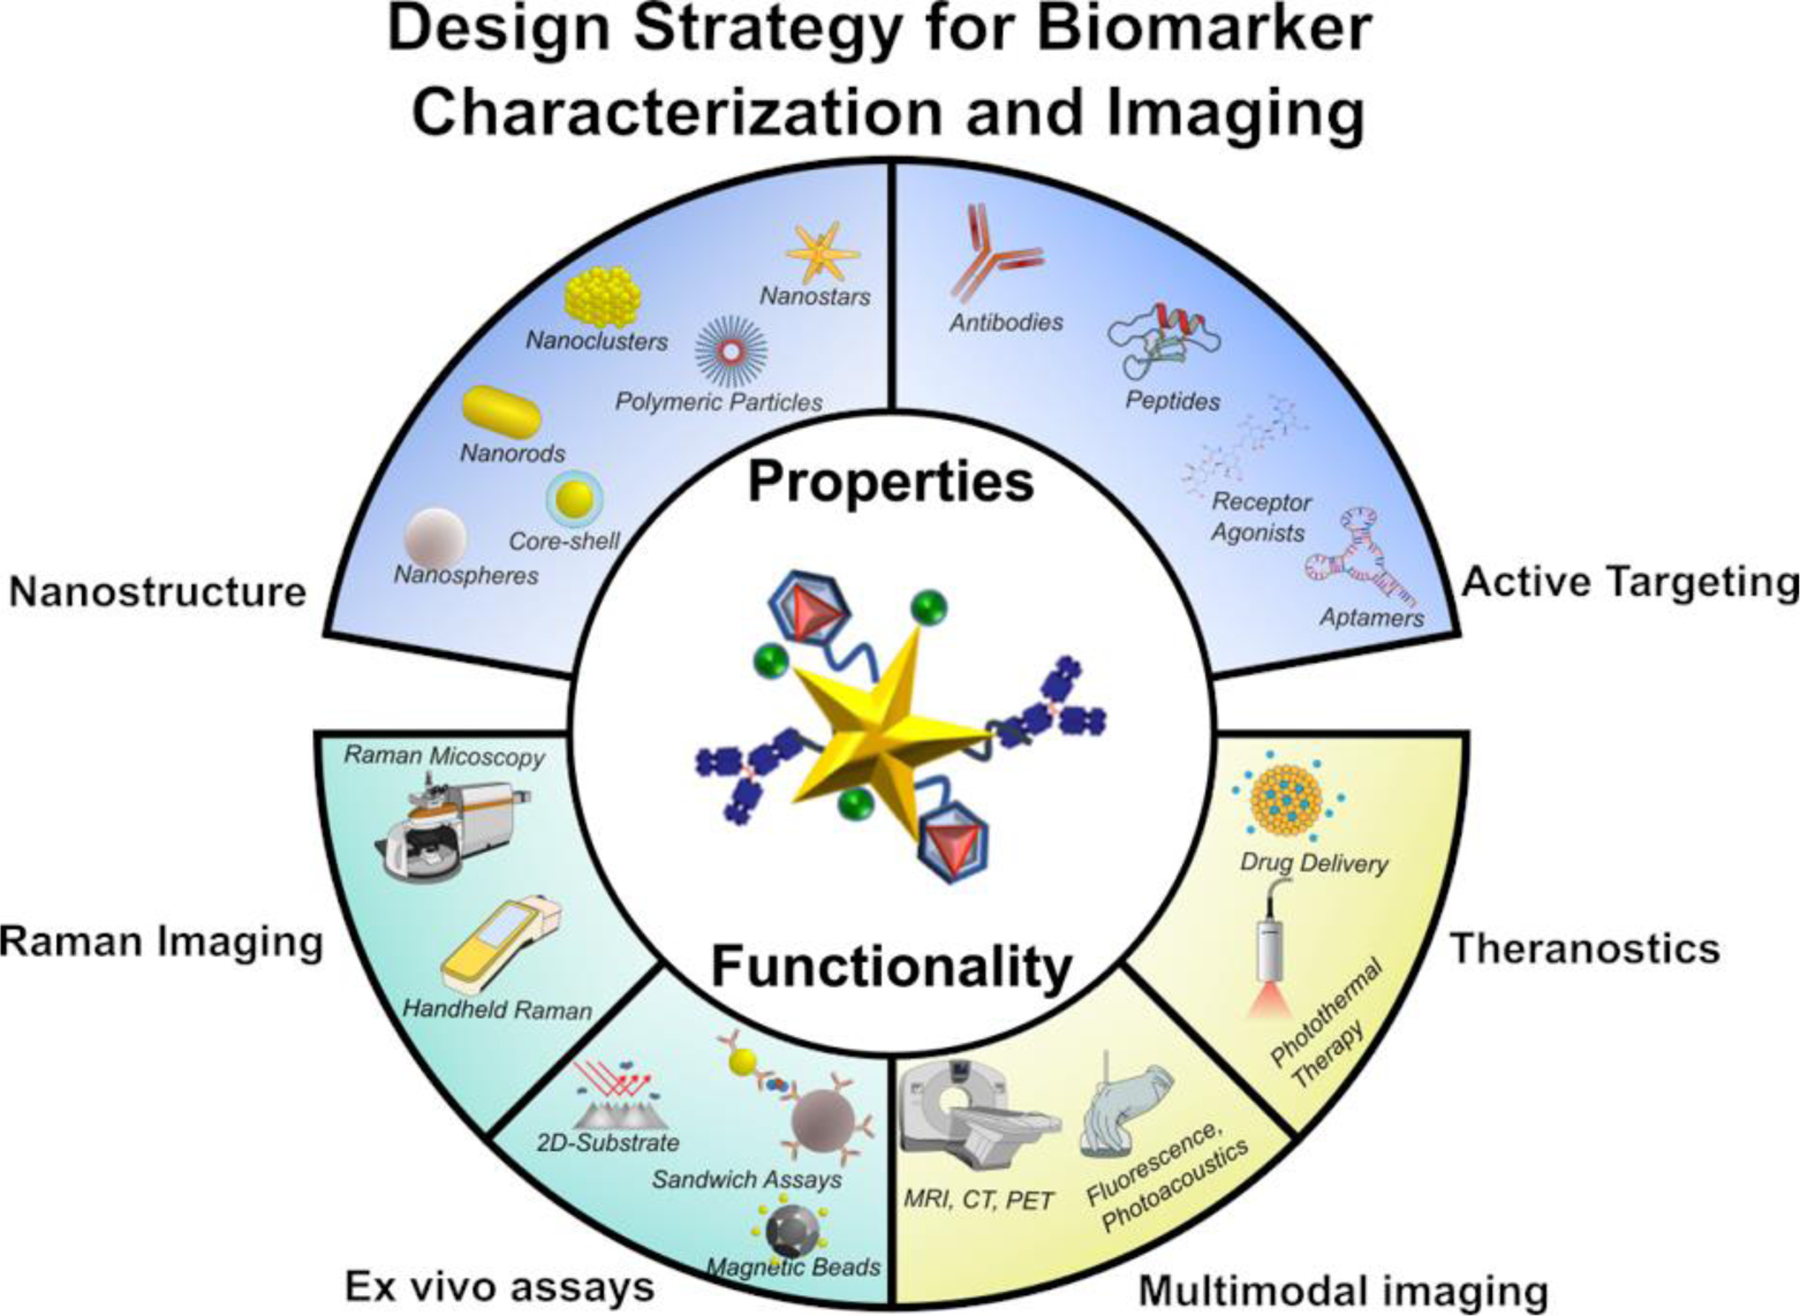
Schematic representation of the principal properties of Raman active nanoprobe design and the resulting functionality from these nanoprobes. The nanoparticles physicochemical properties and surface ligands to achieve active targeting controls efficacy of single modal Raman imaging, multimodal imaging where Raman is combined with other pre-clinical and clinical modalities, ex vivo diagnostic assays, and theranostic abilities that combines therapeutic and diagnostic properties in a single platform.
Many proteins serve as a characteristic biomarker for a specific disease. These proteins are overexpressed in the diseased tissue, such as tumors, that characterizes the pathophysiology of the disease, and are critical for determination of therapeutic options.220 Whereas traditional histological staining and fluorescence-based assays enable multiplexing ex vivo in tissue sections, these approaches can be time and labor-intensive in preparing and analyzing multiple stains or are limited by the number of colors available for tagging different fluorophores.221, 222 SERS imaging is rapid, non-invasive, and can provide real time quantitative measure of biomarkers at high resolution in the targeted tissue surpassing limitations of current clinical modalities. Our group has shown SERS based multiplexing in whole tumor sections ex vivo can capture spatial distribution of multiple biomarkers at a near-single cell resolution achieved within a single imaging session that corresponded well with histology.223 In our group’s work, Ou et al. delivered a mixture of two types of gold nanostars in vivo via intravenous delivery. The nanostars were conjugated with Raman tags and antibodies to target the biomarkers EGFR and PD-L1, and were subsequently imaged in retrieved tumors ex vivo. A study by Wang et al. also demonstrated detection of five biomarkers in tissue slices with the SERS nanoprobes directly stained in the tissue ex vivo using an automated staining device, the process mimicking a histopathology approach for biomarker evaluation.224 Despite the wealth of information, ex vivo SERS imaging cannot predict the dynamic and complex interplay between the different cell types in the tumor microenvironment and therefore detection of multiple biomarkers simultaneously in vivo is highly desirable. In this section we specifically discuss examples where SERS have enabled in vivo imaging in mouse models (and large animals) with clinically-relevant findings, and we highlight where SERS was combined with clinical modalities to capture the potential of SERS in clinically significant applications. Further we also summarize in vitro assays in serum samples and other patient biospecimens where SERS has enabled detection limits that surpass clinical approaches.
Early work on SERS in vivo focused primarily on imaging one or two molecular targets but recent findings have leveraged the exceptional multiplexing ability of SERS and identified >10 molecular targets simultaneously in vivo. In a recent work by Gambhir and co-workers, the authors created a multispectral palette of gold multicore silica shell NPs with Raman reporters adsorbed on the gold core, and demonstrated noninvasive five-plex SERS imaging of the NP accumulation in tumors in vivo.225 A ratiometric combination of the five color palette NPs enabled longitudinal imaging in tumors allowing detection of multiple biomarkers with different expression levels in the tumors. In a similar work, Bock et al. used silica-gold NPs as SERS signal enhancers and produced a library of 14 nanoprobes with Raman peaks that were clearly distinguishable in vivo.226 Their design had an inverse architecture compared to the previous study; there the authors used a silica core coated in gold nanospheres where the gaps between the nanospheres enhanced the SERS signal of Raman reporters. The NPs were detectable through up to 7 mm of tissue and down to a 16 ug/ml concentration in peripheral tissue. In a recent work by Eremina et al., the authors pushed the limits of SERS multiplexing by detecting 26 distinct SERS labels in vivo with gold core silica-shell NPs conjugated to distinct aromatic Raman reporters.227 Using a library of the Raman spectra of all 26 nanoprobes and fitting them to a non-negative least squares algorithm, they successfully performed deconvoluted SERS imaging of a mixture of the 26 nanoprobes that had passively accumulated in the tumor. A subset of the nanoprobes were conjugated with antibodies to allow for active targeting of characteristic molecular targets and were used to distinguish five distinct cell lines in vitro. Whereas the authors did not show detection of biomarkers in vivo via active targeting, this proof-of-concept study with highly multiplexed systems demonstrates the possibility of SERS to move towards clinically-relevant applications with further optimization of signal in vivo. A major challenge in SERS is that the SNR in vivo must compete with the autofluorescence background and native Raman peaks of biological samples (see Fig. 1b). Many conventional Raman reporters have signature peaks within the biological fingerprint region complicating data interpretation. Therefore, recent work has focused on the design of bioorthogonal reporters that possess strong Raman peaks in the biological Raman silent region (1740–2800 cm−1). Zou et al. developed bioorthogonal SERS reporters for multiplexed biomarker characterization based on a graphene-isolated-Au-nanocrystal (Fig. 10a).228 Through this approach they achieved strong SERS signal in the silent region induced by the strain of the deformed graphene shell. The Raman peak position of the graphene reporter was adjusted between 2600 – 2706 cm−1 by varying the fractions of carbon isotopes (C12 vs. C13) to enable five “color” multiplexing in a basic c. Elegans in vivo model. The nanoparticles were further functionalized with a PEG-lipid layer for biocompatibility, and aptamers for targeting specific receptors enabling background-free high contrast in c. Elegans pseudocoel, digestive system, and reproductive system (Fig. 10b). In another work Wang et al. also showed the application of bioorthogonal SERS in the multiplexed detection of three biomarkers using gold nanoflowers with heterogeneous targeting moieties that included RGD peptide for integrins, AS1411 aptamer for nucleolin, and antiCD44 antibodies for CD44 receptors.229 Through these distinct targets they distinguished between MDA-MB-231, a triple negative breast cancer cell line, and MCF-7, breast cancer cell line positive for estrogen, progesterone, and glucocorticoid receptors, in vitro. These cells showed different levels of expression of the target biomarkers, allowing for this discrimination. This functionality was translated into murine tumors and the differences in these protein expression levels were also captured in vivo with SERS.
Figure 10.
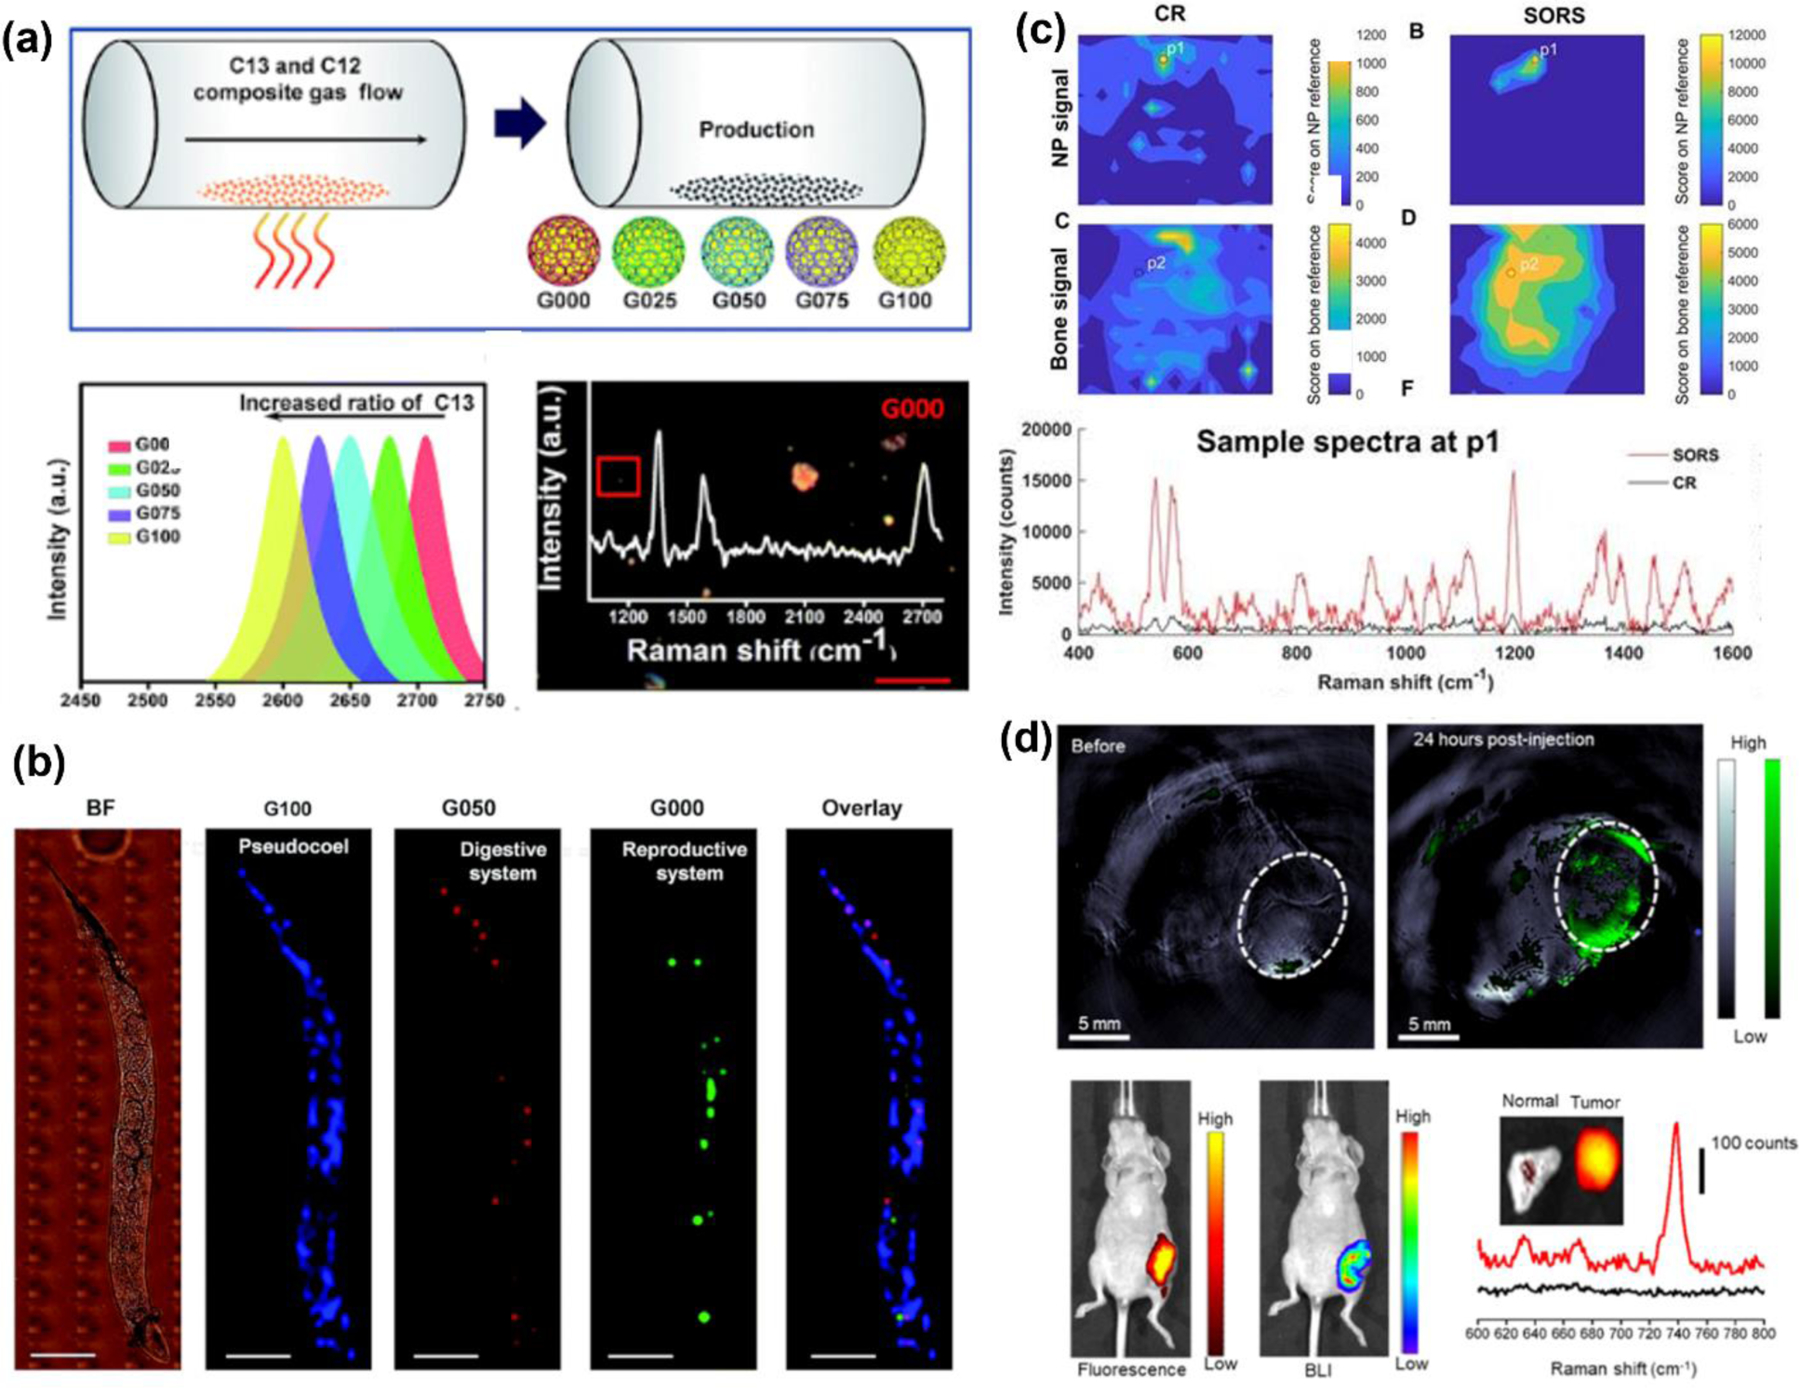
(a) Graphene isolated gold nanocyrstals are synthesized via carbon deposition onto gold nanocrystals. The ratio of C12 to C13 in the graphene shell modulates the bio-orthogonal Raman signal. (b) Multiplexed imaging in c. elegans without overlap of Raman active nanoparticles and minimal background interference. Adapted from ref 228. Copyright 2018 Royal Society of Chemistry under CC BY 3.0 license (https://creativecommons.org/licenses/by/3.0/). (c) SORS imaging with gold nanostar Raman nanoprobes for imaging through a murine skull in vivo. Adapted from ref 230. Copyright 2019 Ivyspring International Publisher under CC BY 4.0 license (https://creativecommons.org/licenses/by/4.0/). (d) DNA-functionalized gold nanorods with folate moieties enable multimodal diagnostics in vivo in murine breast tumors including photoacoustic imaging for depth-resolved pre-operative imaging, fluorescence and bioluminescence for intra-operative imaging, and Raman spectroscopy for ex vivo post-operative imaging. Adapted with permission from ref 242. Copyright 2022 American Chemical Society.
In addition to these innovative bioorthogonal nanoprobes, improvement in SERS signal in vivo has also been achieved with advanced imaging strategies that reduces or avoids biological noise in the Raman systems used to collect spectral data. Nicolson et al. utilized SORS to perform in vivo imaging of brain tumors through the skull of a mouse model.230 SORS enables collection of Raman scattered photons by offsetting the point of light source (laser) from the point of the photon collection, and this lateral shift allows to collect signal from deeper penetrating photons (Fig. 10c). Therefore, SORS allows higher SNR than conventional Raman imaging, which collects signals from the same point as the point of illumination.16 Nicolson et al. used this SORS approach and gold nanostar nanoprobes conjugated with Raman reporters and RGD peptides for targeting integrin receptors overexpressed in murine glioblastoma. The authors demonstrated the collection of Raman spectra at high resolution through 7 mm of thick skull tissue. Such deep tissue Raman signal collection through interfering substrates such as bones would not be possible with the use of conventional RS. In another advanced imaging approach, Strobbia et al. showed the utility of shifted-excitation Raman difference spectroscopy (SERDS) for tumor imaging in vivo.231 SERDS leverages the use of a laser source that enables two slightly shifted emission lines similar to the bandwidth of the Raman peaks being studied. The resulting spectra with these emission lines only differ in the wavenumbers of the Raman peaks with minimal modifications of any signal from the background. Therefore, the difference between these spectra will only capture Raman spectral information without interference from fluorescence background. Using SERDS and passively targeted NPs, the authors showed intraoperative imaging in a well-lit room with a hand-held Raman device. This approach shows potential for enabling RS in clinical settings, such as in surgical operations, by reducing the need of room darkening to capture accurate background-free in vivo signals.
SERS has also been leveraged beyond the static characterization of protein biomarkers allowing longitudinal tracking of dynamic changes in biomarkers to assess treatment response or resistance. This is particularly relevant to address patient-to-patient disease heterogeneity. Therefore, direct in vivo assessment of therapeutic response in real time is key to enable rapid clinical decisions for patient-tailored therapies and improve patient outcomes. Towards this effort, Sujai et al. developed a gold nanorod-based theranostic platform utilizing SERS to measure NP accumulation and drug release following photothermal therapy (PTT) and photodynamic therapy (PDT) in melanoma tumors.232 To enhance the SERS signal, the gold nanorods were coated with a BSA-gold nanoclusters, and melanoma cells were targeted with antiDR-5 antibodies and dacarbazine (DAC), a chemotherapeutic agent. In their unique approach, the photosensitizer squaraine and DAC molecules served as multiplexed Raman reporters and therapeutic agents, and they monitored the signature Raman peaks in real-time as a measure of drug release following laser exposure. Noonan et al. also demonstrated treatment response to recombinant human TNF-α to quantitatively measure the inflammatory response of cells and arterial tissue in vivo.233 SERS nanoprobes consisting of gold NPs labeled with Raman reporters, PEG as a protectant, and antibodies to target ICAM-1, VCAM-1, and p-Selectin enabled quantitative multiplexed signal mapping in tissues showing increases in the expression of these proteins in response to TNF-α treatment. Quantitative SERS showed a strong linear correlation with immunofluorescence signal density at the same levels of TNFα validating SERS signal. In vivo treatment response in grafted human arterial tissues in murine models showed quantitative differences between TNF-α treatment and control groups capturing the degree of inflammation in treated mice. In a different approach, Kang et al. implemented SERS nanoparticles in drug discovery to test the in vivo specificity of candidate antibodies.234 The authors designed multilayered silica-gold-silver-silica NPs to enable high SERS signal with the utility of both gold and silver. The NPs were functionalized with heptamethine-backbone NIR dyes as Raman reporters and a number of distinct antibodies were conjugated to determine the ideal candidate with high affinity for tetraspanin-8, an emerging therapeutic target in colon cancer. SERS mediated evaluation in vitro and in vivo in tumor xenografts identified the most promising antibody candidate. Further, they validated the in vivo SERS findings with clinical SPECT/CT imaging with radiolabeled antibodies demonstrating that pre-clinical SERS has the potential to compete with conventional imaging modalities.
4.2. Multimodal SERS integrated with other imaging techniques.
Whereas SERS in vivo has shown tremendous promise as a pre-clinical approach, synergistic integration of SERS with clinical imaging techniques as a multimodal platform is highly desirable to leverage the high sensitivity and multiplexing capabilities of SERS while overcoming its limitations in whole-body and depth-resolved imaging. Table 2 shows the advantage of integrating SERS with other imaging modalities and leverage multiple functionalities. The integration of multiple imaging modalities on the same platform is largely governed by innovation in the nanoprobe design where multiple molecular labels are decorated on a nanoparticle without compromising the functionality of each label while considering the safety, biocompatibility, and stability of the nanoprobe. Here we will highlight the combination of SERS with other optical techniques and other clinically-established techniques that have advanced the capabilities of each approach towards clinically-relevant diagnostics.
Table 2.
Characteristics of various pre-clinical and clinical imaging modalities that have been combined with Raman spectroscopy for multimodal diagnostics.
| Technique | 3D | Spatial Resolution | Temporal Resolution | Sensitivity | Deep Tissue Imaging | Multiplexing |
|---|---|---|---|---|---|---|
| Fluorescence | X | X | X (Limited) | |||
| Photoacoustics | X | X | X | |||
| MRI | X | X | X | |||
| CT | X | X | ||||
| PET | X | X | ||||
| Raman | X | X | X | X |
SERS has been combined with optical techniques including fluorescence and photoacoustic imaging to enable light-controlled multimodal platforms. Fluorescence imaging is based on molecules emitting photons as they relax from excited to ground state.235 In photoacoustic imaging (PAI) laser source induces ultrasound waves in soft tissue enabling deep-tissue diagnostics not possible with SERS alone.236 Most light-based imaging techniques has not been widely adopted in clinic due to limitations of light penetration through tissue. However, their ease of use, rapid readout, and low costs has propelled recent clinical interest in diseases that are accessible through the skin including arthritis, systemic sclerosis, skin cancer, and visualization of nerves.237–240 Therefore, these optical approaches combined with SERS can be leveraged for targeted diseases for multiplexed molecular profiling with higher sensitivity and specificity in vivo. Cha et al. demonstrated that dual-modal PAI-SERS using “bumpy” silver nanoshells enabled sentinel lymph node imaging in a rat model.241 The bumpy surface of the nanoshells enhanced SERS signal of reporters, and additional coatings with silica and bovine serum albumin improved stability and biocompatibility. The nanoshells were delivered in vivo subcutaneously and lymphatic trafficking was monitored with PAI with a 680 nm laser wavelength followed by multiplexed biomarker identification in the lymph nodes with a portable Raman. In a more ambitious approach, Pal et al. combined photoacoustic, fluorescence, and SERS with DNA-functionalized gold nanorods with folate moieties to target breast cancer tumors, and IR780 served as a multimodal reporter for all three imaging modalities and as a PTT agent (Fig. 10d).242 This highly multifunctional system allowed depth-resolved pre-operative imaging with PAI, intraoperative imaging with fluorescence, and post-operative tumor imaging with Raman for comprehensive information. This work is an excellent example that shows that the successful implementation of multimodal nanoprobes is governed by the choice of the nanoparticle for signal enhancement, the choice of imaging modalities that complement each other, and the selection of a reporter that can achieve multiple functionalities. In a similar approach, Wang et al. combined PAI and SERS leveraging the higher penetration depth and exposure of the second NIR window (1000–1350 nm) with unique nanoporous gold probes developed using liposomes as templates.243 The nanoporous gold was loaded with anticancer agents, labeled with 4-ATP as a Raman reporter and coated with hyaluronic acid as a surface stabilizer and targeting moiety against CD44 receptors overexpressed in tumors. Longitudinal in vivo imaging with PAI and ex vivo Raman mapping enabled targeted detection in tumors and elucidated the intratumoral distribution of these nanoprobes.
Whereas combining SERS with optical techniques has shown merit in imaging peripheral tissues and some improvements in depth resolution, SERS integration with clinically-established modalities is highly appealing to push Raman spectral techniques to the clinic for patient tailored diagnostics (see Table 2). A number of impactful works have now combined SERS with magnetic resonance imaging (MRI), positron emission tomography (PET), and computed tomography (CT). Such multimodal systems enabled by thoughtfully-designed multifunctional nanoprobes allow holistic information in vivo from biomarker tracking and treatment response to surgical guidance and margin assessment for facilitating pre-, intra- and postoperative procedures.
In a work by Zhu et al., MR/SERS imaging was performed with GNPs coated with Prussian blue (PB) and sequential layers of poly-l-lysine for stability and hyaluronic acid for targeting CD44 receptors.244 The PB crystal’s iron ions served as a metallic contrast agent for MRI, and the crystal’s cyanide bridges allowed bioorthogonal Raman signal in the silent region. After systemic delivery of the NPs in mouse models of breast cancer tumors, MRI tracked depth-resolved NP accumulation in tumors, and in vivo SERS maps confirmed NP localization in the tumor periphery. The utility of gold NPs also allowed for PDT and PTT in tumors as an added benefit. In a similar approach, Zhang et al. also used PB assembled on gold NPs as a dual MR/SERS contrast agent to track activated dendritic cells (DCs) in a mouse model in vivo.245 In their unique approach, the PB nanocrystals were doped with gadolinium to further enhance the MR contrast and then decorated on the gold NPs alongside a model antigen (Fig. 11a). DCs were labeled ex vivo with these nanoparticles, subcutaneously delivered in vivo, and were followed by longitudinal tracking of the DCs with MR as they were trafficked via the lymphatic system. SERS maps of resected lymph nodes confirmed localization of the labeled DCs enabling evaluation of both treatment response from DCs transfer and activation of the treated cells via the model antigen bound to the nanoparticles (Fig. 11b). In an image-guided therapy approach, Shi et al. developed an “all-in-one” nanoparticle combining SERS, MR, and CT imaging and dual therapeutics including drug delivery and PTT.246 The authors used gold core-silica shell gap-enhanced NPs loaded with Raman reporters, gadolinium for MR contrast, folate for receptor targeting, and ibrutinib, a small molecule oral drug used for treating lymphomas and lymphocytic leukemias. While MR/CT facilitated preoperative location of the tumor, SERS enabled intraoperative accuracy, and this was followed by PTT and CAR-T cell therapy allowing a highly effective multivalent treatment.
Figure 11.
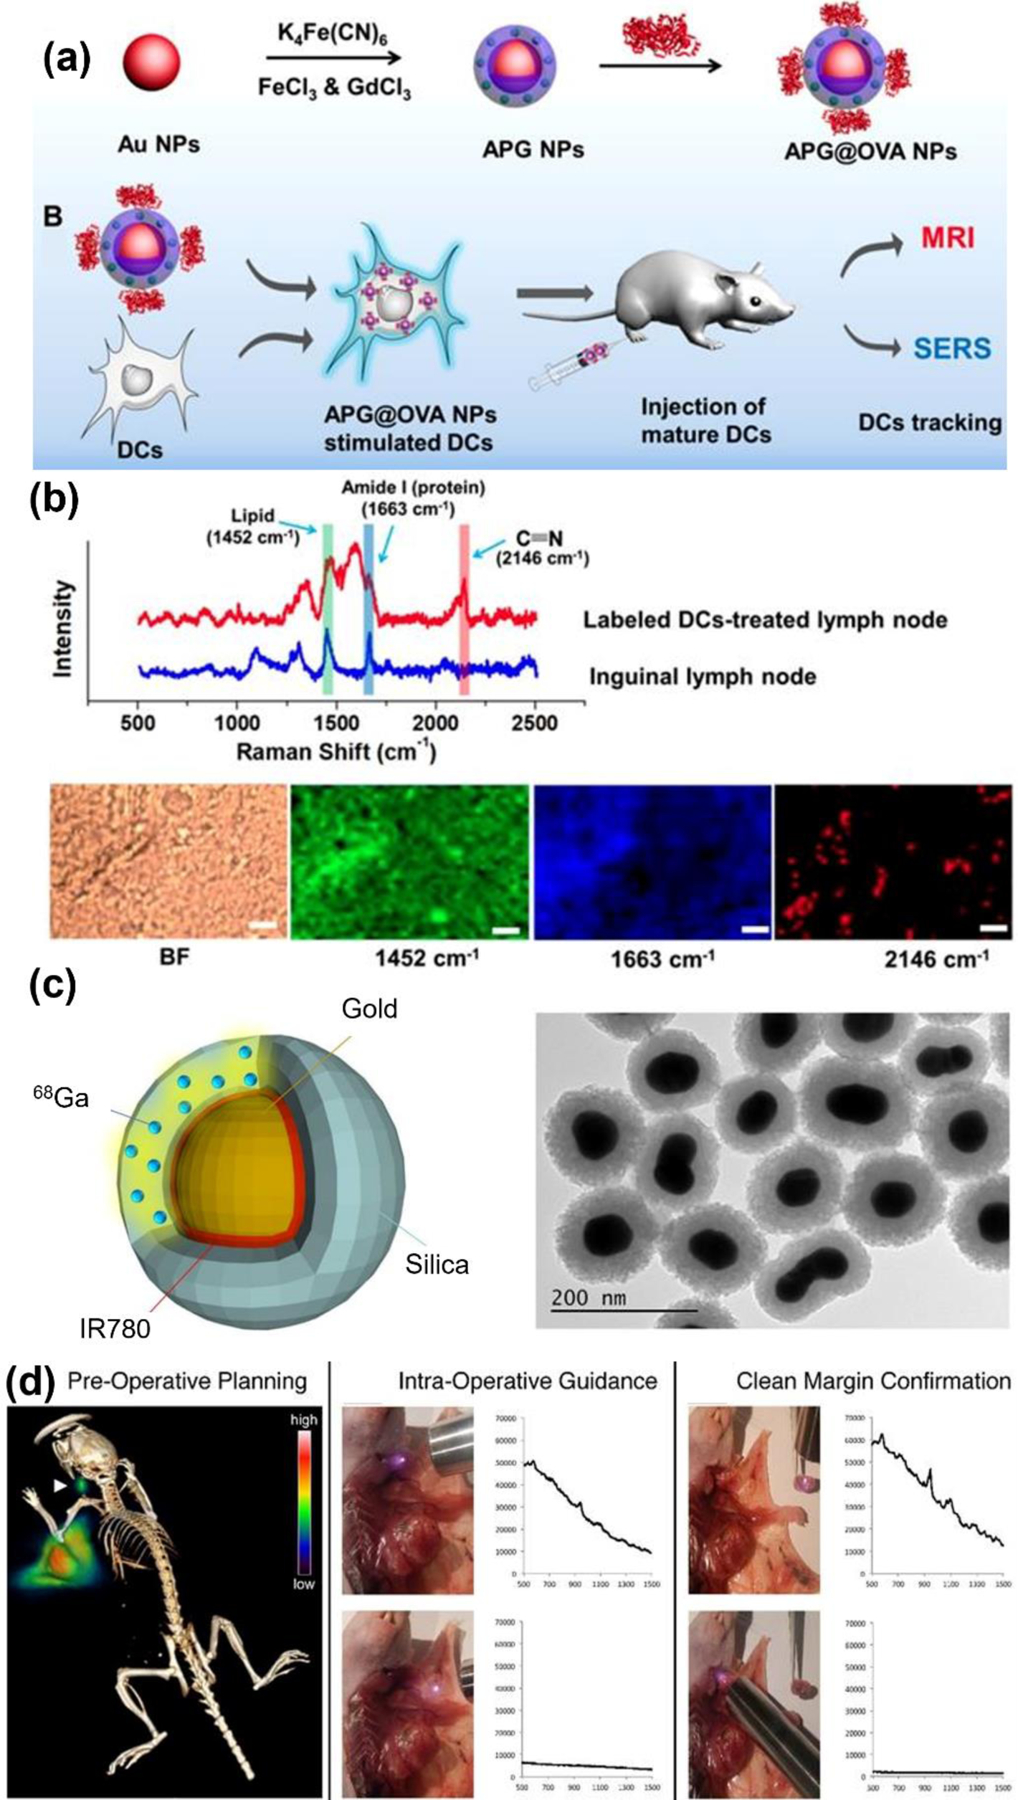
(a) Schematic showing synthesis of the Au NPs assembled with prussian blue and OVA NPs activation of dendritic cells and SERS/MR bimodal tracking. (b) Raman imaging of the inguinal lymph node from the mice treated with NPs labeled BMDCs. Also shown are the bright-field (BF) images of the tissues, Raman maps acquired in 1451, 1665, and 2146 cm −1 channels. Scale bar, 20 μm. Adapted from ref 245. Copyright 2020 Ivyspring International Publisher under CC BY 4.0 license (https://creativecommons.org/licenses/by/4.0/). (c) Schematic of PET-SERRS NPs with gold nanoparticle core, adsorbed layer of Raman active molecules (IR-780), and a silica shell with a radionuclide (68Ga) embedded throughout. Bottom: TEM of the complete PET-SERRS nanoparticles. (d) Left: Lymph node tracking with PET-SERRS NPs showing PET-CT image 4 h after the NPs were injected around the periphery of an orthotopic 4T1 breast tumor; lymph node shown with arrowhead. Middle: SERRS spectrum of NPs in vivo in the cervical lymph node tracked with a handheld Raman scanner. For intraoperative guidance of resection of lymph nodes. Right: After resection, the handheld scanner was used to confirm that the SERRS spectrum is only detected in the excised tissue, indicating clean margins in the resection bed. Adapted from ref 248. Copyright 2020 Ivyspring International Publisher under CC BY NC 4.0 license (https://creativecommons.org/licenses/by-nc/4.0/).
PET/CT is also a well-established clinical imaging modality where positron emission decay of radioisotope tracers allows highly sensitive and deep tissue 3D tomographic imaging.247 Single-channel PET imaging can be deconvoluted via multichannel SERS through selectively trafficked NPs. For example, Wall et al. applied multimodal PET/SERS with gold core-silica shell NPs labeled with 68Ga radiotracer and IR780 Raman reporter (Fig. 11c).248 The NPs were injected at the tumor periphery in murine breast and liver cancer models and were locally trafficked by the lymphatic system. The authors demonstrated that such multimodal NPs enable preoperative planning via PET/CT scan of tumor and lymphatic sites, intraoperative guidance for resection of the target lymphatic tissue, and post-operative margin confirmation to ensure complete removal of tumors (Fig. 11d). In our group’s work, Ou et al. demonstrated treatment response to combinatorial immunotherapy with PET/CT/SERS multimodal multiplexed imaging by simultaneously tracking both CD8+ T cells and PD-L1 expressing cancer cells directly in vivo.249 In this design, two sets of gold nanostars were synthesized with each conjugated to a different Raman reporter. 5,5’-dithiobis-(2-nitrobenzoic acid) (DTNB) and para-mercaptobenzoic acid (pMBA) were chosen to minimize signal overlap in vivo (Fig. 12a,b). This step was followed by functionalization with antiCD8 and antiPD-L1 antibodies respectively to target the specific cell types (CD8+ T-cells and cancer cells) and functionalization with DOTA (dodecane tetraacetic acid) to chelate a 64Cu radiotracer. Our group found that the order of the chemistry on gold nanostars has a huge impact on the overall stability of the nanostars, the targeting ability in vivo, and chelation efficiency and PET sensitivity. Mice bearing immunotherapy responsive YUMM 2.1 melanoma tumors were treated with a combinatorial PD-L1 + CD137 checkpoint blockade (a total of 3 doses), which was followed by systemic delivery of the functionalized nanostars. Whole-body PET/CT showed nanostar trafficking and selective accumulation in tumors, and multiplexed SERS in vivo from the two Raman reporters (DTNB and pMBA) confirmed recruitment of cytotoxic CD8+ T-cells and changes in PD-L1 levels simultaneously (Fig. 12c–e). Our study also showed that nonresponsive RICH 1.1 melanoma tumors saw no PET/SERS signal differences relative to control mice after treatment validating the specificity, sensitivity, and accuracy of this approach in measuring treatment outcome. The in vivo imaging findings were validated with flow cytometry and immunohistochemistry to confirm immune cell infiltration (Fig. 12f). A number of other studies where SERS in vivo as single modal imaging and combined with complementary techniques as multimodal imaging are summarized in Table 3.
Figure 12.
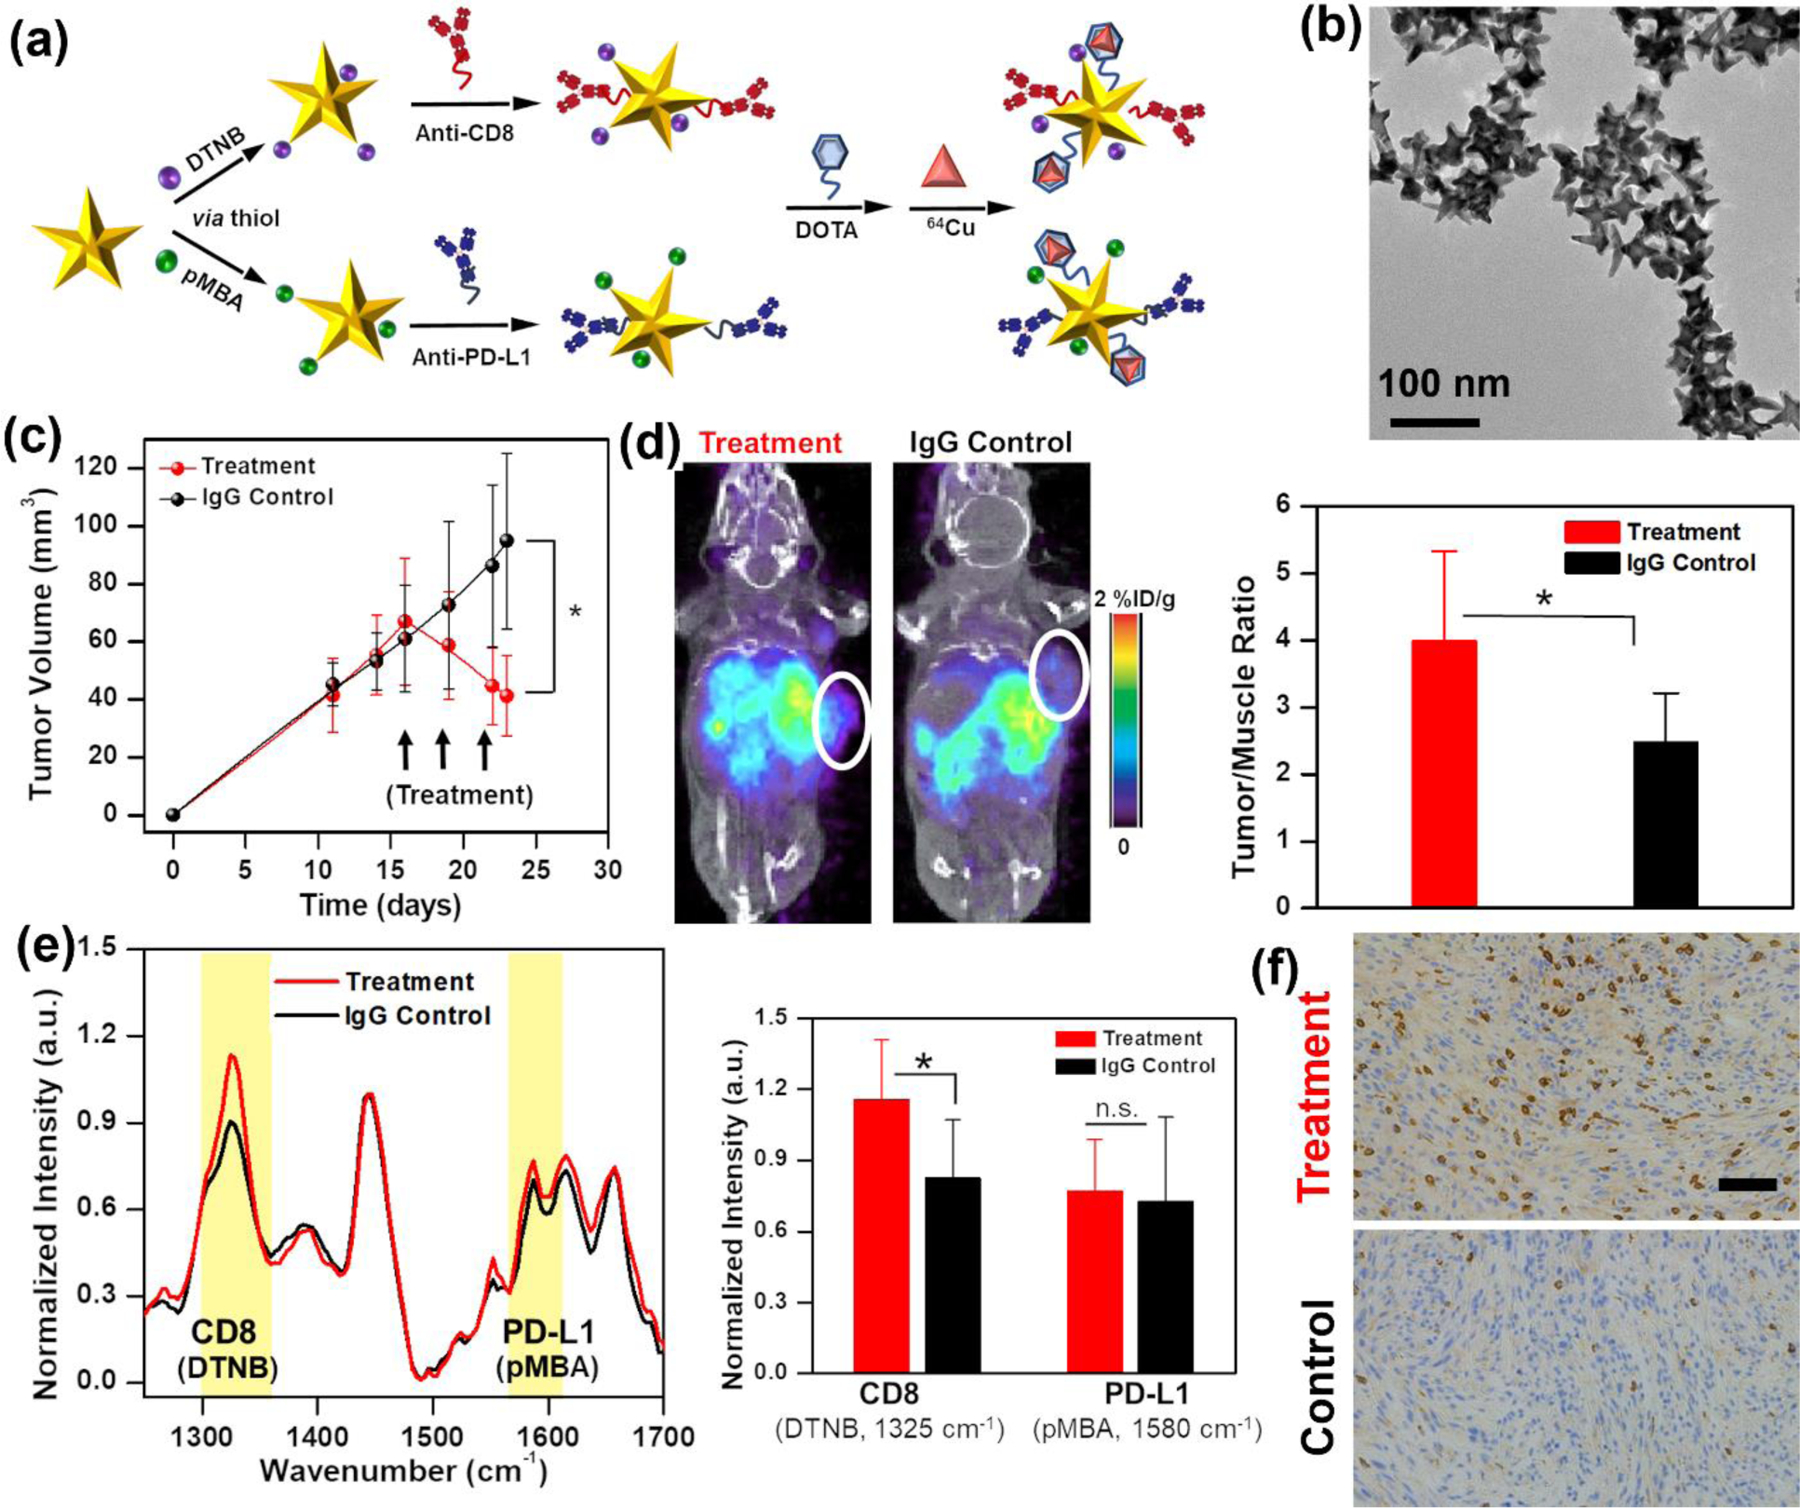
(a) Our group’s work showing the design of gold nanostars labeled with Raman reporters, targeting antibodies, and 64Cu radiolabel chelated with DOTA via PEG-lipid linkers for imaging of CD8+ T cells and PD-L1+ tumor cells. (b) Corresponding TEM image of functionalized gold nanostars. (c) Melanoma tumor bearing mice were treated with immunotherapies and isotype matched antiIgG as control. The tumor volumes are shown. (d) PET/CT images (left) and quantification (right) show higher signal of functionalized nanostars in treatment mice. (e) Raman spectra (left) and corresponding quantification (right) show increased accumulation of T cells targeting nanostars in the tumor site that corresponds well with (f) immunohistochemistry of CD8+ T cell recruitment in tumors of treatment mice. Adapted with permission from ref 249. Copyright 2020 American Chemical Society.
Table 3.
Use of labeled Raman spectroscopy (RS) with Raman reporter labeled NPs and integrated with other imaging modalities for biomarker detection. Techniques include surface enhanced RS (SERS), spatially-offset RS (SORS), and shifted-excitation Raman difference spectroscopy (SERDS). PET: positron emission tomography; PAI: photoacoustic imaging; MRI: magnetic resonance imaging; CT: computed tomography; PTT: photothermal therapy.
| Year | Authors | Pathology / Objective | Probe | Complementary Techniques | Summary | Ref. |
|---|---|---|---|---|---|---|
| 2017 | Jiang et al. | Bone crack | Gold nanospheres coated in polymer PDA. | None | PDA coating allowed for selective NP accumulation in bone crack, allowing for detection via SERS. | A |
| 2021 | Strobbia et al. | Cancer, Bladder | Silica-Silver-coated gold nanostar with Raman reporters | None | SERDS allows for comprehensive background subtraction. Nanoparticles allowed for tumor identification via enhanced permeability retention. | 231 |
| 2019 | Jin et al. | Cancer, Breast | Series of poly(methacrylate) polymeric beads | None | Targetable polymeric beads were synthesized to be Raman active nanomaterials - here it was poly(methacrylate) monomers with different moieties | 285 |
| 2020 | Zhu et al. | Cancer, Breast | Prussian Blue-labeled gold nanosphere | PTT | Gold nanoparticles with Prussian blue serve as both SERS and MRI molecular imaging probes, targeted against CD44 overexpressed by cancer cells. They allowed for in vivo imaging and PTT of tumor tissue. | 244 |
| 2017 | Feng et al. | Cancer, Breast | Gold nanobipyramid functionalized with folic acid. | PTT | Folic acid allowed nanoparticle detection/accumulation in folic-acid receptor positive tumor sites. The nanoparticle was an effective PTT agent. | B |
| 2018 | Ou et al. | Cancer, Breast | Antibody-labeled gold nanostars | None | Gold nanostars facilitated both 2D ex vivo mapping of tumor biomarkers, as well as response to treatment via changes in biomarkers. | 223 |
| 2018 | Huan Min et al. | Cancer, Breast | Gold copper-sulfide nanoparticles functionalized with folate and poly(allylamine). | PAI, PTT | Nanoparticles allowed for longitudinal imaging of tumor via SERS and PA, as well as PTT. | C |
| 2019 | Wang et al. | Cancer, Breast | Gold nanoflower with biorthogonal tags and silica coating. | None | Gold nanoflower can used to characterize the biomarkers of cancer cells and tumors. | 229 |
| 2020 | Wang et al. | Cancer, Breast | Gold nanorod with biorthogonal (silent region) reporter and aptamers for targeting. | PTT | SERS allowed for imaging and mapping of nanorods in tumor in vivo. Gold nanorods served as agent for PTT. | D |
| 2020 | Ou et al. | Cancer, Breast | Gold nanostars functionalized with PEG-lipid-linked antibodies and copper chelators | PET | Gold nanoprobes were used to investigate treatment response in mice to cancer immunotherapy. The targeted nanoparticles showed response in both SERS and PET imaging. | 249 |
| 2020 | Zhang et al. | Cancer, Breast | Manganese dioxide-encapsulated gold nanoparticle functionalized with a PEG layer | MRI | The coated nanoparticle shell degraded in the TME, freeing the manganese and nanoparticle and allowing for MRI imaging of the tumor and SERS substrate imaging of tumor biomolecules. | E |
| 2022 | Pal et al. | Cancer, Breast | Gold nanorod functionalized with DNA-linked NIR dye, a folate targeting moiety and a PEG layer. | Fluorescence, PAI, PTT | Nanoparticles facilitated multimodal imaging of tumor before, during and after operation, and targeting was verified with FLOR1 immunohistology. The nanoparticles also facilitated PTT. | 242 |
| 2020 | Wang et al. | Cancer, Breast | Gold nanoframework loaded with DOX and coated with hyaluronic acid 4-ATP conjugates. | PAI, PTT | Hyaluronic acid allowed active targeting of CD44+ cancer cells. PAI facilitated depth resolved imaging of nanoparticles, and SERS facilitated detailed tumor mapping. | 243 |
| 2021 | Yu et al. | Cancer, Colorectal | Gold-core silica shell nanoparticles. Untargeted | None | Five-fold multiplex was achieved in vivo via varying concentrations of five NIR-labeled nanoparticles, showing accurate measurement in vivo. | 225 |
| 2018 | Kang et al. | Cancer, Colorectal | Silica core embedded with gold/silver shells and a silica coating, functionalized with a silica coating, NIR dyes and a targeting antibody. | None | Nanoparticles conjugated with different targeting antibodies were able to demonstrate the relative efficacy of these antibodies via precise SERS imaging. | 234 |
| 2019 | Nicolson et al. | Cancer, Glioblastoma | Silicated gold nanostar with RDG targeting peptide | None | SORS imaging facilitated imaging of brain tumors through skull. | 230 |
| 2018 | Zou et al. | Cancer, in vitro | Graphene-isolated gold nanocrystals using aptamer to target protein biomarkers | None | Graphene-shell nanoparticles were synthesized, with the C12 to C13 ratio allowing for a tuning of the biorthogonal signal peak position. These particles were demonstrated for in vivo imaging in c. Elegans and were also used for cancer cell recognition via aptamer targeting of biomarkers. | 228 |
| 2021 | Zhao et al. | Cancer, in vitro | Polystyrene nanoparticles loaded with Raman probes | None | Raman active nanoparticles were developed for multiplexing that are compactly sized and ultra-bright loaded with their synthesized Raman dyes and other alkyne tags | 292 |
| 2021 | Chenet al. | Cancer, in vitro | Polystyrene nanoparticles loaded with Raman probes | None | Used the previously developed Rdots to develop a platform for live-cell profiling | 293 |
| 2020 | Tian et al. | Cancer, in vitro | Functionalized polydiacetylene - PDDA | None | A functionalized polydiacetylene (PDDA) was synthesized that could be used as a platform for multi-functional Raman probes | 254 |
| 2019 | Vanden-Hehir et al. | Cancer, in vitro | PLGA with Raman tags | None | PLGA appended with chemical labels were synthesized to be imaged with SRS | 296 |
| 2017 | Hu et al. | Cancer, in vitro | Styrene hydrophobic core, Raman active monomers, TAC surfactant | None | Styrene with Raman active monomers were synthesized as functional synthetic latex nanoparticles for multiplexing live-cells | 41 |
| 2017 | Li et al. | Cancer, in vitro | Different PPE derivatives | None | Poly (phenylene ethynylene) based conjugated polymer nanoparticles were prepared as Raman active nanomaterials | 297 |
| 2017 | Wall et al. | Cancer, Liver | Gold-core silica-shell nanoparticle doped with IR-780 Raman reporter and 68Ga radionuclide. | None | PET-CT and SERS allowed for contrast imaging of tumors in an intraoperative setting. | 248 |
| 2022 | Shi et al. | Cancer, Lymphoma | Gap-enhanced Raman nanoparticles were functionalized with PEG and loaded with Gadolinium and chemotherapy. | MRI, CT, PTT | Nanoparticles facilitated multimodal imaging of the tumor during pre-operative (MRI/CT) and intraoperative (SERS) modes. Nanoparticle therapeutic delivery and PTT facilitated combinatorial therapy. | 246 |
| 2019 | Sujai et al. | Cancer, Melanoma | BSA-coated nanoclusters were embedded on gold nanorods to form a nanoenvelope. That nanoenvelope was loaded with a squaraine Raman reporter/photosensitizer and dacarbazine chemotherapy. | PTT | The particle facilitated SERS imaging of tumor sites and destruction of the tumor with photothermal and chemotherapy. | 232 |
| 2021 | Wen et al. | Cancer, Melanoma | Gold nanorod with cysteine chloro-hydroxyl merocyanine dye | Fluorescence, PAI, PTT | Nanorod sensor was imageable with both fluorescence and photoacoustics. It served as a pH sensitive probe and was an effective PTT agent. | F |
| 2022 | Eremina et al. | Cancer, Multiple | Gold-core silica-shell nanoparticle with embedded Raman reporter. | None | A library of SERS reporters enabled a 26-fold multiplex in vivo. Targeted subsets of that multiplex were also demonstrated. | 227 |
| 2019 | Qiu et al. | Cancer, Prostate | Hollow copper-sulfur nanoparticles | PTT | Nanoparticles allowed for imaging residual tumor lesions through passive accumulation. Photothermal ablation allowed for the induction of hyperthermia in the lesions, and further laser exposure was used to break down the particles, demonstrating the ability to biodegrade these particles in vivo. | G |
| 2018 | Noonan et al. | Cardiovascular disease | Gold nanoparticle with antibody and Raman reporters | None | Multiplexed nanoparticles allowed for quantification of inflammation biomarkers in vivo. | 233 |
| 2019 | Qin et al. | Hypoxia | Gold-silver nanoparticles with CNT-based and azo-alkyne Raman reporter | None | Combination of hypoxia-sensitive reporter and non-sensitive CNT reporter allowed for ratiometric imaging. | H |
| 2020 | Zhang et al. | Immune cell tracking | Gold nanospheres labeled with Prussian blue and gadolinium | MRI | Gadolinium allowed for full-body tracking of DCs, while Prussian blue allowed for silent-region imaging in the lymph node. | 245 |
| 2020 | He et al. | MRSA | Gold-silver nanoshells labeled with DTTC and suspended in a sodium hyaluronate gel | PTT | Nanoparticles allowed for the monitoring of bacterial growth in a wound via SERS. The nanoparticles also served as an effective PTT agent, facilitating wound healing in vivo. | I |
| 2019 | Yu et al. | Nanoplastics | Polystyrene-encapsulated gold nanospheres | None | Nanoparticles allowed for complex, in vivo multiplex imaging at multiple time points. | J |
| 2020 | Yin et al. | Proof of Concept | Waxberry-like gold nanoparticle with lipid bilayer and silica coating labeled with NIR dyes | None | Demonstrated new coating methodology to improve nanostar sensitivity and stability in vivo | K |
| 2022 | Bock et al. | Proof of Concept | Silica - Gold probe with nanogap enhancement | None | A nanoparticle system was demonstrated for a 14-fold multiplex. | 226 |
| 2017 | Cha et al. | Sentinel lymph node detection | Silver-silica core-shell NP with embedded Raman reporter | PAI | Photoacoustics allowed 3D imaging of nanoparticles, which were capable of a x3 multiplex | 241 |
Jiang, C.; Wang, Y.; Wang, J.; Song, W.; Lu, L. Achieving Ultrasensitive in Vivo Detection of Bone Crack with Polydopamine-Capsulated Surface-Enhanced Raman Nanoparticle. Biomaterials. 2017, 114, 54–61.
Feng, J.; Chen, L.; Xia, Y.; Xing, J.; Li, Z.; Qian, Q.; Wang, Y.; Wu, A.; Zeng, L.; Zhou, Y. Bioconjugation of Gold Nanobipyramids for Sers Detection and Targeted Photothermal Therapy in Breast Cancer. ACS Biomater. Sci. Eng. 2017, 3, 608–618.
Lv, Q.; Min, H.; Duan, D. B.; Fang, W.; Pan, G. M.; Shen, A. G.; Wang, Q. Q.; Nie, G.; Hu, J. M. Total Aqueous Synthesis of Au@Cu(2-)(X) S Core-Shell Nanoparticles for in Vitro and in Vivo Sers/Pa Imaging-Guided Photothermal Cancer Therapy. Adv. Healthc. Mater. 2019, 8, e1801257.
Wang, J.; Liang, D.; Jin, Q.; Feng, J.; Tang, X. Bioorthogonal Sers Nanotags as a Precision Theranostic Platform for in Vivo Sers Imaging and Cancer Photothermal Therapy. Bioconjug. Chem. 2020, 31, 182–193.
Zhang, C.; Cui, X.; Yang, J.; Shao, X.; Zhang, Y.; Liu, D. Stimulus-Responsive Surface-Enhanced Raman Scattering: A "Trojan Horse" Strategy for Precision Molecular Diagnosis of Cancer. Chem. Sci. 2020, 11, 6111–6120.
Wen, C.; Chen, H.; Guo, X.; Lin, Z.; Zhang, S.; Shen, X. C.; Liang, H. Lysosome-Targeted Gold Nanotheranostics for in Situ Sers Monitoring Ph and Multimodal Imaging-Guided Phototherapy. Langmuir. 2021, 37, 569–577.
Qiu, Y.; Lin, M.; Chen, G.; Fan, C.; Li, M.; Gu, X.; Cong, S.; Zhao, Z.; Fu, L.; Fang, X.; et al. Photodegradable Cus Sers Probes for Intraoperative Residual Tumor Detection, Ablation, and Self-Clearance. ACS Appl. Mater. Interfaces. 2019, 11, 23436–23444.
Qin, X.; Si, Y.; Wang, D.; Wu, Z.; Li, J.; Yin, Y. Nanoconjugates of Ag/Au/Carbon Nanotube for Alkyne-Meditated Ratiometric Sers Imaging of Hypoxia in Hepatic Ischemia. Anal. Chem. 2019, 91, 4529–4536.
He, J.; Qiao, Y.; Zhang, H.; Zhao, J.; Li, W.; Xie, T.; Zhong, D.; Wei, Q.; Hua, S.; Yu, Y.; et al. Gold-Silver Nanoshells Promote Wound Healing from Drug-Resistant Bacteria Infection and Enable Monitoring Via Surface-Enhanced Raman Scattering Imaging. Biomaterials. 2020, 234, 119763.
Yu, Q.; Wang, Y.; Mei, R.; Yin, Y.; You, J.; Chen, L. Polystyrene Encapsulated Sers Tags as Promising Standard Tools: Simple and Universal in Synthesis; Highly Sensitive and Ultrastable for Bioimaging. Anal. Chem. 2019, 91, 5270–5277.
Yin, Y.; Mei, R.; Wang, Y.; Zhao, X.; Yu, Q.; Liu, W.; Chen, L. Silica-Coated, Waxberry-Like Surface-Enhanced Raman Resonant Scattering Tag-Pair with near-Infrared Raman Dye Encoding: Toward in Vivo Duplexing Detection. Anal. Chem. 2020, 92, 14814–14821.
The concept of multimodal imaging has been prevalent for over a decade and indeed now >100 clinical trials are ongoing where multiple clinical modalities (e.g., trial # NCT05190510) or a clinical and pre-clinical imaging technique are combined (e.g., trial # NCT02790853) for diagnosis of various diseases. Therefore, we envision that multimodal SERS integrated with a clinical technique could transition to clinics with the utility of clinically translatable NPs. Whereas gold-based NPs, such as nanoshells, have shown success in clinical pilot studies,250 gold NPs still need to be approved by the U.S. FDA for clinical use. Innovative approaches such as the design of biodegradable gold NPs,251, 252 or metal-free NPs (discussed in section 5 of this review) will be necessary to enable the clinical translation of SERS-based technologies.
4.3. SERS-based high throughput proteomic assays for ex vivo diagnostics
Beyond in vivo imaging capabilities, SERS offers high precision and sensitivity to ex vivo assessment of protein biomarkers. In ex vivo SERS, since the limitation of imaging a living subject is not involved, these assays can be optimized to show ultralow detection limits, allow multiplexing of >30 molecular targets, and enable quantitative response. The accuracy of SERS assays can be comparable to flow cytometry but at a fraction of the cost since Raman reporters are inexpensive relative to fluorescent tags.253 In such proteomic assays, multiple factors control the overall sensitivity and detection limits that can be achieved. These include: (i) the choice of the metal used where low-loss metals with strong radiative properties such as Ag, Au, and, more recently, Al is highly desirable.254, 255 (ii) The choice of the targeting moiety on the metal NP surface. While antibodies typically surpass the sensitivity and specificity of other ligands (peptides, aptamers, DNA), they also cause aggregation and steric repulsion due to their large sizes.256 And (iii) the architecture of the assay where sandwich immunoassays are the most common due to the ease of fabrication.257 But the use of lateral flow assays, paper-based swabs, and microfluidic devices have also been leveraged to improve the mixing of the capture nanoprobes with the proteins being detected to enable affordability and portability, and to allow point of care (POC) diagnostic for at home use. This section highlights recent findings where these factors have driven successful outcomes in SERS-based proteomic assays.
In a recent work, Zhuang et al. developed a dual-readout strategy involving colorimetry and SERS with Au as the metal of choice to detect tyrosinase (TYR), an enzyme that catalyzes melanin synthesis and aberrations in its expression levels results in various skin diseases such as melanoma.258 In this study, authors used 4-mercaptophenylboronic acid (4-MPBA) anchored to GNPs as the Raman reporter and recognition moiety that reacts with the TYR substrate (Fig. 13a). The TYR substrate consisted of magnetic beads covalently bound to tyramine. Upon interacting with the target TYR, the substrate is oxidized to dopamine and reacts with the 4-MPBA to form five-membered cyclic borate ester complexes, resulting in colorimetric change and SERS response. To improve the sensitivity of SERS for the detection of protein biomarkers, SERS has been coupled with micro-optical systems. Yang et al. demonstrated that the sensitivity of SERS can be enhanced by optimizing the optical matching characteristics of the SERS substrate and Raman detection system.259 In their study, the high-performance SERS chip consisted of a uniform layer of Ag NPs prepared by liquid-liquid interface self-assembly. The SERS chip was used for creatinine detection, a key biomarker for kidney diseases. The limit of detection (LOD) of the creatinine using the SERS chip was reported to be 1 µM and 5 µM in solution and serum, respectively. Aluminum-based SERS probes have also served as excellent candidate for the early diagnosis of cancer. Ganesan et al. demonstrated aluminum-based SERS probes for cancer detection in vitro,260 which consisted of wrinkled aluminum quantum structures as the SERS active component with a wide light spectrum range. SERS-based immunoassays have also been developed with bimetallic NPs for detecting multiple tumor antigen markers. Liu et al. fabricated a SERS-based immunoassay to simultaneously detect squamous cell carcinoma antigen (SCCA) and survivin (Fig. 13b).261 In their unique design, the detection substrate consisted of gold-silver nanoshells (Au-Ag NSs) with DTNB and 4-amino thiophenol (4-ATP) as the Raman reporters, and monoclonal anti-SCCA and anti-survivin antibodies for targeting the respective antigen. The capture substrate consisted of a gold-silver nano box (Au-AgNB) array coated with polyclonal antibodies. In the presence of antigens, the capture and detection substrates form a sandwich structure where the two distinct bimetallic NPs, Ag-AuNSs and Au-AgNB, give rise to intense EM fields and enhanced SERS activity. The authors have reported an ultralow LOD of 6 pg mL−1 for SCCA and 5 pg mL−1for survivin in a wide linear, logarithmic range of 10 pg mL−1to 10 mg mL−1. In another example, both monometallic and bimetallic NPs were leveraged by Lu et al., where an ultrasensitive immunoassay platform was designed with filter paper for simultaneously detecting two cervical cancer serum biomarkers, SCCA and osteopontin.262 In their design, the bimetallic gold-silver nanoshuttles conjugated with Raman reporters and monoclonal antibodies served as the detection substrate, and monometallic gold nanoflowers (AuNFs) conjugated with polyclonal antibodies served as the capture substrate. They achieved an ultrasensitive LOD for SCCA and osteopontin in human serum as 8.628 pg mL−1 and 4.388 pg mL−1, respectively. Of note, the assay was performed with AuNFs on hexadecimal succinic anhydride-treated hydrophobic filter paper; the hydrophobicity was important to minimize the spreading and dilution of the antigens and improve detection sensitivity. In another distinct approach, Chen et al. developed a vertical flow assay system with nanoporous anodic aluminum oxide (AAO) as the sensing unit and Raman tags encoded core-shell nanotags as the labeling unit for the detection of multiple inflammatory biomarkers (Fig. 13c).263 They functionalized bimetallic Au-Ag core-shell nanoprobes with four distinct Raman reporters, including Nile blue A, pMBA, DTNB, and methylene blue, to detect C reactive protein, interleukin-6, serum amyloid A, and procalcitonin markers in patient samples (Fig. 13d). A mixture of the samples and nanoprobes was dropped into the porous AAO and captured in the nanochannels. The confinement within these channels, high surface area to volume ratio of the porous AAO, and high sensitivity of the SERS nanoprobes enabled a wide linear dynamic range and LOD of 53.4, 4.72, 48.3, and 7.53 fg mL−1 for the four markers, respectively.
Figure 13.
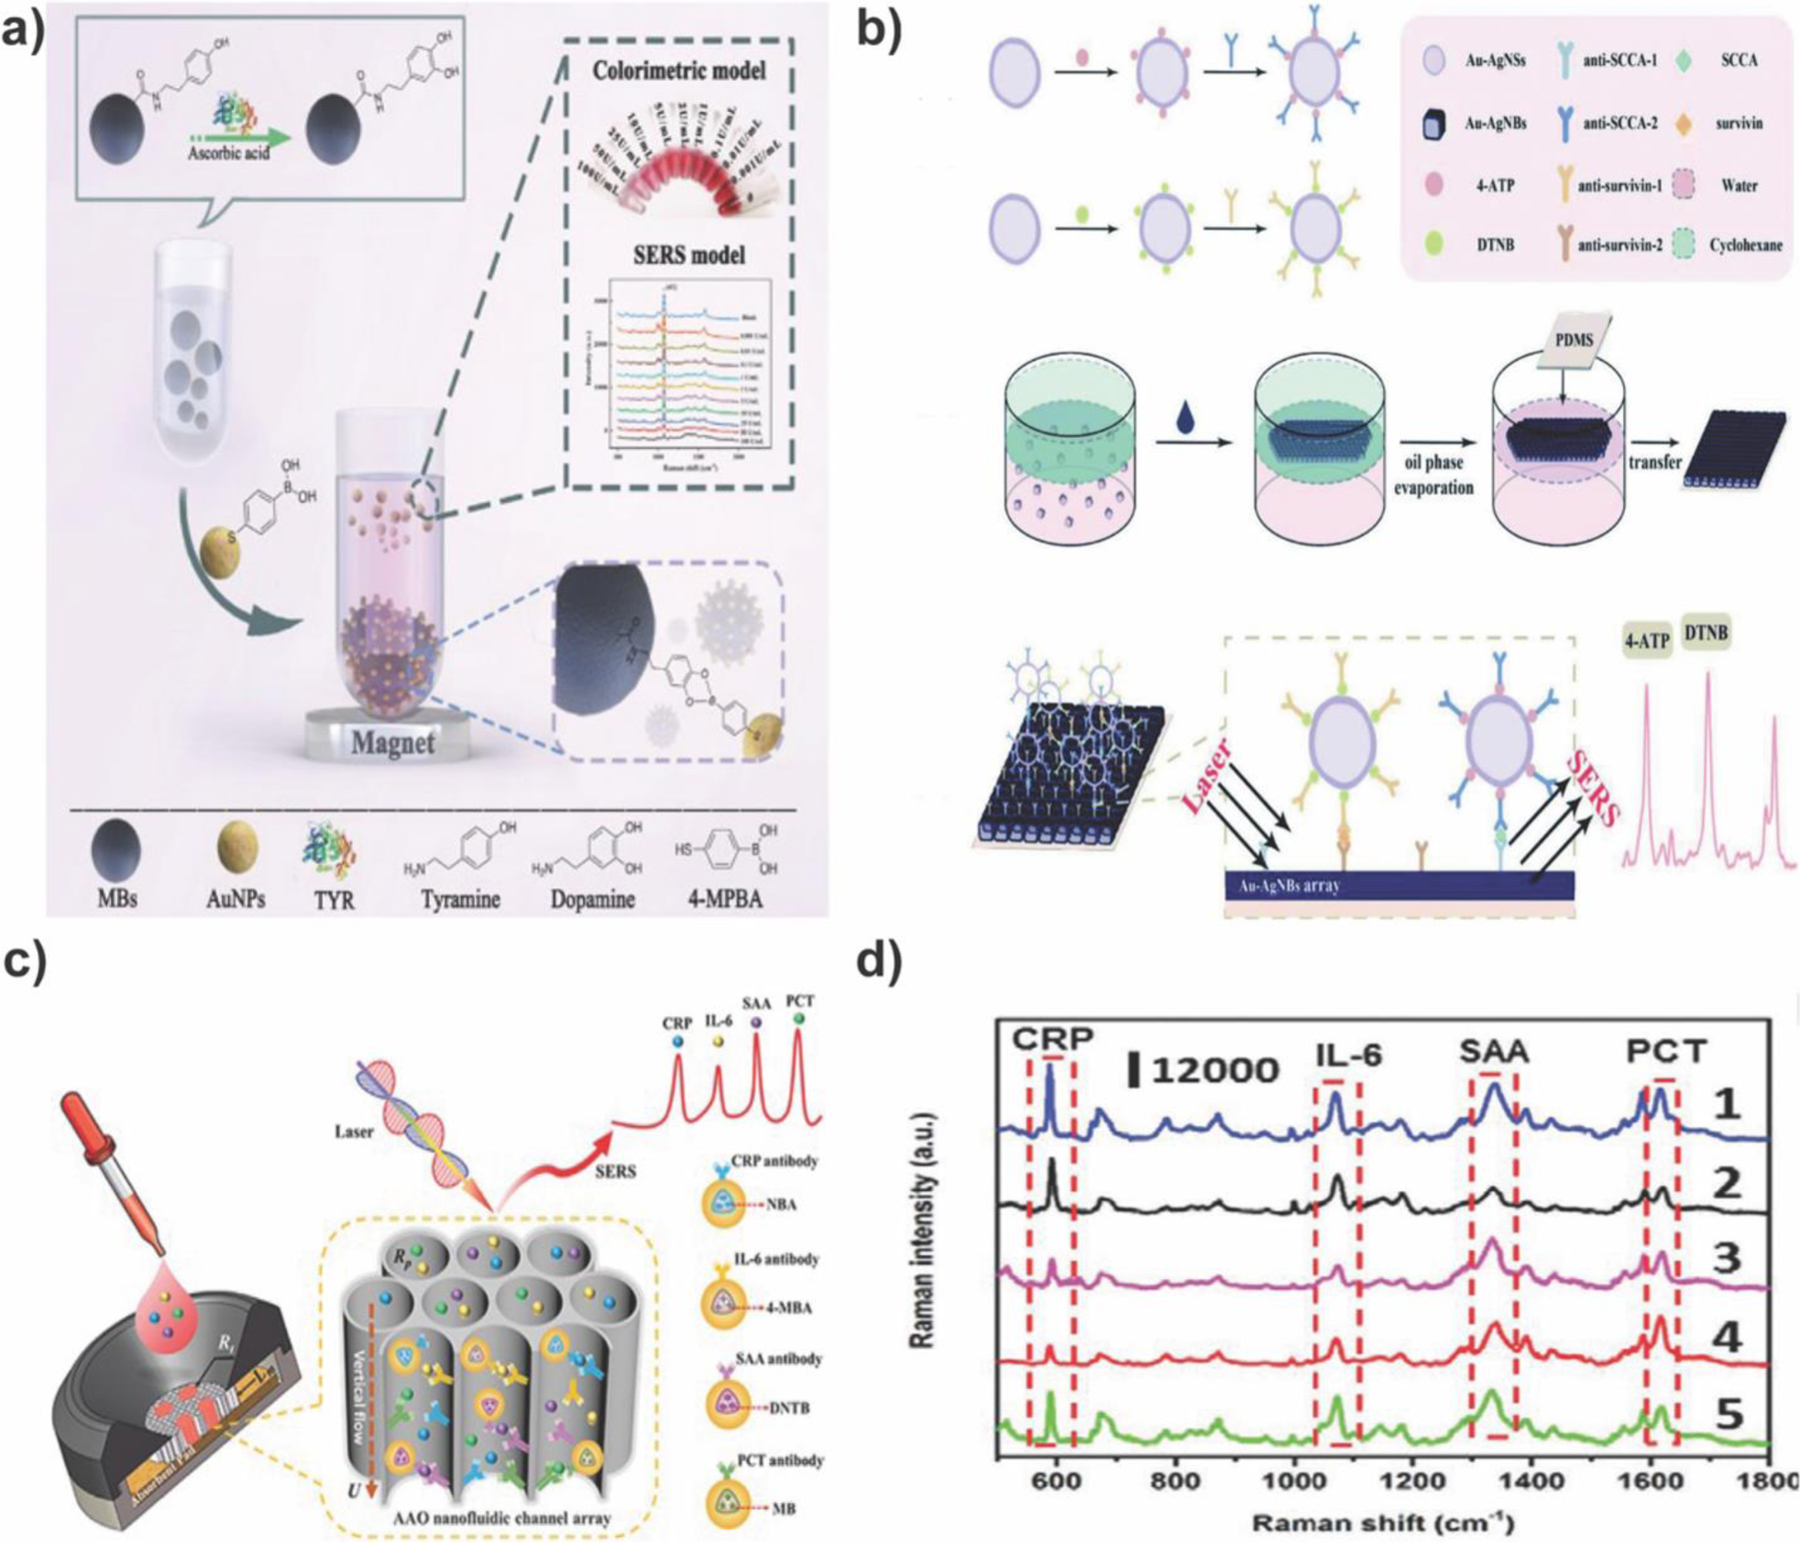
(a) Schematic illustration of colorimetric and SERS dual-readout sensor for detection of tyrosinase activity. GNPs were coated with 4-mercaptophenylboronic acid (4-MPBA) which served as Raman reporter and recognition moiety that reacts with the TYR substrate consisting of magnetic beads covalently bound to tyramine. Adapted with permission from ref 258. Copyright 2021 Elsevier. (b) Schematic illustration of the fabrication of a SERS-based immunoassay platform for the detection of squamous cell carcinoma antigen (SCCA) and survivin. Detection substrate consisted of gold-silver nanoshells (Au-Ag NSs) with DTNB and 4-amino thiophenol (4-ATP) as the Raman reporters. Adapted from ref 261. Copyright 2021 Royal Society of Chemistry under CC BY 3.0 license (https://creativecommons.org/licenses/by/3.0/). (c) and (d) Schematic illustration of vertical flow assay system with nanoporous anodic aluminum oxide (AAO) for the detection of inflammatory biomarkers and Raman spectra of spiked serum samples using AAO-based vertical flow assay platform, respectively. Bimetallic Au-Ag nanoprobes functionalized with four distinct Raman reporters and four antibodies detected different markers in patient samples. Adapted with permission from ref 263. Copyright 2020 John Wiley and Sons.
Whereas the majority of the literature findings on SERS assays have focused on cancer biomarkers, some exciting findings have also shown early diagnosis of diseases beyond cancer, including Alzheimer's disease (AD) and cardiovascular diseases. Yu et al. developed a sandwich immunoassay for detecting AD biomarkers amyloid β peptide (Aβ1–42) and hyperphosphorylated Tau protein (p-Tau-181).264 In the design of the immunosensor, tannin-capped Ag NPs labeled with a Raman probe and antibodies detected the biomarkers, and magnetic iron oxide/graphene oxide (Fe3O4@GOs) magnetic substrates captured the proteins. Antigen capture reduced the distance between the Ag probe and GO substrate, enhancing the Raman signal of the pMBA reporter that resulted in an ultrasensitive LOD of 1.62 fg/mL for Aβ1–42 and 5.74 fg/mL for p-Tau-181. Our group has also reported a portable, reusable, accurate diagnostics with nanostar antennas (PRADA) for the real-time detection of two biomarkers of myocardial infarctions, cardiac troponin 1 (cTn1) and neuropeptide Y (NPY) in human serum samples.265 PRADA consisted of gold nanostar conjugated with small targeting peptides and Raman tags DTNB and pMBA as the detection probes, and magnetic beads functionalized with polyclonal antibodies as the capture probes (Fig. 14a). In the assay, the capture probes were incubated with the human serum to capture cTnI and NPY; a sandwich immunocomplex was formed with the detection probe enabling multiplexed detection with a LOD of 0.0055 ng/ml of cTnI and 0.12 ng/ml for NPY (Fig. 14b). Our lab also demonstrated PRADA was reusable and can be regenerated for ~14 cycles enabled using a magnet and the magnetic bead bottom probes. Furthermore, the approach was validated in 11 de-identified cardiac patient samples, benchmarking a limit of quantification (LOQ) of 0.03 ng/mL of cTNI comparable to those achieved with commercial test kits (Fig. 14c). The LOQ is often not reported but is an important parameter in comparing the sensitivity of immunoassays. LOQ is the lowest concentration detectable for an antigen with a coefficient variation (CV) less than or equal to 10%, and typically LOQ ≥ LOD but not lower, since LOD provides an estimates bias at low analyte concentrations.
Figure 14.
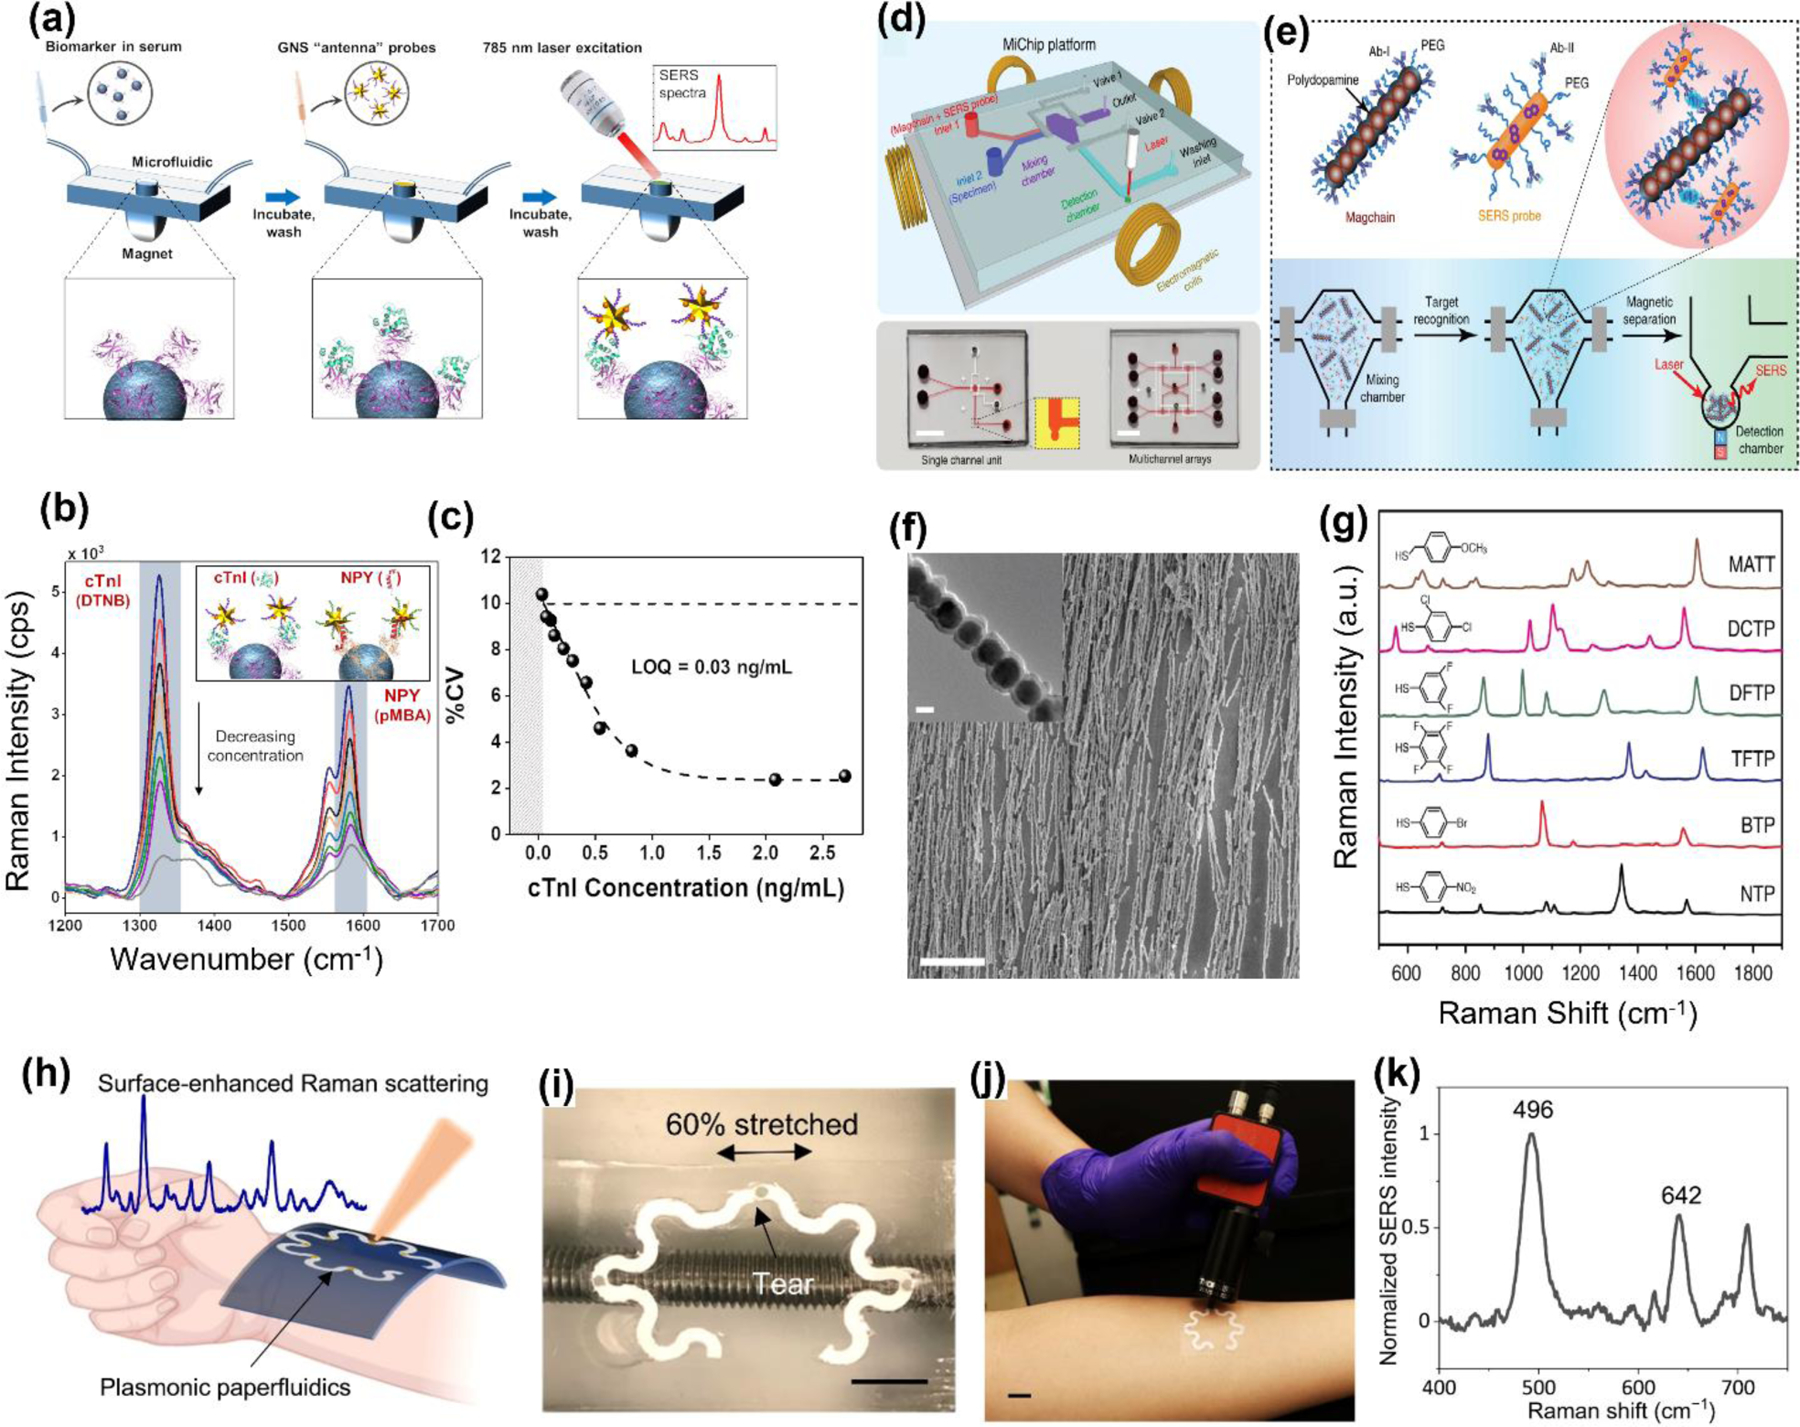
(a) Schematic illustration of PRADA with gold nanostar conjugated Raman tags and peptides as detection probes and magnetic beads coated with polyclonal antibodies as capture probes. (b) Multiplexed detection of both cTnI and NPY simultaneously in buffer with PRADA. (c) cTnI detection in cardiac patient sera with measured LOQ shown. Adapted from ref 265. Copyright 2020 John Wiley and Sons under CC BY 4.0 license (https://creativecommons.org/licenses/by/4.0/). (d) Schematic illustration of design of MiChip and corresponding photographs of the MiChip (bottom). (e) The MiChip assay for the detection of biomarkers where antibody-conjugated magnetic nanochains and SERS-encoded probes form sandwich immune complexes for Raman spectroscopic detection. (f) SEM image of the magnetic nanochains. Inset: TEM image of magnetic nanochain. (g) SERS spectra of 6 representative SERS-encoded gold nanorods Adapted from ref 274. Copyright 2018 Springer Nature under CC BY 4.0 license (https://creativecommons.org/licenses/by/4.0/). (h) Schematic illustration of a wearable plasmonic paperfluidic device for sweat collection and SERS analysis. (i) Device flexibility, stretchability, and stability showing after being 60% stretched (j) Photo of a device conformally laminated on the forearm of a human subject and the use of a portable Raman spectrometer with a flexible fiber probe for spectra collection. (k) SERS spectrum of sweat collected from the sensor S1. Adapted from ref 275. Copyright 2022 American Association for the Advancement of Science under CC BY 4.0 license (https://creativecommons.org/licenses/by/4.0/).
In the examples discussed above, antibodies have dominated the field of SERS assays as a targeting moiety largely due to the ease of availability through many commercial vendors. However, aptamers and peptides are highly desirable as an alternative due to their smaller sizes with improved steric stability, lower cost, and longer shelf-life.266 For example, an antibody-free immunoassay with an aptasensor was developed to detect carcinoembryonic antigen (CEA).267 The aptasensor consisted of aptamer-assisted self-assembly of bimetallic Ag-coated gold NPs and a Raman reporter. In the presence of the CEA antigen, the aptamers facilitated both high sensitivity and selectivity in recognizing the antigen, which resulted in the disassembly of the multimeric structure and a decrease in the SERS signal. This reverse detection method was directly proportional to the logarithm concentration of CEA. Multiplexed SERS sensing has also been reported to detect AD biomarkers in an antibody-free approach. Zhang et al. developed a self-assembled conjugate of Raman dye-coded Polyadenine (poly-A) aptamer-AuNPs for the simultaneous detection of Aβ1–42 and Tau proteins.268 PolyA block oligonucleotides were anchored on AuNPs with a targeting aptamer that enabled protein biomarker recognition. Protein binding to the aptamer induced aggregation of AuNPs resulting in a concomitant plasmonic coupling effect and generation of intense SERS hotspots enabling LOD of 4.2 × 10⁻⁴ pM for Aβ1–42 and 3.7 × 10⁻² nM for Tau proteins, respectively. In another unique work by Yue et al. DNA tetrahedron-mediated branched catalytic hairpin assembly with higher sensitivity and selectivity than other SERS biosensors was reported in the in-situ detection of microRNA. The authors demonstrated that enzyme-free self-assembly of the DNA assembly along with SERS hotspot consisting of DTNB functioned gold NPs have the potential for ultrasensitive in-situ detection of microRNA-21 (miR-21) in living cells with a LOD of 0.33 fM.
In addition to sandwich immunoassays discussed above, SERS-based POC diagnostics have also advanced real-time detection of multiple proteins with the utility of lateral flow assays, paper-based swabs, and microfluidic devices that include both traditional and pump-free paper microfluidics.269 In POC devices, spatial and barcode-based multiplexing have enabled rapid, low-cost, and highly sensitive detection. Spatial multiplexing is created with spatially separated zones where multiple molecular targets are assayed on the same platform but physically separated.270 Barcode-based multiplexing allows direct in situ identification of multiple targets where sandwich immunoassays are created within the POC device.271 Here multiple capture antibodies or capture nanoprobes are immobilized onto the POC device to engage with multiple antigens, followed by the addition of a mixture of detection nanoprobes labeled with distinct Raman reporters and targeting ligands specific to each of the antigens captured. Spatial multiplexing is simpler to design and achieves high specificity without the complexity of SERS signal deconvolution of multiple targets, but spatial separation limits the number of targets a POC can measure while enabling a small footprint of the substrate to keep costs low and maintaining portability. Barcoded multiplexing is ideal for simultaneously detecting a large number (>20) of molecular targets in a highly portable and spatially confined POC device desirable for field use or low-resource settings. However, specificity and sensitivity in such devices are dictated by any steric hindrance among the capture and detection antibodies, the precision of SERS signal separation and deconvolution, and the overall stability of multiple nanoprobes when spatially confined. For example, by leveraging the merits of the barcode-based multiplexing approach, Sánchez-Purrà et al. designed a paper-based SERS swab based on sandwich immunoassay that could distinguish between Zika virus (ZIKV) and dengue virus (DENV) nonstructural protein 1 (NS 1).272 Gold nanostars encoded with Raman tags pMBA and 1,2-bis(4-pyridyl)ethylene and conjugated to antibodies specific to ZIKV NS1 and DENV NS1 enabled a "dipstick" SERS chip and achieved LOD of 0.72 ng mL-1for ZIKV NS1 and 7.67 ng mL-1 for DENV NS1 respectively.
Microfluidic biochips platforms have also been used in ultrasensitive, rapid, and multiple-miRNA detection. Chu et al. have reported the fabrication of a microfluidic detection platform consisting of microfluidic biochips with graphene oxide (GO) assembled reaction microchannels, and poly-L-Lysine (PLL) assembled detection microchamber. The microfluidic detection platform was reported to quantitatively analyze multiple miRNAs in serum samples even with a small sample volume of ∼2 μL and ultralow LOD of 0.146 pM. Microfluidics and SERS has also been employed to monitor patient treatment response. Wang et al. have reported the fabrication of a multiplex extracellular vesicle phenotype analyzer chip (EPAC).273 EPAC-integrated nano mixing-enhanced EVs microchip and multiplex SERS signaling enabled the detection of low-abundance tumor-specific EVs in biological fluids. To achieve multiplexing, each of the EVs was labeled with gold NPs and Raman reporters for detection of melanoma chondroitin sulfate proteoglycan, melanoma cell adhesion molecule, receptor tyrosine-protein kinase, and low-affinity nerve growth factor receptor. In another unique approach magnetic nanochain-integrated microfluidic chips were reported to rapidly detect bacteria and cancer protein markers. Xiong et al. reported the development of rapid, ultrasensitive bioanalysis in simple microfluidic configurations.274 The magchain-integrated microchip (MiChip) consists of a microfluidics chamber in which the antibody-conjugated magnetic nanochains (Magchain) and SERS-encoded probes were mixed (Fig. 14d,e). The antibodies on the Magchain recognize the target of interest in the specimen and forms a sandwich immune complex with the SERS probes with a LOD of ~10 pg mL−1. The SERS probe consisted of SERS-encoded gold nanorod (AuNR) with 4-nitrothiophenol, 4-bromothiophenol, 2,3,5,6-tetrafluorothiophenol, 3,5-difluorothiophenol, 2,4-dichlorothiophenol, and 4-methoxy-α-toluenethiol as the Raman probe (Fig. 14f,g). As an alternative to conventional SERS microfluidics systems, paper-based microfluidic devices have been developed, which are straightforward to fabricate, have low costs, and are highly portable. In a unique design, Mogera et al. reported the development of flexible, wearable plasmonic paper-based microfluidics for highly sensitive detection and quantification of uric acid in sweat at physiological and pathological concentrations (Fig. 14h).275 In their approach, the plasmonic paper-based microfluidic device comprised of chromatography paper with uniformly absorbed gold nanorods resulting in enhanced Raman signal of uric acid (UA) and ultrasensitive detection of UA in sweat. The authors demonstrated that the microfluidic devices are highly flexible and can be stretched, twisted, and crumpled (Fig. 14i) withstanding strain. They also showed clinical relevance of their devices by conformally laminating the flexible microfluidic on a human subject and applying a portable Raman spectrometer for data collection. SERS spectra of human sweat was collected from the devices worn by a healthy human subject who exercised for 20 min (Fig. 14j,k). In another work, Lim et al. also reported the development of a microfluidic paper-based device for the quantitative measurement via SERS of acute myocardial infarction cardiac biomarkers. These include glycogen phosphorylase isoenzyme BB (GPBB), cardiac Troponin T (cTnT) and creatine kinase-MB CK-MB.276 These biomarkers were detected via three distinct Raman reporters conjugated onto three distinct NPs including silver, gold-urchin, and gold NPs. The NPs were subsequently encapsulated with a silica layer to protect the Raman reporters, and further conjugated with specific antibodies for targeting the protein biomarkers of interest. The paper-based microfluidic devices could detect biomarkers well beyond the clinical cut-off values with a LOD of 8, 10, and 1 pg mL−1 for GPBB, CK−MB, and cTnT, respectively. Other compelling examples of SERS-based ex vivo assays are provided in Table 4. The examples highlighted in this section collectively demonstrate that SERS POC devices are highly versatile for rapid and highly sensitive detection of a number of protein biomarkers. Given the low cost, high accuracy, and ability to multiplex >30 markers, we envision that SERS POC devices have the potential to be a cornerstone in clinical diagnostics in near future. However, adaptation of these SERS platforms in clinical testing will require pilot studies where large cohort of patient samples are tested for multiple key proteins and establish a reliable LOD and LOQ with high reproducibility. Further, the stability and shelf-life of the SERS probes will need to be examined for long term to improve their commercial potential.
Table 4.
Surface enhanced Raman spectroscopy-based sensors and point-of-care diagnostics. These include sandwich immunoassay, lateral flow assays, and microfluidics devices designed with Raman reporter labeled NPs for ex vivo proteomics assay and biomarker detection.
| Year | Authors | Pathology / Objective | Probe | SERS Platform | Summary | Ref. |
|---|---|---|---|---|---|---|
| 2019 | Zhang et al. | Alzheimer's Disease | PolyA-aptamer labeled auNPs used to bind to proteins | SERS nanoprobes | Nanoparticles allowed for simultaneous detection of 2 biomarkers. | 268 |
| 2021 | Yu et al. | Alzheimer's Disease | Silver nanoparticles labeled with MBA with magnetic graphene oxide as a magnetic substrate. | SERS-based sandwich immunoassay | Sandwich assay accurately and sensitively detect Aβ1–42 and P-Tau-181 in human serum samples, which provided a promising tool for early diagnosis of Alzheimer’s disease. | 264 |
| 2020 | Maurer et al. | Alzheimer's Disease | Gold nanoparticle labeled with DTNB and iron oxide nanoparticles. | SERS magnetic-particle immunoassay | The assay allowed for detection of the target analyte, tau protein, which is a biomarker for diagnosis of Alzheimer's disease. | A |
| 2019 | Cheng et al. | AMI | Gold-silver core-shell nanoparticles labeled with Malachite green isothiocyanate and fixed on a silica chip. | SERS-based sandwich immunoassay | A sandwich immunoassay platform for the ultrasensitive detection of cTnI and CK-MB, Cardiac troponin I (cTnI) and creatine kinase-MB (CK-MB) are important diagnostic biomarkers for acute myocardial infarction | B |
| 2020 | Hu et al. | AMI | Core-shell au-ag nanoparticles with antibodies and Raman reporters, as well as magnetic nanobeads to capture biomarkers. | SERS-based magnetic immunoassay | Probe system was able to quantify biomarker concentration for the two biomarkers simultaneously. | C |
| 2019 | Lim et al. | AMI | Antibody-functionalized gold/silver/urchin gold-silica core-shell nanoparticles labeled with 4-nitroanilline, tert-Butylhydroquinone and methyl red. | SERS-based microfluidic paper-based device | Sandwich assay accurately and sensitively detected and quantified cardiac biomarkers. | 276 |
| 2018 | Xiong et al. | Bacterial and Protein Biomarkers | Microfluidics assay with antibody-functionalized magnetic-bead chains and antibody-functionalized gold nanorods labeled with aromatic thiol Raman reporters. | magnetic nanochain integrated microfluidic chip | The microfluidics assay allowed for sensitive multiplexed detection of multiple biomarkers in patient and bacterial samples. | 274 |
| 2021 | Lu et al. | Cancer, Biomarker | Core-shell au-ag nanoparticles with aptamer bridges | SERS aptasensor | Multimeric probes gave high Raman signal at baseline, and dissociated in the presence of CEA, creating an easy-to-use test with a low limit of detection. | 268 |
| 2020 | Li et al. | Cancer, Biomarker | Aptamer-labeled magnetic nanobeads to capture biomarker, and core-shell au-ag nanoprobes with cDNA functionalization to bind to captured biomarker | SERS-colorimetric dual-mode aptasensor | Probe system saw Raman signal decrease as MUC1 concentration increased, giving a sensitive nanosensor. Conversely, an increase in MUC1 modified the colorimetric profile, making the presence of MUC1 visible to the naked eye. | D |
| 2020 | Xiao et al. | Cancer, Biomarker | Gold nanorod with antibody label and Raman reporter | SERS-based lateral flow immunoassay | Custom LFIA reaction column and laser setup allowed for reading of biomarkers with SERS, giving a specific concentration detection. | E |
| 2018 | Bhamidipati et al. | Cancer, Biomarker | Gold nanostar with aptamer to bind EpCAM protein | SERS-based biosensor | Immobilized, Raman labeled nanostars were used with aptamers to bind the biomarker of interest, shifting its Raman profile and producing a relatively sensitive assay. | F |
| 2017 | Qu et al. | Cancer, Biomarker | Gold nanoparticle - upconverting nanoparticle aptamer trimers | SERS and luminescence active platform | Two signals, luminescence and Raman properties, are used for the sensitive and rapid detection of AFP and mucin-1 in human serum samples | G |
| 2021 | Wang et al. | Cancer, Breast | Gold-rod array SERS substrate with Raman-labeled aptamer to capture exosomes, and cross-linking aptamer with Raman tag. | Ratiometric Co-DNA-Locker SERS | Gold nanoarray captures exosomes, and cross-linking aptamer allows for specific identification of cancer exosomes. | H |
| 2021 | Liu et al. | Cancer, Cervical | Core-shell au-ag with antibody labeling | SERS-based sandwich immunoassay | Array substrate captured biomarkers, and probe binding to captured biomarkers produced sandwich array and generated SERS signal. | 256 |
| 2021 | Karunakaran et al. | Cancer, Cervical | Silver-caped gold nanostars with antibody labels | SERS nanoprobes | Cells were labeled with nanoprobes and imaged. SERS signal from cells showed differences based on biomarkers. | 74 |
| 2020 | Lu et al. | Cancer, Cervical | Antibody-functionalized sandwich assay using silver-gold nanoshuttles labeled with 4-MBA and DTNB with gold nanoflower substrates. | SERS-based immunoassay | Simultaneous determination of squamous cell carcinoma antigen (SCCA) and osteopontin in cervical cancer serum. | 257 |
| 2018 | Zeng et al. | Cancer, Cervical | Gold nanoparticle 'click' dimers labeled with bio-orthogonal alkyne dyes. | SERS click nanoprobes | 10-plex synchronous biomarkers detection under a single scan, and accurate cellular imaging under double exposure silent region) | 280 |
| 2020 | Xia et al. | Cancer, Cervical | Antibody functionalized silver-polydopamine nanospheres labeled with 4-ATP and DTNB | SERS-based lateral flow immunoassay | detection of SCCA and CA125 using the SERS-based LFA was observed to have high specificity and reproducibility, and the whole detection was completed within 20 min. | I |
| 2021 | Wu et al. | Cancer, Prostate | Core-shell au-ag nanoparticles with embedded silent region Raman reporter and | SERS-based aptasensor | PSA binding to nanoprobe complex lead to release of Raman probe and reduction of signal, providing a sensitive and quantitative sensor for PSA with a low LOD. | J |
| 2020 | Du et al. | Cancer, Prostate | Magnetic-gold nanocomposite particles with Raman reporter and ag-coated substrate. | SERS-based sandwich immunoassay | Recyclable detection of PSA, a limit of detection (LOD), as low as 0.014 mM | K |
| 2017 | Cheng et al. | Cancer, Prostate | Antibody functionalized gold nanospheres labeled with malachite green isothiocyanate and X-rhodamine-5-(and-6)-isothiocyanate | SERS-based magnetic immunoassay | Simultaneous detection of f-PSA and c-PSA markers in blood serum | L |
| 2019 | Chen et al. | Cancer, Prostate | Antibody-functionalized gold-silver core-shell nanoparticles labeled with Raman reporters | SERS-based vertical flow assay (VFA) | Quantitative and rapid detection of three prostate biomarkers, PSA, CEA, and AFP, on a single test spot | M |
| 2019 | Su et al. | Cardiorenal syndrome | Au-ag nanostars and au-ag-au substrate | SERS-based sandwich immunoassay | Probe and substrates allowed for accurate detection of 3 biomarkers simultaneously. | N |
| 2018 | Zhang et al. | Circulating breast cancer cells | "Nanovector" (Gold nanosphere with silver coating, Raman reporters, and aptamer binding) | Microfluidic Chip with multiple spectrally orthogonal SERS | Microfluidic based separation of CTCs from blood samples. CTCs were labeled with different Raman reporter labeled NPs corresponding to different biomarkers. | O |
| 2020 | Chen et al. | Inflammation | Antibody-functionalized gold-silver core-shell labeled with Nile blue A (NBA), pMBA, and DNTB | SERS-based vertical flow assay (VFA) | Vertical flow assay system with nanoporous anodic aluminum oxide as sensing membrane, and encoded core–shell SERS nanotags as labels for multiple inflammatory biomarkers detection | 253 |
| 2022 | Chen et al. | Kidney donation | Gold nanoparticles deposited on black phosphorus nanosheets. | SERS substrate | Quantitative detection of SLPI and IL-18 were then achieved by characterizing SERS signals | P |
| 2020 | Wen et al. | Myocardial Infraction | Sandwich immunoassay using polyclonal antibodies coated magnetic beads to capture the biomarkers. Gold nanostars labeled with Raman tags and short peptides to detect biomarkers. | SERS-based sandwich immunoassay | Multiplexed detection of two biomarkers of myocardial infarction including cardiac troponin I and neuropeptide Y with PRADA with high sensitivity and specificity in patient sera. | 265 |
| 2016 | Pazos et al. | Ovarian adenocarcinoma | SERS-active peptide-conjugate bound to silica-silver microbead | SERS microbeads | A SERS-active chemoreceptor peptide probe was developed to bind c-MYC, a common oncogene. | Q |
| 2019 | Banaei et al. | Ovarian, pancreatic cancer, pancreatitis | Raman reporter/antibody -labeled antibody nanoparticle, and gold substrate | SERS-based immunoassays | Biomarker signals for patient samples was analyzes using SERS, and the biomarker measurements were able to differentiate the patients based on a biomarker classification tree. | R |
| 2020 | Zhang et al. | Panc-1 cells, a human pancreatic cancer cell line | AuNPs as the plasmonic core, MBA, DTNB, and TFMBA were used as the Raman reporter molecules | SERS and luminescence active platform | Simple and sensitive SERS assay to enable multiplexed phenotype profiling of cancer-derived small EVs in a single sample and in a single test, without complex EV isolation steps | S |
| 2022 | Li et al. | Pancreatic cancer | 3D silver substrate with CD63a to bind to exosomes, and Raman labeled probes to bind to LRG1 and GPC1 | SERS-based magnetic immunoassay | A magnetic separation system and 3D substrate was used to capture exosomes from samples. | T |
| 2016 | Wang et al. | Precocious Puberty | Magnetic bead capture using antibody functionalized gold nanospheres labeled with Malachite green isothiocyanate | SERS-based immunoassays | SERS-based competitive immunoassay for highly sensitive E2 detection in clinical serum. | U |
| 2018 | Chen et al. | Proof of Concept | Silver NPs with molecular-imprinted sensors. | SERS nanoprobes | Silver NPs were coated with functional monomer to make MIP sites to bind to BSA, allowing the NPs to be used as a substrate to image BSA in other solutions. | V |
| 2022 | Mogera et al. | Proof of Concept | Gold nanorods embedded in a paperfluidic device. | plasmonic paper–based microfluidic (paperfluidic) SERS | Plasmonic paperfluidic patch allowed for sweat analysis, including the quantitative concentration of uric acid. | 275 |
| 2016 | Ando et al. | Protein Discovery | Alkyne modified small molecules | SERS nanoparticle substrate | HPLC was used to separate protein fragments, and SERS was used to identify fragments containing alkynes, allowing the identification of the binding site of the small molecule. | W |
| 2020 | Rickard et al. | Traumatic Brain Injury | Gold-coated pillar array substrate. | SERS-integrated optofluidic | The microfluidics assay allowed for sensitive detection of neural biomarkers in plasma samples, allowing for the detection of traumatic brain injury. | X |
| 2017 | Sánchez-Purrà et al. | Zika virus & dengue virus | Gold nanostars conjugated with antibodies and labeled with reporters BPE and pMBA. | SERS-based lateral flow immunoassay | Lateral flow assays (LFAs) based SERS can decrease the limit of detection (LOD) relative to colorimetric LFAs by 15-fold for ZIKV NS1 and 7.2-fold for DENV NS1 | 272 |
Maurer, V.; Frank, C.; Porsiel, J. C.; Zellmer, S.; Garnweitner, G.; Stosch, R. Step-by-Step Monitoring of a Magnetic and Sers-Active Immunosensor Assembly for Purification and Detection of Tau Protein. J Biophotonics. 2020, 13, e201960090.
Cheng, Z.; Wang, R.; Xing, Y.; Zhao, L.; Choo, J.; Yu, F. Sers-Based Immunoassay Using Gold-Patterned Array Chips for Rapid and Sensitive Detection of Dual Cardiac Biomarkers. Analyst. 2019, 144, 6533–6540.
Hu, C.; Ma, L.; Guan, M.; Mi, F.; Peng, F.; Guo, C.; Sun, S.; Wang, X.; Liu, T.; Li, J. Sers-Based Magnetic Immunoassay for Simultaneous Detection of Ctni and H-Fabp Using Core-Shell Nanotags. Anal. Methods. 2020, 12, 5442–5449.
Li, N.; Zong, S.; Zhang, Y.; Wang, Z.; Wang, Y.; Zhu, K.; Yang, K.; Wang, Z.; Chen, B.; Cui, Y. A Sers-Colorimetric Dual-Mode Aptasensor for the Detection of Cancer Biomarker Muc1. Anal. Bioanal. Chem. 2020, 412, 5707–5718.
Xiao, R.; Lu, L.; Rong, Z.; Wang, C.; Peng, Y.; Wang, F.; Wang, J.; Sun, M.; Dong, J.; Wang, D.; et al. Portable and Multiplexed Lateral Flow Immunoassay Reader Based on Sers for Highly Sensitive Point-of-Care Testing. Biosens. Bioelectron. 2020, 168, 112524.
Bhamidipati, M.; Cho, H. Y.; Lee, K. B.; Fabris, L. Sers-Based Quantification of Biomarker Expression at the Single Cell Level Enabled by Gold Nanostars and Truncated Aptamers. Bioconjug. Chem. 2018, 29, 2970–2981.
Qu, A.; Wu, X.; Xu, L.; Liu, L.; Ma, W.; Kuang, H.; Xu, C. Sers- and Luminescence-Active Au-Au-Ucnp Trimers for Attomolar Detection of Two Cancer Biomarkers. Nanoscale. 2017, 9, 3865–3872.
Wang, J.; Xie, H.; Ding, C. Designed Co-DNA-Locker and Ratiometric Sers Sensing for Accurate Detection of Exosomes Based on Gold Nanorod Arrays. ACS Appl. Mater. Interfaces. 2021, 13, 32837–32844.
Xia, J.; Liu, Y.; Ran, M.; Lu, W.; Bi, L.; Wang, Q.; Lu, D.; Cao, X. The Simultaneous Detection of the Squamous Cell Carcinoma Antigen and Cancer Antigen 125 in the Cervical Cancer Serum Using Nano-Ag Polydopamine Nanospheres in an Sers-Based Lateral Flow Immunoassay. RSC Adv. 2020, 10, 29156–29170.
Wu, Q.; Chen, G.; Qiu, S.; Feng, S.; Lin, D. A Target-Triggered and Self-Calibration Aptasensor Based on Sers for Precise Detection of a Prostate Cancer Biomarker in Human Blood. Nanoscale. 2021, 13, 7574–7582.
Du, Y.; Liu, H.; Tian, Y.; Gu, C.; Zhao, Z.; Zeng, S.; Jiang, T. Recyclable Sers-Based Immunoassay Guided by Photocatalytic Performance of Fe3o4@Tio2@Au Nanocomposites. Biosensors. 2020, 10, 25.
Cheng, Z.; Choi, N.; Wang, R.; Lee, S.; Moon, K. C.; Yoon, S. Y.; Chen, L.; Choo, J. Simultaneous Detection of Dual Prostate Specific Antigens Using Surface-Enhanced Raman Scattering-Based Immunoassay for Accurate Diagnosis of Prostate Cancer. ACS Nano. 2017, 11, 4926–4933.
Chen, R.; Liu, B.; Ni, H.; Chang, N.; Luan, C.; Ge, Q.; Dong, J.; Zhao, X. Vertical Flow Assays Based on Core-Shell Sers Nanotags for Multiplex Prostate Cancer Biomarker Detection. Analyst. 2019, 144, 4051–4059.
Su, Y.; Xu, S.; Zhang, J.; Chen, X.; Jiang, L. P.; Zheng, T.; Zhu, J. J. Plasmon near-Field Coupling of Bimetallic Nanostars and a Hierarchical Bimetallic Sers "Hot Field": Toward Ultrasensitive Simultaneous Detection of Multiple Cardiorenal Syndrome Biomarkers. Anal. Chem. 2019, 91, 864–872.
Zhang, Y.; Wang, Z.; Wu, L.; Zong, S.; Yun, B.; Cui, Y. Combining Multiplex Sers Nanovectors and Multivariate Analysis for in Situ Profiling of Circulating Tumor Cell Phenotype Using a Microfluidic Chip. Small. 2018, 14, e1704433.
Chen, H.; Luo, C.; Xing, L.; Guo, H.; Ma, P.; Zhang, X.; Zeng, L.; Sui, M. Simultaneous and Ultra-Sensitive Sers Detection of Slpi and Il-18 for the Assessment of Donor Kidney Quality Using Black Phosphorus/Gold Nanohybrids. Opt. Express. 2022, 30, 1452–1465.
Pazos, E.; Garcia-Algar, M.; Penas, C.; Nazarenus, M.; Torruella, A.; Pazos-Perez, N.; Guerrini, L.; Vazquez, M. E.; Garcia-Rico, E.; Mascarenas, J. L.; et al. Surface-Enhanced Raman Scattering Surface Selection Rules for the Proteomic Liquid Biopsy in Real Samples: Efficient Detection of the Oncoprotein C-Myc. J. Am. Chem. Soc. 2016, 138, 14206–14209.
Banaei, N.; Moshfegh, J.; Mohseni-Kabir, A.; Houghton, J. M.; Sun, Y.; Kim, B. Machine Learning Algorithms Enhance the Specificity of Cancer Biomarker Detection Using Sers-Based Immunoassays in Microfluidic Chips. RSC Adv. 2019, 9, 1859–1868.
Zhang, W.; Jiang, L.; Diefenbach, R. J.; Campbell, D. H.; Walsh, B. J.; Packer, N. H.; Wang, Y. Enabling Sensitive Phenotypic Profiling of Cancer-Derived Small Extracellular Vesicles Using Surface-Enhanced Raman Spectroscopy Nanotags. ACS Sens. 2020, 5, 764–771.
Li, J.; Li, Y.; Chen, S.; Duan, W.; Kong, X.; Wang, Y.; Zhou, L.; Li, P.; Zhang, C.; Du, L.; et al. Highly Sensitive Exosome Detection for Early Diagnosis of Pancreatic Cancer Using Immunoassay Based on Hierarchical Surface-Enhanced Raman Scattering Substrate. Small Methods. 2022, 6, e2200154.
Wang, R.; Chon, H.; Lee, S.; Cheng, Z.; Hong, S. H.; Yoon, Y. H.; Choo, J. Highly Sensitive Detection of Hormone Estradiol E2 Using Surface-Enhanced Raman Scattering Based Immunoassays for the Clinical Diagnosis of Precocious Puberty. ACS Appl. Mater. Interfaces. 2016, 8, 10665–10672.
Chen, S.; Dong, L.; Yan, M.; Dai, Z.; Sun, C.; Li, X. Rapid and Sensitive Biomarker Detection Using Molecular Imprinting Polymer Hydrogel and Surface-Enhanced Raman Scattering. Royal Soc. Open Sci. 2018, 5, 171488.
Ando, J.; Asanuma, M.; Dodo, K.; Yamakoshi, H.; Kawata, S.; Fujita, K.; Sodeoka, M. Alkyne-Tag Sers Screening and Identification of Small-Molecule-Binding Sites in Protein. J. Am. Chem. Soc. 2016, 138, 13901–13910.
Rickard, J. J. S.; Di-Pietro, V.; Smith, D. J.; Davies, D. J.; Belli, A.; Oppenheimer, P. G. Rapid Optofluidic Detection of Biomarkers for Traumatic Brain Injury Via Surface-Enhanced Raman Spectroscopy. Nat. Biomed. Eng. 2020, 4, 610–623.
5. Metal-free Nanoprobes for Applications in Biological Raman-silent Region
In section 4, we primarily discussed the merits of metal NPs for SERS from in vivo imaging to in vitro biosensing. Indeed metallic NPs and nanoscale interfaces have dominated the field that has led to a number of new discoveries, innovation in new biological phenomena, and a range of biomedical applications. However, metal NPs based SERS labels have several limitations that hinder their clinical translation. (i) Whereas gold NPs has been extensively used for SERS in vivo due to their biocompatibility, solid metal NPs typically accumulate in organs of the reticuloendothelial system (liver and spleen) and have very slow breakdown and clearance in vivo. This has been supported by several findings including our group’s recent work.277–279 (ii) Metal NPs are known to aggregate easily and several surface protective ligands are necessary to enable colloidal stability.280 While high molecular weight ligands such as PEG are excellent in coating the surface and providing NP stability they also compromise SERS signal of Raman reporters. (iii) Applications of SERS both in vivo and ex vivo have largely used Raman reporters with peaks in the biologically-active fingerprint region (400–1700 cm−1) that compete with autofluorescence from tissues and biofluids and reduce the overall SNR.281 (iv) These Raman molecules also have peaks that overlap with endogenous vibrations from metabolites such as phenylalanine (1000 cm−1) and others (see section 3 for a detailed discussion of metabolites), leading to a reliance on multiplexing with only a few frequently used Raman reporters such as DTNB, pMBA, and 4-ATP. These limitations have motivated the design of metal-free nanoprobes (Fig. 15a) that are highly reproducible, require minimal surface processing to improve stability, show biocompatibility and leverage Raman reporters in the biological Raman-silent region from 1740 to 2800 cm-1 (see Fig. 1b). Recent findings highlight that polymer NPs doped with such Raman reporters fulfil these design objectives. These studies have successfully shown biological sensing with both spontaneous Raman and SRS.42, 282–285 In this section, we discuss some examples of these new directions in metal-free nanoprobes for RS and follow up with a discussion in the conclusions and future directions section on improvements necessary to push these metal-free NPs towards the path of clinical use.
Figure 15.
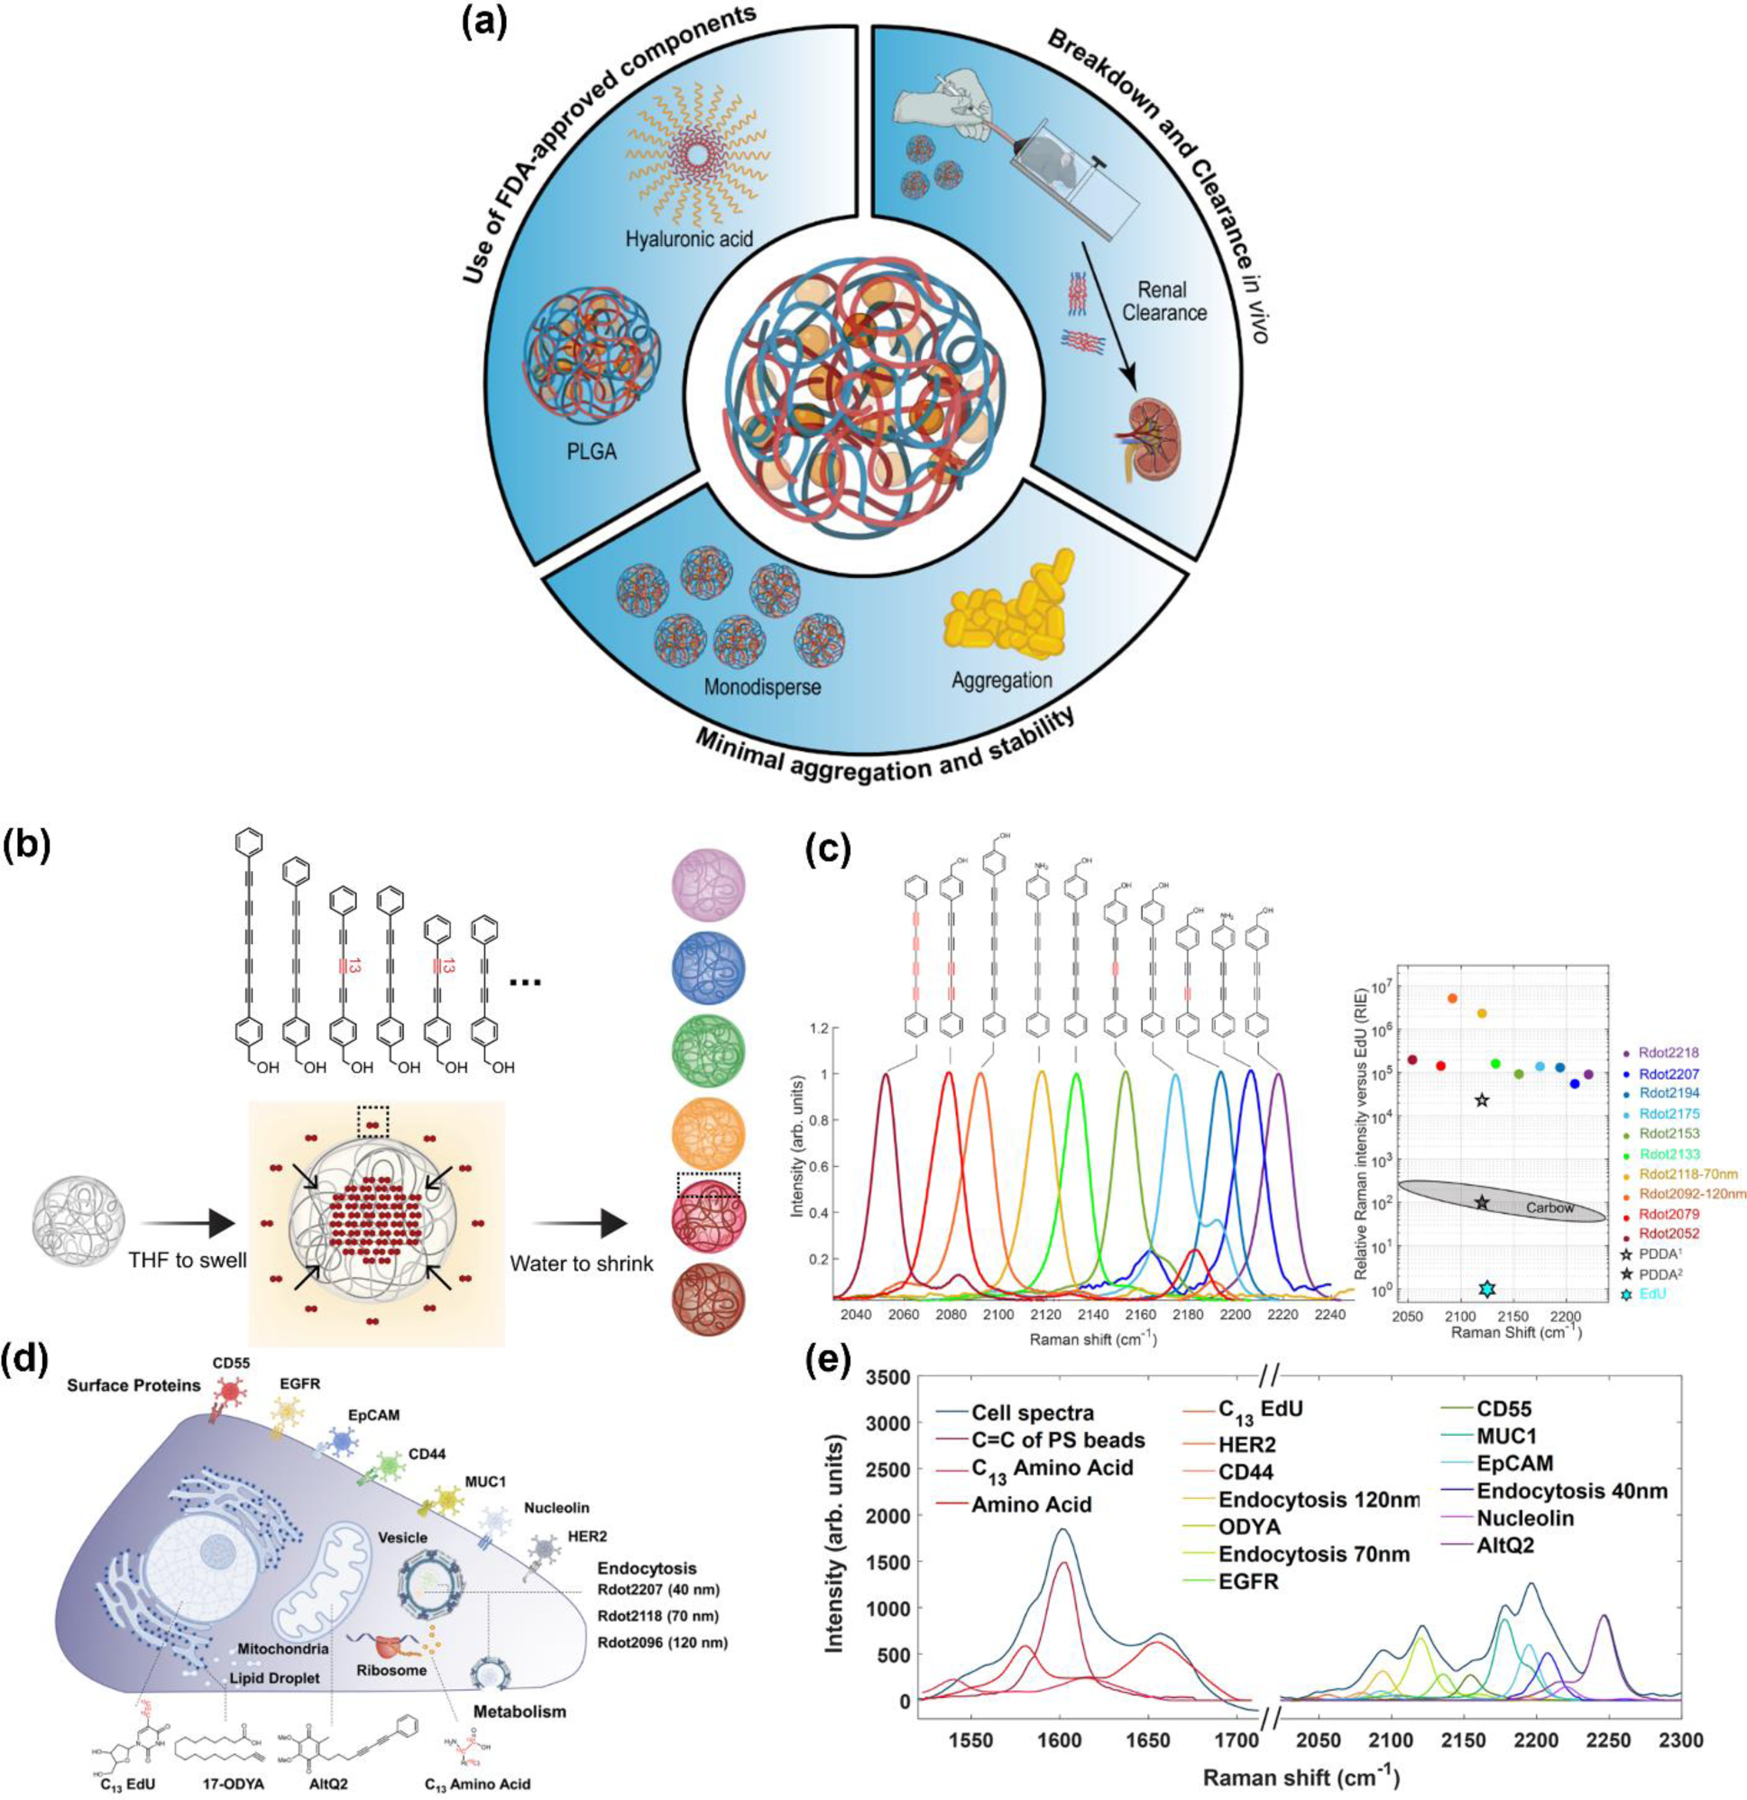
(a) Schematic representation highlighting advantages of metal-free NPs including rapid renal clearance, monodispersity and high stability, use of food and drug administration (FDA) approved components, and leveraging Raman silent region to minimize overlap with endogenous biomolecules. (b) Synthesis of bright R dots where polystyrene NPs are swelled in organic solvents and small-molecule Raman probes are allowed to diffuse in followed by shrinking the polystyrene toentrap the Raman probes. (c) Normalized Raman spectra of ten-colored Rdots with corresponding doped dye structure. Right: RIE values and Raman peak positions of ten-colored Rdots. Adapted from ref 292. Copyright 2021 Springer Nature under CC BY 4.0 license (https://creativecommons.org/licenses/by/4.0/). (d) Schematic illustrating the cellular localization of 14 Raman probes for multiparameter live-cell profiling. (e) Normalized Raman peaks of the Raman probes with distinct frequencies with unmixing processing in the silent window. Adapted from ref 293. Copyright 2021 Springer Nature under CC BY 4.0 license (https://creativecommons.org/licenses/by/4.0/).
Early work leveraging the biological Raman-silent region focused on synthesizing bioorthogonal vibrational reporters composed of alkyne, nitrile, and carbon–deuterium bonds. Several Raman-responsive molecules have emerged in the past decade as fluorescence background-free and photobleaching-free probes that use carbon triple bond molecules to generate distinctive Raman frequencies.130, 258, 286 Among these vibrational probes, alkyne tags have been highly desirable due to a versatility in modifying chemical structures to generate a range of tags with complementary peak positions.259 Further, alkyne tags have an unique ability to label several biological molecules of interest including lipids, nucleosides, sugars, amino acids, and other bioactive molecules to enable high-resolution cellular imaging. 284, 287, 288 For example, Lee et al. synthesized a Raman probe, phenyl-diyne cholesterol, and demonstrated its use for imaging cholesterol esterification, storage, and trafficking inside living cells and c. Elegans.288 In another example where alkyne-modified derivatives of a bioactive molecule were synthesized, Tipping et al. modified anisomycin, a potent inhibitor of the mitogen-activated protein kinase pathway.289 The modified Raman-active drug’s efficacy and organelle distribution was directly monitored in cells with SRS. While both examples achieved high contrast and revealed crucial cellular information, these small molecule approaches do have significant limitations. Most small molecules are unstable in a cellular environment without encapsulation in a protective NP.290 This limits their translation in vivo in murine models or larger animals. Further, direct modification of drug molecules for imaging often compromises their therapeutic efficacy and may lead to other unexpected side effects.
Inspired by these findings Min and co-workers have propelled innovations in encapsulating alkyne-based reporters in polymer NPs to enhance the stability and brightness of the nanoprobes. They reported synthesizing and optimizing Raman-active polymer nanodots to allow multiplexing in live cells.291 In their design approach, polystyrene NPs were synthesized with a hydrophobic styrene moiety that enabled conjugation with hydrophobic Raman reporters through an oil-in-water emulsion technique.291 The NPs were doped with bioorthogonal vibrational reporters of alkyne, nitrile, and carbon–deuterium bonds in the Raman-silent region to achieve precise peaks at 2163 cm−1, 2232 cm−1, and 2293 cm−1 without signal interference in cells. These three “color” polymer nanodots enabled multiplexed live-cell sorting in the co-culture of three distinct cell lines. Most polymer-conjugated Raman nanoprobes have been synthesized by covalent conjugation between the reporter and the polymer surface.292 But in a follow-up work, the same authors designed a new set of Raman active NPs (Rdots) without any chemical or surface modifications (Fig. 15b). In their innovative approach, they developed “carbon rainbow,” or Carbow dyes which consisted of a library of 20 polyynes that exhibited distinct Raman frequencies. . These dyes were then loaded into small 20 nm polystyrene NPs as biofunctional Rdots where the tight stacking of the Rdots, likely emerging from the intermolecular interactions between the polymer and the Raman reporter, resulted in uniform and enhanced signal in SRS.292 In their subsequent work, the Min and co-workers leveraged these “bright” small Rdots for multiplexed detection of different surface receptors in different cancer cell lines (Fig. 15c).293 In the same work, a panel of 14 probes was introduced in a single cell line for highly multiplexed live-cell imaging that enabled detection of surface receptors and metabolites, and tracked the endocytosis of the NPs (Fig. 15d, e). The authors also showed treatment response with their live-cell multiparameter profiling platform after treating cells with five distinct chemotherapy agents. A tSNE analysis of the Raman spectra of single cells of SKBR3 cells treated with the five drugs showed clear clustering, which indicates that treatment response can be captured by their automated whole-cell Raman micro-spectroscopy approach. Despite this excellent body of work, polystyrene NPs are known to be toxic in vivo and therefore, other biocompatible polymers have been explored to translate this work beyond in vitro systems.294
In searching for clinically relevant NP polymers, polylactic-co-glycolic acid (PLGA) is a key candidate. PLGA is approved by the U.S. FDA and has been extensively used in diagnostic and therapeutic applications.295, 296 Applying this polymer, Hulme et al. compared the deuterium and alkyne-labeled analogs of PLGA NPs and found the latter had a stronger Raman signal resulting from integrating the alkyne groups into the rigid polymer backbone and the delocalized p-conjugated structure.296, 297 While direct in vivo imaging was not possible, ex vivo studies of mouse cortical brain slices showed PLGA NPs distribution in the tissue, and depth analysis with Raman captured their heterogeneous uptake. Their Raman findings were supported and validated by immunofluorescence imaging. To enable in vivo translation of metal-free Raman nanoprobes, Jin et al. designed polymethacrylate polymer beads with high densities of alkyne, nitrile, azido, or carbon–deuterium moieties with vibrational bands between 2100– 2400 cm−1 ideal for multiplexing in vivo (Fig. 16a–c).285 The authors conjugated two oligonucleotide aptamers and one targeting peptide to the different polymer beads to target nucleolin, mucin-1 protein, and αvβ3 integrin in cancer cells and showed specific accumulation in MCF-7 cells (Fig. 16d). Systemic intravenous delivery of the beads (Fig. 16e) showed high accumulation in tumors in vivo and minimal in the spleen, consistent with clearance of polymer NPs.298 This work demonstrates that polymer-based Raman nanoprobes can achieve high sensitivity and specificity for direct in vivo bioimaging. However, methacrylate is highly toxic, and the dose of the NPs has to be regulated to minimize additional toxicities while achieving high SNR. Therefore, there remains room for improvement in the design, composition, and surface properties of metal-free Raman nanoprobes to achieve success in vivo imaging. We have provided further discussion in section 6 on innovations in metal-free NPs necessary to enable high in vivo biocompatibility and ultimate transition to clinical use.
Figure 16.
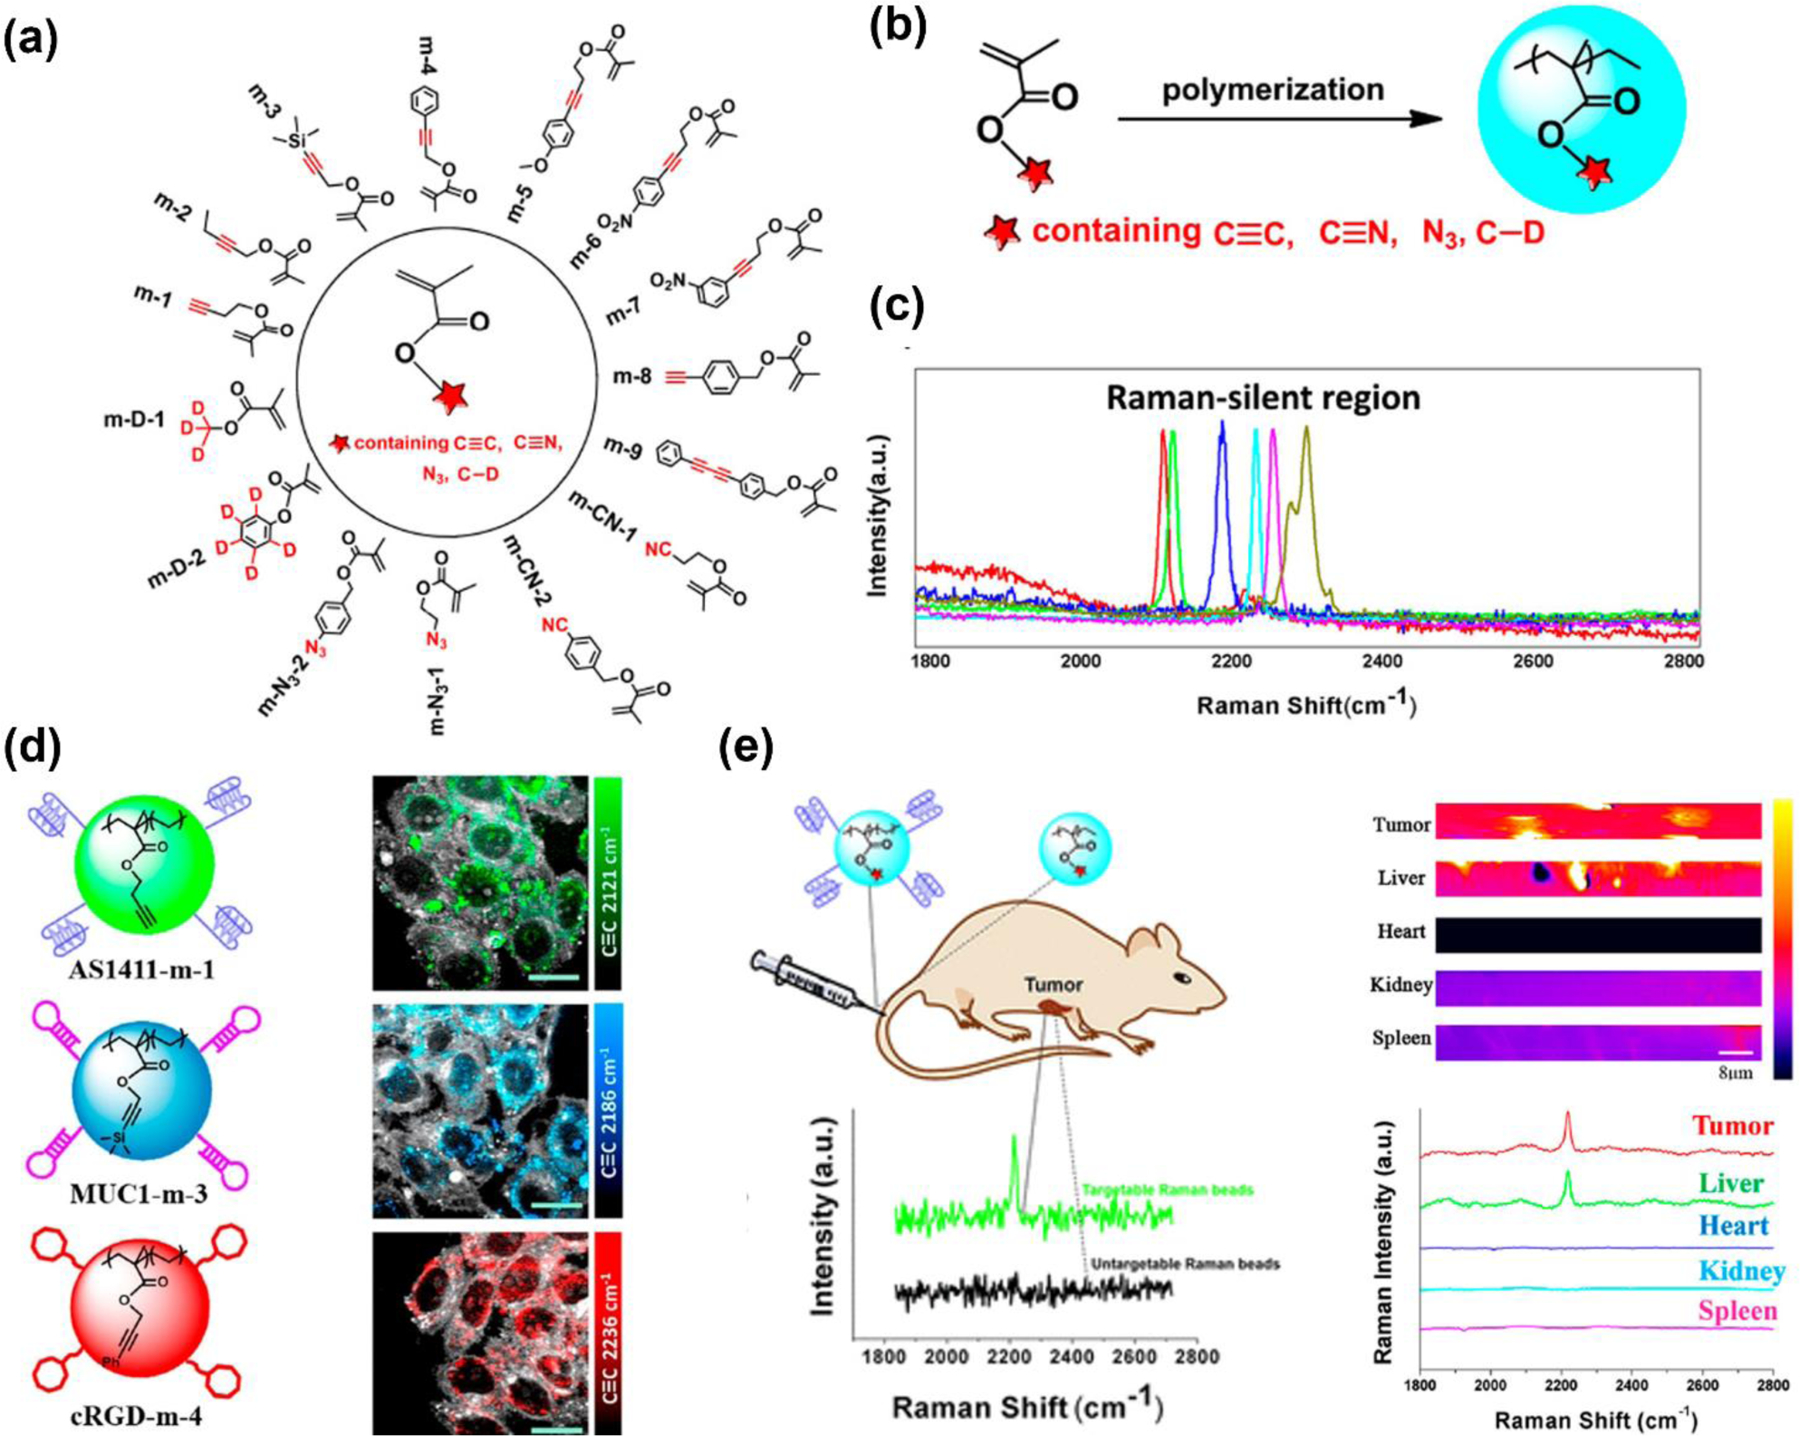
(a) Schematic showing the chemical structure of Raman active monomers. (b) Synthetic route of Raman beads. (c) Spectra of Raman beads with orthogonal vibrational modes of alkyne, nitrile, azido, and carbon–deuterium bonds. (d) Three-color targeted Raman beads incubated separately with MCF-7 cells achieved Raman detection in silent region at 2121 cm–1, 2186 cm–1, and 2236 cm–1. (e) In vivo tumor targeting and spectral detection of cRGDfk-Raman beads with high signal in tumors. Adapted with permission from ref 269. Copyright 2019 American Chemical Society.
6. Conclusions and Future Perspectives
This comprehensive review summarizes the recent findings in RS that focus on understanding the changes in metabolome and proteome during disease progression and in response to clinical therapies to ultimately shape the future of precision medicine. We discussed the utility of label-free Raman for metabolic measurement in cancer, gastrointestinal diseases, cardiac disorders, and neurodegenerative/neuromuscular diseases, primarily ex vivo in cells, tissues, and patient biospecimens, and included a brief discussion on in vivo metabolite detection. We highlighted recent advances in SERS for multiplexed imaging in vivo orchestrated by rationally-designed metal NPs. We reviewed multi-modal SERS approaches, in which Raman was combined with other pre-clinical and clinical imaging for holistic molecular imaging before, during, and after a clinical procedure. We also discussed the utility of SERS-based POC devices for rapid, multiplexed, highly sensitive, and specific detection of biomarkers ex vivo as sandwich immunoassays, lateral flow assays, and in unique microfluidics devices. Finally, we summarized the progress in metal-free NPs with Raman reporters that leverage biological Raman-silent region to probe biomedical phenomena not possible in the fingerprint region where multiple overlapping peaks from tissues and cells interfere with the reporter molecules.
The topics summarized in this review demonstrate the potential of RS in advancing existing pre-clinical and clinical methodologies by complementing these well-established approaches and surmounting the challenges in these technologies. For example, the high sensitivity and multiplexing of RS in vivo, combined with the depth-resolved 3D spatial imaging of clinical modalities such as MRI (see Table 2) will enable exceptional precision before, during, and after surgery. This was recently demonstrated in a prospective pilot clinical study where 18 prostate cancer patients were recruited and underwent high-dose-rate brachytherapy. Preoperative multiparametric MRI with intraoperative transrectal ultrasound was used to guide an RS needle in the prostate before brachytherapy for in situ determination of biochemical features that identify cancer lesions.299 RS also has the potential to transform difficult-to-diagnose disorders by enabling longitudinal monitoring of biochemical alterations that can be established as key biomarkers. This was shown in a pilot study where RS was directly used in the cervix of 68 healthy pregnant women to monitor changes throughout their pregnancy.300 The authors found an increase in Raman peaks corresponding to blood and cholesterol with increasing gestation week, but a decrease in actin and type 1 collagen attributed to cervical remodelling as the pregnancy progressed. Beyond in vivo detection, for in vitro diagnostic assays discussed in this review, RS has already achieved detection sensitivities that surpass that of standard clinical assays such as ELISA (enzyme-linked immunosorbent assay).
Further, RS offers both time- and cost-benefit relative to widely-established approaches such as PCR (polymerase chain reaction). For example, in a recent study, nasopharyngeal swab samples from 15 COVID-19 patients and five negative diagnosis control patients was assessed with SERS within 30 minutes per sample, and their approach reached detection limits of 2.56 fg/mL and the viral lysates at 3.4 PFU/mL.301 Whereas these results are fascinating, since PCR is the current clinical workhorse for molecular diagnostics, it is unlikely that SERS will replace this established technology. A more practical approach would be to combine the strengths of RS and PCR to enable a technology that achieves the sensitivity and specificity of PCR with the rapid and cost-effective analysis of RS. A recent study accomplished this goal by developing a SERS-PCR platform to detect SARS-CoV-2 target genes and reduce the overall time needed for diagnosis by reducing the number of thermocycling steps needed to amplify the DNA.302 These examples give us confidence that RS could be adopted in clinical use, emerging as the “new workhorse” of clinical sampling and an in situ non-invasive “optical metabolic” measure of disease progression. Indeed, there are 34 clinical trials ongoing globally where RS is being leveraged in many disease diagnostics, including cancer, autoimmune, and infectious diseases (NCT05265624, NCT04040673, NCT04888299, NCT05320250, and NCT05701254, among others). For example, trial # NCT05265624, which is a phase 2 study of the impact of pre-symptomatic genetic risk assessment for age-related macular degeneration (AMD), RS is being directly measured in patient skin to assess changes in skin carotenoid status. Carotenoid deficiency plays a key role in AMD progression.303 This is an excellent example of the clinical utility of RS since carotenoids have distinct Raman peaks at 1154 cm−1 and 1517 cm−1. The use of RS may ultimately allow a rapid and sensitive diagnosis of AMD that surpasses the current clinical standard of visual acuity exam and use of an Amsler grid. Another trial (NCT04583306) aimed to validate the salivary Raman fingerprint of COVID-19 and identify the key molecular signature that differentiates healthy subjects from existing COVID-19 patients and those with a past infection of COVID-19. The ultimate goal of this trial was to characterize patient samples with a benchtop Raman (which has higher sensitivity and specificity) and translate the classification models they developed to a portable Raman to enable point-of-care diagnostics. We envision that success of this trial will enable RS as a new contender for rapid on-site COVID-19 diagnostics for both new and past infections in patients that can also be implemented at rural sites. Further, an in-depth biochemical profile of patient samples may help address the pressing question, “how long does COVID-19 vaccine-induced immunity truly last?”
Whereas RS has the potential to revolutionize clinically-relevant innovations, emerging new areas still need to be explored where RS can play a key role in mechanistic understanding of the dynamic metabolome and proteome. In section 3.3 we discussed label-free RS to probe metabolites directly in vivo, and most of the examples we highlighted were executed in mouse models. In vivo metabolic monitoring in human patients currently needs to be explored further. In one successful example, Jermyn et al. used a handheld, portable, fiber-optic RS probe directly in 17 glioma patients for intraoperative brain cancer detection.304 The authors identified key metabolites (cholesterol, phospholipids, and nucleic acids) that differentiated normal brain tissues from the cancerous and invasive margin. This study emphasizes that direct in vivo monitoring of dynamic changes in metabolites and proteins in human patients is crucial to understanding the pathophysiology of a disease that cannot be captured by ex vivo analysis of patient samples. The clinical translation of RS towards patient-centred disease monitoring necessitates such in vivo studies in humans. However, studies in human subjects require multiple steps such as approval from the institutional review board (IRB), patient consent, patient recruitment, coordinating with a physician for data collection, and availability of trained personnel prepared for challenges that may arise during in vivo measurements. Collaborative efforts among scientists with expertise in RS, and clinicians with access to patients will ultimately be key in overcoming the hurdles of moving RS toward clinical applications.
The integration of RS with multi-omics technologies also needs to be explored. Whereas a few exciting works were discussed in section 3.4, future advances in this area will require combining RS data in cells, tissues, and clinical samples with large-scale multi-omics studies. Clinically-relevant correlation analysis is necessary to correlate RS data to omics data, patient demographics, and co-morbidities in order to identify risk factors, resistance mechanisms, mutational burden, and therapeutic indexes. Combining RS and omics data with cutting-edge artificial intelligence approaches that allow multimodal data aggregation and developing a database of clinical predictors will facilitate rapid clinical decisions. Such progressive approaches will advance RS from a discovery tool to a patient-oriented diagnostic method. In this effort, researchers could work with biobanks to access archived patient samples and accompanying clinical datasets to enable this vision of transforming RS to a clinical tool. For example, NIH-supported repositories such as NeuoBioBank, Aging Research Biobank, Patient-Derived Models Repository, and the All of Us Research Program biobank are excellent resources to access samples for a nominal fee focused on various human diseases. We envision that the near-term goal would be to extend multimodal RS + omics technologies to new clinical treatments, for example, immunotherapies, to examine how metabolic profiling in RS corresponds to genomic changes when immune cells are activated and checkpoint receptors are blocked. The long-term goal is to shift from the traditional symptom-driven prognosis to accurate predictive diagnostics personalized to each patient that allow early and effective interventions.
Regarding dynamic in vivo imaging, in section 5 we discussed the use of metal-free polymer-based NPs that use Raman reporters in the biological Raman-silent region (1740–2800 cm−1). While an extremely promising area of research, longitudinal in vivo imaging has been difficult to achieve due to the weak Raman scattering cross-sections of reporters in this region that has necessitated high doses of the reporters for molecular signal. Further, many of these reporters have poor solubility in biocompatible solvents requiring toxic polymers such as polymethacrylate and polystyrene to encapsulate the reporters and achieve high SNR. Therefore, we envision that innovative approaches are necessary for advancing in vivo imaging in the Raman-silent region. These include: (i) The synthesis of new Raman probes with appropriate surface groups that will allow solubility in common solvents and biocompatibility without compromising the alkyne or other moieties that enable bright Raman signal. (ii) New fabrication methods that facilitate high encapsulation efficiency and high stability of Raman probes in biocompatible and clinically approved polymers such as PLGA or alginate to achieve in vivo imaging probes translated to the clinic. (iii) Optimize the chemistry to integrate clinical contrast agents such as radiolabels (64Cu, 89Zr) for PET and metallic ions (Gadolinium or Fe3O4) for MRI to enable holistic imaging. And (iv) adopt the concept of SERS with biocompatible polymers to improve signal in vivo by using biodegradable gold nanoclusters that can break down and achieve renal clearance overcoming some of the hurdles of metal NPs that limit their clinical relevance.305, 306 Towards this last goal, Alkilany et al. synthesized glutathione-capped gold nanoclusters by hydrophobic ion pairing with an alkylamine and showed complete phase transfer to various organic solvents while maintaining high colloidal stability. A high density of such nanoclusters encapsulated in a polymer NP could achieve enhanced SERS signal in the Raman-silent region enabling longitudinal in vivo imaging with minimal signal loss while achieving rapid clearance. We anticipate that such innovations will generate a “new class” of imaging probes that will surpass the capabilities of current SERS NPs.
We also want to highlight another unique and unconventional application of RS that should be leveraged in near future as a new direction in medical imaging. Raman holographic imaging was recently demonstrated by Liebel et al.307 Holography is a disruptive innovation that has been traditionally applied in virtual reality, digital art, and in the military. Coined by Nobel Prize winner Dr. Dennis Gabor in 1948, holography is now a cornerstone in healthcare allowing 3D visualisation of a patient’s body with high resolution.308 Holography has propelled the advanced training of medical students, and physicians have achieved precision during surgeries and other medical procedures.309, 310 Liebel et al. used spontaneous RS, which is incoherent radiation, for the generation of holographic imaging, which would seem impossible since holography relies on coherent light. However, the authors coupled a Michelson interferometer with a holographic microscope and then recorded the phase and the amplitude of wide-field images of SERS NPs and the corresponding Raman spectra to obtain SERS-based holographic images. The authors applied this technology to 3D live cell tracking, where the trajectories of individual SERS NPs were imaged with high precision. We envision that holographic imaging with RS will have tremendous futuristic potential when combined with clinical diagnostics such as CT and MRI. Such multimodal holographic imaging will enable pre-, intra-, and postoperative imaging where 3D holograms of the diseased site could potentially revolutionize precision medicine such as tumor margin delineation in the pre-metastatic niche, and high-risk cardiac and brain surgeries. Further live-tracking therapeutic agents will allow clinicians to determine why some drugs fail in clinical trials or have severe toxicities, completely transforming the drug discovery pipeline. Therefore, RS's future is expected to shift from lab-based detection of metabolites and proteins to clinically relevant radiological imaging propelled by new advances in SERS NPs and Raman spectrometers.
Acknowledgments:
G.C. acknowledge support from the National Institute of Health (NIH) grant 1R01EB029756-01A1. S. U. acknowledges support from CDMRP grant W81XWH1810139. N. H. acknowledges support from the Congressionally Directed Medical Research Program (CDMRP) grant W81XWH2010620. S. K. acknowledge support from the NIH grant 1R21HD100685-01. R.B. acknowledges support from CDMRP grants W81XWH1810139 and W81XWH2010620, and NIH grants 1R21HD100685-01 and 1R01EB029756-01A1.
Biographies
Mr. Gabriel Cutshaw is pursuing his Ph.D in Chemical and Biological Engineering at Iowa State University under the supervision of Prof. Rizia Bardhan. He received a B.S. in Chemical & Biochemical Engineering from Colorado School of Mines, USA. He received the Peter J. Reilly Graduate Scholarship and the Jerrold S. and Mary R. Feroe Endowed Engineering Scholarship in 2020. His research focuses on multimodal SERS nanoprobes in mice, and the application of multivariate analysis to label-free Raman spectroscopy in both patient biofluid and tissue samples.
Dr. Saji Uthaman is a Research Scientist at the Nanovaccine Institute and Department of Chemical and Biological Engineering at Iowa State University under the supervision of Prof. Rizia Bardhan. He received a Ph.D. in Biomedical Sciences from Chonnam National University, Republic of Korea. His expertise includes biomaterial synthesis, surface engineering with biomolecules, synthesis of drug delivery agents, and the utility of these biomaterials in diagnostic and therapeutic applications in cancer and inflammatory diseases.
Dr. Nora Hassan is a postdoctoral fellow the Nanovaccine Institute and Department of Chemical and Biological Engineering at Iowa State University under the supervision of Prof. Rizia Bardhan. She received a Ph.D. in Physics from Johns Hopkins University, USA. Her research interests are focused on various applications of Raman spectroscopy aided with machine learning including label-free Raman in cells, organoids, and tissues.
Mr. Siddhant Kothadiya is pursuing his Ph.D in Chemical and Biological Engineering at Iowa State University under the supervision of Prof. Rizia Bardhan. He received a BE in Chemical Engineering from Siddaganga Institute of Technology, Tumkur, India, and M.Sc in Industrial Chemistry from Technical University of Munich-National University of Singapore. He was awarded the Frederick Martinson Chemical Engineering Scholarship in 2021. His research focuses on both label-free Raman spectroscopy in patient samples, and SERS in mouse models of cancer.
Dr. Xiaona Wen is currently a senior scientist at Merck in the Biologics Analytical Research and Development division. She received a B.S. in Chemical Engineering from the University of California at Los Angeles, and a Ph.D. in Chemical and Bimolecular Engineering at Vanderbilt University, USA. Prior to graduate school, she also worked as a scientist at Amgen. Her research expertise is in the areas of process and analytical development, nanomedicine, drug delivery, and immunotherapies.
Prof. Rizia Bardhan is an Associate Professor at the Nanovaccine Institute and Department of Chemical and Biological Engineering at Iowa State University. She also serves as the Associate Editor of ACS Applied Materials and Interfaces. She received a B.A. in Chemistry and Mathematics from Westminster College, MO, and a Ph.D. in Chemistry from Rice University, USA. Her research interests are on nanoparticles for molecular imaging and image-guided immunotherapies, and in Raman spectroscopy and its applications in metabolism in various diseases. She received the CDMRP Career Development Award, NSF BRIGE award, ORAU’s Ralph E. Powe Junior Faculty Enhancement Award, and was named by Forbes Magazine as “Top 30 Under 30: Rising Stars of Science and Innovation”. She was also recognized as one of “40 Women Honorees in 40 Years” by her alma mater, Westminster College. Rizia has published >70 peer-reviewed papers which has received >10,700 citations and an h-index of 39.
Footnotes
Conflict of interest: The authors declare no conflict of interest.
References
- (1).Ashley EA Towards Precision Medicine. Nat. Rev. Genet 2016, 17, 507–522. [DOI] [PubMed] [Google Scholar]
- (2).Dugger SA; Platt A; Goldstein DB Drug Development in the Era of Precision Medicine. Nat. Rev. Drug Discov 2018, 17, 183–196. [DOI] [PMC free article] [PubMed] [Google Scholar]
- (3).Disease., N. R. C. U. C. o. A. F. f. D. a. N. T. o. Appendix a, the Statement of Task with Additional Context. In Toward Precision Medicine: Building a Knowledge Network for Biomedical Research and a New Taxonomy of Disease, The National Academies Collection: Reports Funded by National Institutes of Health, 2011. [PubMed] [Google Scholar]
- (4).König IR; Fuchs O; Hansen G; von Mutius E; Kopp MV What Is Precision Medicine? Eur. Respir. J 2017, 50, 1700391. [DOI] [PubMed] [Google Scholar]
- (5).McColl ER; Asthana R; Paine MF; Piquette-Miller M The Age of Omics-Driven Precision Medicine. Clin. Pharmacol. Ther 2019, 106, 477–481. [DOI] [PubMed] [Google Scholar]
- (6).Denny JC; Rutter JL; Goldstein DB; Philippakis A; Smoller JW; Jenkins G; Dishman E The “All of Us” Research Program. N. Engl. J. Med 2019, 381, 668–676. [DOI] [PMC free article] [PubMed] [Google Scholar]
- (7).Olivier M; Asmis R; Hawkins GA; Howard TD; Cox LA The Need for Multi-Omics Biomarker Signatures in Precision Medicine. Int. J. Mol. Sci 2019, 20, 4781. [DOI] [PMC free article] [PubMed] [Google Scholar]
- (8).Sandhu C; Qureshi A; Emili A Panomics for Precision Medicine. Trends Mol. Med 2018, 24, 85–101. [DOI] [PMC free article] [PubMed] [Google Scholar]
- (9).Wong AK; Sealfon RSG; Theesfeld CL; Troyanskaya OG Decoding Disease: From Genomes to Networks to Phenotypes. Nat. Rev. Genet 2021, 22, 774–790. [DOI] [PubMed] [Google Scholar]
- (10).Thiele I; Swainston N; Fleming RM; Hoppe A; Sahoo S; Aurich MK; Haraldsdottir H; Mo ML; Rolfsson O; Stobbe MD; et al. A Community-Driven Global Reconstruction of Human Metabolism. Nat. Biotechnol 2013, 31, 419–425. [DOI] [PMC free article] [PubMed] [Google Scholar]
- (11).Shilo S; Rossman H; Segal E Axes of a Revolution: Challenges and Promises of Big Data in Healthcare. Nat. Med 2020, 26, 29–38. [DOI] [PubMed] [Google Scholar]
- (12).Acosta JN; Falcone GJ; Rajpurkar P; Topol EJ Multimodal Biomedical Ai. Nat. Med 2022, 28, 1773–1784. [DOI] [PubMed] [Google Scholar]
- (13).MacEachern SJ; Forkert ND Machine Learning for Precision Medicine. Genome 2020, 64, 416–425. [DOI] [PubMed] [Google Scholar]
- (14).Raman CV; Krishnan KS A New Type of Secondary Radiation. Nature 1928, 121, 501–502. [Google Scholar]
- (15).Pence I; Mahadevan-Jansen A Clinical Instrumentation and Applications of Raman Spectroscopy. Chem. Soc. Rev 2016, 45, 1958–1979. [DOI] [PMC free article] [PubMed] [Google Scholar]
- (16).Nicolson F; Kircher MF; Stone N; Matousek P Spatially Offset Raman Spectroscopy for Biomedical Applications. Chem. Soc. Rev 2021, 50, 556–568. [DOI] [PMC free article] [PubMed] [Google Scholar]
- (17).Krafft C; Dietzek B; Schmitt M; Popp J Raman and Coherent Anti-Stokes Raman Scattering Microspectroscopy for Biomedical Applications. J. Biomed. Opt 2012, 17, 040801–040801–040801–040815. [DOI] [PubMed] [Google Scholar]
- (18).Krafft C; Dietzek B; Popp J Raman and Cars Microspectroscopy of Cells and Tissues. Analyst 2009, 134, 1046–1057. [DOI] [PubMed] [Google Scholar]
- (19).Perez-Jimenez AI; Lyu D; Lu Z; Liu G; Ren B Surface-Enhanced Raman Spectroscopy: Benefits, Trade-Offs and Future Developments. Chem. Sci 2020, 11, 4563–4577. [DOI] [PMC free article] [PubMed] [Google Scholar]
- (20).Joshua D; Sam M; Craig B; Shante H; Paul R; Carole B; Thomas CR; Silas JL Identifying Molecular Contributors to Autofluorescence of Neoplastic and Normal Colon Sections Using Excitation-Scanning Hyperspectral Imaging. J. Biomed. Opt 2018, 24, 1–11. [DOI] [PMC free article] [PubMed] [Google Scholar]
- (21).Xu J; Yu T; Zois CE; Cheng JX; Tang Y; Harris AL; Huang WE Unveiling Cancer Metabolism through Spontaneous and Coherent Raman Spectroscopy and Stable Isotope Probing. Cancers (Basel) 2021, 13, 1718. [DOI] [PMC free article] [PubMed] [Google Scholar]
- (22).Prince RC; Frontiera RR; Potma EO Stimulated Raman Scattering: From Bulk to Nano. Chem. Rev 2017, 117, 5070–5094. [DOI] [PMC free article] [PubMed] [Google Scholar]
- (23).Tipping WJ; Lee M; Serrels A; Brunton VG; Hulme AN Stimulated Raman Scattering Microscopy: An Emerging Tool for Drug Discovery. Chem. Soc. Rev 2016, 45, 2075–2089. [DOI] [PMC free article] [PubMed] [Google Scholar]
- (24).Zhang D; Wang P; Slipchenko MN; Cheng JX Fast Vibrational Imaging of Single Cells and Tissues by Stimulated Raman Scattering Microscopy. Acc. Chem. Res 2014, 47, 2282–2290. [DOI] [PMC free article] [PubMed] [Google Scholar]
- (25).Du J; Su Y; Qian C; Yuan D; Miao K; Lee D; Ng AHC; Wijker RS; Ribas A; Levine RD; et al. Raman-Guided Subcellular Pharmaco-Metabolomics for Metastatic Melanoma Cells. Nat. Commun 2020, 11, 4830. [DOI] [PMC free article] [PubMed] [Google Scholar]
- (26).Camp CH Jr; Lee YJ; Heddleston JM; Hartshorn CM; Walker ARH; Rich JN; Lathia JD; Cicerone MT High-Speed Coherent Raman Fingerprint Imaging of Biological Tissues. Nat. Photon 2014, 8, 627–634. [DOI] [PMC free article] [PubMed] [Google Scholar]
- (27).Cui M; Bachler BR; Ogilvie JP Comparing Coherent and Spontaneous Raman Scattering under Biological Imaging Conditions. Opt. Lett 2009, 34, 773–775. [DOI] [PubMed] [Google Scholar]
- (28).Coluccelli N; Galzerano G; Laporta P; Curtis K; Lonsdale CL; Padgen D; Howle CR; Cerullo G Standoff Detection of Bacterial Spores by Field Deployable Coherent Raman Spectroscopy. Sci. Rep 2023, 13, 2634. [DOI] [PMC free article] [PubMed] [Google Scholar]
- (29).Vardaki MZ; Atkins CG; Schulze HG; Devine DV; Serrano K; Blades MW; Turner RFB Raman Spectroscopy of Stored Red Blood Cell Concentrate within Sealed Transfusion Blood Bags. Analyst 2018, 143, 6006–6013. [DOI] [PubMed] [Google Scholar]
- (30).Nicolson F; Jamieson LE; Mabbott S; Plakas K; Shand NC; Detty MR; Graham D; Faulds K Multiplex Imaging of Live Breast Cancer Tumour Models through Tissue Using Handheld Surface Enhanced Spatially Offset Resonance Raman Spectroscopy (Sesorrs). Chem. Commun 2018, 54, 8530–8533. [DOI] [PubMed] [Google Scholar]
- (31).Webb JA; Bardhan R Emerging Advances in Nanomedicine with Engineered Gold Nanostructures. Nanoscale 2014, 6, 2502–2530. [DOI] [PubMed] [Google Scholar]
- (32).Webb JA; Aufrecht J; Hungerford C; Bardhan R Ultrasensitive Analyte Detection with Plasmonic Paper Dipsticks and Swabs Integrated with Branched Nanoantennas. J. Mater. Chem. C 2014, 2, 10446–10454. [Google Scholar]
- (33).Webb JA; Ou YC; Faley S; Paul EP; Hittinger JP; Cutright CC; Lin EC; Bellan LM; Bardhan R Theranostic Gold Nanoantennas for Simultaneous Multiplexed Raman Imaging of Immunomarkers and Photothermal Therapy. ACS Omega 2017, 2, 3583–3594. [DOI] [PMC free article] [PubMed] [Google Scholar]
- (34).Ou YC; Wen X; Bardhan R Cancer Immunoimaging with Smart Nanoparticles. Trends Biotechnol 2020, 38, 388–403. [DOI] [PubMed] [Google Scholar]
- (35).Khurgin JB Fundamental Limits of Hot Carrier Injection from Metal in Nanoplasmonics. Nanophotonics 2020, 9, 453–471. [Google Scholar]
- (36).Zhou L; Swearer DF; Zhang C; Robatjazi H; Zhao H; Henderson L; Dong L; Christopher P; Carter EA; Nordlander P; et al. Quantifying Hot Carrier and Thermal Contributions in Plasmonic Photocatalysis. Science 2018, 362, 69–72. [DOI] [PubMed] [Google Scholar]
- (37).Judge A; Dodd MS Metabolism. Essays Biochem 2020, 64, 607–647. [DOI] [PMC free article] [PubMed] [Google Scholar]
- (38).Zhu J; Thompson CB Metabolic Regulation of Cell Growth and Proliferation. Nat. Rev. Mol. Cell Biol 2019, 20, 436–450. [DOI] [PMC free article] [PubMed] [Google Scholar]
- (39).Desroches J; Jermyn M; Pinto M; Picot F; Tremblay MA; Obaid S; Marple E; Urmey K; Trudel D; Soulez G; et al. A New Method Using Raman Spectroscopy for in Vivo Targeted Brain Cancer Tissue Biopsy. Sci. Rep 2018, 8, 1792. [DOI] [PMC free article] [PubMed] [Google Scholar]
- (40).Gaifulina R; Maher AT; Kendall C; Nelson J; Rodriguez-Justo M; Lau K; Thomas GM Label-Free Raman Spectroscopic Imaging to Extract Morphological and Chemical Information from a Formalin-Fixed, Paraffin-Embedded Rat Colon Tissue Section. Int. J. Exp. Pathol 2016, 97, 337–350. [DOI] [PMC free article] [PubMed] [Google Scholar]
- (41).Hu C; Wang J; Zheng C; Xu S; Zhang H; Liang Y; Bi L; Fan Z; Han B; Xu W Raman Spectra Exploring Breast Tissues: Comparison of Principal Component Analysis and Support Vector Machine-Recursive Feature Elimination. Med. Phys 2013, 40, 063501. [DOI] [PubMed] [Google Scholar]
- (42).Hu F; Shi L; Min W Biological Imaging of Chemical Bonds by Stimulated Raman Scattering Microscopy. Nat. Methods 2019, 16, 830–842. [DOI] [PubMed] [Google Scholar]
- (43).Li Q; Hao C; Xu Z Diagnosis of Breast Cancer Tissues Using 785 Nm Miniature Raman Spectrometer and Pattern Regression. Sensors (Basel) 2017, 17, 627. [DOI] [PMC free article] [PubMed] [Google Scholar]
- (44).Li QB; Wang W; Liu CH; Zhang GJ Discrimination of Breast Cancer from Normal Tissue with Raman Spectroscopy and Chemometrics. J. Appl. Spectrosc 2015, 82, 450–455. [Google Scholar]
- (45).Manoharan R; Wang Y; Feld MS Histochemical Analysis of Biological Tissues Using Raman Spectroscopy. Spectrochim. Acta A Mol. Biomol. Spectrosc 1996, 52, 215–249. [Google Scholar]
- (46).Sabtu SN; Sani SFA; Looi LM; Chiew SF; Pathmanathan D; Bradley DA; Osman Z Indication of High Lipid Content in Epithelial-Mesenchymal Transitions of Breast Tissues. Sci. Rep 2021, 11, 3250. [DOI] [PMC free article] [PubMed] [Google Scholar]
- (47).Tolstik T; Marquardt C; Beleites C; Matthaus C; Bielecki C; Burger M; Krafft C; Dirsch O; Settmacher U; Popp J; et al. Classification and Prediction of Hcc Tissues by Raman Imaging with Identification of Fatty Acids as Potential Lipid Biomarkers. J. Cancer Res. Clin. Oncol 2015, 141, 407–418. [DOI] [PMC free article] [PubMed] [Google Scholar]
- (48).Abramczyk H; Imiela A; Surmacki J Novel Strategies of Raman Imaging for Monitoring Intracellular Retinoid Metabolism in Cancer Cells. J. Mol. Liq 2021, 334, 116033. [Google Scholar]
- (49).Bielecki C; Bocklitz TW; Schmitt M; Krafft C; Marquardt C; Gharbi A; Knosel T; Stallmach A; Popp J Classification of Inflammatory Bowel Diseases by Means of Raman Spectroscopic Imaging of Epithelium Cells. J. Biomed. Opt 2012, 17, 076030. [DOI] [PubMed] [Google Scholar]
- (50).Chaturvedi D; Balaji SA; Bn VK; Ariese F; Umapathy S; Rangarajan A Different Phases of Breast Cancer Cells: Raman Study of Immortalized, Transformed, and Invasive Cells. Biosensors (Basel) 2016, 6, 57. [DOI] [PMC free article] [PubMed] [Google Scholar]
- (51).di Masi A; Sessa RL; Cerrato Y; Pastore G; Guantario B; Ambra R; Di Gioacchino M; Sodo A; Verri M; Crucitti P; et al. Unraveling the Effects of Carotenoids Accumulation in Human Papillary Thyroid Carcinoma. Antioxidants (Basel) 2022, 11, 1463. [DOI] [PMC free article] [PubMed] [Google Scholar]
- (52).El-Mashtoly SF; Petersen D; Yosef HK; Mosig A; Reinacher-Schick A; Kotting C; Gerwert K Label-Free Imaging of Drug Distribution and Metabolism in Colon Cancer Cells by Raman Microscopy. Analyst 2014, 139, 1155–1161. [DOI] [PubMed] [Google Scholar]
- (53).Fu D; Zhou J; Zhu WS; Manley PW; Wang YK; Hood T; Wylie A; Xie XS Imaging the Intracellular Distribution of Tyrosine Kinase Inhibitors in Living Cells with Quantitative Hyperspectral Stimulated Raman Scattering. Nat. Chem 2014, 6, 614–622. [DOI] [PMC free article] [PubMed] [Google Scholar]
- (54).Guerenne-Del Ben T; Couderc V; Duponchel L; Sol V; Leproux P; Petit JM Multiplex Coherent Anti-Stokes Raman Scattering Microspectroscopy Detection of Lipid Droplets in Cancer Cells Expressing Trkb. Sci. Rep 2020, 10, 16749. [DOI] [PMC free article] [PubMed] [Google Scholar]
- (55).Lee D; Du J; Yu R; Su Y; Heath JR; Wei L Visualizing Subcellular Enrichment of Glycogen in Live Cancer Cells by Stimulated Raman Scattering. Anal. Chem 2020, 92, 13182–13191. [DOI] [PMC free article] [PubMed] [Google Scholar]
- (56).Marro M; Nieva C; Sanz-Pamplona R; Sierra A Molecular Monitoring of Epithelial-to-Mesenchymal Transition in Breast Cancer Cells by Means of Raman Spectroscopy. Biochim. Biophys. Acta 2014, 1843, 1785–1795. [DOI] [PubMed] [Google Scholar]
- (57).Meister K; Niesel J; Schatzschneider U; Metzler-Nolte N; Schmidt DA; Havenith M Label-Free Imaging of Metal-Carbonyl Complexes in Live Cells by Raman Microspectroscopy. Angew. Chem. Int. Ed 2010, 49, 3310–3312. [DOI] [PubMed] [Google Scholar]
- (58).Mitra R; Chao O; Urasaki Y; Goodman OB; Le TT Detection of Lipid-Rich Prostate Circulating Tumour Cells with Coherent Anti-Stokes Raman Scattering Microscopy. BMC Cancer 2012, 12, 540. [DOI] [PMC free article] [PubMed] [Google Scholar]
- (59).Nieva C; Marro M; Santana-Codina N; Rao S; Petrov D; Sierra A The Lipid Phenotype of Breast Cancer Cells Characterized by Raman Microspectroscopy: Towards a Stratification of Malignancy. PLoS One 2012, 7, e46456. [DOI] [PMC free article] [PubMed] [Google Scholar]
- (60).Zhang C; Li J; Lan L; Cheng JX Quantification of Lipid Metabolism in Living Cells through the Dynamics of Lipid Droplets Measured by Stimulated Raman Scattering Imaging. Anal. Chem 2017, 89, 4502–4507. [DOI] [PubMed] [Google Scholar]
- (61).George N; Singh H; Jotaniya R; Pandya SR Raman Spectroscopy for the Determination of Forensically Important Bio-Fluids. Forensic Sci. Int 2022, 340, 111441. [DOI] [PubMed] [Google Scholar]
- (62).Leal LB; Nogueira MS; Canevari RA; Carvalho L Vibration Spectroscopy and Body Biofluids: Literature Review for Clinical Applications. Photodiagnosis Photodyn. Ther 2018, 24, 237–244. [DOI] [PubMed] [Google Scholar]
- (63).Adigal SS; Rizvi A; Rayaroth NV; John RV; Barik A; Bhandari S; George SD; Lukose J; Kartha VB; Chidangil S Human Tear Fluid Analysis for Clinical Applications: Progress and Prospects. Expert Rev. Mol. Diagn 2021, 21, 767–787. [DOI] [PubMed] [Google Scholar]
- (64).Ami D; Duse A; Mereghetti P; Cozza F; Ambrosio F; Ponzini E; Grandori R; Lunetta C; Tavazzi S; Pezzoli F; et al. Tear-Based Vibrational Spectroscopy Applied to Amyotrophic Lateral Sclerosis. Anal. Chem 2021, 93, 16995–17002. [DOI] [PMC free article] [PubMed] [Google Scholar]
- (65).Camerlingo C; Lisitskiy M; Lepore M; Portaccio M; Montorio D; Prete SD; Cennamo G Characterization of Human Tear Fluid by Means of Surface-Enhanced Raman Spectroscopy. Sensors (Basel) 2019, 19, 1177. [DOI] [PMC free article] [PubMed] [Google Scholar]
- (66).Capaccio A; Sasso A; Rusciano G Raman Analysis of Tear Fluid Alteration Following Contact Lense Use. Sensors (Basel) 2019, 19, 3392. [DOI] [PMC free article] [PubMed] [Google Scholar]
- (67).Cennamo G; Montorio D; Morra VB; Criscuolo C; Lanzillo R; Salvatore E; Camerlingo C; Lisitskiy M; Delfino I; Portaccio M; et al. Surface-Enhanced Raman Spectroscopy of Tears: Toward a Diagnostic Tool for Neurodegenerative Disease Identification. J. Biomed. Opt 2020, 25, 1–12. [DOI] [PMC free article] [PubMed] [Google Scholar]
- (68).Cui X; Li J; Li Y; Liu M; Qiao J; Wang D; Cao H; He W; Feng Y; Yang Z Detection of Glucose in Diabetic Tears by Using Gold Nanoparticles and Mxene Composite Surface-Enhanced Raman Scattering Substrates. Spectrochim. Acta, Pt. A: Mol. Biomol. Spectrosc 2022, 266, 120432. [DOI] [PubMed] [Google Scholar]
- (69).Li J; Cui X; Yang X; Qiu Y; Li Y; Cao H; Wang D; He W; Feng Y; Yang Z Quantification of Uric Acid Concentration in Tears by Using Pdms Inverse Opal Structure Surface-Enhanced Raman Scattering Substrates: Application in Hyperuricemia. Spectrochim. Acta, Pt. A: Mol. Biomol. Spectrosc 2022, 278, 121326. [DOI] [PubMed] [Google Scholar]
- (70).Park M; Jung H; Jeong Y; Jeong KH Plasmonic Schirmer Strip for Human Tear-Based Gouty Arthritis Diagnosis Using Surface-Enhanced Raman Scattering. ACS Nano 2017, 11, 438–443. [DOI] [PubMed] [Google Scholar]
- (71).Zhao W; Li J; Xue Z; Qiao X; Li A; Chen X; Feng Y; Yang Z; Wang T A Separation-Sensing Platform Performing Accurate Diagnosis of Jaundice in Complex Biological Tear Fluids. Angew. Chem. Int. Ed 2022, 61, e202205628. [DOI] [PubMed] [Google Scholar]
- (72).de Sousa Vieira EE; Silveira L Jr.; Carvalho HC; Bispo JAM; Fernandes FB; Fernandes AB Biochemical Analysis of Urine Samples from Diabetic and Hypertensive Patients without Renal Dysfunction Using Spectrophotometry and Raman Spectroscopy Techniques Aiming Classification and Diagnosis. Bioengineering (Basel) 2022, 9, 500. [DOI] [PMC free article] [PubMed] [Google Scholar]
- (73).Carlomagno C; Banfi PI; Gualerzi A; Picciolini S; Volpato E; Meloni M; Lax A; Colombo E; Ticozzi N; Verde F; et al. Human Salivary Raman Fingerprint as Biomarker for the Diagnosis of Amyotrophic Lateral Sclerosis. Sci. Rep 2020, 10, 10175. [DOI] [PMC free article] [PubMed] [Google Scholar]
- (74).Karunakaran V; Joseph MM; Yadev I; Sharma H; Shamna K; Saurav S; Sreejith RP; Anand V; Beegum R; Regi David S; et al. A Non-Invasive Ultrasensitive Diagnostic Approach for Covid-19 Infection Using Salivary Label-Free Sers Fingerprinting and Artificial Intelligence. J. Photochem. Photobiol. B: Biol 2022, 234, 112545. [DOI] [PMC free article] [PubMed] [Google Scholar]
- (75).Koster HJ; Guillen-Perez A; Gomez-Diaz JS; Navas-Moreno M; Birkeland AC; Carney RP Fused Raman Spectroscopic Analysis of Blood and Saliva Delivers High Accuracy for Head and Neck Cancer Diagnostics. Sci. Rep 2022, 12, 18464. [DOI] [PMC free article] [PubMed] [Google Scholar]
- (76).Mohammadi M; Antoine D; Vitt M; Dickie JM; Sultana Jyoti S; Wall JG; Johnson PA; Wawrousek KE A Fast, Ultrasensitive Sers Immunoassay to Detect Sars-Cov-2 in Saliva. Anal. Chim. Acta 2022, 1229, 340290. [DOI] [PMC free article] [PubMed] [Google Scholar]
- (77).Alix JJP; Verber NS; Schooling CN; Kadirkamanathan V; Turner MR; Malaspina A; Day JCC; Shaw PJ Label-Free Fibre Optic Raman Spectroscopy with Bounded Simplex-Structured Matrix Factorization for the Serial Study of Serum in Amyotrophic Lateral Sclerosis. Analyst 2022, 147, 5113–5120. [DOI] [PMC free article] [PubMed] [Google Scholar]
- (78).Duan Z; Chen Y; Ye M; Xiao L; Chen Y; Cao Y; Peng Y; Zhang J; Zhang Y; Yang T; et al. Differentiation and Prognostic Stratification of Acute Myeloid Leukemia by Serum-Based Spectroscopy Coupling with Metabolic Fingerprints. FASEB J 2022, 36, e22416. [DOI] [PubMed] [Google Scholar]
- (79).Su N; Dawuti W; Hu Y; Zhao H Noninvasive Cholangitis and Cholangiocarcinoma Screening Based on Serum Raman Spectroscopy and Support Vector Machine. Photodiagnosis Photodyn. Ther 2022, 40, 103156. [DOI] [PubMed] [Google Scholar]
- (80).Torre-Gutierrez LG; Martinez-Zerega BE; Oseguera-Galindo DO; Aguilar-Lemarroy A; Jave-Suarez LF; Torres-Gonzalez LA; Gonzalez-Solis JL Breast Cancer Chemotherapy Treatment Monitoring Based on Serum Sample Raman Spectroscopy. Lasers Med. Sci 2022, 37, 3649–3659. [DOI] [PMC free article] [PubMed] [Google Scholar]
- (81).Zeng Q; Chen C; Chen C; Song H; Li M; Yan J; Lv X Serum Raman Spectroscopy Combined with Convolutional Neural Network for Rapid Diagnosis of Her2-Positive and Triple-Negative Breast Cancer. Spectrochim. Acta, Pt. A: Mol. Biomol. Spectrosc 2023, 286, 122000. [DOI] [PubMed] [Google Scholar]
- (82).Morasso CF; Sproviero D; Mimmi MC; Giannini M; Gagliardi S; Vanna R; Diamanti L; Bernuzzi S; Piccotti F; Truffi M; et al. Raman Spectroscopy Reveals Biochemical Differences in Plasma Derived Extracellular Vesicles from Sporadic Amyotrophic Lateral Sclerosis Patients. Nanomedicine 2020, 29, 102249. [DOI] [PubMed] [Google Scholar]
- (83).Zhang QJ; Chen Y; Zou XH; Hu W; Ye ML; Guo QF; Lin XL; Feng SY; Wang N Promoting Identification of Amyotrophic Lateral Sclerosis Based on Label-Free Plasma Spectroscopy. Ann. Clin. Transl. Neurol 2020, 7, 2010–2018. [DOI] [PMC free article] [PubMed] [Google Scholar]
- (84).Zhang QJ; Chen Y; Zou XH; Hu W; Lin XL; Feng SY; Chen F; Xu LQ; Chen WJ; Wang N Prognostic Analysis of Amyotrophic Lateral Sclerosis Based on Clinical Features and Plasma Surface-Enhanced Raman Spectroscopy. J. Biophotonics 2019, 12, e201900012. [DOI] [PubMed] [Google Scholar]
- (85).Guerenne-Del Ben T; Rajaofara Z; Couderc V; Sol V; Kano H; Leproux P; Petit JM Multiplex Coherent Anti-Stokes Raman Scattering Highlights State of Chromatin Condensation in Ch Region. Sci. Rep 2019, 9, 13862. [DOI] [PMC free article] [PubMed] [Google Scholar]
- (86).Seto K; Okuda Y; Tokunaga E; Kobayashi T Development of a Multiplex Stimulated Raman Microscope for Spectral Imaging through Multi-Channel Lock-in Detection. Rev. Sci. Instrum 2013, 84, 083705. [DOI] [PubMed] [Google Scholar]
- (87).Lima C; Muhamadali H; Goodacre R The Role of Raman Spectroscopy within Quantitative Metabolomics. Annu. Rev. Anal. Chem. (Palo Alto Calif) 2021, 14, 323–345. [DOI] [PubMed] [Google Scholar]
- (88).Kuzmin AN; Pliss A; Prasad PN Ramanomics: New Omics Disciplines Using Micro Raman Spectrometry with Biomolecular Component Analysis for Molecular Profiling of Biological Structures. Biosensors (Basel) 2017, 7. [DOI] [PMC free article] [PubMed] [Google Scholar]
- (89).Lussier F; Thibault V; Charron B; Wallace GQ; Masson J-F Deep Learning and Artificial Intelligence Methods for Raman and Surface-Enhanced Raman Scattering. TrAC, Trends Anal. Chem 2020, 124, 115796. [Google Scholar]
- (90).Langer J; Jimenez de Aberasturi D; Aizpurua J; Alvarez-Puebla RA; Auguié B; Baumberg JJ; Bazan GC; Bell SEJ; Boisen A; Brolo AG; et al. Present and Future of Surface-Enhanced Raman Scattering. ACS Nano 2020, 14, 28–117. [DOI] [PMC free article] [PubMed] [Google Scholar]
- (91).Morais CLM; Lima KMG; Singh M; Martin FL Tutorial: Multivariate Classification for Vibrational Spectroscopy in Biological Samples. Nat. Protoc 2020, 15, 2143–2162. [DOI] [PubMed] [Google Scholar]
- (92).Maleki F; Muthukrishnan N; Ovens K; Reinhold C; Forghani R Machine Learning Algorithm Validation: From Essentials to Advanced Applications and Implications for Regulatory Certification and Deployment. Neuroimaging Clin. N. Am 2020, 30, 433–445. [DOI] [PubMed] [Google Scholar]
- (93).Baek S; Tsai C-A; Chen JJ Development of Biomarker Classifiers from High-Dimensional Data. Brief. Bioinform 2009, 10, 537–546. [DOI] [PubMed] [Google Scholar]
- (94).Desaire H How (Not) to Generate a Highly Predictive Biomarker Panel Using Machine Learning. J. Proteome Res 2022, 21, 2071–2074. [DOI] [PMC free article] [PubMed] [Google Scholar]
- (95).Plou J; Valera PS; Garcia I; de Albuquerque CDL; Carracedo A; Liz-Marzan LM Prospects of Surface-Enhanced Raman Spectroscopy for Biomarker Monitoring toward Precision Medicine. ACS Photonics 2022, 9, 333–350. [DOI] [PMC free article] [PubMed] [Google Scholar]
- (96).He Q; Yang W; Luo W; Wilhelm S; Weng B Label-Free Differentiation of Cancer and Non-Cancer Cells Based on Machine-Learning-Algorithm-Assisted Fast Raman Imaging. Biosensors (Basel) 2022, 12, 250. [DOI] [PMC free article] [PubMed] [Google Scholar]
- (97).Milligan K; Deng X; Shreeves P; Ali-Adeeb R; Matthews Q; Brolo A; Lum JJ; Andrews JL; Jirasek A Raman Spectroscopy and Group and Basis-Restricted Non Negative Matrix Factorisation Identifies Radiation Induced Metabolic Changes in Human Cancer Cells. Sci. Rep 2021, 11, 3853. [DOI] [PMC free article] [PubMed] [Google Scholar]
- (98).Paidi SK; Rodriguez Troncoso J; Raj P; Monterroso Diaz P; Ivers JD; Lee DE; Avaritt NL; Gies AJ; Quick CM; Byrum SD; et al. Raman Spectroscopy and Machine Learning Reveals Early Tumor Microenvironmental Changes Induced by Immunotherapy. Cancer Res 2021, 81, 5745–5755. [DOI] [PMC free article] [PubMed] [Google Scholar]
- (99).Butler HJ; Ashton L; Bird B; Cinque G; Curtis K; Dorney J; Esmonde-White K; Fullwood NJ; Gardner B; Martin-Hirsch PL; et al. Using Raman Spectroscopy to Characterize Biological Materials. Nat. Protoc 2016, 11, 664–687. [DOI] [PubMed] [Google Scholar]
- (100).Xu J; Yi X; Jin G; Peng D; Fan G; Xu X; Chen X; Yin H; Cooper JM; Huang WE High-Speed Diagnosis of Bacterial Pathogens at the Single Cell Level by Raman Microspectroscopy with Machine Learning Filters and Denoising Autoencoders. ACS Chem. Biol 2022, 17, 376–385. [DOI] [PubMed] [Google Scholar]
- (101).He C; Zhu S; Wu X; Zhou J; Chen Y; Qian X; Ye J Accurate Tumor Subtype Detection with Raman Spectroscopy Via Variational Autoencoder and Machine Learning. ACS Omega 2022, 7, 10458–10468. [DOI] [PMC free article] [PubMed] [Google Scholar]
- (102).Gravely M; Roxbury D Multispectral Fingerprinting Resolves Dynamics of Nanomaterial Trafficking in Primary Endothelial Cells. ACS Nano 2021, 15, 12388–12404. [DOI] [PubMed] [Google Scholar]
- (103).Wilson RE Jr.; O'Connor R; Gallops CE; Kwizera EA; Noroozi B; Morshed BI; Wang Y; Huang X Immunomagnetic Capture and Multiplexed Surface Marker Detection of Circulating Tumor Cells with Magnetic Multicolor Surface-Enhanced Raman Scattering Nanotags. ACS Appl. Mater. Interfaces 2020, 12, 47220–47232. [DOI] [PubMed] [Google Scholar]
- (104).Van de Sompel D; Garai E; Zavaleta C; Gambhir SS A Hybrid Least Squares and Principal Component Analysis Algorithm for Raman Spectroscopy. PLoS One 2012, 7, e38850. [DOI] [PMC free article] [PubMed] [Google Scholar]
- (105).Noothalapati H; Shigeto S Exploring Metabolic Pathways in Vivo by a Combined Approach of Mixed Stable Isotope-Labeled Raman Microspectroscopy and Multivariate Curve Resolution Analysis. Anal. Chem 2014, 86, 7828–7834. [DOI] [PubMed] [Google Scholar]
- (106).Iwasaki K; Araki A; Krishna CM; Maruyama R; Yamamoto T; Noothalapati H Identification of Molecular Basis for Objective Discrimination of Breast Cancer Cells (Mcf-7) from Normal Human Mammary Epithelial Cells by Raman Microspectroscopy and Multivariate Curve Resolution Analysis. Int. J. Mol. Sci 2021, 22, 800. [DOI] [PMC free article] [PubMed] [Google Scholar]
- (107).Lawton WH; Sylvestre EA Self Modeling Curve Resolution. Technometrics 1971, 13, 617–633. [Google Scholar]
- (108).de Juan A; Tauler R Multivariate Curve Resolution: 50 Years Addressing the Mixture Analysis Problem – a Review. Anal. Chim. Acta 2021, 1145, 59–78. [DOI] [PubMed] [Google Scholar]
- (109).Tauler R Multivariate Curve Resolution Applied to Second Order Data. Chemom. Intell. Lab. Syst 1995, 30, 133–146. [Google Scholar]
- (110).Holden CA; Hunnicutt SS; Sánchez-Ponce R; Craig JM; Rutan SC Study of Complexation in Methanol/Water Mixtures by Infrared and Raman Spectroscopy and Multivariate Curve Resolution-Alternating Least-Squares Analysis. Appl. Spectrosc 2003, 57, 483–490. [DOI] [PubMed] [Google Scholar]
- (111).Horii S; Ando M; Samuel AZ; Take A; Nakashima T; Matsumoto A; Takahashi YK; Takeyama H Detection of Penicillin G Produced by Penicillium Chrysogenum with Raman Microspectroscopy and Multivariate Curve Resolution-Alternating Least-Squares Methods. J. Nat. Prod 2020, 83, 3223–3229. [DOI] [PubMed] [Google Scholar]
- (112).Chen X; Xie L; He Y; Guan T; Zhou X; Wang B; Feng G; Yu H; Ji Y Fast and Accurate Decoding of Raman Spectra-Encoded Suspension Arrays Using Deep Learning. Analyst 2019, 144, 4312–4319. [DOI] [PubMed] [Google Scholar]
- (113).Contorno S; Darienzo RE; Tannenbaum R Evaluation of Aromatic Amino Acids as Potential Biomarkers in Breast Cancer by Raman Spectroscopy Analysis. Sci. Rep 2021, 11, 1698. [DOI] [PMC free article] [PubMed] [Google Scholar]
- (114).Bendau E; Smith J; Zhang L; Ackerstaff E; Kruchevsky N; Wu B; Koutcher JA; Alfano R; Shi L Distinguishing Metastatic Triple-Negative Breast Cancer from Nonmetastatic Breast Cancer Using Second Harmonic Generation Imaging and Resonance Raman Spectroscopy. J. Biophotonics 2020, 13, e202000005. [DOI] [PMC free article] [PubMed] [Google Scholar]
- (115).Samoylenko A; Kogler M; Zhyvolozhnyi A; Makieieva O; Bart G; Andoh SS; Roussey M; Vainio SJ; Hiltunen J Time-Gated Raman Spectroscopy and Proteomics Analyses of Hypoxic and Normoxic Renal Carcinoma Extracellular Vesicles. Sci. Rep 2021, 11, 19594. [DOI] [PMC free article] [PubMed] [Google Scholar]
- (116).Abramczyk H; Imiela A; Brozek-Pluska B; Kopec M; Surmacki J; Sliwinska A Aberrant Protein Phosphorylation in Cancer by Using Raman Biomarkers. Cancers (Basel) 2019, 11, 2017. [DOI] [PMC free article] [PubMed] [Google Scholar]
- (117).Abramczyk H; Surmacki JM; Brozek-Pluska B; Kopec M Revision of Commonly Accepted Warburg Mechanism of Cancer Development: Redox-Sensitive Mitochondrial Cytochromes in Breast and Brain Cancers by Raman Imaging. Cancers (Basel) 2021, 13, 2599. [DOI] [PMC free article] [PubMed] [Google Scholar]
- (118).Akagi Y; Mori N; Kawamura T; Takayama Y; Kida YS Non-Invasive Cell Classification Using the Paint Raman Express Spectroscopy System (Press). Sci. Rep 2021, 11, 8818. [DOI] [PMC free article] [PubMed] [Google Scholar]
- (119).Bose S; Zhang C; Le A Glucose Metabolism in Cancer: The Warburg Effect and Beyond. In The Heterogeneity of Cancer Metabolism, Le A Ed.; Springer International Publishing, 2021; p 3–15. [DOI] [PMC free article] [PubMed] [Google Scholar]
- (120).Chen X; Qian Y; Wu S The Warburg Effect: Evolving Interpretations of an Established Concept. Free Radic. Biol. Med 2015, 79, 253–263. [DOI] [PMC free article] [PubMed] [Google Scholar]
- (121).Martínez-Reyes I; Chandel NS Cancer Metabolism: Looking Forward. Nat. Rev. Cancer 2021, 21, 669–680. [DOI] [PubMed] [Google Scholar]
- (122).DeBerardinis RJ; Chandel NS Fundamentals of Cancer Metabolism. Sci Adv 2016, 2, e1600200. [DOI] [PMC free article] [PubMed] [Google Scholar]
- (123).Wood B; Jevremovic D; Béné MC; Yan M; Jacobs P; Litwin V Validation of Cell-Based Fluorescence Assays: Practice Guidelines from the Icsh and Iccs - Part V - Assay Performance Criteria. Cytometry B Clin. Cytom 2013, 84, 315–323. [DOI] [PubMed] [Google Scholar]
- (124).Marcino J A Comparison of Two Methods for Colorimetric in Situ Hybridization Using Paraffin-Embedded Tissue Sections and Digoxigenin-Labeled Hybridization Probes. J. Aquat. Anim. Health 2013, 25, 119–124. [DOI] [PubMed] [Google Scholar]
- (125).Thiha A; Ibrahim F A Colorimetric Enzyme-Linked Immunosorbent Assay (Elisa) Detection Platform for a Point-of-Care Dengue Detection System on a Lab-on-Compact-Disc. Sensors (Basel) 2015, 15, 11431–11441. [DOI] [PMC free article] [PubMed] [Google Scholar]
- (126).Zanatta L; Valori L; Cappelletto E; Pozzebon ME; Pavan E; Dei Tos AP; Merkle D Reagent and Labor Cost Optimization through Automation of Fluorescence in Situ Hybridization (Fish) with the Vp 2000: An Italian Case Study. SLAS Technol 2015, 20, 25–31. [DOI] [PubMed] [Google Scholar]
- (127).Castro I; Sampaio-Marques B; Ludovico P Targeting Metabolic Reprogramming in Acute Myeloid Leukemia. Cells 2019, 8, 967. [DOI] [PMC free article] [PubMed] [Google Scholar]
- (128).Leichtle AB; Nuoffer JM; Ceglarek U; Kase J; Conrad T; Witzigmann H; Thiery J; Fiedler GM Serum Amino Acid Profiles and Their Alterations in Colorectal Cancer. Metabolomics 2012, 8, 643–653. [DOI] [PMC free article] [PubMed] [Google Scholar]
- (129).Peng X; Zheng T; Guo Y; Zhu Y Amino Acid Metabolism Genes Associated with Immunotherapy Responses and Clinical Prognosis of Colorectal Cancer. Front Mol Biosci 2022, 9, 955705. [DOI] [PMC free article] [PubMed] [Google Scholar]
- (130).Liu X; Liu X; Rong P; Liu D Recent Advances in Background-Free Raman Scattering for Bioanalysis. Trends Anal. Chem 2020, 123, 115765. [Google Scholar]
- (131).Nakasuka F; Tabata S; Sakamoto T; Hirayama A; Ebi H; Yamada T; Umetsu K; Ohishi M; Ueno A; Goto H; et al. Tgf-Beta-Dependent Reprogramming of Amino Acid Metabolism Induces Epithelial-Mesenchymal Transition in Non-Small Cell Lung Cancers. Commun. Biol 2021, 4, 782. [DOI] [PMC free article] [PubMed] [Google Scholar]
- (132).Hanahan D; Weinberg RA Hallmarks of Cancer: The Next Generation. Cell 2011, 144, 646–674. [DOI] [PubMed] [Google Scholar]
- (133).Hanahan D Hallmarks of Cancer: New Dimensions. Cancer Discov 2022, 12, 31–46. [DOI] [PubMed] [Google Scholar]
- (134).Murai T The Role of Lipid Rafts in Cancer Cell Adhesion and Migration. Int. J. Cell Biol 2012, 2012, 763283. [DOI] [PMC free article] [PubMed] [Google Scholar]
- (135).Cruz ALS; Barreto EA; Fazolini NPB; Viola JPB; Bozza PT Lipid Droplets: Platforms with Multiple Functions in Cancer Hallmarks. Cell Death Dis 2020, 11, 105. [DOI] [PMC free article] [PubMed] [Google Scholar]
- (136).Geng F; Guo D Lipid Droplets, Potential Biomarker and Metabolic Target in Glioblastoma. Intern. Med. Rev. (Wash D C) 2017, 3. [DOI] [PMC free article] [PubMed] [Google Scholar]
- (137).Liu Q; Luo Q; Halim A; Song G Targeting Lipid Metabolism of Cancer Cells: A Promising Therapeutic Strategy for Cancer. Cancer Lett 2017, 401, 39–45. [DOI] [PubMed] [Google Scholar]
- (138).Becker A; Thakur BK; Weiss JM; Kim HS; Peinado H; Lyden D Extracellular Vesicles in Cancer: Cell-to-Cell Mediators of Metastasis. Cancer Cell 2016, 30, 836–848. [DOI] [PMC free article] [PubMed] [Google Scholar]
- (139).Pastushenko I; Blanpain C Emt Transition States During Tumor Progression and Metastasis. Trends Cell Biol 2019, 29, 212–226. [DOI] [PubMed] [Google Scholar]
- (140).Du B; Shim JS Targeting Epithelial–Mesenchymal Transition (Emt) to Overcome Drug Resistance in Cancer. Molecules 2016, 21, 965. [DOI] [PMC free article] [PubMed] [Google Scholar]
- (141).Wei M; Shi L; Shen Y; Zhao Z; Guzman A; Kaufman LJ; Wei L; Min W Volumetric Chemical Imaging by Clearing-Enhanced Stimulated Raman Scattering Microscopy. Proc. Natl. Acad. Sci. U.S.A 2019, 116, 6608–6617. [DOI] [PMC free article] [PubMed] [Google Scholar]
- (142).Yang SK; Cho N; Moon WK The Role of Pet/Ct for Evaluating Breast Cancer. Korean J. of Radiol 2007, 8, 429–437. [DOI] [PMC free article] [PubMed] [Google Scholar]
- (143).Lao IH; Chao H; Wang YJ; Mak CW; Tzeng WS; Wu RH; Chang ST; Fang JL Computed Tomography Has Low Sensitivity for the Diagnosis of Early Colon Cancer. Colorectal Dis 2013, 15, 807–811. [DOI] [PubMed] [Google Scholar]
- (144).Nishino M; Ramaiya NH; Hatabu H; Hodi FS Monitoring Immune-Checkpoint Blockade: Response Evaluation and Biomarker Development. Nat. Rev. Clin. Oncol 2017, 14, 655–668. [DOI] [PMC free article] [PubMed] [Google Scholar]
- (145).Wen X; Ou YC; Bogatcheva G; Thomas G; Mahadevan-Jansen A; Singh B; Lin EC; Bardhan R Probing Metabolic Alterations in Breast Cancer in Response to Molecular Inhibitors with Raman Spectroscopy and Validated with Mass Spectrometry. Chem. Sci 2020, 11, 9863–9874. [DOI] [PMC free article] [PubMed] [Google Scholar]
- (146).Danil de Namor AF; Al Hakawati N; Farhat SY Targeting Colorectal Cancer Cells with a Functionalised Calix[4]Arene Receptor: Biophysical Studies. Molecules 2022, 27, 510. [DOI] [PMC free article] [PubMed] [Google Scholar]
- (147).Kanmalar M; Abdul Sani SF; Kamri N; Said N; Jamil A; Kuppusamy S; Mun KS; Bradley DA Raman Spectroscopy Biochemical Characterisation of Bladder Cancer Cisplatin Resistance Regulated by Fdft1: A Review. Cell. Mol. Biol. Lett 2022, 27, 9. [DOI] [PMC free article] [PubMed] [Google Scholar]
- (148).Larion M; Dowdy T; Ruiz-Rodado V; Meyer MW; Song H; Zhang W; Davis D; Gilbert MR; Lita A Detection of Metabolic Changes Induced Via Drug Treatments in Live Cancer Cells and Tissue Using Raman Imaging Microscopy. Biosensors (Basel) 2018, 9, 5. [DOI] [PMC free article] [PubMed] [Google Scholar]
- (149).Wei L; Hu F; Shen Y; Chen Z; Yu Y; Lin CC; Wang MC; Min W Live-Cell Imaging of Alkyne-Tagged Small Biomolecules by Stimulated Raman Scattering. Nat. Methods 2014, 11, 410–412. [DOI] [PMC free article] [PubMed] [Google Scholar]
- (150).Aljakouch K; Lechtonen T; Yosef HK; Hammoud MK; Alsaidi W; Kotting C; Mugge C; Kourist R; El-Mashtoly SF; Gerwert K Raman Microspectroscopic Evidence for the Metabolism of a Tyrosine Kinase Inhibitor, Neratinib, in Cancer Cells. Angew. Chem. Int. Ed 2018, 57, 7250–7254. [DOI] [PMC free article] [PubMed] [Google Scholar]
- (151).Deng X; Milligan K; Brolo A; Lum JJ; Andrews JL; Jirasek A Radiation Treatment Response and Hypoxia Biomarkers Revealed by Machine Learning Assisted Raman Spectroscopy in Tumour Cells and Xenograft Tissues. Analyst 2022, 147, 5091–5104. [DOI] [PubMed] [Google Scholar]
- (152).Liu C; Yang M; Zhang D; Chen M; Zhu D Clinical Cancer Immunotherapy: Current Progress and Prospects. Front. Immunol 2022, 13, 961805. [DOI] [PMC free article] [PubMed] [Google Scholar]
- (153).Madden MZ; Rathmell JC The Complex Integration of T-Cell Metabolism and Immunotherapy. Cancer Discov 2021, 11, 1636–1643. [DOI] [PMC free article] [PubMed] [Google Scholar]
- (154).Wei J; Hu M; Du H Improving Cancer Immunotherapy: Exploring and Targeting Metabolism in Hypoxia Microenvironment. Front. Immunol 2022, 13, 845923. [DOI] [PMC free article] [PubMed] [Google Scholar]
- (155).Acri G; Venuti V; Costa S; Testagrossa B; Pellegrino S; Crupi V; Majolino D Raman Spectroscopy as Noninvasive Method of Diagnosis of Pediatric Onset Inflammatory Bowel Disease. Appl. Sci 2020, 10, 6974. [Google Scholar]
- (156).Addis J; Mohammed N; Rotimi O; Magee D; Jha A; Subramanian V Raman Spectroscopy of Endoscopic Colonic Biopsies from Patients with Ulcerative Colitis to Identify Mucosal Inflammation and Healing. Biomed. Opt. Express 2016, 7, 2022–2035. [DOI] [PMC free article] [PubMed] [Google Scholar]
- (157).Fraser-Miller SJ; Rooney JS; Lau M; Gordon KC; Schultz M Can Coupling Multiple Complementary Methods Improve the Spectroscopic Based Diagnosis of Gastrointestinal Illnesses? A Proof of Principle Ex Vivo Study Using Celiac Disease as the Model Illness. Anal. Chem 2021, 93, 6363–6374. [DOI] [PubMed] [Google Scholar]
- (158).Smith SCL; Banbury C; Zardo D; Cannatelli R; Nardone OM; Shivaji UN; Ghosh S; Oppenheimer PG; Iacucci M Raman Spectroscopy Accurately Differentiates Mucosal Healing from Non-Healing and Biochemical Changes Following Biological Therapy in Inflammatory Bowel Disease. PLoS One 2021, 16, e0252210. [DOI] [PMC free article] [PubMed] [Google Scholar]
- (159).Tefas C; Marginean R; Toma V; Petrushev B; Fischer P; Tantau M; Stiufiuc R Surface-Enhanced Raman Scattering for the Diagnosis of Ulcerative Colitis: Will It Change the Rules of the Game? Anal. Bioanal. Chem 2021, 413, 827–838. [DOI] [PubMed] [Google Scholar]
- (160).Pence IJ; Beaulieu DB; Horst SN; Bi X; Herline AJ; Schwartz DA; Mahadevan-Jansen A Clinical Characterization of in Vivo Inflammatory Bowel Disease with Raman Spectroscopy. Biomed. Opt. Express 2017, 8, 524–535. [DOI] [PMC free article] [PubMed] [Google Scholar]
- (161).Yang H; Zhao C; Li R; Shen C; Cai X; Sun L; Luo C; Yin Y Noninvasive and Prospective Diagnosis of Coronary Heart Disease with Urine Using Surface-Enhanced Raman Spectroscopy. Analyst 2018, 143, 2235–2242. [DOI] [PubMed] [Google Scholar]
- (162).John RV; Devasia T; N, M.; Lukose J; Chidangil S Micro-Raman Spectroscopy Study of Blood Samples from Myocardial Infarction Patients. Lasers Med. Sci 2022, 37, 3451–3460. [DOI] [PMC free article] [PubMed] [Google Scholar]
- (163).You AYF; Bergholt MS; St-Pierre JP; Kit-Anan W; Pence IJ; Chester AH; Yacoub MH; Bertazzo S; Stevens MM Raman Spectroscopy Imaging Reveals Interplay between Atherosclerosis and Medial Calcification in the Human Aorta. Sci Adv 2017, 3, e1701156. [DOI] [PMC free article] [PubMed] [Google Scholar]
- (164).Tombolesi N; Altara R; da Silva GJJ; Tannous C; Zouein FA; Stenslokken KO; Morresi A; Paolantoni M; Booz GW; Cataliotti A; et al. Early Cardiac-Chamber-Specific Fingerprints in Heart Failure with Preserved Ejection Fraction Detected by Ftir and Raman Spectroscopic Techniques. Sci. Rep 2022, 12, 3440. [DOI] [PMC free article] [PubMed] [Google Scholar]
- (165).Plesia M; Stevens OA; Lloyd GR; Kendall CA; Coldicott I; Kennerley AJ; Miller G; Shaw PJ; Mead RJ; Day JCC; et al. In Vivo Fiber Optic Raman Spectroscopy of Muscle in Preclinical Models of Amyotrophic Lateral Sclerosis and Duchenne Muscular Dystrophy. ACS Chem. Neurosci 2021, 12, 1768–1776. [DOI] [PMC free article] [PubMed] [Google Scholar]
- (166).Tian F; Yang W; Mordes DA; Wang JY; Salameh JS; Mok J; Chew J; Sharma A; Leno-Duran E; Suzuki-Uematsu S; et al. Monitoring Peripheral Nerve Degeneration in Als by Label-Free Stimulated Raman Scattering Imaging. Nat. Commun 2016, 7, 13283. [DOI] [PMC free article] [PubMed] [Google Scholar]
- (167).Kofla-Dłubacz A; Pytrus T; Akutko K; Sputa-Grzegrzółka P; Piotrowska A; Dzięgiel P Etiology of Ibd—Is It Still a Mystery? . Int. J. Mol. Sci 2022, 23, 12445. [DOI] [PMC free article] [PubMed] [Google Scholar]
- (168).Guan Q A Comprehensive Review and Update on the Pathogenesis of Inflammatory Bowel Disease. J. Immunol. Res 2019, 2019, 7247238. [DOI] [PMC free article] [PubMed] [Google Scholar]
- (169).Lavelle A; Sokol H Gut Microbiota-Derived Metabolites as Key Actors in Inflammatory Bowel Disease. Nat. Rev. Gastroenterol. Hepatol 2020, 17, 223–237. [DOI] [PubMed] [Google Scholar]
- (170).Agus A; Clément K; Sokol H Gut Microbiota-Derived Metabolites as Central Regulators in Metabolic Disorders. Gut 2021, 70, 1174–1182. [DOI] [PMC free article] [PubMed] [Google Scholar]
- (171).Jain U; Ver Heul AM; Xiong S; Gregory MH; Demers EG; Kern JT; Lai CW; Muegge BD; Barisas DAG; Leal-Ekman JS; et al. Debaryomyces Is Enriched in Crohn's Disease Intestinal Tissue and Impairs Healing in Mice. Science 2021, 371, 1154–1159. [DOI] [PMC free article] [PubMed] [Google Scholar]
- (172).Bamba S; Inatomi O; Nishida A; Ohno M; Imai T; Takahashi K; Naito Y; Iwamoto J; Honda A; Inohara N; et al. Relationship between the Gut Microbiota and Bile Acid Composition in the Ileal Mucosa of Crohn's Disease. Intest. Res 2022, 20, 370–380. [DOI] [PMC free article] [PubMed] [Google Scholar]
- (173).Tefas C; Tantau M Clinical Applications of Raman Spectroscopy in Inflammatory Bowel Diseases. A Review. J. Gastrointestin. Liver Dis 2018, 27, 433–438. [DOI] [PubMed] [Google Scholar]
- (174).Tintut Y; Hsu JJ; Demer LL Lipoproteins in Cardiovascular Calcification: Potential Targets and Challenges. Front. Cardiovasc. Med 2018, 5, 172. [DOI] [PMC free article] [PubMed] [Google Scholar]
- (175).Chignon A; Bon-Baret V; Boulanger M-C; Bossé Y; Mathieu P Oxyphospholipids in Cardiovascular Calcification. Arterioscler. Thromb. Vasc. Biol 2021, 41, 11–19. [DOI] [PubMed] [Google Scholar]
- (176).Ferrari S; Pesce M The Complex Interplay of Inflammation, Metabolism, Epigenetics, and Sex in Calcific Disease of the Aortic Valve. Front. Cardiovasc. Med 2022, 8, 791646. [DOI] [PMC free article] [PubMed] [Google Scholar]
- (177).Tanoren B; Parlatan U; Parlak M; Kecoglu I; Unlu MB; Oztas DM; Ulukan MO; Erkanli K; Ugurlucan M Aortic Aneurysm Evaluation by Scanning Acoustic Microscopy and Raman Spectroscopy. Anal. Methods 2021, 13, 4683–4690. [DOI] [PubMed] [Google Scholar]
- (178).Saw ST; Leong BDK; Abdul Aziz DA Early Detection of Undiagnosed Abdominal Aortic Aneurysm and Sub-Aneurysmal Aortic Dilatations in Patients with High-Risk Coronary Artery Disease: The Value of Targetted Screening Programme. Vasc. Health Risk Manag 2020, 16, 215–229. [DOI] [PMC free article] [PubMed] [Google Scholar]
- (179).Czamara K; Natorska J; Kapusta P; Baranska M; Kaczor A Raman Microspectroscopy of Human Aortic Valves: Investigation of the Local and Global Biochemical Changes Associated with Calcification in Aortic Stenosis. Analyst 2015, 140, 2164–2170. [DOI] [PubMed] [Google Scholar]
- (180).Chaichi A; Prasad A; Gartia MR Raman Spectroscopy and Microscopy Applications in Cardiovascular Diseases: From Molecules to Organs. Biosensors (Basel) 2018, 8, 107. [DOI] [PMC free article] [PubMed] [Google Scholar]
- (181).Donjuán-Loredo G; Espinosa-Tanguma R; Ramírez-Elías MG Raman Spectroscopy in the Diagnosis of Metabolic Syndrome. Appl Spectrosc Rev 2023, 58, 159–179. [Google Scholar]
- (182).Strong MJ The Evidence for Altered Rna Metabolism in Amyotrophic Lateral Sclerosis (Als). J. Neurol. Sci 2010, 288, 1–12. [DOI] [PubMed] [Google Scholar]
- (183).Valbuena GN; Rizzardini M; Cimini S; Siskos AP; Bendotti C; Cantoni L; Keun HC Metabolomic Analysis Reveals Increased Aerobic Glycolysis and Amino Acid Deficit in a Cellular Model of Amyotrophic Lateral Sclerosis. Mol. Neurobiol 2016, 53, 2222–2240. [DOI] [PMC free article] [PubMed] [Google Scholar]
- (184).Wei QQ; Chen Y; Cao B; Ou RW; Zhang L; Hou Y; Gao X; Shang H Blood Hemoglobin A1c Levels and Amyotrophic Lateral Sclerosis Survival. Mol. Neurodegener 2017, 12, 69. [DOI] [PMC free article] [PubMed] [Google Scholar]
- (185).Blasco H; Corcia P; Moreau C; Veau S; Fournier C; Vourc'h P; Emond P; Gordon P; Pradat PF; Praline J; et al. 1h-Nmr-Based Metabolomic Profiling of Csf in Early Amyotrophic Lateral Sclerosis. PLoS One 2010, 5, e13223. [DOI] [PMC free article] [PubMed] [Google Scholar]
- (186).Wagey R; Pelech SL; Duronio V; Krieger C Phosphatidylinositol 3-Kinase: Increased Activity and Protein Level in Amyotrophic Lateral Sclerosis. J. Neurochem 1998, 71, 716–722. [DOI] [PubMed] [Google Scholar]
- (187).Cutler RG; Pedersen WA; Camandola S; Rothstein JD; Mattson MP Evidence That Accumulation of Ceramides and Cholesterol Esters Mediates Oxidative Stress-Induced Death of Motor Neurons in Amyotrophic Lateral Sclerosis. Ann. Neurol 2002, 52, 448–457. [DOI] [PubMed] [Google Scholar]
- (188).Devitt G; Howard K; Mudher A; Mahajan S Raman Spectroscopy: An Emerging Tool in Neurodegenerative Disease Research and Diagnosis. ACS Chem. Neurosci 2018, 9, 404–420. [DOI] [PubMed] [Google Scholar]
- (189).Polykretis P; Banchelli M; D'Andrea C; de Angelis M; Matteini P Raman Spectroscopy Techniques for the Investigation and Diagnosis of Alzheimer's Disease. Front Biosci (Schol Ed) 2022, 14, 22. [DOI] [PubMed] [Google Scholar]
- (190).Payne TD; Moody AS; Wood AL; Pimiento PA; Elliott JC; Sharma B Raman Spectroscopy and Neuroscience: From Fundamental Understanding to Disease Diagnostics and Imaging. Analyst 2020, 145, 3461–3480. [DOI] [PubMed] [Google Scholar]
- (191).Jagla K; Kalman B; Boudou T; Hénon S; Batonnet-Pichon S Beyond Mice: Emerging and Transdisciplinary Models for the Study of Early-Onset Myopathies. Semin. Cell Dev. Biol 2017, 64, 171–180. [DOI] [PubMed] [Google Scholar]
- (192).Pansarasa O; Bordoni M; Diamanti L; Sproviero D; Gagliardi S; Cereda C Sod1 in Amyotrophic Lateral Sclerosis: "Ambivalent" Behavior Connected to the Disease. Int. J. Mol. Sci 2018, 19, 1345. [DOI] [PMC free article] [PubMed] [Google Scholar]
- (193).Malada Edelstein YF; Solomonov Y; Hadad N; Alfahel L; Israelson A; Levy R Early Upregulation of Cytosolic Phospholipase a(2)Alpha in Motor Neurons Is Induced by Misfolded Sod1 in a Mouse Model of Amyotrophic Lateral Sclerosis. J. Neuroinflammation 2021, 18, 274. [DOI] [PMC free article] [PubMed] [Google Scholar]
- (194).Lin R; Brown F; James S; Jones J; Ekinci E Continuous Glucose Monitoring: A Review of the Evidence in Type 1 and 2 Diabetes Mellitus. Diabet. Med 2021, 38, e14528. [DOI] [PubMed] [Google Scholar]
- (195).Ju J; Hsieh CM; Tian Y; Kang J; Chia R; Chang H; Bai Y; Xu C; Wang X; Liu Q Surface Enhanced Raman Spectroscopy Based Biosensor with a Microneedle Array for Minimally Invasive in Vivo Glucose Measurements. ACS Sensors 2020, 5, 1777–1785. [DOI] [PubMed] [Google Scholar]
- (196).Hasin Y; Seldin M; Lusis A Multi-Omics Approaches to Disease. Genome Biol 2017, 18, 83. [DOI] [PMC free article] [PubMed] [Google Scholar]
- (197).Karczewski KJ; Snyder MP Integrative Omics for Health and Disease. Nat. Rev. Genet 2018, 19, 299–310. [DOI] [PMC free article] [PubMed] [Google Scholar]
- (198).Collins SL; Koo I; Peters JM; Smith PB; Patterson AD Current Challenges and Recent Developments in Mass Spectrometry–Based Metabolomics. Annu Rev Anal Chem (Palo Alto Calif) 2021, 14, 467–487. [DOI] [PubMed] [Google Scholar]
- (199).Gertsman I; Barshop BA Promises and Pitfalls of Untargeted Metabolomics. J. Inherit. Metab. Dis 2018, 41, 355–366. [DOI] [PMC free article] [PubMed] [Google Scholar]
- (200).Cui L; Lu H; Lee YH Challenges and Emergent Solutions for Lc-Ms/Ms Based Untargeted Metabolomics in Diseases. Mass Spectrom. Rev 2018, 37, 772–792. [DOI] [PubMed] [Google Scholar]
- (201).Kirchberger-Tolstik T; Ryabchykov O; Bocklitz T; Dirsch O; Settmacher U; Popp J; Stallmach A Nondestructive Molecular Imaging by Raman Spectroscopy Vs. Marker Detection by Maldi Ims for an Early Diagnosis of Hcc. Analyst 2021, 146, 1239–1252. [DOI] [PubMed] [Google Scholar]
- (202).Lanekoff I; Sharma VV; Marques C Single-Cell Metabolomics: Where Are We and Where Are We Going? Curr. Opin. Biotechnol 2022, 75, 102693. [DOI] [PubMed] [Google Scholar]
- (203).Ali A; Abouleila Y; Shimizu Y; Hiyama E; Watanabe TM; Yanagida T; Germond A Single-Cell Screening of Tamoxifen Abundance and Effect Using Mass Spectrometry and Raman-Spectroscopy. Anal. Chem 2019, 91, 2710–2718. [DOI] [PubMed] [Google Scholar]
- (204).Kobayashi-Kirschvink KJ; Nakaoka H; Oda A; Kamei K.-i. F.; Nosho K; Fukushima H; Kanesaki Y; Yajima S; Masaki H; Ohta K; et al. Linear Regression Links Transcriptomic Data and Cellular Raman Spectra. Cell Syst 2018, 7, 104–117.e104. [DOI] [PubMed] [Google Scholar]
- (205).Le Reste PJ; Pilalis E; Aubry M; McMahon M; Cano L; Etcheverry A; Chatziioannou A; Chevet E; Fautrel A Integration of Raman Spectra with Transcriptome Data in Glioblastoma Multiforme Defines Tumour Subtypes and Predicts Patient Outcome. J. Cell. Mol. Med 2021, 25, 10846–10856. [DOI] [PMC free article] [PubMed] [Google Scholar]
- (206).Morrish R; Yim KHW; Pagliara S; Palombo F; Chahwan R; Stone N Single Cell Label-Free Probing of Chromatin Dynamics During B Lymphocyte Maturation. Front. Cell Dev. Biol 2021, 9, 646616. [DOI] [PMC free article] [PubMed] [Google Scholar]
- (207).Germond A; Ichimura T; Horinouchi T; Fujita H; Furusawa C; Watanabe TM Raman Spectral Signature Reflects Transcriptomic Features of Antibiotic Resistance in Escherichia Coli. Commun. Biol 2018, 1, 85. [DOI] [PMC free article] [PubMed] [Google Scholar]
- (208).Diggs LP; Hsueh EC Utility of Pd-L1 Immunohistochemistry Assays for Predicting Pd-1/Pd-L1 Inhibitor Response. Biomark. Res 2017, 5, 12. [DOI] [PMC free article] [PubMed] [Google Scholar]
- (209).Carvajal-Hausdorf DE; Schalper KA; Neumeister VM; Rimm DL Quantitative Measurement of Cancer Tissue Biomarkers in the Lab and in the Clinic. Lab. Invest 2015, 95, 385–396. [DOI] [PMC free article] [PubMed] [Google Scholar]
- (210).James ML; Gambhir SS A Molecular Imaging Primer: Modalities, Imaging Agents, and Applications. Physiol. Rev 2012, 92, 897–965. [DOI] [PubMed] [Google Scholar]
- (211).Rowe SP; Pomper MG Molecular Imaging in Oncology: Current Impact and Future Directions. CA Cancer J. Clin 2022, 72, 333–352. [DOI] [PMC free article] [PubMed] [Google Scholar]
- (212).Bell SEJ; Charron G; Cortés E; Kneipp J; de la Chapelle ML; Langer J; Procházka M; Tran V; Schlücker S Towards Reliable and Quantitative Surface-Enhanced Raman Scattering (Sers): From Key Parameters to Good Analytical Practice. Angew. Chem. Int. Ed 2020, 59, 5454–5462. [DOI] [PMC free article] [PubMed] [Google Scholar]
- (213).Zhang Y; Hong H; Myklejord DV; Cai W Molecular Imaging with Sers-Active Nanoparticles. Small 2011, 7, 3261–3269. [DOI] [PMC free article] [PubMed] [Google Scholar]
- (214).Liu H; Gao X; Xu C; Liu D Sers Tags for Biomedical Detection and Bioimaging. Theranostics 2022, 12, 1870–1903. [DOI] [PMC free article] [PubMed] [Google Scholar]
- (215).Du Z; Qi Y; He J; Zhong D; Zhou M Recent Advances in Applications of Nanoparticles in Sers in Vivo Imaging. Wiley Interdiscip. Rev. Nanomed. Nanobiotechnol 2021, 13, e1672. [DOI] [PubMed] [Google Scholar]
- (216).Tim B; Błaszkiewicz P; Kotkowiak M Recent Advances in Metallic Nanoparticle Assemblies for Surface-Enhanced Spectroscopy. Int. J. Mol. Sci 2022, 23, 291. [DOI] [PMC free article] [PubMed] [Google Scholar]
- (217).Andreiuk B; Nicolson F; Clark LM; Panikkanvalappil SR; Kenry; Rashidian M; Harmsen S; Kircher MF Design and Synthesis of Gold Nanostars-Based Sers Nanotags for Bioimaging Applications. Nanotheranostics 2022, 6, 10–30. [DOI] [PMC free article] [PubMed] [Google Scholar]
- (218).Li Y; Wang Z; Mu X; Ma A; Guo S Raman Tags: Novel Optical Probes for Intracellular Sensing and Imaging. Biotechnol. Adv 2017, 35, 168–177. [DOI] [PubMed] [Google Scholar]
- (219).Crist RM; Dasa SSK; Liu CH; Clogston JD; Dobrovolskaia MA; Stern ST Challenges in the Development of Nanoparticle-Based Imaging Agents: Characterization and Biology. Wiley Interdiscip. Rev. Nanomed. Nanobiotechnol 2021, 13, e1665. [DOI] [PubMed] [Google Scholar]
- (220).Kuppusamy P; Govindan N; Yusoff MM; Ichwan SJA Proteins Are Potent Biomarkers to Detect Colon Cancer Progression. Saudi J. Biol. Sci 2017, 24, 1212–1221. [DOI] [PMC free article] [PubMed] [Google Scholar]
- (221).Bocklitz T; Silge A; Bae H; Rodewald M; Legesse FB; Meyer T; Popp J Non-Invasive Imaging Techniques: From Histology to in Vivo Imaging. In Molecular Imaging in Oncology, Schober O, Kiessling F, Debus J Eds.; Springer International Publishing, 2020; p 795–812. [DOI] [PubMed] [Google Scholar]
- (222).Murali VP; Karunakaran V; Murali M; Lekshmi A; Kottarathil S; Deepika S; Saritha VN; Ramya AN; Raghu KG; Sujathan K; et al. A Clinically Feasible Diagnostic Spectro-Histology Built on Sers-Nanotags for Multiplex Detection and Grading of Breast Cancer Biomarkers. Biosens. Bioelectron 2023, 227, 115177. [DOI] [PubMed] [Google Scholar]
- (223).Ou YC; Webb JA; O'Brien CM; Pence IJ; Lin EC; Paul EP; Cole D; Ou SH; Lapierre-Landry M; DeLapp RC; et al. Diagnosis of Immunomarkers in Vivo Via Multiplexed Surface Enhanced Raman Spectroscopy with Gold Nanostars. Nanoscale 2018, 10, 13092–13105. [DOI] [PubMed] [Google Scholar]
- (224).Wang YW; Doerksen JD; Kang S; Walsh D; Yang Q; Hong D; Liu JT Multiplexed Molecular Imaging of Fresh Tissue Surfaces Enabled by Convection-Enhanced Topical Staining with Sers-Coded Nanoparticles. Small 2016, 12, 5612–5621. [DOI] [PMC free article] [PubMed] [Google Scholar]
- (225).Yu JH; Steinberg I; Davis RM; Malkovskiy AV; Zlitni A; Radzyminski RK; Jung KO; Chung DT; Curet LD; D'Souza AL; et al. Noninvasive and Highly Multiplexed Five-Color Tumor Imaging of Multicore near-Infrared Resonant Surface-Enhanced Raman Nanoparticles in Vivo. ACS Nano 2021, 15, 19956–19969. [DOI] [PMC free article] [PubMed] [Google Scholar]
- (226).Bock S; Choi YS; Kim M; Yun Y; Pham XH; Kim J; Seong B; Kim W; Jo A; Ham KM; et al. Highly Sensitive near-Infrared Sers Nanoprobes for in Vivo Imaging Using Gold-Assembled Silica Nanoparticles with Controllable Nanogaps. J. Nanobiotechnology 2022, 20, 130. [DOI] [PMC free article] [PubMed] [Google Scholar]
- (227).Eremina OE; Czaja AT; Fernando A; Aron A; Eremin DB; Zavaleta C Expanding the Multiplexing Capabilities of Raman Imaging to Reveal Highly Specific Molecular Expression and Enable Spatial Profiling. ACS Nano 2022, 16, 10341–10353. [DOI] [PubMed] [Google Scholar]
- (228).Zou Y; Huang S; Liao Y; Zhu X; Chen Y; Chen L; Liu F; Hu X; Tu H; Zhang L; et al. Isotopic Graphene-Isolated-Au-Nanocrystals with Cellular Raman-Silent Signals for Cancer Cell Pattern Recognition. Chem. Sci 2018, 9, 2842–2849. [DOI] [PMC free article] [PubMed] [Google Scholar]
- (229).Wang J; Liang D; Feng J; Tang X Multicolor Cocktail for Breast Cancer Multiplex Phenotype Targeting and Diagnosis Using Bioorthogonal Surface-Enhanced Raman Scattering Nanoprobes. Anal. Chem 2019, 91, 11045–11054. [DOI] [PubMed] [Google Scholar]
- (230).Nicolson F; Andreiuk B; Andreou C; Hsu HT; Rudder S; Kircher MF Non-Invasive in Vivo Imaging of Cancer Using Surface-Enhanced Spatially Offset Raman Spectroscopy (Sesors). Theranostics 2019, 9, 5899–5913. [DOI] [PMC free article] [PubMed] [Google Scholar]
- (231).Strobbia P; Cupil-Garcia V; Crawford BM; Fales AM; Pfefer TJ; Liu Y; Maiwald M; Sumpf B; Vo-Dinh T Accurate in Vivo Tumor Detection Using Plasmonic-Enhanced Shifted-Excitation Raman Difference Spectroscopy (Serds). Theranostics 2021, 11, 4090–4102. [DOI] [PMC free article] [PubMed] [Google Scholar]
- (232).Sujai PT; Joseph MM; Karunakaran V; Saranya G; Adukkadan RN; Shamjith S; Thomas R; Nair JB; Swathi RS; Maiti KK Biogenic Cluster-Encased Gold Nanorods as a Targeted Three-in-One Theranostic Nanoenvelope for Sers-Guided Photochemotherapy against Metastatic Melanoma. ACS Appl. Bio Mater 2019, 2, 588–600. [DOI] [PubMed] [Google Scholar]
- (233).Noonan J; Asiala SM; Grassia G; MacRitchie N; Gracie K; Carson J; Moores M; Girolami M; Bradshaw AC; Guzik TJ; et al. In Vivo Multiplex Molecular Imaging of Vascular Inflammation Using Surface-Enhanced Raman Spectroscopy. Theranostics 2018, 8, 6195–6209. [DOI] [PMC free article] [PubMed] [Google Scholar]
- (234).Kang H; Jeong S; Jo A; Chang H; Yang JK; Jeong C; Kyeong S; Lee YW; Samanta A; Maiti KK; et al. Ultrasensitive Nir-Serrs Probes with Multiplexed Ratiometric Quantification for in Vivo Antibody Leads Validation. Adv. Healthc. Mater 2018, 7, 1700870. [DOI] [PubMed] [Google Scholar]
- (235).Morrison LE Basic Principles of Fluorescence and Energy Transfer. In Molecular Beacons: Signalling Nucleic Acid Probes, Methods, and Protocols, Marx A, Seitz O Eds.; Humana Press, 2008; p 3–19. [Google Scholar]
- (236).Rao AP; Bokde N; Sinha S Photoacoustic Imaging for Management of Breast Cancer: A Literature Review and Future Perspectives. Appl. Sci 2020, 10, 767. [Google Scholar]
- (237).Heeman W; Vonk J; Ntziachristos V; Pogue BW; Dierckx R; Kruijff S; van Dam GM A Guideline for Clinicians Performing Clinical Studies with Fluorescence Imaging. J. Nucl. Med 2022, 63, 640–645. [DOI] [PubMed] [Google Scholar]
- (238).Glimm AM; Sprenger LI; Haugen IK; Mansmann U; Hermann S; Haupl T; Hoff P; Burmester GR; Backhaus M; Le L; et al. Fluorescence Optical Imaging for Treatment Monitoring in Patients with Early and Active Rheumatoid Arthritis in a 1-Year Follow-up Period. Arthrit. Res. Ther 2019, 21, 209. [DOI] [PMC free article] [PubMed] [Google Scholar]
- (239).Daoudi K; Kersten BE; van den Ende CHM; van den Hoogen FHJ; Vonk MC; de Korte CL Photoacoustic and High-Frequency Ultrasound Imaging of Systemic Sclerosis Patients. Arthrit. Res. Ther 2021, 23, 22. [DOI] [PMC free article] [PubMed] [Google Scholar]
- (240).Stridh MT; Hult J; Merdasa A; Albinsson J; Pekar-Lukacs A; Gesslein B; Dahlstrand U; Engelsberg K; Berggren J; Cinthio M; et al. Photoacoustic Imaging of Periorbital Skin Cancer Ex Vivo: Unique Spectral Signatures of Malignant Melanoma, Basal, and Squamous Cell Carcinoma. Biomed. Opt. Express 2022, 13, 410–425. [DOI] [PMC free article] [PubMed] [Google Scholar]
- (241).Cha MG; Lee S; Park S; Kang H; Lee SG; Jeong C; Lee YS; Kim C; Jeong DH A Dual Modal Silver Bumpy Nanoprobe for Photoacoustic Imaging and Sers Multiplexed Identification of in Vivo Lymph Nodes. Nanoscale 2017, 9, 12556–12564. [DOI] [PubMed] [Google Scholar]
- (242).Pal S; Koneru JK; Andreou C; Rakshit T; Rajasekhar VK; Wlodarczyk M; Healey JH; Kircher MF; Mondal J DNA-Functionalized Gold Nanorods for Perioperative Optical Imaging and Photothermal Therapy of Triple-Negative Breast Cancer. ACS Applied Nano Materials 2022, 5, 9159–9169. [Google Scholar]
- (243).Wang J; Sun J; Wang Y; Chou T; Zhang Q; Zhang B; Ren L; Wang H Gold Nanoframeworks with Mesopores for Raman-Photoacoustic Imaging and Photo-Chemo Tumor Therapy in the Second near-Infrared Biowindow. Adv. Funct. Mater 2020, 30, 1908825. [DOI] [PMC free article] [PubMed] [Google Scholar]
- (244).Zhu W; Gao MY; Zhu Q; Chi B; Zeng LW; Hu JM; Shen AG Monodispersed Plasmonic Prussian Blue Nanoparticles for Zero-Background Sers/Mri-Guided Phototherapy. Nanoscale 2020, 12, 3292–3301. [DOI] [PubMed] [Google Scholar]
- (245).Zhang C; Xu Z; Di H; Zeng E; Jiang Y; Liu D Gadolinium-Doped Au@Prussian Blue Nanoparticles as Mr/Sers Bimodal Agents for Dendritic Cell Activating and Tracking. Theranostics 2020, 10, 6061–6071. [DOI] [PMC free article] [PubMed] [Google Scholar]
- (246).Shi B; Li D; Yao W; Wang W; Jiang J; Wang R; Yan F; Liu H; Zhang H; Ye J Multifunctional Theranostic Nanoparticles for Multi-Modal Imaging-Guided Car-T Immunotherapy and Chemo-Photothermal Combinational Therapy of Non-Hodgkin's Lymphoma. Biomaterials Science 2022, 10, 2577–2589. [DOI] [PubMed] [Google Scholar]
- (247).Basu S; Kwee TC; Surti S; Akin EA; Yoo D; Alavi A Fundamentals of Pet and Pet/Ct Imaging. Ann. N.Y. Acad. Sci 2011, 1228, 1–18. [DOI] [PubMed] [Google Scholar]
- (248).Wall MA; Shaffer TM; Harmsen S; Tschaharganeh DF; Huang CH; Lowe SW; Drain CM; Kircher MF Chelator-Free Radiolabeling of Serrs Nanoparticles for Whole-Body Pet and Intraoperative Raman Imaging. Theranostics 2017, 7, 3068–3077. [DOI] [PMC free article] [PubMed] [Google Scholar]
- (249).Ou YC; Wen X; Johnson CA; Shae D; Ayala OD; Webb JA; Lin EC; DeLapp RC; Boyd KL; Richmond A; et al. Multimodal Multiplexed Immunoimaging with Nanostars to Detect Multiple Immunomarkers and Monitor Response to Immunotherapies. ACS Nano 2020, 14, 651–663. [DOI] [PMC free article] [PubMed] [Google Scholar]
- (250).Rastinehad AR; Anastos H; Wajswol E; Winoker JS; Sfakianos JP; Doppalapudi SK; Carrick MR; Knauer CJ; Taouli B; Lewis SC; et al. Gold Nanoshell-Localized Photothermal Ablation of Prostate Tumors in a Clinical Pilot Device Study. Proc. Natl. Acad. Sci. U.S.A 2019, 116, 18590–18596. [DOI] [PMC free article] [PubMed] [Google Scholar]
- (251).Higbee-Dempsey EM; Amirshaghaghi A; Case MJ; Bouché M; Kim J; Cormode DP; Tsourkas A Biodegradable Gold Nanoclusters with Improved Excretion Due to Ph-Triggered Hydrophobic-to-Hydrophilic Transition. J. Am. Chem. Soc 2020, 142, 7783–7794. [DOI] [PMC free article] [PubMed] [Google Scholar]
- (252).Cheheltani R; Ezzibdeh RM; Chhour P; Pulaparthi K; Kim J; Jurcova M; Hsu JC; Blundell C; Litt HI; Ferrari VA; et al. Tunable, Biodegradable Gold Nanoparticles as Contrast Agents for Computed Tomography and Photoacoustic Imaging. Biomaterials 2016, 102, 87–97. [DOI] [PMC free article] [PubMed] [Google Scholar]
- (253).Wang J; Koo KM; Trau M Tetraplex Immunophenotyping of Cell Surface Proteomes Via Synthesized Plasmonic Nanotags and Portable Raman Spectroscopy. Anal. Chem 2022, 94, 14906–14916. [DOI] [PubMed] [Google Scholar]
- (254).Tian S; Neumann O; McClain MJ; Yang X; Zhou L; Zhang C; Nordlander P; Halas NJ Aluminum Nanocrystals: A Sustainable Substrate for Quantitative Sers-Based DNA Detection. Nano Lett 2017, 17, 5071–5077. [DOI] [PubMed] [Google Scholar]
- (255).Sharma B; Frontiera RR; Henry A-I; Ringe E; Van Duyne RP Sers: Materials, Applications, and the Future. Mater. Today 2012, 15, 16–25. [Google Scholar]
- (256).Busch RT; Karim F; Weis J; Sun Y; Zhao C; Vasquez ES Optimization and Structural Stability of Gold Nanoparticle–Antibody Bioconjugates. ACS Omega 2019, 4, 15269–15279. [DOI] [PMC free article] [PubMed] [Google Scholar]
- (257).Liu Y; Zhan L; Qin Z; Sackrison J; Bischof JC Ultrasensitive and Highly Specific Lateral Flow Assays for Point-of-Care Diagnosis. ACS Nano 2021, 15, 3593–3611. [DOI] [PubMed] [Google Scholar]
- (258).Zhuang X; Hu Y; Wang J; Hu J; Wang Q; Yu X A Colorimetric and Sers Dual-Readout Sensor for Sensitive Detection of Tyrosinase Activity Based on 4-Mercaptophenyl Boronic Acid Modified Aunps. Anal. Chim. Acta 2021, 1188, 339172. [DOI] [PubMed] [Google Scholar]
- (259).Yang F; Wen P; Li G; Zhang Z; Ge C; Chen L High-Performance Surface-Enhanced Raman Spectroscopy Chip Integrated with a Micro-Optical System for the Rapid Detection of Creatinine in Serum. Biomed. Opt. Express 2021, 12, 4795–4806. [DOI] [PMC free article] [PubMed] [Google Scholar]
- (260).Ganesan S; Venkatakrishnan K; Tan B Wrinkled Metal Based Quantum Sensor for in Vitro Cancer Diagnosis. Biosens. Bioelectron 2020, 151, 111967. [DOI] [PubMed] [Google Scholar]
- (261).Liu Y; Ran M; Sun Y; Fan Y; Wang J; Cao X; Lu D A Sandwich Sers Immunoassay Platform Based on a Single-Layer Au-Ag Nanobox Array Substrate for Simultaneous Detection of Scca and Survivin in Serum of Patients with Cervical Lesions. Rsc Adv 2021, 11, 36734–36747. [DOI] [PMC free article] [PubMed] [Google Scholar]
- (262).Lu D; Ran M; Liu Y; Xia J; Bi L; Cao X Sers Spectroscopy Using Au-Ag Nanoshuttles and Hydrophobic Paper-Based Au Nanoflower Substrate for Simultaneous Detection of Dual Cervical Cancer-Associated Serum Biomarkers. Anal. Bioanal. Chem 2020, 412, 7099–7112. [DOI] [PubMed] [Google Scholar]
- (263).Chen R; Du X; Cui Y; Zhang X; Ge Q; Dong J; Zhao X Vertical Flow Assay for Inflammatory Biomarkers Based on Nanofluidic Channel Array and Sers Nanotags. Small 2020, 16, e2002801. [DOI] [PubMed] [Google Scholar]
- (264).Yu D; Yin Q; Wang J; Yang J; Chen Z; Gao Z; Huang Q; Li S Sers-Based Immunoassay Enhanced with Silver Probe for Selective Separation and Detection of Alzheimer's Disease Biomarkers. Int. J. Nanomedicine 2021, 16, 1901–1911. [DOI] [PMC free article] [PubMed] [Google Scholar]
- (265).Wen X; Ou YC; Zarick HF; Zhang X; Hmelo AB; Victor QJ; Paul EP; Slocik JM; Naik RR; Bellan LM; et al. Prada: Portable Reusable Accurate Diagnostics with Nanostar Antennas for Multiplexed Biomarker Screening. Bioeng. Transl. Med 2020, 5, e10165. [DOI] [PMC free article] [PubMed] [Google Scholar]
- (266).Taghdisi SM; Danesh NM; Lavaee P; Ramezani M; Abnous K An Electrochemical Aptasensor Based on Gold Nanoparticles, Thionine and Hairpin Structure of Complementary Strand of Aptamer for Ultrasensitive Detection of Lead. Sens. Actuators B Chem 2016, 234, 462–469. [Google Scholar]
- (267).Lu T; Wang L; Xia Y; Jin Y; Zhang L; Du S A Multimer-Based Sers Aptasensor for Highly Sensitive and Homogeneous Assay of Carcinoembryonic Antigens. Analyst 2021, 146, 3016–3024. [DOI] [PubMed] [Google Scholar]
- (268).Zhang X; Liu S; Song X; Wang H; Wang J; Wang Y; Huang J; Yu J Robust and Universal Sers Sensing Platform for Multiplexed Detection of Alzheimer's Disease Core Biomarkers Using Paapt-Aunps Conjugates. ACS Sensors 2019, 4, 2140–2149. [DOI] [PubMed] [Google Scholar]
- (269).Oliveira MJ; Dalot A; Fortunato E; Martins R; Byrne HJ; Franco R; Águas H Microfluidic Sers Devices: Brightening the Future of Bioanalysis. Discov. Mater 2022, 2, 12. [DOI] [PMC free article] [PubMed] [Google Scholar]
- (270).Gil Rosa B; Akingbade OE; Guo X; Gonzalez-Macia L; Crone MA; Cameron LP; Freemont P; Choy K-L; Güder F; Yeatman E; et al. Multiplexed Immunosensors for Point-of-Care Diagnostic Applications. Biosens. Bioelectron 2022, 203, 114050. [DOI] [PubMed] [Google Scholar]
- (271).Yang M; Liu Y; Jiang X Barcoded Point-of-Care Bioassays. Chem. Soc. Rev 2019, 48, 850–884. [DOI] [PubMed] [Google Scholar]
- (272).Sanchez-Purra M; Carre-Camps M; de Puig H; Bosch I; Gehrke L; Hamad-Schifferli K Surface-Enhanced Raman Spectroscopy-Based Sandwich Immunoassays for Multiplexed Detection of Zika and Dengue Viral Biomarkers. ACS Infect. Dis 2017, 3, 767–776. [DOI] [PMC free article] [PubMed] [Google Scholar]
- (273).Wang J; Wuethrich A; Sina AA; Lane RE; Lin LL; Wang Y; Cebon J; Behren A; Trau M Tracking Extracellular Vesicle Phenotypic Changes Enables Treatment Monitoring in Melanoma. Sci Adv 2020, 6, eaax3223. [DOI] [PMC free article] [PubMed] [Google Scholar]
- (274).Xiong Q; Lim CY; Ren J; Zhou J; Pu K; Chan-Park MB; Mao H; Lam YC; Duan H Magnetic Nanochain Integrated Microfluidic Biochips. Nat. Commun 2018, 9, 1743. [DOI] [PMC free article] [PubMed] [Google Scholar]
- (275).Mogera U; Guo H; Namkoong M; Rahman MS; Nguyen T; Tian L Wearable Plasmonic Paper-Based Microfluidics for Continuous Sweat Analysis. Sci Adv 2022, 8, eabn1736. [DOI] [PMC free article] [PubMed] [Google Scholar]
- (276).Lim WY; Goh CH; Thevarajah TM; Goh BT; Khor SM Using Sers-Based Microfluidic Paper-Based Device (Mupad) for Calibration-Free Quantitative Measurement of Ami Cardiac Biomarkers. Biosens. Bioelectron 2020, 147, 111792. [DOI] [PubMed] [Google Scholar]
- (277).Wen X; Ou L; Cutshaw G; Uthaman S; Ou Y-C; Zhu T; Szakas S; Carney B; Gundlach-Graham A; Houghton J; et al. Physicochemical Properties and Route of Systemic Delivery Control The in Vivo dynamics and Breakdown of Radiolabeled Gold Nanostars. Small 2023. [DOI] [PMC free article] [PubMed]
- (278).Mosier-Boss PA Review of Sers Substrates for Chemical Sensing. Nanomaterials (Basel) 2017, 7, 142. [DOI] [PMC free article] [PubMed] [Google Scholar]
- (279).Attarilar S; Yang J; Ebrahimi M; Wang Q; Liu J; Tang Y; Yang J The Toxicity Phenomenon and the Related Occurrence in Metal and Metal Oxide Nanoparticles: A Brief Review from the Biomedical Perspective. Front. Bioeng. Biotechnol 2020, 8, 822. [DOI] [PMC free article] [PubMed] [Google Scholar]
- (280).Wang W; Wei Q-Q; Wang J; Wang B-C; Zhang S.-h.; Yuan Z Role of Thiol-Containing Polyethylene Glycol (Thiol-Peg) in the Modification Process of Gold Nanoparticles (Aunps): Stabilizer or Coagulant? J. Colloid Interface Sci 2013, 404, 223–229. [DOI] [PubMed] [Google Scholar]
- (281).Zhao Z; Shen Y; Hu F; Min W Applications of Vibrational Tags in Biological Imaging by Raman Microscopy. Analyst 2017, 142, 4018–4029. [DOI] [PMC free article] [PubMed] [Google Scholar]
- (282).Bi X; Miao K; Wei L Alkyne-Tagged Raman Probes for Local Environmental Sensing by Hydrogen-Deuterium Exchange. J. Am. Chem. Soc 2022, 144, 8504–8514. [DOI] [PubMed] [Google Scholar]
- (283).Koike K; Bando K; Ando J; Yamakoshi H; Terayama N; Dodo K; Smith NI; Sodeoka M; Fujita K Quantitative Drug Dynamics Visualized by Alkyne-Tagged Plasmonic-Enhanced Raman Microscopy. ACS Nano 2020, 14, 15032–15041. [DOI] [PubMed] [Google Scholar]
- (284).Chen Y; Ren JQ; Zhang XG; Wu DY; Shen AG; Hu JM Alkyne-Modulated Surface-Enhanced Raman Scattering-Palette for Optical Interference-Free and Multiplex Cellular Imaging. Anal. Chem 2016, 88, 6115–6119. [DOI] [PubMed] [Google Scholar]
- (285).Jin Q; Fan X; Chen C; Huang L; Wang J; Tang X Multicolor Raman Beads for Multiplexed Tumor Cell and Tissue Imaging and in Vivo Tumor Spectral Detection. Anal. Chem 2019, 91, 3784–3789. [DOI] [PubMed] [Google Scholar]
- (286).Zeng C; Hu F; Long R; Min W A Ratiometric Raman Probe for Live-Cell Imaging of Hydrogen Sulfide in Mitochondria by Stimulated Raman Scattering. Analyst 2018, 143, 4844–4848. [DOI] [PMC free article] [PubMed] [Google Scholar]
- (287).Bakthavatsalam S; Dodo K; Sodeoka M A Decade of Alkyne-Tag Raman Imaging (Atri): Applications in Biological Systems. RSC Chemical Biology 2021, 2, 1415–1429. [DOI] [PMC free article] [PubMed] [Google Scholar]
- (288).Lee HJ; Zhang W; Zhang D; Yang Y; Liu B; Barker EL; Buhman KK; Slipchenko LV; Dai M; Cheng JX Assessing Cholesterol Storage in Live Cells and C. Elegans by Stimulated Raman Scattering Imaging of Phenyl-Diyne Cholesterol. Sci. Rep 2015, 5, 7930. [DOI] [PMC free article] [PubMed] [Google Scholar]
- (289).Tipping WJ; Lee M; Serrels A; Brunton VG; Hulme AN Imaging Drug Uptake by Bioorthogonal Stimulated Raman Scattering Microscopy. Chem. Sci 2017, 8, 5606–5615. [DOI] [PMC free article] [PubMed] [Google Scholar]
- (290).Jahangirian H; Kalantari K; Izadiyan Z; Rafiee-Moghaddam R; Shameli K; Webster TJ A Review of Small Molecules and Drug Delivery Applications Using Gold and Iron Nanoparticles. Int. J. Nanomedicine 2019, 14, 1633–1657. [DOI] [PMC free article] [PubMed] [Google Scholar]
- (291).Hu F; Brucks SD; Lambert TH; Campos LM; Min W Stimulated Raman Scattering of Polymer Nanoparticles for Multiplexed Live-Cell Imaging. Chem. Commun 2017, 53, 6187–6190. [DOI] [PMC free article] [PubMed] [Google Scholar]
- (292).Zhao Z; Chen C; Wei S; Xiong H; Hu F; Miao Y; Jin T; Min W Ultra-Bright Raman Dots for Multiplexed Optical Imaging. Nat. Commun 2021, 12, 1305. [DOI] [PMC free article] [PubMed] [Google Scholar]
- (293).Chen C; Zhao Z; Qian N; Wei S; Hu F; Min W Multiplexed Live-Cell Profiling with Raman Probes. Nat. Commun 2021, 12, 3405. [DOI] [PMC free article] [PubMed] [Google Scholar]
- (294).Kik K; Bukowska B; Sicińska P Polystyrene Nanoparticles: Sources, Occurrence in the Environment, Distribution in Tissues, Accumulation and Toxicity to Various Organisms. Environ. Pollut 2020, 262, 114297. [DOI] [PubMed] [Google Scholar]
- (295).Ghitman J; Biru EI; Stan R; Iovu H Review of Hybrid Plga Nanoparticles: Future of Smart Drug Delivery and Theranostics Medicine. Materials & Design 2020, 193, 108805. [Google Scholar]
- (296).Vanden-Hehir S; Cairns SA; Lee M; Zoupi L; Shaver MP; Brunton VG; Williams A; Hulme AN Alkyne-Tagged Plga Allows Direct Visualization of Nanoparticles in Vitro and Ex Vivo by Stimulated Raman Scattering Microscopy. Biomacromolecules 2019, 20, 4008–4014. [DOI] [PMC free article] [PubMed] [Google Scholar]
- (297).Li S; Chen T; Wang Y; Liu L; Lv F; Li Z; Huang Y; Schanze KS; Wang S Conjugated Polymer with Intrinsic Alkyne Units for Synergistically Enhanced Raman Imaging in Living Cells. Angew. Chem. Int. Ed 2017, 56, 13455–13458. [DOI] [PubMed] [Google Scholar]
- (298).Gagliardi A; Giuliano E; Venkateswararao E; Fresta M; Bulotta S; Awasthi V; Cosco D Biodegradable Polymeric Nanoparticles for Drug Delivery to Solid Tumors. Front. Pharmacol 2021, 12, 601626. [DOI] [PMC free article] [PubMed] [Google Scholar]
- (299).Grajales Lopera DO; Picot F; Shams R; Dallaire F; Sheehy G; Alley S; Barkati M; Delouya G; Carrier JF; Birlea M; et al. Image-Guided Raman Spectroscopy Navigation System to Improve Transperineal Prostate Cancer Detection. Part 2: In-Vivo Tumor-Targeting Using a Classification Model Combining Spectral and Mri-Radiomics Features. J. Biomed. Opt 2022, 27, 095004. [DOI] [PMC free article] [PubMed] [Google Scholar]
- (300).O'Brien CM; Vargis E; Rudin A; Slaughter JC; Thomas G; Newton JM; Reese J; Bennett KA; Mahadevan-Jansen A In Vivo Raman Spectroscopy for Biochemical Monitoring of the Human Cervix Throughout Pregnancy. Am. J. Obstet. Gynecol 2018, 218, 528 e521–528 e518. [DOI] [PMC free article] [PubMed] [Google Scholar]
- (301).Cha H; Kim H; Joung Y; Kang H; Moon J; Jang H; Park S; Kwon H-J; Lee I-C; Kim S; et al. Surface-Enhanced Raman Scattering-Based Immunoassay for Severe Acute Respiratory Syndrome Coronavirus 2. Biosens. Bioelectron 2022, 202, 114008. [DOI] [PMC free article] [PubMed] [Google Scholar]
- (302).Fraiman J; Erviti J; Jones M; Greenland S; Whelan P; Kaplan RM; Doshi P Serious Adverse Events of Special Interest Following Mrna Covid-19 Vaccination in Randomized Trials in Adults. Vaccine 2022, 40, 5798–5805. [DOI] [PMC free article] [PubMed] [Google Scholar]
- (303).Lem DW; Davey PG; Gierhart DL; Rosen RB A Systematic Review of Carotenoids in the Management of Age-Related Macular Degeneration. Antioxidants (Basel) 2021, 10, 1255. [DOI] [PMC free article] [PubMed] [Google Scholar]
- (304).Jermyn M; Mok K; Mercier J; Desroches J; Pichette J; Saint-Arnaud K; Bernstein L; Guiot MC; Petrecca K; Leblond F Intraoperative Brain Cancer Detection with Raman Spectroscopy in Humans. Sci. Transl. Med 2015, 7, 274ra219. [DOI] [PubMed] [Google Scholar]
- (305).Alkilany AM; Alsotari S; Alkawareek MY; Abulateefeh SR Facile Hydrophobication of Glutathione-Protected Gold Nanoclusters and Encapsulation into Poly(Lactide-Co-Glycolide) Nanocarriers. Sci. Rep 2019, 9, 11098. [DOI] [PMC free article] [PubMed] [Google Scholar]
- (306).Porret E; Sancey L; Martín-Serrano A; Montañez MI; Seeman R; Yahia-Ammar A; Okuno H; Gomez F; Ariza A; Hildebrandt N; et al. Hydrophobicity of Gold Nanoclusters Influences Their Interactions with Biological Barriers. Chem. Mater 2017, 29, 7497–7506. [Google Scholar]
- (307).Liebel M; Pazos-Perez N; van Hulst NF; Alvarez-Puebla RA Surface-Enhanced Raman Scattering Holography. Nat. Nanotechnol 2020, 15, 1005–1011. [DOI] [PubMed] [Google Scholar]
- (308).Gabor D A New Microscopic Principle. Nature 1948, 161, 777. [DOI] [PubMed] [Google Scholar]
- (309).Aarnisalo AA; Cheng JT; Ravicz ME; Hulli N; Harrington EJ; Hernandez-Montes MS; Furlong C; Merchant SN; Rosowski JJ Middle Ear Mechanics of Cartilage Tympanoplasty Evaluated by Laser Holography and Vibrometry. Otol. Neurotol 2009, 30, 1209–1214. [DOI] [PMC free article] [PubMed] [Google Scholar]
- (310).Pathania D; Im H; Kilcoyne A; Sohani AR; Fexon L; Pivovarov M; Abramson JS; Randall TC; Chabner BA; Weissleder R; et al. Holographic Assessment of Lymphoma Tissue (Halt) for Global Oncology Field Applications. Theranostics 2016, 6, 1603–1610. [DOI] [PMC free article] [PubMed] [Google Scholar]