

Abstract
Background
Periodontitis is intricately linked to oxidative stress-antioxidant (redox) imbalance. The antioxidant system scavenges the oxygen free radicals in biological fluids in patients with periodontitis. However, little is still known about the free radicals mediated oxidative stress and reductive ability of the antioxidant system. Thus, the present meta-analysis aims to quantitatively review the literature that assessed the oxidative stress marker total oxidative stress (TOS) and total antioxidant capacity (TAC) in various biological fluids of patients with periodontitis. Methodology. Electronic databases were searched for studies that assessed TOS and TAC levels in various biological samples of patients with periodontitis.
Results
From the 1,812 articles identified, 1,754 were excluded based on title and abstract screening due to irrelevance to the topic of interest. A full-text assessment of the remaining 58 articles led to the selection of 42 articles that satisfied the inclusion criteria. Of these, only 24 studies had consistent data for quantitative analysis. The periodontitis group displayed significantly elevated TOS levels (p < 0.05) in serum, gingival crevicular fluid (GCF), and saliva samples in the studies evaluated. In contrast, the periodontitis group exhibited significantly attenuated TAC levels (p < 0.01) compared to healthy controls in plasma, serum, and GCF samples of the studies evaluated, which was insignificant in salivary samples (p=0.433). At the same time, the periodontitis group displayed insignificantly elevated TAC levels after periodontal therapy (p=0.130).
Conclusions
The present meta-analysis showed significantly higher TOS and lower TAC in periodontitis, reflecting the elevated oxidative stress level than the control group. Clinical Relevance. Scientific rationale for the study: The imbalance between oxidants and antioxidants (oxidative stress (OS)) plays a critical role in the onset and progression of periodontitis; the assessment of the relationship between OS-related biomarkers in regional samples and systemic samples of patients with periodontitis helps us to evaluate the periodontal disease progression. The OS biomarker levels can be used to assess periodontal disease and therapeutic efficacy.
1. Introduction
Reactive oxygen species or free radicals are anions with one unpaired electron in the outer shell. The complex effect of enzymatic and nonenzymatic antioxidants scavenge or neutralize the free radical activity [1]. Indeed, when the antioxidant reserve system is exhausted by the excessive accumulation of free radicals, there is no scavenging of reactive oxygen species (ROS) nor their neutralization. The resultant disruption of the antioxidant barrier is directly responsible for oxidative stress (OS)/nitrosative stress-mediated modifications of biological components [2]. OS plays a primary role in the etiopathogenesis of many systemic diseases, such as diabetes and cardiovascular diseases, as well as a possible risk factor for chronic renal failure, rheumatoid arthritis, and neurodegenerative diseases [3]. Chronic inflammatory disease, like periodontitis, is also intricately associated with oxidative-reductive imbalance. Many studies have shown that OS is directly responsible for the progressive degradation of extracellular matrix components of the periodontal attachment apparatus [4]. Recent literature indicates that redox disturbances are intensified in periodontitis patients with comorbidities. Therefore, the present meta-analysis aims to assess the literature that evaluated the total oxidative and antioxidative capacity of various biological fluids in patients with periodontitis.
2. Materials and Methods
2.1. Registration of the Protocol
PRISMA guidelines have been strictly followed for study selection. The meta-analysis protocol was recorded in the PROSPERO database (CRD42021281819).
2.2. Question of Observation
Is there any significant difference in the total oxidative stress (TOS) and total antioxidant capacity (TAC) levels of biological fluid samples between patients with periodontitis and the healthy control group?
Based on the research question, the following components were formulated:
Patient population: patients with periodontitis
Exposure or marker of evaluation: mean and standard deviation value of TOS and TAC values
Comparison: between patients with periodontitis and healthy control group
Outcome: assessment of TOS and TAC in various biological fluid samples of patients with Periodontitis
Study: collect the literature of cross-sectional and case-controlled studies that evaluated the status of TOS and TAC in Periodontitis and control from 2000 to 2023.
2.3. Literature Search
Electronic databases, including PubMed, ScienceDirect, Cochrane, Wiley Online Library, and Cross Reference, were searched for published articles addressing the TOS and TAC in patients with periodontitis and the control group between 2000 and 2023. The keywords were employed: “periodontal disease,” “total oxidative stress,” “oxidative stress,” and “total antioxidant capacity.”
2.4. Screening for Selection
Articles discussing oxidative stress and TAC in periodontitis were collected and screened for relevance based on the titles and abstracts.
2.5. Inclusion Criteria
Studies discussed the TOS and TAC in patients with periodontitis and the healthy control group;
Both the case and control groups consisted of individuals who were in good systemic health, refraining from the use of antibiotics, anti-inflammatories, or any other medications. Moreover, they had not undergone any periodontal treatments within the past 3 months.
The inclusion of studies examining systemic diseases in relation to periodontitis was contingent on the presence of two distinct evaluation groups: one for systemically healthy controls and another for the periodontitis-afflicted group.
Studies investigating the correlation between periodontitis and smoking were considered only if they incorporated nonsmokers in both the periodontitis group and the control group as separate evaluation groups.
Studies examining the impact of therapy on periodontitis were included only when they provided baseline values for both the periodontitis group and the control group.
Studies involving various biological fluid samples and expressed the assessed TOS and TAC values in mean, standard deviation, along with probability value:
Papers provided consistent data to allow comparison of patient and control groups with other relevant studies.
2.6. Exclusion Criteria
Articles with the unmatched title and objectives:
Studies that were duplicates, when they involved the same subjects and by the same authors.
Observational studies exclusively focusing on pregnant women or children.
The studies examined the therapeutic effect but did not include an evaluation of the control group.
Studies included patients with systemic diseases or smokers but did not incorporate separate evaluation groups for systemically healthy individuals or nonsmokers in the periodontitis and control groups.
Being literature, critical, or systematic reviews.
Studies used other markers of oxidative stress and antioxidant capacity for evaluation.
The articles provided incompatible data for the comparison between control and periodontitis groups with other studies.
The studies expressed the results in Graphical representation without the accurate value display.
Studies discussed the TOS and TAC values in other oral chronic inflammatory diseases.
2.7. Full-Text Retrieval and Evaluation
Two authors screened the titles and objectives of the collected studies and excluded the presentations at higher risk of bias from the quantitative synthesis based on predefined criteria. Two authors have independently evaluated the full text of each included study. Two authors have collected data for the factors considered in the meta-analysis. After considering all the particulars, the authors have selected the articles for eligibility criteria. The authors resolved disagreements by consensus. Finally, all the authors participated in manuscript preparation.
2.8. Data Segregation
The extracted information from the full text of selected articles as the author, year of publication, sample size, TOS and TAC measurements in Periodontitis, and control group expressed as the mean with standard deviation along with specific measurement units and assessment methods.
2.9. Statistical Analysis
The meta-analysis was performed by deriving the forest plot using the standard mean difference method using comprehensive meta-analysis software version 3 (Biostat Inc. Englewood, NJ, USA). The standardized mean difference values of TOS and TAC in periodontitis were evaluated at a 95% confidence interval (CI). Due to significant heterogeneity, a random-effects model was chosen for the analysis. The studies that expressed the TOS and TAC levels in similar units in each sample were only selected for the meta-analysis.
3. Results
PubMed search yielded 783 papers, ScienceDirect search yielded 369 papers, Wiley Online Library yielded 265 papers, Cochrane search yielded 390 papers, and Cross-reference search yielded five papers. After search refinement, 1,754 articles were excluded due to unmatched titles and abstracts, including four duplicated data reports and one animal study. After the extraction of these articles, 58 articles had titles relevant to the present work. The full text was retrieved for the screened articles. Papers not meeting the selection criteria (n = 16) were excluded. Finally, 42 articles with matched objectives were selected for the systematic review. Only 24 articles had data compatible with the meta-analysis (Figure 1).
Figure 1.

Flowchart for study selection.
Newcastle–Ottawa scale of included studies in the meta-analysis was displayed in Table 1 [5–46]. Collected TOS and TAC assessment data, criteria for periodontitis diagnosis, and other relevant findings from included articles in various biological fluid samples were tabulated in Tables 2 and 3, respectively [47–52]. The different methodologies utilized for assessing TOS and TAC values were also displayed in Tables 2 and 3 [53–61]. The pre and posttreatment mean values of TAC in different biological fluid samples in patients with periodontitis data from the included studies are presented in Table 4. The analysis of TOS levels after therapeutic intervention could not be performed due to the scarcity of published studies.
Table 1.
Newcastle–Ottawa Scale for studies included in the meta-analysis.
| Study | Selection | Comparison | Exposure | Total scores |
|---|---|---|---|---|
| Chapple et al. [5] | ∗ ∗ ∗ ∗ | ∗ ∗ | ∗ ∗ | 8 |
| Brock et al. [6] | ∗ ∗ ∗ ∗ | ∗ ∗ | ∗ ∗ ∗ | 9 |
| Baltacıoğlu et al. [7] | ∗ ∗ ∗ ∗ | ∗ ∗ | ∗ ∗ | 8 |
| Chapple et al. [8] | ∗ ∗ ∗ ∗ | ∗ ∗ | ∗ ∗ ∗ | 9 |
| Akalın et al. [9] | ∗ ∗ ∗ ∗ | ∗ ∗ | ∗ ∗ | 8 |
| Konopka [10] | ∗ ∗ ∗ ∗ | ∗ ∗ | ∗ ∗ | 8 |
| Guentch et al. [11] | ∗ ∗ ∗ ∗ | ∗ ∗ | ∗ ∗ ∗ | 9 |
| Akalın et al. [12] | ∗ ∗ ∗ ∗ | ∗ ∗ | ∗ ∗ | 8 |
| Su et al. [13] | ∗ ∗ ∗ ∗ | ∗ ∗ | ∗ ∗ | 8 |
| Kim et al. [14] | ∗ ∗ ∗ ∗ | ∗ ∗ | ∗ ∗ ∗ | 9 |
| Sulaiman and Shehadeh [15] | ∗ ∗ ∗ ∗ | ∗ ∗ | ∗ ∗ ∗ | 9 |
| Wei et al. [16] | ∗ ∗ ∗ ∗ | ∗ ∗ | ∗ ∗ | 8 |
| Dhotre et al. [17] | ∗ ∗ ∗ ∗ | ∗ ∗ | ∗ ∗ | 8 |
| Dhotre et al. [18] | ∗ ∗ ∗ ∗ | ∗ ∗ | ∗ ∗ | 8 |
| Esen et al. [19] | ∗ ∗ ∗ ∗ | ∗ ∗ | ∗ ∗ | 8 |
| Konuganti et al. [20] | ∗ ∗ ∗ ∗ | ∗ ∗ | ∗ | 7 |
| Toker et al. [21] | ∗ ∗ ∗ ∗ | ∗ ∗ | ∗ ∗ | 8 |
| Akpinar et al. [22] | ∗ ∗ ∗ ∗ | ∗ ∗ | ∗ ∗ | 8 |
| Novakovic et al. [23] | ∗ ∗ ∗ ∗ | ∗ ∗ | ∗ ∗ | 8 |
| Sezer et al. [24] | ∗ ∗ ∗ ∗ | ∗ ∗ | ∗ ∗ | 8 |
| Azizi et al. [25] | ∗ ∗ ∗ ∗ | ∗ ∗ | ∗ ∗ | 8 |
| Baltacıoğlu et al. [26] | ∗ ∗ ∗ ∗ | ∗ ∗ | ∗ ∗ | 8 |
| Bostanci et al. [27] | ∗ ∗ ∗ ∗ | ∗ ∗ | ∗ ∗ ∗ | 9 |
| Kose et al. [28] | ∗ ∗ ∗ ∗ | ∗ ∗ | ∗ ∗ ∗ | 9 |
| Miricescu et al. [29] | ∗ ∗ ∗ ∗ | ∗ ∗ | ∗ ∗ | 8 |
| Shirzaiy et al. [30] | ∗ ∗ ∗ ∗ | ∗ ∗ | ∗ ∗ | 8 |
| Thomas et al. [31] | ∗ ∗ ∗ ∗ | ∗ ∗ | ∗ ∗ ∗ | 9 |
| Almerich-Silla et al. [32] | ∗ ∗ ∗ ∗ | ∗ | ∗ | 6 |
| Baser et al. [33] | ∗ ∗ ∗ ∗ | ∗ ∗ | ∗ ∗ | 8 |
| Shankarram et al. [34] | ∗ ∗ ∗ ∗ | ∗ ∗ | ∗ | 7 |
| Nguyen et al. [35] | ∗ ∗ ∗ ∗ | ∗ ∗ | ∗ ∗ | 8 |
| Atabay et al. [36] | ∗ ∗ ∗ ∗ | ∗ ∗ | ∗ ∗ ∗ | 9 |
| Bansel et al. [37] | ∗ ∗ ∗ ∗ | ∗ ∗ | ∗ ∗ | 8 |
| Ahmadi-Motamayel et al. [38] | ∗ ∗ ∗ ∗ | ∗ ∗ | ∗ ∗ | 8 |
| Punj et al. [39] | ∗ ∗ ∗ ∗ | ∗ ∗ | ∗ ∗ | 8 |
| Narendra et al. [40] | ∗ ∗ ∗ ∗ | ∗ ∗ | ∗ ∗ | 8 |
| Verma et al. [41] | ∗ ∗ ∗ ∗ | ∗ ∗ | ∗ ∗ | 8 |
| Vincent et al. [42] | ∗ ∗ ∗ ∗ | ∗ ∗ | ∗ ∗ | 8 |
| Sánchez-Villamil et al. [43] | ∗ ∗ ∗ ∗ | ∗ ∗ | ∗ ∗ | 8 |
| Senouci et al. [44] | ∗ ∗ ∗ ∗ | ∗ ∗ | ∗ ∗ | 8 |
| Thomas et al. [45] | ∗ ∗ ∗ ∗ | ∗ | ∗ | 6 |
| Verghese et al. [46] | ∗ ∗ ∗ ∗ | ∗ ∗ | ∗ ∗ ∗ | 9 |
Table 2.
The mean values of TOS in various biological fluid samples between healthy controls and patients with periodontitis in the included studies of quantitative synthesis.
| Study name | Country | Study design | Criteria | Age years case/control mean ± SD or range | Sample type | Unit of measurement | Periodontitis | Control | p-Value | ||
|---|---|---|---|---|---|---|---|---|---|---|---|
| Mean ± SD or median (upper–lower value) | Sample size (M/F) | Mean ± SD median (upper– lower value) | Sample size (M/F) | ||||||||
| Akalın et al. [9] | Turkey | CC | Armitage [47] | 40.66 ± 5.31/38.5 ± 6.10 | Serum | µmol | 22.5 ± 17.21 | 36 (19/17) | 13.77 ± 2.381 | 28 (13/15) | <0.05 |
| Saliva | µmol | 6.03 ± 1.37 | 4.16 ± 0.63 | <0.05 | |||||||
| GCF | µmol | 39.2 ± 5.95 | 31.4 ± 5.54 | <0.05 | |||||||
| Wei et al. [16] | China | PS | Armitage [47] | 40.1 ± 7.3/42.1 ± 7.7 | Serum | mmol | 24.8 ± 18.53 | 48 (27/21) | 19.21 ± 16.246 | 35 (19/16) | <0.05 |
| Saliva | mmol | 9.12 ± 1.77 | 6.75 ± 1.02 | <0.05 | |||||||
| GCF | mmol | 50.9 ± 6.33 | 42.76 ± 7.94 | <0.05 | |||||||
| Esen et al. [19] | Turkey | CS | AL ≥ 4 mm and PPD ≥ 5 mm | 42.85 ± 9.6/40.05 ± 9.8 | Serum | µmol H2O2 equiv./l | 7.115 (4.920– 8.055) | 20 (4/16) | 6.935 (5.655– 8.755) | 20 (4/16) | 0.920 |
| GCF | 0.285 (0.070–0.360) | 0.010 (0.010– 0.415) | 0.030 | ||||||||
| Toker et al. [21] | Turkey | Interventional study | CAL > 30% of sites; PPD ≥ 5 mm | 38.7 ± 5.9/38.0 ± 7.2 | GCF | µmol H2O2 Eq/l | 10.06 ± 0.22 | 15 (7/8) | 10.4 ± 0.48 | 10 (6/4) | <0.05 |
| Akpinar [22] | Turkey | Interventional | Armitage [47] | 37.7 ± 5.9/37.0 ± 7.4 | GCF | µmol H2O2 equiv./l | (9.4–10.7) 10 | 15 (7/8) | (9.7–11.3) 10.6 | 10 (5/5) | |
| Sezer [24] | Turkey | CS | – | 45.50 ± 7.50/40.75 ± 10.26 | Serum | µmol H2O2 Eq/l | 19.48 ± 7.91 | 20 (6/14) | 21.47 ± 7.39 | 20 (6/14) | |
| Baltacıoğlu et al. [26] | Turkey | CS and CC | Armitage [47] | 32.55 ± 5.32/30.10 ± 4.06 | Serum | µmol | 16.8 ± 2.467 | 33 (16/17) | 13.77 ± 0.567 | 30 (16/14) | <0.05 |
| Saliva | µmol | 6.27 ± 0.844 | 4.167 ± 0.444 | <0.05 | |||||||
| GCF | µmol H2O2 Eq/l | 27.5 ± 4.96 | 30 | 19.75 ± 3.46 | 28 | <0.05 | |||||
| Bostanci [27] | Turkey | Interventional studies | Armitage [47] | 38.80 ± 4.87/37.33 ± 5.67 | GCF | µmol H2O2 Eq/l | 9.74 (8.75–12.25) | 15 (6/9) | 5.25(4.05–7.72) | 15 (7/8) | <0.05 |
| Serum | 4.2 (3.25–6.85) | 3.86(2.24–5.25) | >0.05 | ||||||||
| Kose et al. [28] | Turkey | Comparative study | Armitage [47] | 27–51 years | Serum | µmol H2O2 Eq/l | 16 ± 4.01 | 22 (11/11) | 12.19 ± 2.77 | 22 (12/10) | <0.05 |
| Saliva | 6.8 ± 3.49 | 4.41 ± 1.54 | <0.05 | ||||||||
| Vincent et al. [42] | India | Comparative study | Armitage [48] | 25–65 years | GCF | µmol/l | 9.08 ± 3.7 | 20 (10/10) | 5.2 ± 1.3 | 20 (11/9) | <0.001 |
The method utilized for the assessment of TOS values in various biological samples was Erel [53]. SD, standard deviation; Cont, control; H2O2, hydrogen peroxide; Eq, equivalent; CC, case–control; PS, prospective study; CS, cross-sectional study.
Table 3.
The mean values of TAC in various biological fluid samples between healthy controls and patients with periodontitis in the included studies included in the meta-analysis.
| Author name and Year | Country | Study design | Criteria | Age years case/control mean ± SD or range | Sample type | Unit | Periodontitis | Control | p-Value | Method of assessment | ||
|---|---|---|---|---|---|---|---|---|---|---|---|---|
| Mean ± SD or median (upper–lower value) | Sample size (M/F) | Mean ± SD or median (upper–lower value) | Sample size (M/F) | |||||||||
| Chapple et al. [5] | UK | CS | Gustafsson et al. [49] | 46.1/46.9 | Plasma | µmol TEq/l | 501.8 ± 123 | 10 (5/5) | 577.9 ± 99.8 | 10 (5/5) | >0.05 | Chapple et al. [54] |
| Brock et al. [6] | UK | CC | PPD ≥ 5 mm at least two sites per quadrant, BOP, radiographic LB ≥ 30% | 43.5 (23–60) /44.7 (24–63) | Saliva | nmol/30s sample | 0.18 ± 0.08 | 17 (7/10) | 0.14 ± 0.06 | 17 (7/10) | NS | Chapple et al. [54] |
| GCF | µmol | 0.14 ± 0.06 | 0.18 ± 0.08 | <0.001 | ||||||||
| Baltacıoğlu et al. [7] | Turkey | Comparative study | Armitage [47] | 37.4 ± 5.4/37.1 ± 4.2 | Serum | mM Trolox equivalent | 0.53 ± 0.19 | 31 (F) | 0.72 ± 0.21 | 26 (F) | <0.05 | Erel [55] |
| GCF | 0.07 ± 0.03 | 0.12 ± 0.05 | ||||||||||
| GCF TAOC/30 s | 0.36 ± 0.12 | 0.50 ± 0.16 | ||||||||||
| Chapple et al. [8] | UK | Interventional | Brock et al. [6] | 32–60 | Plasma | µmol TEq | 507 ± 92 | 35 (12/23) |
520 ± 100 | 32 (N/A) | 0.57 | Chapple et al. [54] Maxwell et al. [56] |
| GCF | 680 ± 371 | 1129 ± 722 | <0.0001 | |||||||||
| Konopka et al. [10] | Poland | CC | Lindhe et al. [50] | 31.5/33.2 | Venous Blood | mmol/l | 1.68 ± 0.13 | 30 (15/15) |
1.94 ± 0.12 | 25 (10/15) |
<0.001 | ABTS reduction method |
| Gingival Blood | 1.81 ± 0.18 | 1.94 ± 0.13 | 0.029 | |||||||||
| Guentsch et al. [11] | Germany | Interventional study | At least 30% of teeth with PPD >5 mm | 46.3 ± 13.1/34.1 ± 11.8 | Saliva | μmol/ml | 0.37 ± 0.24 | 15 (6/9) |
0.52 ± 0.20 | 15 (7/8) |
<0.05 | Popov and Lewin [57] |
| Akalin et al. [12] | Turkey | CS | Armitage [47] | 29.3 ± 3.94/29.73 ± 3.71 | Serum | mM Trolox equivalent | 0.59 ± 0.20 | 27 (F) | 0.75 ± 0.21 | 25(F) | <0.005 | Erel [55] |
| GCF Conc | 0.09 ± 0.03 | 0.17 ± 0.04 | ||||||||||
| GCF TAC/30s | 0.40 ± 0.11 | 0.59 ± 0.10 | ||||||||||
| Su et al. [13] | USA | CS–CC | Scully and Langley-Evans [51] | 52.27 (14.08)/45.39 (18.75) SEM | Saliva | mmol | 0.71 ± 0.08 | 58 (25/33) |
0.46 ± 0.04 | 234 (107/126) | 0.0001 | Miller et al. [58] |
| Kim et al. [14] | Korea | Interventional study | PPD ≥ 5 mm at least two sites per quadrant, BOP, radiographic LB ≥ 30% | 50.0 ± 12.5/31.7 ± 8.0 | Saliva | μM | 335.7 ± 36.6 | 7 (3/4) | 282.7 ± 55.1 | 7 (3/4) | ImAnOx (TAS) Kit | |
| Sulaiman and Shehadeh [15] | Syria | Interventional study | PPD ≥ 5 mm at least two sites per quadrant, BOP, radiographic LB ≥ 30% | 41/34 | Plasma | µmol TEq | 559 ± 53.2 | 30 (9/21) |
625 ± 88.7 | 30 (9/21) |
<0.001 | Erel [55] |
| Dhotre et al. [17] | India | CC | Armitage [47] | 52.7 ± 9.27/50.3 ± 9.39 | Plasma | mmol/l | 1.3 ± 0.15 | 100 (60/40) |
2.32 ± 0.24 | 100 (60/40) |
<0.001 | Benzie and Strain [59] |
| Saliva | 0.46 ± 0.07 | 1.07 ± 0.03 | ||||||||||
| Dhotre et al. [18] | India | CC | Armitage [47] | 52.7 ± 9.27/50.03 ± 9.39 | Plasma | mmol/l | 1.14 ± 0.13 | 50 | 2.32 ± 0.24 | 25 | <0.001 | Benzie and Strain [59] |
| Esen et al. [19] | Turkey | CS | AL ≥ 4 mm and PPD ≥ 5 mm. | 42.85 ± 9.6/40.05 ± 9.8 | Serum | millimoles trolox equivalent per/l | 1.980 (1.835– 2.195) | 20 (4/16) | 2.510 (2.170– 2.725) | 20 (4/16) | <0.001 | Erel [55] |
| GCF | 0.0875 (0.059 to 0.140) | 0.105 (0.070– 0.145) | ||||||||||
| Konuganti et al. [20] | India | CC | PPD ≥ 5 mm at least 2 sites per quadrant, BOP | 18–40 years | Blood | µg/dl | 37.13 ± 7.14 | 15 | 52.4 ± 9.71 | 15 | <0.001 | NBT method |
| Toker et al. [21] | Turkey | Interventional study | CAL > 30% of sites; PPD ≥ 5 mm | 38.7 ± 5.9/38.0 ± 7.2 | GCF | mmol TEq/l | 0.12 ± 0.33 | 15 (7/8) | 0.13 ± 0.25 | 10 (6/4) | >0.05 | Erel [55] |
| Akpinar et al. [22] | Turkey | Interventional | Armitage [47] | 37.7 ± 5.9/37.0 ± 7.4 | GCF | mmol Trolox equiv./l | (0–0.1) 0.1 | 15 (7/8) |
(0.1–0.1) 0.1 | 10 (5/5) |
Erel [55] | |
| Novaković et al. [23] | Serbia | PS | Bone loss >30%, at least one pocket; PPD >5 mm per quadrant with BOP | 39.2 ± 11.5/35.2 ± 7.1 | Saliva | µmol/l | 0.4 ± 0.24 | 21 (14/7) |
0.59 ± 0.14 | 21 (14/7) |
>0.05 | ABTS colorimetric, Ransod kit |
| Sezer et al. [24] | Turkey | CS | – | 45.50 ± 7.50/40.75 ± 10.26 | Serum | mmol Trolox Eq/l | 1.15 ± 0.36 | 20 (6/14) |
1.30 ± 0.23 | 20 (6/14) |
Erel [55] | |
| Azizi et al. [25] | India | CC | Armitage [47] | 37–50/39.64 ± 5.04 | Plasma | μmol/l | 831.75 ± 78.15 | 134 (M) | 925.2 ± 68.4 | 64 (M) | 0.001 | Benzie and Strain [59] |
| Baltacıoğlu et al. [26] | Turkey | CS and CC | Armitage [47] | 32.55 ± 5.32/30.10 ± 4.06 | Serum | mmol TEq | 1.08 ± 0.0736 | 33 (16/17) |
1.5 ± 0.0736 | 30 (16/14) |
0.001 | ABTS Erel [55] |
| Saliva | mmol TEq | 0.5 ± 0.11 | 0.71 ± 0.08 | <0.05 | Elisa kit | |||||||
| Bostanci [27] | Turkey | Interventional studies | Armitage [47] | 38.80 ± 4.87/37.33 ± 5.67 | GCF | μmol trolox equivalent/l | 0.09 (0.07–0.11) | 15 (6/9) |
0.07 (0.05–0.15) | 15 (7/8) | >0.05 | Erel [55] |
| Serum | 1.45 (1.23–2.10) | 1.44 (1.28–1.68) | ||||||||||
| Kose et al. [28] | Turkey | Comparative study | Armitage [47] | 27–51 years | Saliva | mmol TEq/l | 0.77 ± 0.14 | 22 (11/11) | 0.92 ± 0.22 | 22 (12/10) |
<0.05 | Erel [55] |
| Serum | mmol TEq/l | 1.16 ± 0.29 | 1.34 ± 0.32 | |||||||||
| Miricescu et al. [29] | Romania | CC | At least six sites with PD ≥ 4 mm; bone loss higher than 30% and gingival inflammation | 51.26 ± 7.4/18.66 ± 2 | Saliva | nmol/mg albumin | 0.75 ± 0.16 | 25 (14/11) |
1.24 ± 0.16 | 25 (20/5) |
<0.05 | ABTS colorimetric, Ransod kit |
| Thomas et al. [31] | India | Interventional | CAL ≥ 4 mm in at least 30% of sites | 35–65 | Serum | mmol/l | 0.4972 ± 0.2250 | 25 | 1.2585 ± 0.3683 | 25 | <0.001 | – |
| Almerich-Silla et al [32] | Spain | CC | At least four zones with PP ≥ 5 mm and LA ≥ 2 mm | 41–45/38–43 | Saliva | mmol | 1.09 ± 0.0905 | 33 (19/14) |
0.9067 ± 0.119 | 37 (15/22) |
<0.001 | Elisa kit |
| Baser et al. [33] | Turkey | CC | Armitage [47] | 39.9 ± 5.2/37.3 ± 5.4 | Saliva | μmol | 0.33 ± 0.3 | 36 (11/25) |
0.57 ± 0.3 | 16 (6/10) |
<0.05 | Commercially available calorimetry |
| Plasma | μmol | 0.27 ± 0.14 | 0.44 ± 0.26 | |||||||||
| Shankarram et al. [34] | India | CC | – | – | Saliva | mmol | 1.03 ± 0.158 | 25 | 0.906 ± 0.119 | 25 | <0.01 | Elisa kit |
| Nguyen et al. [35] | Vietnam | CS | Armitage [47] | 51.04 ± 12.25/51.17 ± 11.88 | Saliva | mmol | 0.07 ± 0.07 | 24 (12/12) |
0.19 ± 0.14 | 24 (14/10) |
<0.001 | Antioxidant assay kit |
| Atabay et al. [36] | Turkey | CC | ≥ 30% of sites with PPD ≥ 5 mm; with CAL ≥ 5 mm; ≥ 30% LB | 42.47 ± 2.99/39.60 ± 5.84 | GCF Concentration | µM/ml | 72.43 ± 6.79 | 15 (9/6) | 351.60 ± 21.66 | 15 (6/9) |
0.001 | TAOC (ImAnOx-TAS)/TAC Kit |
| GCF Total | µM | 69.70 ± 3.37 | 88.01 ± 4.61 | |||||||||
| Bansel et al. [37] | India | Interventional | Armitage [47] | 20–45 | Plasma | µmol/l | 792.33 ± 124.33 | 40 | 1,076.1 ± 193.82 | 40 | <0.001 | Benzie and Strain [59] |
| Ahmadi-Motamayel et al. [38] | Iran | CC | Page and Eke [52] | 30–50 (Both groups) | Saliva | mol/ml unit | 0.16 ± 0.09 | 55 (28/27) |
0.18 ± 0.1 | 56 (28/28) |
0.11 | Riviere and Papagiannoulis [60] |
| Serum | mol/ml unit | 0.36 ± 0.01 | 0.37 ± 0.05 | |||||||||
| Punj et al. [39] | India | Comparative study | Armitage [48] | 25–65 (Both groups) | Saliva | mmol/l | 0.44 ± 0.14 | 20 | 0.48 ± 0.18 | 20 | >0.05 | Phosphomolybdenum method |
| Serum | mmol/l | 0.58 ± 0.13 | 0.94 ± 0.36 | <0.001 | ||||||||
| Narendra et al. [40] | India | CC | Armitage [47] | 47.13 ± 7.00/36.56 ± 6.26 | Serum | mmol/l | 0.49 ± 0.075 | 46 (29/17) |
1.23 ± 0.22 | 50 (33/17) |
<0.001 | Miller et al. [58] |
| GCF | mmol/l | 0.655 ± 0.16 | 1.36 ± 0.11 | |||||||||
| Tripathi et al. [41] | India | CC | Armitage [47] | > 18 years | Saliva | mM Trolox equivalent | 0.60 | 40 | 0.78 | 40 | 0.04 | ELISA |
| Serum | 1.10 | 1.50 | 0.03 | |||||||||
| Vincent et al. [42] | India | Comparative study | Armitage [48] | 25–65 years | GCF | mmol/l | 0.75 ± 0.24 | 20 | 1.2 ± 0.41 | 20 | 0.001 | Erel [55] |
| Sánchez-Villamil et al. [43] | Colombia | CS and CC | Page and Eke [52] | 45 ± 12/31 ± 10 | Saliva | mmol | 0.32 ± 0.21 | 87 (45/42) |
0.15 ± 0.1 | 14 (6/8) |
0.004 | TAC assay kit (CS0790—Sigma- Aldrich) |
| Senouci et al. [44] | Algeria | CC | PPD ≥ 6 mm; with CAL ≥ 5 mm; Tooth loss due to periodontitis | 24.06 ± 6.09/24.73 ± 1.38 | Saliva | μmol ascorbic acid eq/l | 0.46 ± 0.34 | 29 | 1.45 ± 0.57 | 28 | <0.0001 | Kerboua et al. [61] |
| Thomas et al. [45] | India | RCT | 30–60 (Both) |
Serum | µg/ml | 0.5865 ± 0.1701 | 100 | 1.1028 ± 0.2600 | 100 | <0.001 | Phosphomolybdenum assay | |
| Verghese et al. [46] | India | LS | Minimum 20 natural teeth; PPD at least 30% of sites; CAL >3 mm; bone loss | 30–60 (Both) |
Serum | 0.56 ± 0.04 | 25 | 1.92 ± 0.10 | 25 | <0.001 | Phosphomolybdenum assay | |
SD, standard deviation; Cont, control; TEq, Trolox equivalent; ABTS, 2,2′-azinobis (3-ethylbenzothiazoline-6-sulfonic acid) FRAP, ferric reducing antioxidant power; TAC, total antioxidant capacity; PPD, periodontal pocket depth; BOP, bleeding on probing; LB, loss of bone; CAL, clinical attachment level; CC, case–control; PS, prospective study; CS, cross-sectional study; RCT, randomized controlled trial; LS, longitudinal study.
Table 4.
The pre and posttreatment mean values of TAC in various biological fluid samples in patients with periodontitis in the included studies of quantitative synthesis.
| Study name | Unit | Sample type | Periodontitis (pretreatment) | Periodontitis (posttreatment) | p-Value | ||
|---|---|---|---|---|---|---|---|
| Mean ± SD or median (upper–lower value) | Sample size | Mean ± SD or median (upper–lower value) | Sample size | ||||
| Chapple et al. [8] | μMTeq | Plasma | 483 ± 111 | 35 | 489 ± 119 | 32 | 0.56 |
| GCF | 632 ± 343 | 1,015 ± 549 | 0.001 | ||||
| Guentsch et al. [11] | μmol/ml | Saliva | 0.37 ± 0.24 | 15 | 0.44 ± 0.22 | 15 | <0.05 |
| Kim et al. [14] | μM | Saliva | 335.7 ± 36.6 | 7 | 326.8 ± 53.2 | 7 | >0.05 |
| Akpinar et al. [22] | mmol Trolox equiv./L | GCF | 0.1 (0–0.1) | 15 | 0.1 (0–0.1) | 15 | <0.05 |
| Novaković et al. [23] | µmol/l | Saliva | 0.4 ± 0.24 | 21 | 0.66 ± 0.35 | 21 | <0.01 |
| Bostanci et al. [27] | μmol Trolox equivalent/l | Serum | 0.09 (0.07–0.11) | 15 | 1.65 (1.55–2.62) | 15 | <0.05 |
| GCF | 1.45 (1.23–2.10) | 0.05 (0.04–0.09) | |||||
| Shirzaiy et al. [30] | µmol/l | Saliva | 0.655 ± 0.281 | 31 | 0.962 ± 0.287 | 31 | <0.001 |
| Thomas et al. [31] | mmol/l | Serum | 0.497 ± 0.225 | 25 | 0.957 ± 0.188 | 25 | ≤0.001 |
| Bansal [37] | µmol/l | Plasma | 792.33 ± 124.33 | 40 | 989.75 ± 96.80 | 40 | <0.001 |
| Verghese et al. [46] | Serum | 0.56 ± 0.04 | 25 | 1.58 ± 0.05 | 25 | <0.001 | |
The treatment performed was non-surgical therapy (NST). SD, standard deviation.
Selection—Case definition, case selection, control definition, and selection.
Comparability—Consideration of matching known and potential confounding factors.
Exposure—Securing patient records, interviewer blindness to groups, similarity ascertainment between groups, and nonresponse rate.
Each criterion was awarded with one star. The overall score was determined by summing the awarded stars. Studies receiving scores in the range of 6–9 were categorized as high-quality, those scoring between 3 and 5 were classified as fair-quality, and studies with scores ranging from 0 to 2 were deemed to be of poor quality. Importantly, it's worth noting that all the studies analyzed received scores exceeding 6, indicating a minimal risk of bias.
The periodontitis group displayed significantly elevated TOS levels (p < 0.05) in serum, gingival crevicular fluid (GCF), and saliva samples in the studies evaluated. In contrast, the periodontitis group exhibited significantly attenuated TAC levels (p < 0.01) compared to healthy controls in serum, plasma, and GCF samples of the studies evaluated, which was insignificant in salivary samples (p=0.433). At the same time, the periodontitis group displayed insignificantly elevated TAC levels after periodontal therapy (p=0.130).
The GCF samples showed an overall standard mean difference TOS value of 1.011 µmol H2O2 equivalent (Eq)/l with 95% CI (0.262–1.760) (Figure 2). The salivary samples displayed an overall standard mean difference TOS value of 1.784 µmol H2O2 Eq/l with 95% CI (1.003–2.565) (Figure 3). The serum samples depicted an overall standard mean difference TOS value of 0.694 µmol H2O2 Eq/l with 95% CI (0.092–1.297) (Figure 4).
Figure 2.

The forest plot shows standard mean difference estimates with 95% confidence intervals representing differences in GCF levels of TOS between the patients with periodontitis and healthy controls.
Figure 3.
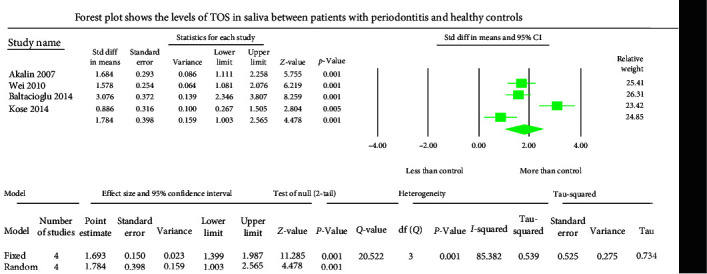
The forest plot depicts standard mean difference estimates with 95% confidence intervals representing differences in salivary levels of TOS between patients with periodontitis and healthy controls.
Figure 4.
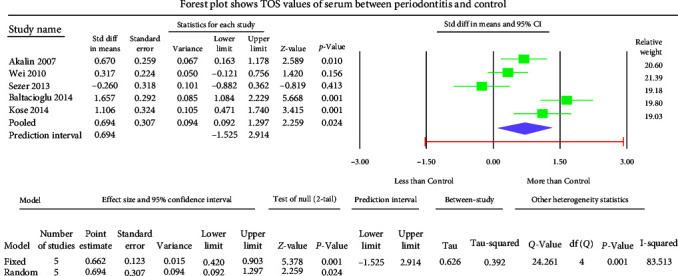
The forest plot displays standard mean difference estimates with 95% confidence intervals representing differences in serum levels of TOS between patients with periodontitis and healthy controls.
The GCF samples showed an overall mean difference TAC value of −2.004 mmol Trolox equivalent (TEq)/l with 95% CI (−3.490 to −0.517) (Figure 5). The salivary samples displayed an overall standard mean difference TAC value of −0.709 mmol TEq/l with 95% CI (−2.481 to 1.063) (Figure 6). The serum samples showed an overall standard mean difference TAC value of −2.049 mmol TEq/l with 95% CI (−3.018 to −1.079) (Figure 7). The plasma samples showed an overall standard mean difference TAC value of −0.959 µmol TEq/l with 95% CI (−1.504 to −0.415) (Figure 8). The overall standard mean difference TAC value pre and posttherapy is 0.666 µmol TEq/l with 95% CI (−0.196 to 1.528) (Figure 9).
Figure 5.
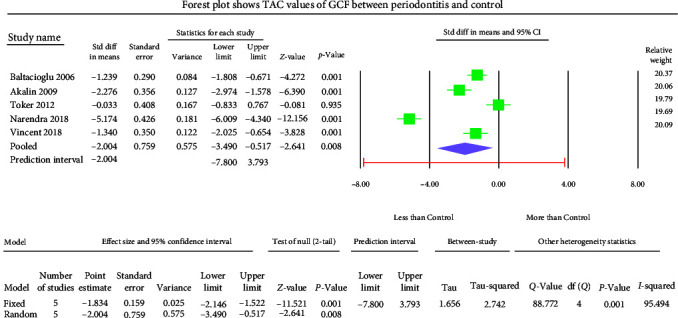
The forest plot shows standard mean difference values of TAC in GCF samples with 95% confidence intervals between patients with the periodontitis group and healthy controls.
Figure 6.
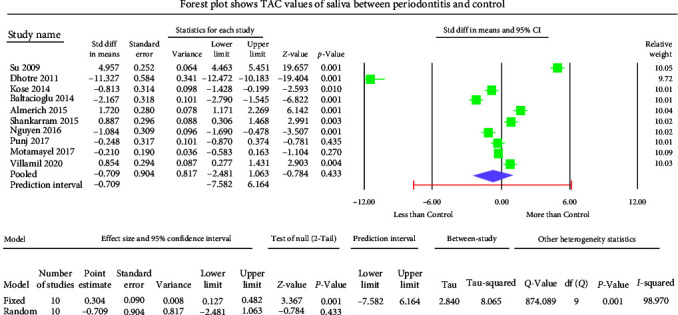
The forest plot shows salivary TAC standard mean difference values with 95% confidence intervals between patients with the periodontitis group and healthy controls.
Figure 7.

The forest plot shows serum TAC standard mean difference values with 95% confidence intervals between patients with periodontitis and healthy controls.
Figure 8.

The forest plot shows plasma TAC standard mean difference values with 95% confidence intervals between patients with periodontitis and healthy controls.
Figure 9.
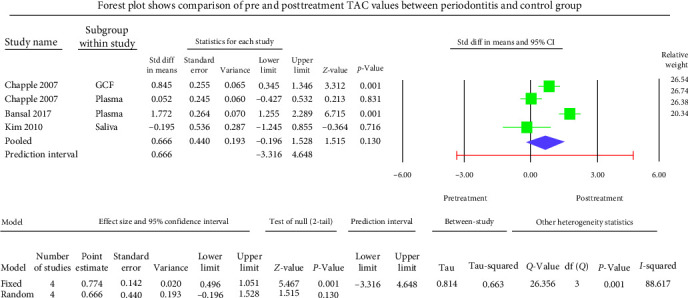
Meta-analysis of TAC levels between before and after treatment of periodontitis group.
The meta-analysis of the TOS assessment presented high heterogeneity, reflected by the I2 values 87.256, 85.382, and 83.513 in Figure 2–4, respectively. The meta-analysis of the TAC assessment presented high heterogeneity, reflected by the I2 values 95.494, 98.970, 94.749, 82.757, and 88.617 in Figure 5, Figure 6, Figure 7, Figure 8, and Figure 9, respectively. The different methodologies utilized to measure TOS and TAC values could cause high heterogeneity.
3.1. Publication Bias
Studies included in this assessment of TOS in periodontitis meta-analysis showed Egger's regression intercept values 9.162, −6.856, 3.689 with two-tailed p-values 0.45, 0.45, and 0.701 in saliva, GCF, and serum samples, respectively, indicating a low risk of publication bias of included studies in meta-analysis. Studies included in this assessment of TAC in periodontitis meta-analysis showed Egger's regression intercept values −12.79, 1.895, −23.06 with two-tailed p-values 0.48, 0.67, and 0.07 in GCF, plasma, and saliva samples, respectively, denoting a lower risk of publication bias of included studies in meta-analysis. Studies included in this assessment of serum TAC in periodontitis meta-analysis showed Kendall's S statistic (P–Q) value of −20.0 with two-tailed p-values of 0.051 (Begg and Mazumdar's test for rank correlation), denoting a moderate risk of publication bias of included studies in the salivary assessment of TAC meta-analysis. The studies included the posttherapy TAC assessment in periodontitis meta-analysis showed Eggers regression intercept value of −2.67 with a two-tailed p-value of 0.73, indicating a low risk of publication bias of included studies in meta-analysis.
4. Discussion
Despite the increasing knowledge of the etiopathogenesis of inflammatory periodontal diseases, there are no definitive indicators for objectivizing the diagnosis, determining the disease's severity, and evaluating treatment results. Hence, the present meta-analysis assessed the literature evaluated the oxidative stress markers such as TOS and TAC levels in the blood, GCF, and both stimulated and nonstimulated saliva in patients with periodontitis to find the validity of these markers in determining the diagnosis and prognosis of periodontitis as well as the treatment effects. In the present meta-analysis, Out of 10 studies of TOS assessment in serum, GCF, and saliva involving 260 patients in the study group and 212 in the control group, seven studies proved a significantly higher TOS in patients with periodontitis [9, 16, 19, 26–28, 42]. They also reported a strong correlation of TOS with the clinical parameters of periodontitis [12, 16]. This fact is unsurprising since the stimulated saliva secreted by the parotid gland is the primary source of free radicals (ROS) [62, 63]. However, Zhang et al. [64] showed no difference in the salivary TOS levels between periodontitis and healthy controls. Further, they found that a high bacterial load did not depict any correlation with salivary TOS values [64]. Toczewska et al. [65] found a weak correlation of TOS values with clinical periodontal parameters. These differences might be due to the selection criteria of patients in different studies. Since other factors related to subjects such as age, smoking, gender, and nutrition would yield distinct effects on the alteration of OS parameters; thus, it is essential to consider these factors when considering this parameter as a potential marker of periodontitis. Therefore, patient selection could be a crucial parameter influencing salivary levels of TOS.
The present meta-analysis of the evaluated studies displayed significantly elevated TOS levels (p < 0.05) in GCF, saliva, and serum samples of the periodontitis group with the overall standardized mean difference value of 1.011, 1.784, and 0.694 µmol H2O2 Eq/l, respectively.
Out of 39 studies of TAC assessment in plasma, serum, GCF, and saliva, involving 1,418 patients in the study group and 1,340 in the control group, except 11 studies, the remaining 31 studies proved a significant decrease in the TAC in patients with periodontitis when compared to the clinically healthy periodontium [5, 6, 8, 14, 21–24, 27, 38, 39]. Chapple et al. [8] reported that GCF/salivary TAC values were significantly higher in patients with periodontitis than in the control group. The authors attributed that the initial increase in antioxidant response in periodontitis is due to local reactive or adaptive response to a first phase increase of oxidative burst (OS) occurring with periodontal inflammation. The adaptive antioxidant defense might decrease over time as ROS production becomes chronic. The excess utilization of antioxidants to neutralize the exaggerated ROS activity during periodontal inflammation results in the depletion of TAC levels in participants with periodontitis. The facts mentioned above might account for the different results reported in the various studies evaluating TAC levels in patients with periodontitis. Wei et al. [16] and Baltacıoğlu et al. [26] found significant correlations between salivary/serum TOS levels and clinical parameters of periodontitis (plaque index, gingival index, probing depth, and clinical attachment level). Baser et al. [33] and Zhang et al. [64] studies depicted plasma and salivary TAC values correlated with clinical periodontal parameters. Zhang et al. [64] further found that a high bacterial load did not exhibit any correlation with salivary TAC levels. Their study carried out a multifactorial analysis, and they depicted that out of many factors, the diagnosis of periodontitis was significantly related to TAC salivary values only regardless of other variables such as age, gender, smoking habits, or presence of periodontal pathogens in saliva. They also found a significant inverse relationship between salivary TAC and the clinical attachment level of periodontitis [64]. Toczewska et al. [65] research found a significant reduction of GCF total antioxidant activity in periodontal pockets compared to other gingival regions, and the extent of this reduction did not correlate with the different stages of periodontitis and weakly correlated with clinical periodontal parameters. Becerik et al. [66] stated that a significant decrease in the GCF antioxidant capacity (ferric reducing antioxidant power) in patients with periodontitis also displayed an inverse correlation with the clinical parameters of periodontitis, such as the clinical attachment level and pocket depth. Some previous studies demonstrated that reduced salivary TAC values correlated with increased inflammatory burden in periodontitis [11, 67, 68]. The three included studies of the present meta-analysis showed that periodontal therapy significantly improved salivary and serum TAC values in patients with periodontitis. It is also suggested that shifting the salivary/GCF redox balance in favor of the oxidative reactions (↓TAC, ↑TOS) predisposes to oxidative damage to proteins, lipids, and DNA in the periodontal tissue, which leads to progressive degradation of the periodontal attachment apparatus [4, 69]. Su et al. [13] and Panjamurthy et al. [70] reported higher serum, GCF, and salivary TAC values in periodontitis participants. However, some studies also showed that salivary TAC increases or remains at the same level in periodontitis patients compared to healthy controls [6, 32, 71]. Another study reported that neither gingivitis nor smoking habits influence salivary TAC values [72]. The variations in the results of TAC between different studies could be due to different analytical methods utilized in assessing TAC values.
The present meta-analysis of the evaluated studies exhibited significantly attenuated TAC levels (p < 0.01) in the periodontitis group compared to healthy controls in GCF, serum, and plasma samples, which was insignificant in salivary samples (p=0.433). The overall mean difference of TAC value in GCF, salivary, serum, and plasma samples were −2.004, −0.709, −2.049, and −0.959 µmol TEq/l.
At the same time, the periodontitis group displayed insignificantly (p=0.130) elevated TAC levels after periodontal therapy. The overall standard mean difference TAC value upon comparison of pre and posttherapy was 0.666 µmol TEq/l.
Although high heterogeneity was detected among included studies of the present meta-analysis, our results still indicate that periodontitis has statistically correlated with some local OS biomarkers, and oxidative stress played a critical role in the pathological process of periodontitis. Thus, TOS and TAC may be helpful and practical biomarkers for evaluating oxidative injury in periodontal tissues.
5. Conclusions
In conclusion, the present meta-analysis supports the rationale that there is a direct link between periodontitis and OS-related biomarkers in the local site. The imbalance of ROS and antioxidant systems may contribute to functional and structural remodeling that favors the occurrence of periodontitis. Furthermore, these two measurements can potentially evaluate the interaction between periodontal and systemic status and the effectiveness of periodontal treatment. Considering the above facts, it may be speculated that oxidative stress is an essential factor in periodontitis. Studying the antioxidant defense mechanisms may be regarded as a valuable biomarker that will help better understand the underlying pathology of tissue damage and novel therapeutic interventional strategies. Therefore, it is necessary to conduct further research on a larger number of patients with periodontitis to understand the oxidative stress and antioxidant status imbalance reported in patients with periodontitis.
Abbreviations
- TOS:
Total oxidative stress
- TAC:
Total anti-oxidant capacity
- OS:
Oxidative stress
- NS:
Nitrative stress
- CI:
Confidence interval
- GCF:
Gingival crevicular fluid
- ROS:
Reactive oxygen species
- PI:
Plaque index
- GI:
Gingival index
- PPD:
Periodontal probing depth
- PD:
Probing depth
- BOP:
Bleeding on probing
- CAL:
Clinical attachment level
- LB:
Loss of bone
- FRAP:
Ferric reducing antioxidant power
- ABTS:
2,2′-azinobis-(3-ethylbenzothiazoline-6-sulfonate)
- Eq:
Equivalent
- TEq:
Trolox equivalent
- CC:
Case–control
- CS:
Cross-sectional
- PS:
Prospective study
- LS:
Longitudinal study
- RCT:
Randomized controlled trial.
Contributor Information
Khadijah Mohideen, Email: dr.khadijahm@gmail.com.
Snehashish Ghosh, Email: drsnehashishop@gmail.com.
Data Availability
Data analyzed in this study were a reanalysis of existing data, which are openly available at locations cited in the reference section.
Additional Points
Limitations. The chronic exposure of the oral cavity to many environmental factors destabilizes the local redox homeostasis. It reduces the diagnostic usefulness of redox biomarkers in periodontal diseases. Furthermore, due to a lack of redox salivary/GCF biomarkers reference values for assessment, it is difficult to compare the values obtained from different studies. In addition, the resultant differences might be due to the different patient selection criteria in reported studies. The attributed factors such as age, gender, smoking, and nutrition status would yield distinct effects on the alteration of OS parameters; thus, it is essential to consider these factors when considering OS as a potential marker of periodontitis.
Conflicts of Interest
The authors declare that they have no conflicts of interest.
Authors' Contributions
All the authors have equally contributed and been included in the present study.
References
- 1.Mohideen K., Sudhakar U., Balakrishnan T., et al. Malondialdehyde, an oxidative stress marker in oral squamous cell carcinoma—a systematic review and meta-analysis. Current Issues in Molecular Biology . 2021;43(2):1019–1035. doi: 10.3390/cimb43020072. [DOI] [PMC free article] [PubMed] [Google Scholar]
- 2.Toczewska J., Konopka T., Zalewska A., Maciejczyk M. Nitrosative stress biomarkers in the non-stimulated and stimulated saliva, as well as gingival crevicular fluid of patients with periodontitis: review and clinical study. Antioxidants . 2020;9(3) doi: 10.3390/antiox9030259.259 [DOI] [PMC free article] [PubMed] [Google Scholar]
- 3.Konkel J. E., O’Boyle C., Krishnan S. Distal consequences of oral inflammation. Frontiers in Immunology . 2019;10 doi: 10.3389/fimmu.2019.01403.1403 [DOI] [PMC free article] [PubMed] [Google Scholar]
- 4.Kimura S., Yonemura T., Kaya H. Increased oxidative product formation by peripheral blood polymorphonuclear leukocytes in human periodontal diseases. Journal of Periodontal Research . 1993;28(3):197–203. doi: 10.1111/j.1600-0765.1993.tb01069.x. [DOI] [PubMed] [Google Scholar]
- 5.Chapple I. L., Brock G., Eftimiadi C., Matthews J. B. Glutathione in gingival crevicular fluid and its relation to local antioxidant capacity in periodontal health and disease. Molecular Pathology . 2002;55(6):367–373. doi: 10.1136/mp.55.6.367. [DOI] [PMC free article] [PubMed] [Google Scholar]
- 6.Brock G. R., Butterworth C. J., Matthews J. B., Chapple I. L. C. Local and systemic total antioxidant capacity in periodontitis and health. Journal of Clinical Periodontology . 2004;31(7):515–521. doi: 10.1111/j.1600-051X.2004.00509.x. [DOI] [PubMed] [Google Scholar]
- 7.Baltacıoğlu E., Akalın F. A., Alver A., Balaban F., Ünsal M., Karabulut E. Total antioxidant capacity and superoxide dismutase activity levels in serum and gingival crevicular fluid in post-menopausal women with chronic periodontitis. Journal of Clinical Periodontology . 2006;33(6):385–392. doi: 10.1111/j.1600-051X.2006.00923.x. [DOI] [PubMed] [Google Scholar]
- 8.Chapple I. L. C., Brock G. R., Milward M. R., Ling N., Matthews J. B. Compromised GCF total antioxidant capacity in periodontitis: cause or effect? Journal of Clinical Periodontology . 2007;34(2):103–110. doi: 10.1111/j.1600-051X.2006.01029.x. [DOI] [PubMed] [Google Scholar]
- 9.Akalın F. A., Baltacıoğlu E., Alver A., Karabulut E. Lipid peroxidation levels and total oxidant status in serum, saliva and gingival crevicular fluid in patients with chronic periodontitis. Journal of Clinical Periodontology . 2007;34(7):558–565. doi: 10.1111/j.1600-051X.2007.01091.x. [DOI] [PubMed] [Google Scholar]
- 10.Konopka T., Król K., Kopeć W., Gerber H. Total antioxidant status and 8-hydroxy-2′-deoxyguanosine levels in gingival and peripheral blood of periodontitis patients. Archivum Immunologiae et Therapiae Experimentalis . 2007;55(6):417–425. doi: 10.1007/s00005-007-0047-1. [DOI] [PMC free article] [PubMed] [Google Scholar]
- 11.Guentsch A., Preshaw P. M., Bremer-Streck S., Klinger G., Glockmann E., Sigusch B. W. Lipid peroxidation and antioxidant activity in saliva of periodontitis patients: effect of smoking and periodontal treatment. Clinical Oral Investigations . 2008;12(4):345–352. doi: 10.1007/s00784-008-0202-z. [DOI] [PubMed] [Google Scholar]
- 12.Akalın F. A., Baltacıoğlu E., Alver A., Karabulut E. Total antioxidant capacity and superoxide dismutase activity levels in serum and gingival crevicular fluid in pregnant women with chronic periodontitis. Journal of Periodontology . 2009;80(3):457–467. doi: 10.1902/jop.2009.080218. [DOI] [PubMed] [Google Scholar]
- 13.Su H., Gornitsky M., Velly A. M., Yu H., Benarroch M., Schipper H. M. Salivary DNA, lipid, and protein oxidation in nonsmokers with periodontal disease. Free Radical Biology and Medicine . 2009;46(7):914–921. doi: 10.1016/j.freeradbiomed.2009.01.008. [DOI] [PubMed] [Google Scholar]
- 14.Kim S.-C., Kim O.-S., Kim O.-J., Kim Y.-J., Chung H.-J. Antioxidant profile of whole saliva after scaling and root planing in periodontal disease. Journal of Periodontal & Implant Science . 2010;40(4):164–171. doi: 10.5051/jpis.2010.40.4.164. [DOI] [PMC free article] [PubMed] [Google Scholar]
- 15.Sulaiman A. E. A., Shehadeh R. M. H. Assessment of total antioxidant capacity and the use of vitamin C in the treatment of non-smokers with chronic periodontitis. Journal of Periodontology . 2010;81(11):1547–1554. doi: 10.1902/jop.2010.100173. [DOI] [PubMed] [Google Scholar]
- 16.Wei D., Zhang X.-L., Wang Y.-Z., Yang C.-X., Chen G. Lipid peroxidation levels, total oxidant status and superoxide dismutase in serum, saliva and gingival crevicular fluid in chronic periodontitis patients before and after periodontal therapy. Australian Dental Journal . 2010;55(1):70–78. doi: 10.1111/j.1834-7819.2009.01123.x. [DOI] [PubMed] [Google Scholar]
- 17.Dhotre P. S., Suryakar A. N., Bhogade R. B. Oxidative stress in periodontitis: a critical link to cardiovascular disease. Biomedical Research . 2011;22(2):180–184. [Google Scholar]
- 18.Dhotre P. S., Suryakar A. N., Bhogade R. B. Oxidative stress in periodontitis. Electronic Journal of General Medicine . 2012;9(2):81–84. doi: 10.29333/ejgm/82469. [DOI] [Google Scholar]
- 19.Esen C., Alkan B. A., Kirnap M., Akgül O., Isikoglu S., Erel O. The effects of chronic periodontitis and rheumatoid arthritis on serum and gingival crevicular fluid total antioxidant/oxidant status and oxidative stress index. Journal of Periodontology . 2012;83(6):773–779. doi: 10.1902/jop.2011.110420. [DOI] [PubMed] [Google Scholar]
- 20.Konuganti K., Seshan H., Zope S., Silvia W. D. A comparative evaluation of whole blood total antioxidant capacity using a novel nitroblue tetrazolium reduction test in patients with periodontitis and healthy subjects: a randomized, controlled trial. Journal of Indian Society of Periodontology . 2012;16(4):620–622. doi: 10.4103/0972-124X.106937. [DOI] [PMC free article] [PubMed] [Google Scholar]
- 21.Toker H., Akpınar A., Aydın H., Poyraz O. Influence of smoking on interleukin-1beta level, oxidant status and antioxidant status in gingival crevicular fluid from chronic periodontitis patients before and after periodontal treatment. Journal of Periodontal Research . 2012;47(5):572–577. doi: 10.1111/j.1600-0765.2012.01468.x. [DOI] [PubMed] [Google Scholar]
- 22.Akpinar A., Toker H., Ozdemir H., Bostanci V., Aydin H. The effects of non-surgical periodontal therapy on oxidant and anti-oxidant status in smokers with chronic periodontitis. Archives of Oral Biology . 2013;58(6):717–723. doi: 10.1016/j.archoralbio.2012.11.009. [DOI] [PubMed] [Google Scholar]
- 23.Novakovic N., Cakic S., Todorovic T., et al. Antioxidative status of saliva before and after non-surgical periodontal treatment. Srpski arhiv za celokupno lekarstvo . 2013;141(3-4):163–168. doi: 10.2298/SARH1304163N. [DOI] [PubMed] [Google Scholar]
- 24.Sezer U., Erciyas K., Üstün K., et al. Effect of chronic periodontitis on oxidative status in patients with rheumatoid arthritis. Journal of Periodontology . 2013;84(6):785–792. doi: 10.1902/jop.2012.120179. [DOI] [PubMed] [Google Scholar]
- 25.Azizi A., Sarlati F., Parchakani A., Alirezaei S. Evaluation of whole saliva antioxidant capacity in patients with periodontal diseases. Open Journal of Stomatology . 2014;04(4):228–231. doi: 10.4236/ojst.2014.44031. [DOI] [Google Scholar]
- 26.Baltacıoğlu E., Yuva P., Aydın G., et al. Lipid peroxidation levels and total oxidant/antioxidant status in serum and saliva from patients with chronic and aggressive periodontitis. oxidative stress index: a new biomarker for periodontal disease? Journal of Periodontology . 2014;85(10):1432–1441. doi: 10.1902/jop.2014.130654. [DOI] [PubMed] [Google Scholar]
- 27.Bostanci V., Toker H., Senel S., Ozdemir H., Aydin H. Effect of chronic periodontitis on serum and gingival crevicular fluid oxidant and antioxidant status in patients with familial mediterranean fever before and after periodontal treatment. Journal of Periodontology . 2014;85(5):706–712. doi: 10.1902/jop.2013.130230. [DOI] [PubMed] [Google Scholar]
- 28.Kose O., Canakci V., Canakci C. F., et al. The effect of obesity on total antioxidant/oxidant status and oxidative stress index in patients with chronic periodontitis. Oxidants and Antioxidants in Medical Science . 2014;3(2):153–159. [Google Scholar]
- 29.Miricescu D., Totan A., Calenic B., et al. Salivary biomarkers: relationship between oxidative stress and alveolar bone loss in chronic periodontitis. Acta Odontologica Scandinavica . 2014;72(1):42–47. doi: 10.3109/00016357.2013.795659. [DOI] [PubMed] [Google Scholar]
- 30.Shirzaiy M., Ansari S. M., Dehghan J. H., Ghaeni S. H. Total anti-oxidant capacity of saliva in chronic periodontitis patients before and after periodontal treatment. Journal of Nepal Health Research Council . 2014;12(28):172–176. [PubMed] [Google Scholar]
- 31.Thomas B., Madani S. M., Prasad B. R., Kumari S. Comparative evaluation of serum antioxidant levels in periodontally diseased patients: an interventional study. Contemporary Clinical Dentistry . 2014;5(3):340–344. doi: 10.4103/0976-237X.137938. [DOI] [PMC free article] [PubMed] [Google Scholar]
- 32.Almerich-Silla J. M., Montiel-Company J. M., Pastor S., Serrano F., Puig-Silla M., Dasí F. Oxidative stress parameters in saliva and its association with periodontal disease and types of bacteria. Disease Markers . 2015;2015:7. doi: 10.1155/2015/653537.653537 [DOI] [PMC free article] [PubMed] [Google Scholar]
- 33.Baser U., Gamsiz-Isik H., Cifcibasi E., Ademoglu E., Yalcin F. Plasma and salivary total antioxidant capacity in healthy controls compared with aggressive and chronic periodontitis patients. Saudi Medical Journal . 2015;36(7):856–861. doi: 10.15537/smj.2015.7.11954. [DOI] [PMC free article] [PubMed] [Google Scholar]
- 34.Shankarram V., Narayanan L., Sudhakar U., Moses J., Selvan T., Parthiban S. Detection of oxidative stress in periodontal disease and oral cancer. Biomedical and Pharmacology Journal . 2015;8(2):725–729. doi: 10.13005/bpj. [DOI] [Google Scholar]
- 35.Nguyen T. T., Ngo L. Q., Promsudthi A., Surarit R. Salivary oxidative stress biomarkers in chronic periodontitis and acute coronary syndrome. Clinical Oral Investigations . 2017;21(7):2345–2353. doi: 10.1007/s00784-016-2029-3. [DOI] [PubMed] [Google Scholar]
- 36.Atabay V. E., Lutfioğlu M., Avci B., Sakallioglu E. E., Aydoğdu A. Obesity and oxidative stress in patients with different periodontal status: a case–control study. Journal of Periodontal Research . 2017;52(1):51–60. doi: 10.1111/jre.12368. [DOI] [PubMed] [Google Scholar]
- 37.Bansal N., Gupta N. D., Bey A., Sharma V. K., Gupta N., Trivedi H. Impact of nonsurgical periodontal therapy on total antioxidant capacity in chronic periodontitis patients. Journal of Indian Society of Periodontology . 2017;21(4):291–295. doi: 10.4103/jisp.jisp_281_15. [DOI] [PMC free article] [PubMed] [Google Scholar]
- 38.Ahmadi-Motamayel F., Goodarzi M. T., Jamshidi Z., Kebriaei R. Evaluation of salivary and serum antioxidant and oxidative stress statuses in patients with chronic periodontitis: a case–control study. Frontiers in Physiology . 2017;8 doi: 10.3389/fphys.2017.00189.189 [DOI] [PMC free article] [PubMed] [Google Scholar]
- 39.Punj A., Shenoy S., Kumari N. S., Pampani P. Estimation of antioxidant levels in saliva and serum of chronic periodontitis patients with and without ischemic heart disease. International Journal of Dentistry . 2017;2017:9. doi: 10.1155/2017/1965697.1965697 [DOI] [PMC free article] [PubMed] [Google Scholar]
- 40.Narendra S., Das U. K., Tripathy S. K., Sahani N. C. Superoxide dismutase, uric acid, total antioxidant status, and lipid peroxidation assay in chronic and aggressive periodontitis patients. The Journal of Contemporary Dental Practice . 2018;19(7):874–880. doi: 10.5005/jp-journals-10024-2350. [DOI] [PubMed] [Google Scholar]
- 41.Verma A., Tripathi V., Singh S. T., Singh C. D., Gill J. S. Assessment of lipid peroxidation levels and total antioxidant status in chronic and aggressive periodontitis patients: an in vivo study. The Journal of Contemporary Dental Practice . 2018;19(3):287–291. doi: 10.5005/jp-journals-10024-2254. [DOI] [PubMed] [Google Scholar]
- 42.Vincent R. R., Appukuttan D., Victor D. J., Balasundaram A. Oxidative stress in chronic periodontitis patients with type II diabetes mellitus. European Journal of Dentistry . 2018;12(2):225–231. doi: 10.4103/ejd.ejd_244_17. [DOI] [PMC free article] [PubMed] [Google Scholar]
- 43.Sánchez-Villamil J. P., Pino-Vélez C., Trejos-Suárez J., Cardona N., España A. L., Alfonso P. A. Salivary markers of oxidative stress and periodontal pathogens in patients with periodontitis from Santander, Colombia. Biomédica . 2020;40(Supl. 1):113–124. doi: 10.7705/biomedica.5149. [DOI] [PMC free article] [PubMed] [Google Scholar]
- 44.Senouci S., Yahia D. A., Bouziane D., Mehadj M., Malaisse W. J. The diagnostic role of salivary biomarkers of oxidative stress and inflammatory status and their relationship in periodontitis stage III and grade C. Biologia . 2021;76(5):1617–1625. doi: 10.1007/s11756-021-00714-z. [DOI] [Google Scholar]
- 45.Thomas B., Varma S., Prasad R., et al. Assessment of the antioxidant levels in sera of periodontitis patients with or without diabetes mellitus. Research Journal of Pharmacy and Technology . 2021;14(2):1025–1032. doi: 10.5958/0974-360X.2021.00183.9. [DOI] [Google Scholar]
- 46.Verghese R., Anegundi R., Thomas B., Varma S., Shenoy S., Ramesh A. Comparative evaluation of antioxidant levels in the serum of patients with periodontitis and diabetes mellitus after scaling and root planing. Romanian Journal of Diabetes Nutrition and Metabolic Diseases . 2023;30(1):55–63. [Google Scholar]
- 47.Armitage G. C. Development of a classification system for periodontal diseases and conditions. Annals of Periodontology . 1999;4(1):1–6. doi: 10.1902/annals.1999.4.1.1. [DOI] [PubMed] [Google Scholar]
- 48.Armitage G. C. Periodontal diagnoses and classification of periodontal diseases. Periodontology 2000 . 2004;34:9–21. doi: 10.1046/j.0906-6713.2002.003421.x. [DOI] [PubMed] [Google Scholar]
- 49.Gustafsson A., Asman B., Bergstrom K. Lower protein concentration in GCF from patients with periodontitis: an indicator of host-specific inflammatory reaction. Journal of Clinical Periodontology . 1995;22(3):225–228. doi: 10.1111/j.1600-051X.1995.tb00138.x. [DOI] [PubMed] [Google Scholar]
- 50.Lindhe J., Ranney R., Lamster I., et al. Consensus report: chronic periodontitis. Annals of Periodontology . 1999;4(1):38–38. doi: 10.1902/annals.1999.4.1.38. [DOI] [Google Scholar]
- 51.Sculley D. V., Langley-Evans S. C. Periodontal disease is associated with lower antioxidant capacity in whole saliva and evidence of increased protein oxidation. Clinical Science . 2003;105(2):167–172. doi: 10.1042/CS20030031. [DOI] [PubMed] [Google Scholar]
- 52.Page R. C., Eke P. I. Case definitions for use in population-based surveillance of periodontitis. Journal of Periodontology . 2007;78(7S):1387–1399. doi: 10.1902/jop.2007.060264. [DOI] [PubMed] [Google Scholar]
- 53.Erel O. A new automated colorimetric method for measuring total oxidant status. Clinical Biochemistry . 2005;38(12):1103–1111. doi: 10.1016/j.clinbiochem.2005.08.008. [DOI] [PubMed] [Google Scholar]
- 54.Chapple I. L. C., Mason G. I., Garner I., et al. Enhanced chemiluminescent assay for measuring the total antioxidant capacity of serum, saliva and crevicular fluid. Annals of Clinical Biochemistry . 1997;34(4):412–421. doi: 10.1177/000456329703400413. [DOI] [PubMed] [Google Scholar]
- 55.Erel O. A novel automated direct measurement method for total antioxidant capacity using a new generation, more stable ABTS radical cation. Clinical Biochemistry . 2004;37(4):277–285. doi: 10.1016/j.clinbiochem.2003.11.015. [DOI] [PubMed] [Google Scholar]
- 56.Maxwell S. R., Dietrich T., Chapple I. L. C. Prediction of serum total antioxidant activity from the concentration of individual serum antioxidants. Clinica Chimica Acta . 2006;372(1-2):188–194. doi: 10.1016/j.cca.2006.04.015. [DOI] [PubMed] [Google Scholar]
- 57.Popov I., Lewin G. Methods in enzymology. Methods in Enzymology . 1999;300:437–456. doi: 10.1016/S0076-6879(99)00149-4. [DOI] [PubMed] [Google Scholar]
- 58.Miller N. J., Rice-Evans C., Davies M. J., Gopinathan V., Milner A. A novel method for measuring antioxidant capacity and its application to monitoring the antioxidant status in premature neonates. Clinical Science . 1993;84(4):407–412. doi: 10.1042/cs0840407. [DOI] [PubMed] [Google Scholar]
- 59.Benzie I. F. F., Strain J. J. The ferric reducing ability of plasma (FRAP) as a measure of “antioxidant power”: the FRAP assay. Analytical Biochemistry . 1996;239(1):70–76. doi: 10.1006/abio.1996.0292. [DOI] [PubMed] [Google Scholar]
- 60.Riviere G. R., Papagiannoulis L. Antibodies to indigenous and laboratory strains of Streptococcus mutans in saliva from children with dental caries and from caries-free children. Pediatric Dentistry . 1987;9:216–220. [PubMed] [Google Scholar]
- 61.Kerboua K. E., Haiba F., Boumediene A. The plasmatic oxygen radical antioxidant capacity (ORAC) index but not the neutrophil enzyme Lcn2 level may predict high levels of serum malondialdehyde in male idiopathic infertility. Annals of Biological Research . 2015;6(12):16–24. [Google Scholar]
- 62.Zalewska A., Maciejczyk M., Szulimowska J., Imierska M., Błachnio-Zabielska A. High-fat diet affects ceramide content, disturbs mitochondrial redox balance, and induces apoptosis in the submandibular glands of mice. Biomolecules . 2019;9(12) doi: 10.3390/biom9120877.877 [DOI] [PMC free article] [PubMed] [Google Scholar]
- 63.Zalewska A., Ziembicka D., Żendzian-Piotrowska M., Maciejczyk M. The impact of high-fat diet on mitochondrial function, free radical production, and nitrosative stress in the salivary glands of wistar rats. Oxidative Medicine and Cellular Longevity . 2019;2019:15. doi: 10.1155/2019/2606120.2606120 [DOI] [PMC free article] [PubMed] [Google Scholar]
- 64.Zhang T., Andrukhov O., Haririan H., et al. Total antioxidant capacity and total oxidant status in saliva of periodontitis patients in relation to bacterial load. Frontiers in Cellular and Infection Microbiology . 2016;5 doi: 10.3389/fcimb.2015.00097.97 [DOI] [PMC free article] [PubMed] [Google Scholar]
- 65.Toczewska J., Maciejczyk M., Konopka T., Zalewska A. Total oxidant and antioxidant capacity of gingival crevicular fluid and saliva in patients with periodontitis: review and clinical study. Antioxidants . 2020;9(5) doi: 10.3390/antiox9050450.450 [DOI] [PMC free article] [PubMed] [Google Scholar]
- 66.Becerik S., Öztürk V. Ö., Celec P., Kamodyova N., Atilla G., Emingil G. Gingival crevicular fluid and plasma oxidative stress markers and TGM-2 levels in chronic periodontitis. Archives of Oral Biology . 2017;83:47–54. doi: 10.1016/j.archoralbio.2017.06.032. [DOI] [PubMed] [Google Scholar]
- 67.Diab-Ladki R., Pellat B., Chahine R. Decrease in the total antioxidant activity of saliva in patients with periodontal diseases. Clinical Oral Investigations . 2003;7(2):103–107. doi: 10.1007/s00784-003-0208-5. [DOI] [PubMed] [Google Scholar]
- 68.Abdollahi M., Mashayekhi F., Agha-hoseini F., Rezaie A., Zamani M. J., Khorasani R. Alteration of cyclic nucleotides levels and oxidative stress in saliva of human subjects with periodontitis. The Journal of Contemporary Dental Practice . 2005;6(4):46–53. doi: 10.5005/jcdp-6-4-46. [DOI] [PubMed] [Google Scholar]
- 69.Kna M., Maciejczyk M., Waszkiel D., Zalewska A. Oxidative stress and salivary antioxidants. Dental and Medical Problems . 2013;50(4):461–466. [Google Scholar]
- 70.Panjamurthy K., Manoharan S., Ramachandran C. R. Lipid peroxidation and antioxidant status in patients with periodontitis. Cellular & Molecular Biology Letters . 2005;10(2):255–264. [PubMed] [Google Scholar]
- 71.Tóthová L., Hodosy J., Mettenburg K., et al. No harmful effect of different Coca-Cola beverages after 6months of intake on rat testes. Food and Chemical Toxicology . 2013;62:343–348. doi: 10.1016/j.fct.2013.08.073. [DOI] [PubMed] [Google Scholar]
- 72.Buduneli N., Kardesşler L., Isşık H., et al. Effects of smoking and gingival inflammation on salivary antioxidant capacity. Journal of Clinical Periodontology . 2006;33(3):159–164. doi: 10.1111/j.1600-051X.2006.00892.x. [DOI] [PubMed] [Google Scholar]
Associated Data
This section collects any data citations, data availability statements, or supplementary materials included in this article.
Data Availability Statement
Data analyzed in this study were a reanalysis of existing data, which are openly available at locations cited in the reference section.