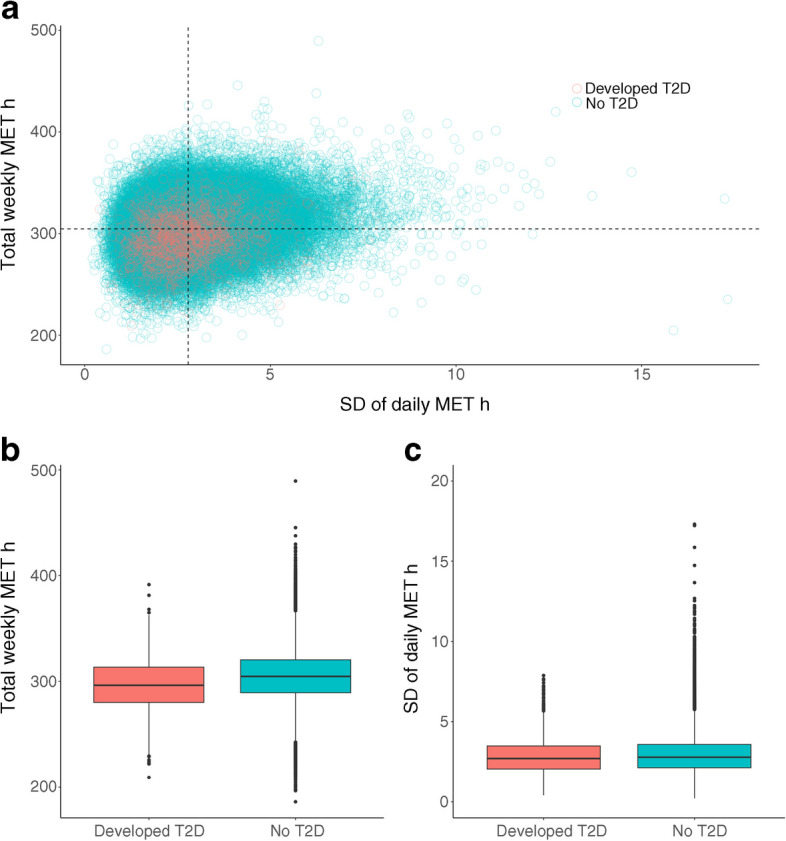
Fig. 2.

Distribution of within-person daily MET h SD and total weekly MET h for participants who developed type 2 diabetes (n=1657) and did not develop type 2 diabetes (n=91,438). (a) Scatter plot of total weekly MET h vs SD of daily MET h for the two groups. (b) Box plots showing the distribution of total weekly MET h for the two groups. (c) Box plots showing the distribution of daily MET h SD for the two groups. In the box plots, horizontal lines depict the IQR and median (25th, 50th and 75th percentile). The whiskers represent the min. and max. values and the dots represent outliers. T2D, type 2 diabetes
