

Abstract
Overexpression of the antiapoptotic protein B-cell lymphoma 2 (Bcl-2) is correlated with poor survival outcomes in triple-negative breast cancer (TNBC), making Bcl-2 inhibition a promising strategy to treat this aggressive disease. Unfortunately, Bcl-2 inhibitors developed to date have limited clinical success against solid tumors, owing to poor bioavailability, insufficient tumor delivery, and off-target toxicity. To circumvent these problems, we loaded the Bcl-2 inhibitor ABT-737 in poly(lactic-co-glycolic acid) (PLGA) nanoparticles (NPs) that were wrapped with phospholipid membranes derived from 4T1 murine mammary cancer cells, which mimic the growth and metastasis of human TNBC. We show that the biomimetic cancer cell membrane coating enabled the NPs to preferentially target 4T1 TNBC cells over noncancerous mammary epithelial cells in vitro and significantly increased NP accumulation in orthotopic 4T1 tumors in mice after intravenous injection by over 2-fold compared to poly(ethylene glycol)–poly(lactide-co-glycolic) (PEG–PLGA) copolymer NPs. Congruently, the ABT-737 loaded, cancer cell membrane-wrapped PLGA NPs (ABT CCNPs) induced higher levels of apoptosis in TNBC cells in vitro than ABT-737 delivered freely or in PEG–PLGA NPs. When tested in a syngeneic spontaneous metastasis model, the ABT CCNPs significantly increased apoptosis (evidenced by elevated active caspase-3 and decreased Bcl-2 staining) and decreased proliferation (denoted by reduced Ki67 staining) throughout tumors compared with saline or ABT-loaded PEG–PLGA NP controls. Moreover, the ABT CCNPs did not alter animal weight or blood composition, suggesting that the specificity afforded by the TNBC cell membrane coating mitigated the off-target adverse effects typically associated with ABT-737. Despite these promising results, the low dose of ABT CCNPs administered only modestly reduced primary tumor growth and metastatic nodule formation in the lungs relative to controls. We posit that increasing the dose of ABT CCNPs, altering the treatment schedule, or encapsulating a more potent Bcl-2 inhibitor may yield more robust effects on tumor growth and metastasis. With further development, drug-loaded biomimetic NPs may safely treat solid tumors such as TNBC that are characterized by Bcl-2 overexpression.
Keywords: nanomedicine, biomimicry, oncology, targeted chemotherapy, ABT-737, metastasis, membrane-wrapped
Graphical Abstract
INTRODUCTION
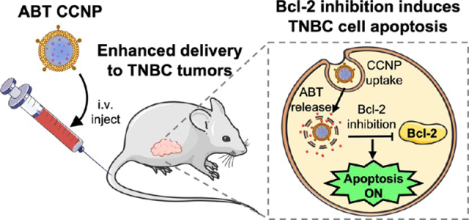
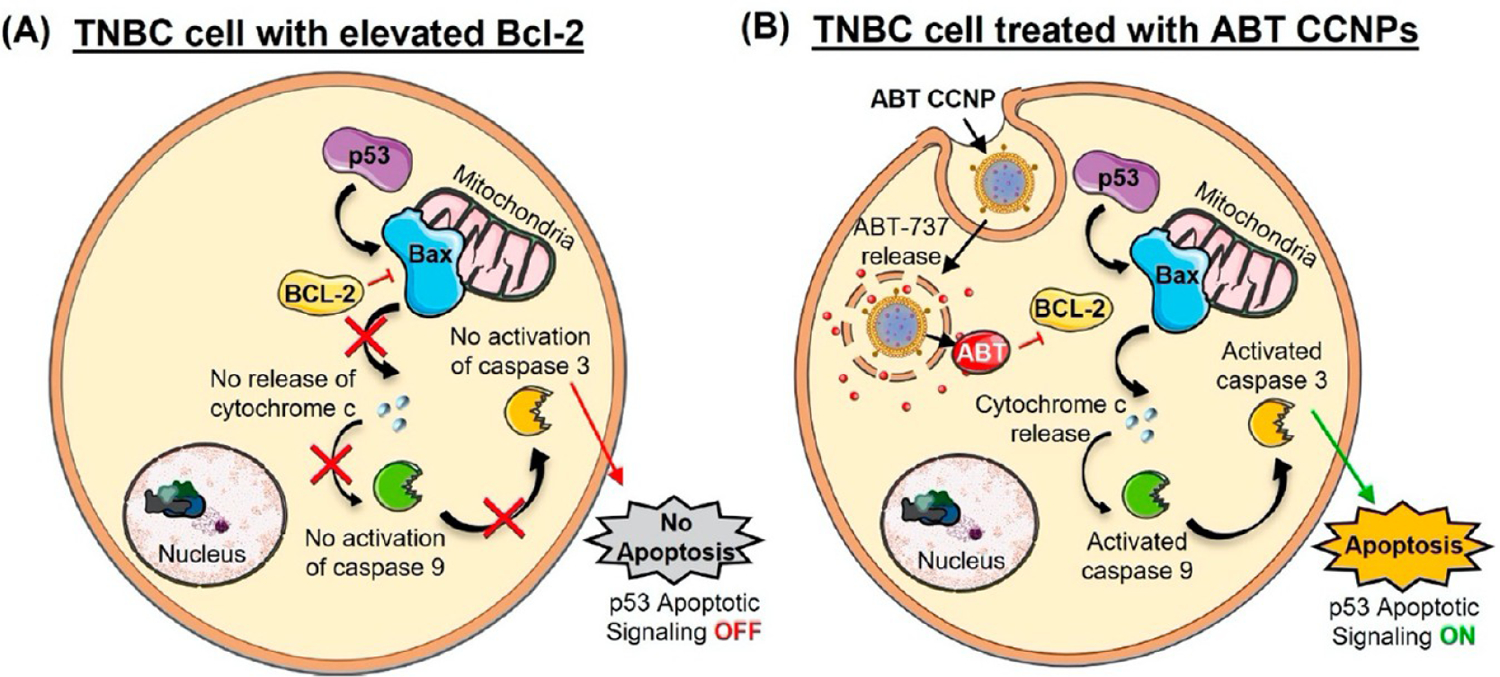
The cell cycle is a highly regulated process involving a delicate interplay among many intracellular signaling pathways. When two pathways become imbalanced, it can shift cellular fate toward survival or death, and this often plays a role in cancer development and progression. In healthy noncancerous cells, the p53 apoptotic pathway becomes activated in response to external stress, DNA replication errors, DNA damage, or cell cycle checkpoint evasion.1 Acetylated p53 then migrates to the mitochondria to induce the BAX-mediated release of cytochrome c, leading to downstream activation of caspases, which will eventually cause cellular apoptosis. External or internal stress in cancer cells should cause a similar response, but cancer cells survive these death signals by blocking them via overexpression of antiapoptotic proteins, such as B-cell lymphoma 2 (Bcl-2).2 Overexpressed Bcl-2 prevents apoptosis by binding to and sequestering the pro-apoptotic proteins BAX and BAK, stopping their activation and preventing cytochrome c release from mitochondria (Scheme 1A).1–3 Since elevated Bcl-2 prevents cancer cells from undergoing programmed cell death, its inhibition holds promise as an antitumor strategy. Here, we report the development and implementation of biomimetic nanoparticles loaded with Bcl-2 inhibitor ABT-737 for targeted treatment of triple-negative breast cancer (TNBC) (Scheme 1B).
Scheme 1.
Depiction of p53 Pathway Dysregulation in TNBC Cells and How Biomimetic Nanoparticles Loaded with ABT-737 Could Be Used to Inhibit Bcl-2 in This Pathway to Induce Cancer Cell Apoptosisa
a(A) TNBC cells overexpress Bcl-2, which inhibits BAX-mediated cytochrome c release from the mitochondria, thereby reducing caspase activity to prevent apoptosis and promote cell survival. (B) Nanoparticles loaded with ABT-737, a Bcl-2 inhibitor, and coated with TNBC cell-derived membranes (ABT CCNPs) can specifically target and enter TNBC cells in vitro and in vivo to intracellularly release ABT-737, reinstating apoptotic signaling. Portions of this figure were produced using Servier Medical ART templates, which are licensed under a Creative Commons Attribution 3.0 Unported License from Servier Medical Art; https://smart.servier.com.
Various drugs and small molecule inhibitors have been designed to regulate Bcl-2 and Bcl-2 family proteins, including oblimersen, obatoclax, gossypol derivatives, AT-101, and BIM SAHBA.4–9 One drug with high targeting affinity for Bcl-2 family proteins is ABT-737, a small molecule Bcl-2 homology 3 (BH3) mimetic.10 ABT-737 mimics BAD, one of eight proapoptotic subfamily “BH3-only proteins”, and binds to the hydrophobic groove of the antiapoptotic/pro-survival proteins Bcl-2, Bcl-xL, and BcL-W, having the highest affinity for Bcl-2 among these three.11,12 This binding prevents the sequestration of BAX/BAK and allows BAX/BAK-mediated apoptosis to continue. By doing so, ABT-737 ultimately neutralizes the expression of Bcl-2 in cancer cells.13 ABT-737 has been studied as a treatment for several cancer types, both alone and in combination with other drugs that can combat potential chemoresistance mechanisms or provide synergistic effects. To date, ABT-737 has been studied as a treatment for small cell lung cancer,14,15 non-small-cell lung cancer,16,17 chronic lymphocytic leukemia,18 glioblastoma,19 and colorectal,20,21 ovarian,22,23 thyroid,24 and bladder cancers.25 It has also received attention as a potential treatment for TNBC, an aggressive breast cancer subtype that accounts for 10–15% of all breast cancer diagnoses.12,26,27 TNBC is unsusceptible to traditional targeted hormonal- or molecular-oriented therapies because it lacks expression of the three receptors these therapies commonly target.28 A study investigating 124 TNBC tumors reported that 81% exhibit Bcl-2 overexpression and Bcl-2 positivity was associated with poorer survival,29 and hence ABT-737 has been explored as a TNBC treatment both alone and in combination with the chemotherapeutic drugs docetaxel or paclitaxel.30,31
While ABT-737 holds promise as an anticancer therapeutic, several issues have hindered its use as a frontline therapy. In particular, ABT-737 has poor aqueous solubility and limited bioavailability when delivered orally.32 ABT-263, also known as navitoclax, was developed as a derivative of ABT-737 with improved oral bioavailability and was tested in clinical trials against small cell lung cancer, leukemia, and solid tumors.33–36 Although some patients experienced promising partial responses or a lack of disease progression, thrombocytopenia was a common adverse and dose-limiting side effect of ABT-263. Thrombocytopenia is characterized by decreased platelet counts and can result from the inhibition of Bcl-xL, a protein essential for platelet survival.37 To avoid this toxicity, ABT-based Bcl-2 inhibitor drugs must be reformulated into carriers that specifically deliver them to cancer cells and avoid off-target cells and platelets.
To improve ABT-737’s solubility, blood circulation half-life, bioavailability, and tumor-specific delivery, researchers have moved toward encapsulating it within nanoparticles (NPs). This nanoencapsulation aims to prevent off-target Bcl-xL suppression and thrombocytopenia, while increasing Bcl-2 inhibition and apoptosis in target cancer cells. Schmid et al. coencapsulated ABT-737 and camptothecin, a topoisomerase I inhibitor, in poly(ethylene glycol) (PEG) coated polymeric NPs, which diminished ABT-737-induced thrombocytopenia and synergistically induced apoptosis both in vitro and in vivo in colorectal cancer models.38 Wu et al. coencapsulated ABT-737 with the kinase inhibitor IRAK1/4 in biodegradable and biocompatible PEG-modified poly(lactic-co-glycolic acid) (PLGA) NPs to treat T cell acute lymphoblastic leukemia (T-ALL).39 The IRAK/ABT-NPs increased the number of apoptotic cells to 86.4%, compared to 39% in the combined free drug treatment group. In mouse xenograft models, the IRAK/ABT-NP treatment increased median survival to 65 days from just 50 days for the combined free drug treatment.39 While these studies show the benefit of delivering ABT-737 in combination with another drug via NP carriers, a different study from Kim et al. showed that delivering ABT-737 alone via PEG-coated carbon nanotubes could improve Bcl-2-mediated apoptosis and reactive oxygen species generation in A549 lung cancer cells.40 Finally, our group recently showed that encapsulating ABT-737 in PLGA NPs coated with Notch-1 antibodies could facilitate its successful delivery to TNBC cells to cause cancer cell death in vitro and tumor reduction and prolonged survival in vivo.41 Despite the success of these antibody-coated NPs, there remains a risk of off-target delivery to noncancerous cells overexpressing Notch-1 receptors.42 NPs that target a single receptor may also fail to eliminate cancer cells with heterogeneous receptor expression. Therefore, improved NP designs are needed to efficiently deliver ABT-737 to primary and metastasized cancer cells, while avoiding immune recognition and off-target delivery.
To enhance the delivery of ABT-737 to TNBC cells with heterogeneous receptor expression, we encapsulated the drug in PLGA NPs that are wrapped with TNBC cell-derived phospholipid membranes (Scheme 1B). This system uses the diverse array of proteins present on the cell membrane to both engage receptors on target cells and minimize immune recognition.43 Several studies have shown that cell membrane wrapped NPs have reduced immunogenicity owing to “marker-of-self proteins” that are present on the membrane, which afford prolonged blood circulation and reduced accumulation in clearance organs.44 Additionally, cancer cell membrane wrapped NPs (CCNPs) can use “self-recognition molecules” present on the membrane to bind cancer cells throughout the body, which is a process known as homotypic targeting.45 Conventional ligand-coated NPs cannot achieve such effective biointerfacing.42 Moreover, membrane wrapping of NPs is advantageous compared to PEG conjugation for stealth delivery due to increasing research revealing humans have developed an immune response to PEG.46 Overall, by incorporating ABT-737 into TNBC membrane-wrapped PLGA NPs, we can increase the drug’s solubility and stability, allow for iv administration, prevent off-target delivery and toxicity, and enhance the delivery and activity in targeted cancer cells with heterogeneous receptor expression.
Here, we demonstrate that ABT CCNPs are stable in storage and serum conditions, efficiently enter TNBC cells but not noncancerous breast epithelial cells in vitro, and potently induce apoptosis in TNBC cells in vitro and in vivo with greater efficacy than ABT delivered freely or in nontargeted PLGA NPs. When tested in a syngeneic murine spontaneous metastasis model of TNBC, the CCNPs exhibited approximately 2-fold higher tumor accumulation than PEG–PLGA NPs. While the ABT CCNPs only modestly suppressed the growth of primary tumors and metastatic lesions in the lungs, histological analysis showed that they significantly increased apoptosis and decreased proliferation and Bcl-2 expression in tumors compared to ABT-loaded PEG–PLGA NPs. Additionally, mice treated with ABT CCNPs maintained their body weight and normal blood composition better than mice treated with ABT-loaded PEG–PLGA NPs, demonstrating the potential to mitigate off-target effects of ABT-737. These results indicate that the limitations of ABT-737 can be overcome by loading the drug in biomimetic nanocarriers and warrant further investigation of ABT-loaded membrane-wrapped NPs for the treatment of TNBC and other cancers characterized by abnormal Bcl-2 expression.
METHODS
Synthesis of ABT PLGA NPs and ABT PEG–PLGA NPs.
ABT-737-loaded PLGA NPs (i.e., bare NPs) were synthesized by first dissolving PLGA (Lactel, 50:50 carboxylic acid terminated, 39.5 kDa) in acetone (VWR) at 1 mg/mL. ABT-737 (Selleckchem, stored in dimethyl sulfoxide (DMSO) at 50 mg/mL) was added to the PLGA in acetone solution at a concentration of 0.05 mg/mL. This ABT/PLGA/acetone mixture was subsequently added dropwise to distilled water at a 1:3 volume ratio with stirring at 800 rpm. This emulsion continued to stir for 24 h, allowing the acetone to evaporate. The NPs were then purified using centrifugal filtration (Millipore, 10 kDa molecular weight cut off (MWCO), 4200 g, 30 min) to remove unencapsulated ABT-737 and excess solvent. NPs were collected from the top of the centrifuge filter and immediately used for subsequent experiments.
ABT-737-loaded PEG–PLGA NPs (i.e., PEG NPs) were synthesized by using a similar method. Poly(lactide-co-glycolic)-b-poly(ethylene glycol) methyl ether (MPEG (5 kDa)–PLGA (30 kDa); 50:50 L/G ratio; Nanosoft Polymers) was dissolved in dichloromethane (DCM; Sigma-Aldrich) at 1 mg/mL. Then, 1500 μL of PEG–PLGA in DCM and 500 μL of PLGA in acetone, both at 1 mg/mL concentrations, were combined to create the oil phase. ABT-737 was added to this oil phase solution at 0.05 mg/mL. This ABT/PEG–PLGA/DCM/PLGA/acetone mixture was then added dropwise to 0.1% poly(vinyl alcohol) (PVA; Sigma-Aldrich) in RNase-free water at a 1:3 volume ratio while stirring at 800 rpm. The solution was then sonicated with a probe sonicator for 1 min while on ice. This emulsion was left to stir for 24 h, letting the acetone and DCM evaporate. The NPs were then purified by using centrifugal filtration (Millipore, 10 kDa MWCO, 4200 g, 30 min) to remove unencapsulated ABT-737 and excess solvent. The filtrate was removed from the bottom of the tube; 1 mL of RNase free water was added to the top of the filter with the NPs, and the centrifugation was repeated once (4200 g, 15 min). NPs were collected from the top of the centrifuge filter and immediately used for experiments.
Cell Culture.
4T1 and 4T1-Luc2 mammary breast cancer cells (American Type Culture Collection, ATCC; CRL-2539 and CRL-2539-LUC2) were cultured in Roswell Park Memorial Institute (RPMI) 1640 (ATCC 30–2001) medium supplemented with 10% fetal bovine serum (FBS; Gemini Bio Products) and 1% penicillin–streptomycin (pen-strep; VWR). EpH4-Ev murine breast epithelial cells (ATCC CRL-3063) were cultured in Dulbecco’s Modified Eagle’s Medium (DMEM; ATCC 30–2002) supplemented with 10% bovine calf serum (BCS; ATCC) and 1.2 μg/mL puromycin dihydrochloride 99% (VWR). Each cell culture was maintained at 37 °C in a 5% CO2 humidified environment. When cells reached 80–90% confluency in T75 cell culture flasks, they were passaged or plated by detaching the cells from the flask using 3 mL of Trypsin-EDTA (ThermoFisher) and then counting cells with a hemocytometer before transferring to a new container.
Cancer Cell Membrane Derivation and Characterization.
To harvest 4T1 cell membranes, cells were grown in T300 cell culture flasks to 80–90% confluency and detached with addition of 8 mL of Trypsin-EDTA (ThermoFisher) for 3 min. RPMI-1640 media was added to neutralize Trypsin-EDTA and then the sample was centrifuged at 300 rcf for 5 min to obtain a cell pellet. The supernatant was aspirated, and pelleted cells were dispersed in 8 mL of ice cold 1× phosphate-buffered saline (PBS; Corning). The cell/PBS suspension was then centrifuged at 300 rcf for 5 min. This washing and centrifuging step was repeated twice more. After the last centrifugation, the PBS supernatant was aspirated and 1 mL of hypotonic lysis buffer consisting of 20 mM UltraPure 1 M Tris-HCl Buffer, pH 7.5 (ThermoFisher), 10 mM KCl (Sigma-Aldrich), 2 mM MgCl2 (Sigma-Aldrich), and 10 μL of Halt Protease Inhibitor Cocktail, EDTA-free (100×) (ThermoFisher) per 1 mL of hypotonic lysis buffer was added and pipetted up and down to disrupt the cell pellet. The hypotonic lysis buffer/cell suspension was kept on ice for 15 min and then added to a Dounce Tissue Grinder (DWK Life Sciences, KIMBLE; VWR) to homogenize the cell suspension with two tight-fitting pestles, 30 passes for each pestle. The homogenized cell suspension was then added to two cold 1.5 mL Eppendorf tubes and centrifuged at 1000 rcf for 10 min at 4 °C. The supernatant from each tube was transferred to a new ice cold 1.5 mL Eppendorf tube. Remaining cell pellets were then broken up by adding 500 μL of hypotonic lysis buffer to each pellet and then gently pipetting up and down. Both cell suspensions were then combined and added back into the Dounce Tissue Grinder, homogenized with both pestles, and centrifuged in two balanced, separate 1.5 mL tubes at 1000 rcf for 10 min at 4 °C. The supernatants from both tubes were then combined into a new ice cold 1.5 mL tube, and the pellets were discarded. The supernatants collected from the previous steps were then centrifuged at 10 000 rcf for 10 min at 4 °C. The supernatants collected after this step were then centrifuged at 40 000 rpm for 1.5 h at 4 °C (Beckman Optima MAX Benchtop Ultracentrifuge). The supernatant produced from the ultracentrifugation step was discarded, and the remaining pellet containing extracted cell membranes was resuspended in 1.2 mL of water to create a 4T1 cell membrane solution. A mini-extruder (Avanti Polar Lipids) heated to ~75 °C was then used to physically extrude cell membranes through a 400 nm polycarbonate membrane (Avanti Polar Lipids) for 11 passes. The resulting cell membrane vesicles in water were collected and used as purified cancer cell membranes for subsequent experiments.
Characterization of Membranes and NPs.
A LiteSizer 500 (AntonPaar) dynamic light scattering (DLS) instrument was used to measure the hydrodynamic diameters and zeta potentials of samples diluted in Milli-Q water. A NanoSight NS300 nanoparticle tracking analysis system (NTA; Malvern Panalytical) was utilized to measure the samples’ concentration (particles/mL) diluted in Milli-Q water. To visualize the morphology of the samples, electron micrographs were acquired by using a Zeiss Libra 120 Transmission Electron Microscope (TEM) at the Delaware Biotechnology Institute. TEM samples were prepared by placing small volumes of samples (at equal concentrations) on hydrophilic carbon support films with copper grids at 400 mesh, staining with 2% uranyl acetate, and drying prior to imaging.
Synthesis and Characterization of ABT CCNPs.
Using the concentration (particles/mL) measurements recorded from the NTA, the membrane vesicles and ABT PLGA NPs were combined at a 4:1 membrane/NP ratio. This solution was then extruded through a 400 nm polycarbonate membrane (Avanti Polar Lipids) for 11 passes using the Avanti mini-extruder. The final CCNP solution was collected in a 1.5 mL Eppendorf tube and centrifuged at 17 000 rpm for 45 min to pellet CCNPs and remove any unused membranes in solution. The centrifuged CCNP pellet was resuspended in water and used immediately or stored at 4 °C. The CCNP hydrodynamic diameter and zeta potential were measured using the LiteSizer. CCNP size and concentration (particles/mL) were measured using NTA. To visualize the morphology of 4T1 membrane vesicles and ABT CCNPs, samples were placed on TEM grids, stained with 2% uranyl acetate, dried, and examined by TEM (Carl Zeiss Libra 120).
Cancer Cell Membrane Protein Characterization.
During the membrane extraction protocol, samples of the 4T1 cell nuclear components, mitochondrial components, and whole cell lysate were kept and stored on ice. To assess protein content in ABT CCNPs, sodium dodecyl sulfate (SDS)–polyacrylamide gel electrophoresis (PAGE) was performed on various samples following a protocol modified from that described by Fang et al.47 For this assay, a Pierce BCA Protein Assay kit (Thermofisher) was used per manufacturers’ instructions to measure the protein concentration in the 4T1 cell nuclear components, mitochondrial components, whole cell lysate, and membranes and that from ABT CCNPs. Samples were then diluted to 20 μg of protein with 1× PBS and 4× Bolt LDS Sample Buffer (Thermofisher). Each sample was then denatured for 10 min at 70 °C while vortexing at 400 rpm. SDS-PAGE was run using 20 μg of protein sample per well (total volume of 40 μL per well) in 4–12% Bolt Bis-Tris Plus gels (Thermofisher), with one well containing a prestained 11–250 kDa protein ladder (Cell Signaling Technologies; CST). A mini-gel tank (Thermofisher) was filled with 1× 3-(N-morpholino) propanesulfonic acid (MOPS) running buffer (Thermofisher), and the gels were run at 120 V for 75 min. Next, the gel was removed, rinsed 3× with reverse osmosis purified (RO) water, and stained with SimplyBlue SafeStain (Thermofisher) for 1 h at room temperature while rocking. The excess stain was discarded, and the gel was rinsed in RO water for 30 min while rocking at room temperature. The RO water was then discarded, and new RO water was added to rinse the gel overnight while rocking at 4 °C. After rinsing overnight, the gel was placed on transparency paper and imaged for qualitative analysis.
Calculating Encapsulation Efficiency, Loading Capacity, Drug Release, and Stability of NPs.
To determine the encapsulation and loading capacity of ABT-loaded bare NPs, PEG NPs, and CCNPs, 500 μL of DMSO (VWR) containing 0.004% hydrochloric acid (HCl; Fisher Scientific) was added to each NP type in a 1.5 mL Eppendorf tube. The tubes were placed horizontally on a rocker at room temperature (21 °C) for 30 min. The NPs in Eppendorf tubes were sonicated in a water bath for 20 min. Then the tubes were centrifuged for 15 min at 16 000 rcf to separate degraded NPs from released cargo. The postcentrifugation supernatant for each NP sample was then added in 200 μL volumes to a 96-well plate alongside a standard curve of known ABT-737 concentration serially diluted in DMSO containing 0.004% HCl. The absorbance of the samples and standard curve in the plate were read at 300 nm on a Synergy H1 plate reader (BioTek). To analyze the data, the background (DMSO containing 0.004% HCl alone) was subtracted from the absorbance reading in each well. Encapsulation efficiency (EE%) was calculated as
Loading capacity (LC%) was calculated as
Drug release in storage conditions (water, 4 °C) and physiological conditions (10% FBS, 37 °C, 100 rpm) was measured by resuspending 0.5 mg of NPs in 1 mL of either storage or physiological conditions for 1, 2, 4, 24, or 48 h, centrifuging the NPs for 20 min at 20 000 rcf at each time point, then measuring 200 μL of the postcentrifugation supernatant for each NP sample in a 96-well plate alongside a standard curve of known ABT-737 concentration serially diluted in either water or 10% FBS, respectively. The absorbance of the samples and standard curve in the plate was read at 300 nm on a Synergy H1 plate reader (BioTek). To analyze the data, the background (water for storage or 10% FBS for physiological conditions) was subtracted from the absorbance reading in each well. For size stability measurements, 1 mg of each NP type was placed in 1 mL storage (water, 4 °C) or serum (10% FBS, 37 °C, 100 rpm) conditions for 0, 0.5, 1, 4, 24, 48, or 72 h, and the LiteSizer was used to measure each sample’s size and zeta potential stability in each condition. All data were obtained in at least three biological replicates and averaged. Drug release data was compared using one-way ANOVA with post hoc Tukey.
Cellular Binding and Uptake of DiD-Loaded NPs.
To analyze cellular binding and uptake of CCNPs, bare NPs, or PEG NPs, the NPs were loaded with DiD solid (DiIC18(5) solid (1,1′-dioctadecyl-3,3,3′,3′-tetramethylindodicarbocyanine, 4-chlorobenzenesulfonate salt) (DiD) fluorophores (ThermoFisher Scientific; excitation 644 nm/emission 663 nm) in place of ABT-737. Additionally, PLGA NPs were wrapped with 4T1 cell membranes that were separately stained with lipophilic membrane red-fluorescent dye PKH26 (Sigma-Aldrich; excitation 551 nm/emission 567 nm) so that both the cargo and membranes of CCNPs could be identified. For confocal microscopy and image-based analysis, cells were plated at 1 × 10⁴ cells per well (4T1) or 5 × 10³ cells per well (EpH4-Ev) in an 8-well Nunc Lab-TekTM Chambered Coverglass, Borosilicate Glass 1.0 slide (FisherSci; Item #155411) in triplicate and incubated overnight. Cells were then treated with DiD bare NPs, DiD PEG NPs, or DiD CCNPs at equal DiD fluorescence values or left untreated for 4 h. After 4 h, the cells were washed 3 times with cold 1× PBS to remove unbound NPs, fixed with 4% formaldehyde at room temperature for 10 min, then washed again 3 times with 1× PBS. Cells were then permeabilized with 0.1% Trition-X-100 in PBS for 5 min at room temperature and washed again 3 times with 1× PBS. Cells were treated with 1% BSA in PBS for 20 min at room temperature. This 1% BSA was removed, cells were counterstained with Alexa Fluor 488 (ThermoFisher Scientific; excitation 490 nm/emission 525 nm) for 30 min at room temperature, and then this solution was rinsed off 3 times with 1× PBS. Cells were then stained with DAPI (ThermoFisher Scientific; excitation 358 nm/emission 461 nm) in 1× PBS (1:1000) for 3 min at room temperature and then washed 3 times with 1× PBS. A final volume of 200 μL of PBS was added to each well prior to imaging with a Zeiss LSM880 Multiphoton Confocal Microscope.
For flow cytometric analysis of cellular binding and uptake, 4T1 cells and EpH4-Ev cells were plated at 1.5 × 10⁴ cells per well in 24-well plates in triplicate and incubated overnight. Cells were then treated with DiD bare NPs, DiD PEG NPs, or DiD CCNPs (without PKH26 stained membranes) at equal DiD fluorescence values or left untreated for 30 min, 2 h, or 4 h. At each time point, the media and NPs were removed, cells were washed with 1 mL of 1× PBS and treated with 200 μL of 0.25% Trypsin-EDTA (ThermoFisher) for 3 min, and then 500 μL of 1× PBS was added to each well to neutralize trypsin. The cell suspensions were each added to separate 1.5 mL Eppendorf tubes and spun down for 5 min at 300 rcf and 21 °C. Supernatants were then removed and discarded, and each cell pellet was resuspended in 200 μL of 1× PBS and put on ice prior to flow cytometry analysis. All cell suspensions were analyzed using an Acea Novocyte 2060 flow cytometer with the APC (excitation, 640 nm; emission, 675/30 nm) channel. Density plots showing forward and side scatter data were used to create a primary gate for cells, excluding debris, prior to analyzing the DiD content. Flow cytometric analysis was performed in triplicate, and data were analyzed by two sample Student’s t test assuming equal variances (two-tail).
Evaluating Changes in Gene Expression Induced by ABT CCNPs.
To determine the effects of ABT CCNPs on gene expression in TNBC cells by quantitative real-time reverse transcription polymerase chain reaction (qRT-PCR), 4T1 cells were seeded at 4 × 10⁴ cells per well in a 6-well plate and incubated overnight. Cells were then treated with 7 μM ABT-737 freely in solution or in NP form in bare NPs, PEG NPs, or CCNPs for 48 h. At the end of the treatment period, cells were rinsed with PBS and put on ice, and mRNA was extracted using a Bioline Isolate II RNA Mini Kit (Thomas Scientific). Modifications to the protocol included omitting the β-mercaptoethanol addition. RNA concentration was read by measuring sample absorbance at 260 nm by using a Take3 Plate on a Synergy H1 plate reader. qRT-PCR was then performed using a SensiFAST SYBR One-Step Master Mix (Thomas Scientific) on a LightCycler 96 (Roche). Gene expression was normalized to that of GAPDH and further normalized to the empty PLGA NPs. These experiments were performed in triplicate and analyzed using a one-way ANOVA with post hoc Tukey. Primer sequences are as follows (listed 5′ to 3′): GAPDH forward, TCTCCACTTTGCCACTGCAA; GAPDH reverse, GAACGGATTTGGCCGTATTG; Bcl-2 forward, GACTTCTCCCGCCGCTACC; Bcl-2 reverse, CCCAGTTCACCCCGTCCCT.
Investigating Changes in Protein Expression Induced by ABT CCNPs.
To evaluate the effects of ABT CCNPs on Bcl-2 protein expression by Western blotting, 4T1 cells were plated at 4 × 10⁴ cells per well in a 6-well plate and incubated overnight. Cells were then treated with 7 μM ABT-737 freely in solution or in NP form in bare NPs, PEG NPs, or CCNPs for 48 h. Thereafter, the cells were rinsed with PBS and lysed with Halt Protease Inhibitor in RIPA buffer at a ratio of 1:100 for 15 min. Cells were then manually lysed using a pipet tip and collected in 1.5 mL Eppendorf tubes. The lysate was bath sonicated for 1 min and then pelleted at 12 000 rcf for 10 min at 8 °C to remove debris. The lysate supernatant was further concentrated using Spin-X UF 500 Concentrators (Corning) at 14 000 rcf for 15 min at 8 °C. The concentrated supernatant on top of the filters was collected in 1.5 mL Eppendorf tubes. A DC Protein Assay kit (Bio-Rad) was used per the manufacturer’s instructions to measure the protein concentration in each sample’s lysate. Samples were then diluted to 30 μg with 1× PBS. Additionally, equal volumes of 2× Laemmli’s Buffer (Sigma) and lysate were mixed. Each sample was then denatured for 6 min at 99 °C. Next, 30 μg of protein sample or 5 μL of a prestained 11–250 kDa protein ladder (CST) was added to each well of 4–12% Bolt Bis-Tris Plus gels (Thermofisher). A mini-gel tank (Thermofisher) was filled with 1× morpholino-ethanesulfonic (MES) sodium dodecyl sulfate (SDS) running buffer (LifeTech) and set to 120 V, and the protein-loaded gels were run for 75 min. The gel was then removed and transferred onto a 0.45 μm pore nitrocellulose membrane using the Power Blotter System (Thermofisher) set to MID RANGE MW for 7 min. The transferred blot was blocked in 5% nonfat milk diluted in tris buffer saline with 0.1% Tween-20 (TBS-T) for 1 h while rocking at room temperature (21 °C). After blocking, the membrane blots were cut right below the 32 kDa band marked by the ladder. The corresponding blots were then fully covered and incubated with primary antibodies in 5% nonfat milk/TBS-T in plastic containers for at least 20 h while rocking at 4 °C. The following concentrations were used for the primary antibodies: β-actin, 1:10,000 (CST; 8H10D10); Bcl-2, 1:1000 (CST; D17C4). The following day the blots were washed with TBS-T 3 times for 5 min while rocking at room temperature. Blots were then incubated with secondary antibodies of HRP-Rabbit (SeraCare; Item #5220–0336) or HRP-Mouse (SeraCare; Item #5220–0341) at a dilution of 1:25,000 for 90 min covered and rocking at room temperature. The blots were then washed with TBS-T 3 times for 5 min with an additional wash while rocking with TBS only. Lastly, the blots were incubated with enhanced chemiluminescence (ECL) solutions per the manufacturer’s instructions. The blots probed for β-actin were incubated with SuperSignal West Pico PLUS Chemiluminescent Substrate (Thermofisher) for 3 min, and blots probed for Bcl-2 were incubated with SuperSignal West Femto Maximum Sensitivity Substrate (Thermofisher) for 1 min. After treatment with ECL solutions, the blots were imaged using a UV-Imager chemiluminescent setting with exposure times ranging from 500 ms to 1.5 min. The collected images were further analyzed using ImageJ for protein quantification. Bands for Bcl-2 target protein expression were normalized to the corresponding β-actin expression and further normalized to the no treatment group. These experiments were performed in triplicate and analyzed by using a one-way ANOVA.
Effect of Free ABT and NPs on Metabolic Activity.
To evaluate the toxicity of freely delivered ABT-737 and ABT-loaded PLGA and PEG–PLGA NPs versus ABT CCNPs using a MTT (3-(4,5-dimethylthiazol-2-yl)-2,5-diphenyltetrazolium bromide) assay, 4T1 cells were plated at 2 × 10³ cells per well, and EpH4-Ev cells were plated at 2.5 × 10³ cells per well in 96-well plates and incubated overnight. Cells were treated with 0, 1, 2, 4, 6, 8, 10, or 12 μM ABT-737, either freely in solution or in NP form for 72 h. Subsequently, the treatments were removed, and the cells were incubated in MTT solution per the manufacturer’s instructions (ThermoFisher). After 3 h, the MTT solution was replaced with DMSO, and the absorbance at 540 nm was read on a Synergy H1 plate reader (BioTek). To analyze the data, background (DMSO in wells without cells) was subtracted from the absorbance reading in each well. Triplicate well signals were averaged and then normalized to untreated cells. These MTT assay experiments were performed in 4T1 cells using freely delivered ABT-737 (n = 9), ABT bare NPs (n = 6), ABT PEG NPs (n = 6), and ABT CCNPs (n = 7) and in EpH4-Ev cells using ABT-737 (n = 4), ABT bare NPs (n = 4), ABT PEG NPs (n = 4), and ABT CCNPs (n = 4). To confirm that the PLGA or PEG–PLGA in each nanocarrier was not affecting cell metabolic activity, nonloaded (empty) PLGA NPs, PEG–PLGA NPs, and CCNPs were added to 4T1 cells. The number of nonloaded NPs added to 4T1 cells was calculated using NTA concentration measurements to match the number of ABT-loaded PLGA NPs, PEG–PLGA NPs, and CCNPs added to 4T1 cells in each 0, 1, 2, 4, 6, 8, 10, and 12 μM dosage. The MTT assay on nonloaded/empty NP treated 4T1 cells was performed as previously described above in triplicate. Significance between treatment groups in MTT assays was analyzed by one-way ANOVA with post hoc Tukey and is displayed in Figure S4.
Measuring the Ability of Free ABT and NPs to Induce Cellular Apoptosis.
To analyze the mechanism of cell death induced by ABT CCNPs, 4T1 cells were plated at 1.5 × 10⁴ cells per well in 48-well plates in triplicate and incubated overnight. Cells were then treated with 0 or 7 μM ABT-737, either freely in solution or in NP form. After 24 or 48 h, an Annexin V/Propidium Iodide (PI) stain (Cayman Chemicals) was conducted per the manufacturer’s instructions. In short, the treatment medium was removed, cells were washed with 1× PBS, and 0.25% Trypsin-EDTA was used to lift cells. Cells were spun down for 5 min at 300 rcf and 21 °C. Supernatants were discarded, each cell pellet was resuspended in 300 μL of 1× Binding Buffer, and then cell suspensions were centrifuged at 300 rcf for 5 min at room temperature (21 °C). The supernatant was removed from each sample, and the cell pellets were then resuspended in 50 μL of Annexin V FITC/PI staining solution containing 1:500 Annexin V and 1:2000 PI stains. Cell suspensions were incubated in the dark at room temperature for 10 min, and then 150 μL of 1× Binding Buffer was added. The samples were then analyzed using an Acea NovoCyte 2060 Flow Cytometer with FITC (excitation, 488 nm; emission, 530/30 nm) and PerCP (excitation, 488 nm; emission, 675/30 nm) channels. Data analysis was performed with NovoExpress software (ACEA Biosciences). Density plots showing forward and side scatter data were used to create a primary gate for cells, excluding debris, prior to establishing gates for Annexin V-positive and PI-positive cells. Positive stained gates were based on unstained cells, and single stained controls were used for compensation. The data presented are the average of three experiments and were analyzed by one-way ANOVA with post hoc Tukey–Kramer. Staurosporine was used as a positive control to ensure that stains accurately marked apoptosis. Cells were treated with 1 μM staurosporine 2 h prior to the Annexin V/PI and flow cytometry analysis detailed above.
In Vivo Tumor Model.
Female Balb/cJ mice, approximately 5 weeks old, were purchased from Jackson Laboratory. The Institutional Animal Care and Use Committee of the University of Delaware approved all procedures. Mice were fed a low chlorophyll diet upon arrival and were housed at least 1 week prior to any cell inoculation procedures. Prior to surgery, 4T1-Luc2 luciferase-expressing cells were prepared at a concentration of 1 × 10⁵ cells in sterile 1× PBS per 50 μL injection and put on ice. On the day of surgery, all equipment and surgical area were sterilized with bead sterilizers and/or EtOH. Mice were weighed, anesthetized with isoflurane, and injected intraperitoneally with buprenorphine based on weight. Ophthalmic ointment was applied to the eyes prior to placing mice belly up into a nose cone for constant isoflurane administration. The surgical site was sterilized with ethanol and then povidone-iodine swab sticks 3× times prior to performing a toe pinch test to ensure mice were completely anesthetized. A longitudinal incision with a sterile surgical blade was made along the fourth inguinal mammary fat pad and a cotton swab soaked with sterile 1× PBS was tucked into the incision to create a small pocket at the incision opening. The mammary fat pad was then exposed by pinching and lifting with curved tweezers, and the prepared 4T1 cell suspension was injected into the base of the exposed mammary fat pad. The fat pad was slowly released, and the incision site was dabbed with sterile gauze. Curved tweezers were used to pull the incision together tightly, and VetBond was applied to close the incision site. Mice were then placed in a sterile cage on a heating pad and monitored until awake and alert prior to being placed back into home cages. Tumor growth was monitored at least 3 times per week with digital Vernier calipers. Tumor volume was calculated as ((tumor length) × (tumor width)2)/2. Tumor growth was also monitored at least once per week following cell injection using a PerkinElmer IVIS Lumina III. Mice were anesthetized with isoflurane and injected intraperitoneally with D-luciferin (150 mg/kg) 10 min prior to imaging. Each mouse’s weight was measured at least three times per week following cell implantation. If any animal experienced loss in weight >20% from the day of cell injection or if tumor volume exceeded 1000 mm3, it was humanely euthanized.
Assessment of NP Biodistribution In Vivo.
Orthotopic mammary fat pad tumors in female Balb/cJ mice were created and monitored as described above until the tumors reached ~50–200 mm3. PLGA NPs and PEG NPs were loaded with DiD fluorophores (ThermoFisher Scientific; excitation 644 nm/emission 663 nm) in place of ABT-737 for biodistribution studies. PLGA NPs were then wrapped with 4T1 cell membranes to make DiD-loaded CCNPs using the same protocol described above for in vitro studies. Mice (which ate a low chlorophyll diet to reduce tissue autofluorescence) received tail-vein injections of 100 μL of saline or DiD-loaded PEG NPs or DiD-loaded CCNPs at a concentration of 1 mg/mL per mouse. At approximately 24 h postinjection, mice were euthanized, and the heart, lungs, kidneys, spleen, liver, brain, and tumor were collected and stored in equivalent volumes of 1× PBS containing 1% pen-strep antibiotics. A PerkinElmer IVIS Lumina III was used to image DiD signal in each tissue and tumor sample with excitation and emission filters of 640 and 710 nm. The total radiant efficiency within tissues and tumors was measured by adjusting the minimum fluorescence threshold to the lowest value that still had no signal in the saline group and the maximum signal was left at the automated threshold for the image. Tissues and tumors were then weighed. The total radiant efficiency per mg of tissue or tumor was determined per mouse and averaged with others in its respective treatment group, and data were analyzed by one-way ANOVA. Tissues and tumors were then divided into smaller pieces with surgical scissors and homogenized with a VWR 200 Homogenizer. Samples were added to a 96-well plate in three wells containing 200 μL per tissue or tumor per mouse, and a Synergy H1 Microplate Reader (Biotek) (ex/em 640 nm/675 nm) was used to read DiD fluorescence signal. Values per sample were averaged, and signal per milligram of tissue was calculated based on the volume of the homogenized sample, total volume of homogenized sample, and measured ex vivo weight of each tissue or tumor. Average fluorescence per milligram tumor/tissue values were analyzed using one-way ANOVA with post hoc Tukey–Kramer.
Evaluating the Therapeutic Potential of ABT CCNPs In Vivo.
Orthotopic mammary fat pad tumors in female Balb/cJ mice were created and monitored as described above until the tumors reached ~50–200 mm3 (day 0). Mice were injected with 150 μL of saline or ABT-loaded PEG NPs or ABT-loaded CCNPs at doses of 1 mg PLGA per mouse, which was approximately 2 mg of ABT-737 per kg of mouse weight. Injections were performed twice per week on day 0, 3, 7, 10, 14, 17, 21, and 24 for a total of 8 treatments over 4 weeks. Body weight and tumor length and width measured with digital Vernier calipers were monitored 2× per week in each mouse, and tumor volume was calculated as above until day 45 when the last mouse was euthanized. Mice were euthanized if there was weight loss >20% from the day of cell injection or if tumor volume exceeded 1000 mm3. After euthanasia, the major organs (heart, lungs, kidneys, liver, spleen, and brain) and tumors of the mice were excised and used for histological analysis.
For histology, excised organs and tumors were rinsed in 1× PBS and placed into embedding cassettes. Cassettes were then placed in 4% paraformaldehyde (in 1× PBS) for 72 h while rocking at 4 °C. Next, cassettes were rinsed three times in 70% ethanol for 15 min at 4 °C while rocking. Tissues were then stored in fresh 70% EtOH solution at 4 °C prior to histological preparation and processing. The fixed tissues were processed using a Leica ASP6025 S Tissue Processor and embedded with paraffin using a Milestone Medical HistoDream Embedding center. Tissue blocks were created using Parapro Blue paraffin from Statlab (ref # PPBLU). Embedded tissues were cut into 5 μm slices using a Leica RM 2125 rotary microtome. Sample sections were stained with hematoxylin and eosin (H&E) using the Leica Autostainer XL platform to enable visualization of tissue structure. Briefly, the tissues were deparaffinized with xylene and rehydrated prior to hematoxylin staining and subsequent counterstaining with eosin. Separate tumor sections were stained for Bcl-2 or with Ki67 proliferation marker or active caspase-3 (aCasp-3) apoptosis marker. After staining, the slides were coverslipped using the automate TissueTek Film 4740 coverslipper using Tanner Tape coverslipping film and Surgipath Xylene. Stained tissue sections were imaged on an Axioobserver Z1 Inverted Fluorescence Microscope (Zeiss).
Images of Ki67, aCasp-3, and Bcl-2-stained tumor tissues were analyzed with ImageJ to determine the average positive cell percentage ((positively stained cells)/(total cells in image) × 100). The TIF images of tumors were opened in ImageJ, converted into 8-bit, adjusted with Threshold, and made Binary with Watershed to add a one-pixel line between cell bodies. Analyze Particles was then applied to automatically count each cell in an image. Then the multipoint tool was used on the full-color tumor image to manually count positively stained cells. The positive cell count was divided by the total cell count and multiplied by 100 to find the positive cell percentage for seven images of distinctive cell regions per tumor sample. Each sample image value was then averaged against other samples from the corresponding tumor. Significance between mice sacrificed on the same day that received different treatment types was determined by using a Student’s t test.
H&E-stained lung tissues were analyzed with ImageJ to determine the average metastasis area percentage ((metastasis area)/(total tissue area) × 100). The TIF images of lungs were downloaded into ImageJ, converted into 8-bit, and made Binary. The Wand (tracing) tool was used to trace and measure total tissue area and the Freehand selection was used to outline and measure the areas of metastatic regions. Each metastatic region’s area was then totaled and divided by total lung tissue area to determine the metastasis area percentage per sample. Each sample was then averaged with other samples from the corresponding treatment groups and analyzed using one-way ANOVA.
Immediately after euthanasia, blood samples were also retrieved from mice via cardiac puncture with Smiths Medical Pro-Vent Blood Gas Sampling 25G syringes (FisherSci). Blood was stored in BD Microtainer Blood Collection Tubes with K2EDTA at 4 °C and subsequently analyzed with a VetScan HM5 Hematology Analyzer (Abaxis) to determine blood composition.
RESULTS AND DISCUSSION
Characterization of Cell-Derived Membranes and NPs.
ABT-loaded PLGA NPs were synthesized and wrapped in 4T1 cell membranes as depicted in Figure 1A and described in the Methods. 4T1 murine mammary breast cancer cells were used as the membrane source due to their close relation in genotype and metastasis to TNBC in humans. In short, PLGA NPs were synthesized by adding ABT (dissolved in DMSO) to PLGA (1 mg/mL in acetone) to a final ABT concentration of 0.05 mg/mL, adding this mixture to water at a 1:3 volumetric ratio, and then stirring overnight to allow solvent evaporation before purification by centrifugal filtration. NPs and membranes (collected from 4T1 cells as described in the Methods, then extruded to reduce their size before coating of NPs) were characterized using TEM, NTA, DLS, SDS-PAGE, and absorbance measurements. TEM was performed on individual CCNP components to visualize the wrapping of membranes around PLGA cores and the core–shell structure of CCNPs (Figure 1A). Prior to membrane wrapping, bare ABT-loaded PLGA NPs (bare NPs) had a diameter of 57.0 ± 19.4 nm and a zeta potential of −27.7 ± 9.1 mV. Extruded 4T1 cell membrane vesicles (Membranes) had a hydrodynamic diameter of 147.1 ± 28.5 nm and a zeta potential of −25.4 ± 9.9 mV (Figure 1B). After membrane wrapping, ABT-loaded CCNPs (ABT CCNPs) had a hydrodynamic diameter of 89.6 ± 22.2 nm and a zeta potential of −24.6 ± 7.5 mV (Figure 1B). The ~20–30 nm size increase from bare NPs to CCNPs indicates the presence of the cell membrane around the exterior of the PLGA NP core. The CCNPs’ shift to a slightly more neutral zeta potential closer to that of membrane vesicles is also indicative of membrane wrapping around the PLGA NP core. SDS-PAGE further confirmed the successful transfer of membrane proteins onto the surface of the ABT CCNPs. In Figure 1C, the protein profiles of the removed nuclear and mitochondrial fractions are compared with whole cell lysate, membrane vesicles, and CCNPs. Dark protein bands appear at ~46, 22, and 17 kDa in the nuclear and mitochondrial fractions and whole cell lysate lanes but are not present in the membrane vesicle or ABT CCNP lanes (white boxes in Figure 1C), indicating intracellular components were removed during membrane extraction. Membrane vesicles and ABT CCNPs also have a greater intensity of proteins at ~134–190 kDa (yellow box in Figure 1C), representing the increased concentration and presence of these membrane protein components compared to the less concentrated protein bands in the removed pellets and whole cell lysate. Moreover, the striking similarities between membrane vesicles and ABT CCNP proteins show there were no major protein component losses during the NP wrapping process and that electrostatic interactions allowed membrane coating onto the ABT PLGA NP surface.
Figure 1.
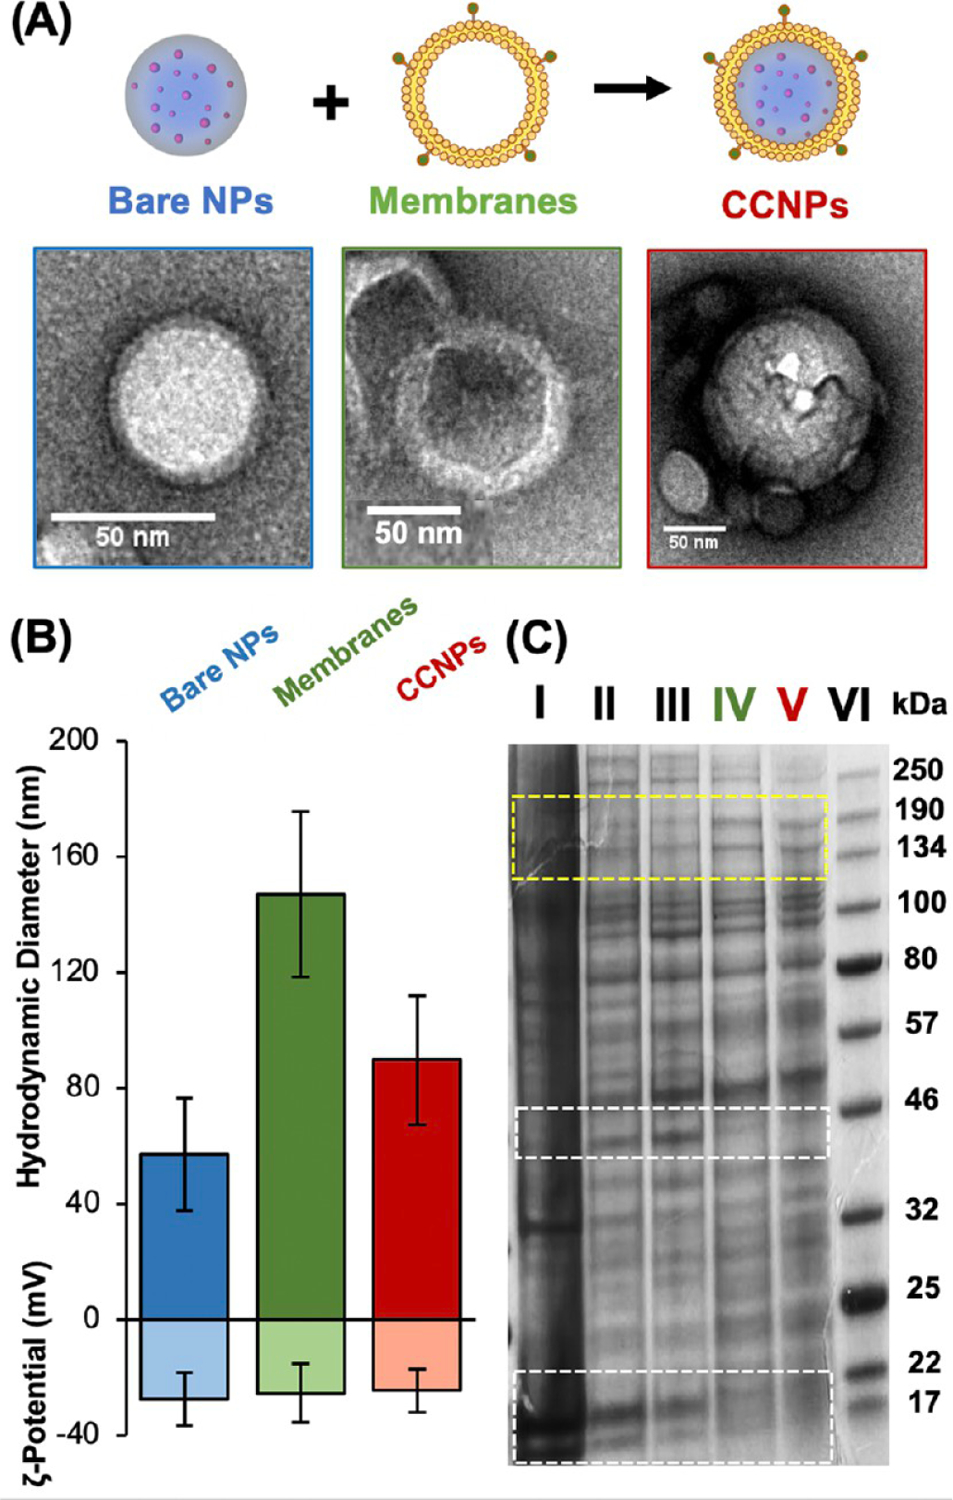
Synthesis and characterization of CCNPs. (A) Schematic and corresponding transmission electron micrographs of bare ABT-loaded PLGA NPs, extruded 4T1 membrane vesicles, and ABT CCNPs. (B) Hydrodynamic diameter and zeta potential of bare NPs, empty membrane vesicles, and CCNPs (n = 41, 28, 29). (C) SDS-PAGE gel showing proteins lysed from (I) nuclear pellet, (II) mitochondrial pellet, (III) 4T1 whole cell lysate, (IV) isolated 4T1 cell membrane vesicles, (V) 4T1 membrane-wrapped ABT-loaded CCNPs, and (VI) known protein ladder. Gel shown is a representative image from n = 3 samples. White boxes denote bands that are present in lanes I–III but diminished in lanes IV and V, indicating removal of intracellular proteins from extracted membranes and CCNPs. Yellow box denotes proteins that are more abundant/concentrated in membranes and CCNPs compared to whole cell lysate, nuclear fractions, or mitochondrial fractions.
Next, the encapsulation efficiency (EE%), drug loading, drug release, and stability of the NPs was assessed. As an additional control, ABT-loaded PEG–PLGA copolymer NPs (PEG NPs) were synthesized as described in the Methods so that it would be possible to determine any advantages ABT CCNPs possess over a nontargeting but stealth NP design. These PEG NPs had a hydrodynamic diameter of 133.4 ± 16.8 nm (n = 12) and a zeta potential of −22.1 ± 1.7 mV (n = 10). The EE% and drug loading of bare NPs, CCNPs, and PEG NPs was measured by breaking down the NPs and directly measuring the separated ABT-containing supernatants via absorbance measurements at 300 nm with a plate reader (Figure 2A). Bare NPs encapsulated ~61% of ABT added during synthesis, corresponding to a drug loading of ~100 μg of ABT/mg of PLGA. After membrane wrapping, CCNPs exhibited drug loading of ~50 μg of ABT/mg of PLGA, which was comparable to the ~60 μg of ABT/mg of PLGA encapsulated in PEG NPs (Figure 2A). The difference in loading between bare NPs and CCNPs may have resulted from the strains of physical extrusion or loss of surface-bound ABT during the membrane-wrapping process.
Figure 2.
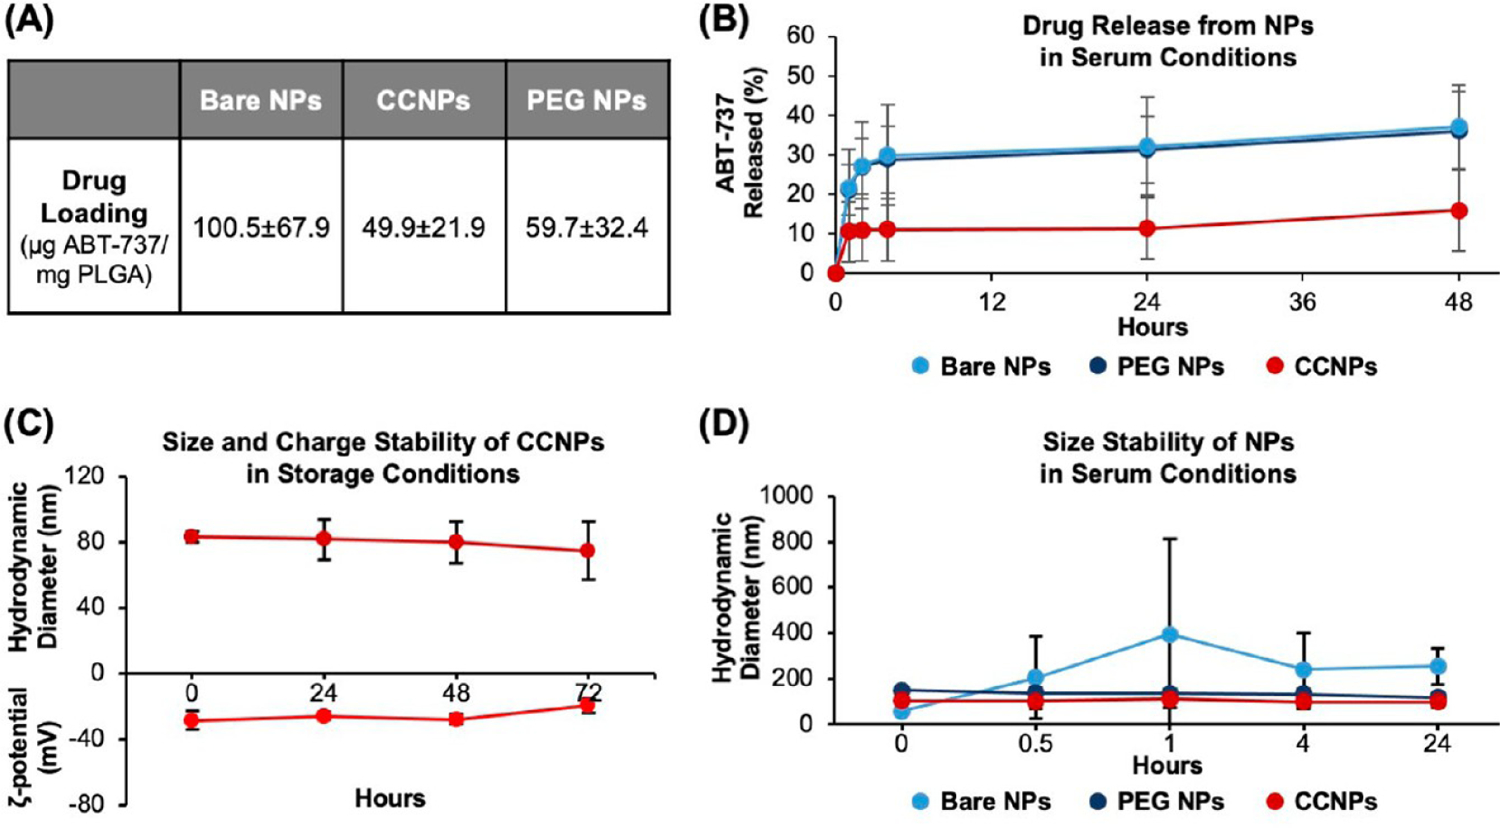
Characterization of the CCNP drug loading, release, and stability. (A) Drug loading in bare NPs, CCNPs, and PEG NPs based on measurement of ABT-737 absorbance (n = 11 per group). (B) Percentage of ABT-737 released from bare NPs, PEG NPs, and CCNPs over 2 days in serum conditions (10% FBS, 37 °C, 100 rpm) (n = 3). (C) ABT CCNP hydrodynamic diameter and zeta potential when suspended under storage conditions (water, 4 °C; n = 4). (D) ABT-loaded NP hydrodynamic diameter versus time when suspended in serum conditions (10% FBS, 37 °C, 100 rpm; n = 3). Error bars in parts B–D show standard deviation.
Drug release from CCNPs was determined by measuring ABT absorbance at various time points after the NPs were subjected to serum conditions mimicking the pH, composition, and temperature to which NPs would be exposed after intravenous (iv) injection (pH 7.4, 10% FBS, 37 °C on an incubated shaker at 100 rpm) (Figure 2B) or storage conditions (water, 4 °C) (Figure S1). CCNPs only released ~16% of ABT after 48 h in serum conditions compared to bare NPs or PEG NPs that lost over double that amount of ABT (~37%) over the same period (Figure 2B). The reduced drug loss from CCNPs in serum conditions is beneficial as it would allow more ABT to reach tumors to elicit therapeutic effects. The membrane coating also slowed ABT-737 release in storage conditions, where bare NPs and PEG NPs exhibited 20.4% and 24.1% release after 48 h, respectively, compared to 8.4% for CCNPs, which further proves the superiority of a cell membrane coating design (Figure S1). The difference in release between CCNPs and bare NPs in storage conditions was statistically significant (p < 0.05) at the 4- and 24 h time points and the difference between CCNPs and PEG NPs in storage conditions was significant at the 4, 24, and 48 h time points per one-way ANOVA with post hoc Tukey (Figure S1). CCNP hydrodynamic diameter and zeta potential were also measured in storage conditions over 72 h to reveal their stability, and they maintained a uniform size and charge over this exposure time (Figure 2C). The stability of CCNPs was also compared to that of bare NPs and PEG NPs by measuring the hydrodynamic diameter of each when placed under serum conditions (Figure 2D). While bare NPs exhibited a large increase in size within 30 min of incubation, CCNPs retained their size, suggesting that the membrane coating inhibited formation of a protein corona and limited aggregation, similar to how PEG in PEG NPs provides colloidal stability in dynamic serum-containing conditions (Figure 2D). The size and charge stability and low drug release of CCNPs in storage and serum conditions indicate that CCNPs have potential for clinical translation because both storage stability during transport prior to dosing subjects and limited drug release during intravenous travel to target sites in the body are necessary for clinical success. Overall, these assays demonstrate that CCNPs can be loaded with ABT-737 and offer a more stable drug delivery vehicle compared to bare NPs.
Cancer Cell Membrane Wrapping Enables Preferential and Enhanced NP Interaction with TNBC Cells.
We moved forward to investigate if CCNPs preferentially bind targeted 4T1 cells versus nontargeted breast epithelial cells and whether 4T1 cells internalize more CCNPs than control NPs. To evaluate this, we used 4T1 cells, the source of the CCNP membranes, as the targeted cancer cells and EpH4-Ev murine breast epithelial cells derived from the mammary gland as our nontargeted cell line as such cells would be found in breast tissue surrounding tumor regions in the patient setting. To allow NP visualization by fluorescence confocal microscopy, we loaded NPs with DiD fluorophores as a model cargo in place of nonfluorescent ABT-737 and we also stained the 4T1 membrane vesicles with lipophilic membrane red-fluorescent dye PKH26, pseudocolored green for imaging purposes, prior to CCNP membrane wrapping. 4T1 and EpH4-Ev cells were treated with DiD-loaded bare NPs, PEG NPs, or CCNPs at equal fluorescent values for 30 min, 2 h, or 4 h, and the cells were stained for nuclei (DAPI, blue) or actin (phalloidin, fuchsia) prior to imaging. Representative images at the 4 h time point show that CCNPs were extensively taken up by targeted 4T1 cells with minimal uptake by nontargeted EpH4-Ev cells (Figure 3A). Within the 4T1 cells, there was colocalization between the DiD cargo and PKH26 stained membrane (colocalization appears as yellow in images), indicating the CCNPs were intact after internalization. Flow cytometry was also performed to quantitatively measure the amount of DiD CCNP uptake by 4T1 versus EpH4-Ev cells (Figure 3B,C) and to evaluate if CCNPs had greater uptake by 4T1 cells than unwrapped (bare) and stealth (PEG) control NPs (Figures 3D). DiD CCNPs had significantly greater uptake in 4T1 target cells than in nontarget EpH4-Ev cells at all time points, with ~30 times more uptake in 4T1 cells than EpH4-Ev cells after 4 h of incubation (quantitative analysis of median DiD signal, taken to correlate with NP uptake, in Figure 3B; representative flow cytometry histograms of untreated cells and CCNP-treated cells at 4 h in Figure 3C). When comparing the ability of CCNPs or control NPs to enter 4T1 cells, we found that DiD CCNPs had ~17 and ~198 times greater uptake than bare NPs and PEG NPs, respectively, after 4 h, as shown in the representative flow cytometry histogram plot in Figure 3D and quantitatively in Figure S2. The dramatically improved uptake of CCNPs by targeted 4T1 cells compared to other control NPs may be attributed to the membrane coating enabling recognition by 4T1 cells. These studies agree with prior work that has shown that using cancer cell membranes as a NP coating can increase interaction with homotypic cells.45,48,49
Figure 3.
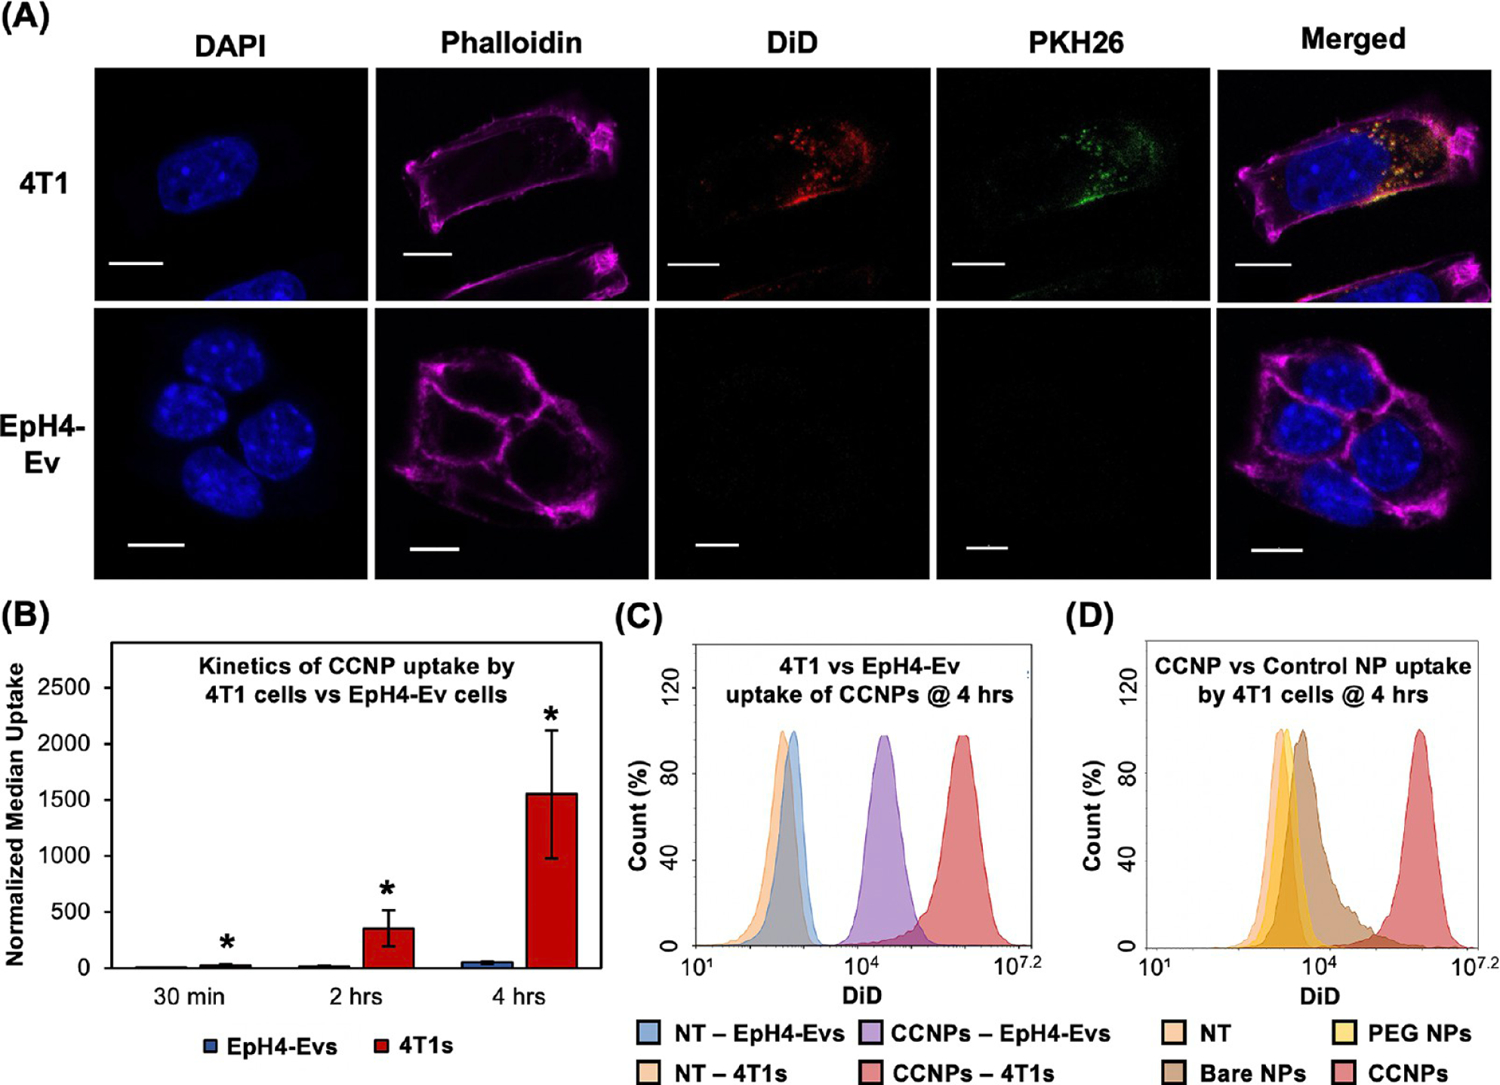
Cancer cell membrane wrapping enables preferential NP interaction and increases uptake in TNBC cells. (A) Confocal microscopy images of DiD-loaded CCNP uptake by nontargeted EpH4-EV breast epithelial cells or target 4T1 cancer cells after 4 h of incubation. Cell nuclei are blue (DAPI), actin is fuchsia (phalloidin), NP cargo is red (DiD), cell membranes on CCNPs are green (PKH26), and colocalized NP cargo and CCNP membranes create yellow. Scale bars = 10 μm. (B) Median fluorescence intensity (MFI) of DiD in EpH4-Ev vs 4T1 cells after 30 min, 2 h, or 4 h of incubation with DiD CCNPs as measured by flow cytometry (n = 4). * indicates p < 0.05 versus EpH4-Ev at the same time point by Student’s t test. Error bars represent standard deviation. (C) Representative flow cytometry histogram of EpH4-Ev or 4T1 cells after 4 h of incubation with DiD CCNPs compared to saline treated controls (NT). (D) Representative flow cytometry histogram of 4T1 cells treated with DiD-loaded bare NPs, PEG NPs, or CCNPs after 4 h of incubation compared to saline treated controls (NT).
ABT CCNPs Regulate Bcl-2 mRNA and Protein Expression in TNBC Cells.
To determine the therapeutic potential of CCNPs, we evaluated their ability to reduce Bcl-2 mRNA and protein expression in 4T1 cells with qRT-PCR and Western blotting, respectively. 4T1 cells were treated with 7 μM ABT-737 free or loaded in bare NPs, PEG NPs, or CCNPs for 48 h. Bare NPs and CCNPs without any cargo (empty bare NPs and empty CCNPs) were used as nontherapeutic controls and to ensure the NP core and membrane coating on CCNPs had no effect on Bcl-2 mRNA expression. These samples were added to cells at particle concentrations equivalent to those of bare NPs or CCNPs, respectively. After 48 h, ABT-loaded CCNPs reduced Bcl-2 mRNA expression by 55% which is similar to the knockdown caused by free ABT (50%) and greater than the knockdown caused by bare NPs (5%) or PEG NPs (16%) (Figure 4A). Empty NPs had a negligible and insignificant effect on Bcl-2 mRNA expression, thus affirming that the CCNPs’ therapeutic effects are due to the successful release of ABT-737 in the cytosol after cellular internalization. The similar knockdown of Bcl-2 mRNA expression by free ABT and CCNPs suggests that ABT does not lose its potency upon nanoencapsulation. As ABT-737 is unable to be delivered freely intravenously due to its insolubility and cytotoxicity, the ability to load it in CCNPs without reducing its efficacy is important. To corroborate the PCR results, Western blotting for Bcl-2 protein expression was performed as described in the Methods. Figure 4B displays representative Western blot protein bands above the densitometry data for each test group. ABT CCNPs significantly reduced Bcl-2 protein levels in 4T1 cells by ~75% compared to untreated cells, which was ~2.5–3 times greater knockdown than that achieved with freely administered ABT-737, PEG NPs, or bare NPs. Together, the qRT-PCR and Western blot results show that CCNPs were the most effective treatment in reducing Bcl-2 mRNA and protein expression in targeted 4T1 cells. Freely delivered ABT may have had a greater effect on Bcl-2 mRNA expression than protein expression because the drug was delivered without a vehicle in a short-term “burst” to cells. As ABT is relatively unstable in aqueous solutions, it was only able to suppress Bcl-2 mRNA expression but not protein expression at the examined 48 h time point. In comparison, ABT-loaded CCNPs yielded both mRNA and protein level knockdown of Bcl-2, indicating that the improved drug stability and slower drug release afforded by the CCNPs has beneficial effects.
Figure 4.
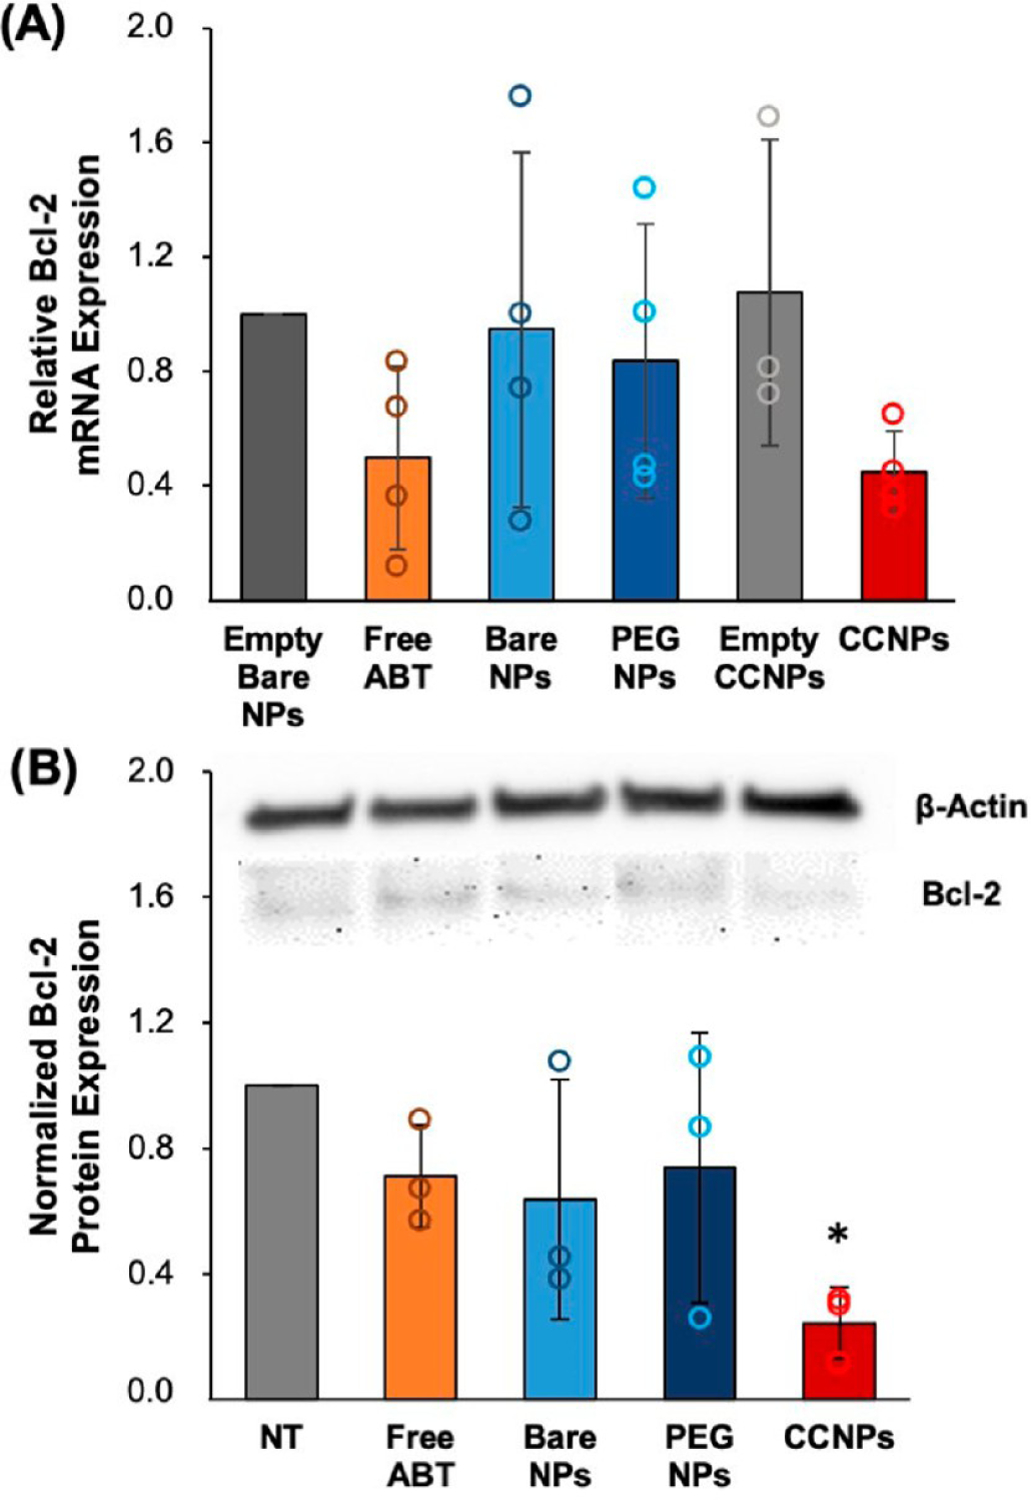
ABT CCNPs regulate the Bcl-2 mRNA and protein expression in TNBC cells. (A) qRT-PCR analysis of relative Bcl-2 mRNA expression in 4T1 cancer cells after treatment with 7 μM free ABT or ABT in NPs for 48 h (n = 4). Relative mRNA expression in NP treated groups is normalized to that of cells treated with unloaded PLGA NPs. (B) Representative Western blot bands for Bcl-2 and β-actin protein levels after 4T1 cells were treated with 7 μM free ABT or ABT in NPs for 48 h. Quasi-quantitative analysis of Bcl-2 protein expression from Western blots (n = 3). β-actin was used as a control and expression in NP-treated cells was normalized to expression in untreated cells (NT). *p < 0.05 versus NT by one-way ANOVA with post hoc Tukey. All error bars represent standard deviations.
ABT CCNPs Reduce TNBC Cell Proliferation and Induce Apoptosis In Vitro.
The downstream effects of Bcl-2 inhibition were investigated by performing MTT and AnnexinV/PI assays to measure cellular metabolic activity and apoptosis, respectively, after treatment of 4T1 and EpH4-Ev cells with free ABT or ABT-loaded NPs for 72 h at doses from 0 to 12 μM ABT (in increments of 2 μM). In 4T1 cells, ABT CCNPs had a half maximal inhibitory concentration, or IC50, of ~3 μM, which was ~1.6 times less than the ~5 μM IC50 for freely administered ABT and ~3.3 times less than the ~10 μM IC50 for bare NPs and PEG NPs (Figure 5A). This indicates that ABT CCNPs are more potent against 4T1 cell metabolic activity than free ABT or ABT-loaded control NPs. In EpH4-Ev cells, ~10 μM ABT CCNPs was required to reduce metabolic activity by 50% (Figure S3A), compared to 6–7 μM for free ABT. The higher dose of CCNPs needed to inhibit metabolic activity in EpH4-Ev cells relative to 4T1 cells indicates that CCNPs have potential to deliver ABT to tumors at therapeutically relevant levels in vivo without inducing off-target effects in cells in the surrounding tumor microenvironment. The safety of CCNPs is further evidenced by MTT assays that showed that empty PLGA NPs, empty PEG NPs, and empty CCNPs had no negative effect on 4T1 cell metabolic activity (Figure S3B); hence, the therapeutic effect of ABT CCNPs can be solely attributed to the successful intracellular delivery of ABT. A table listing the significance between each treatment type at each ABT-737 dosage is provided in the Supporting Information (Figure S4). ABT CCNPs significantly reduced metabolic activity compared to bare NPs or PEG NPs at all dosages >4 μM or >2 μM, respectively. Based on the results of the MTT assays, a dose of 7 μM was selected for subsequent in vitro studies.
Figure 5.
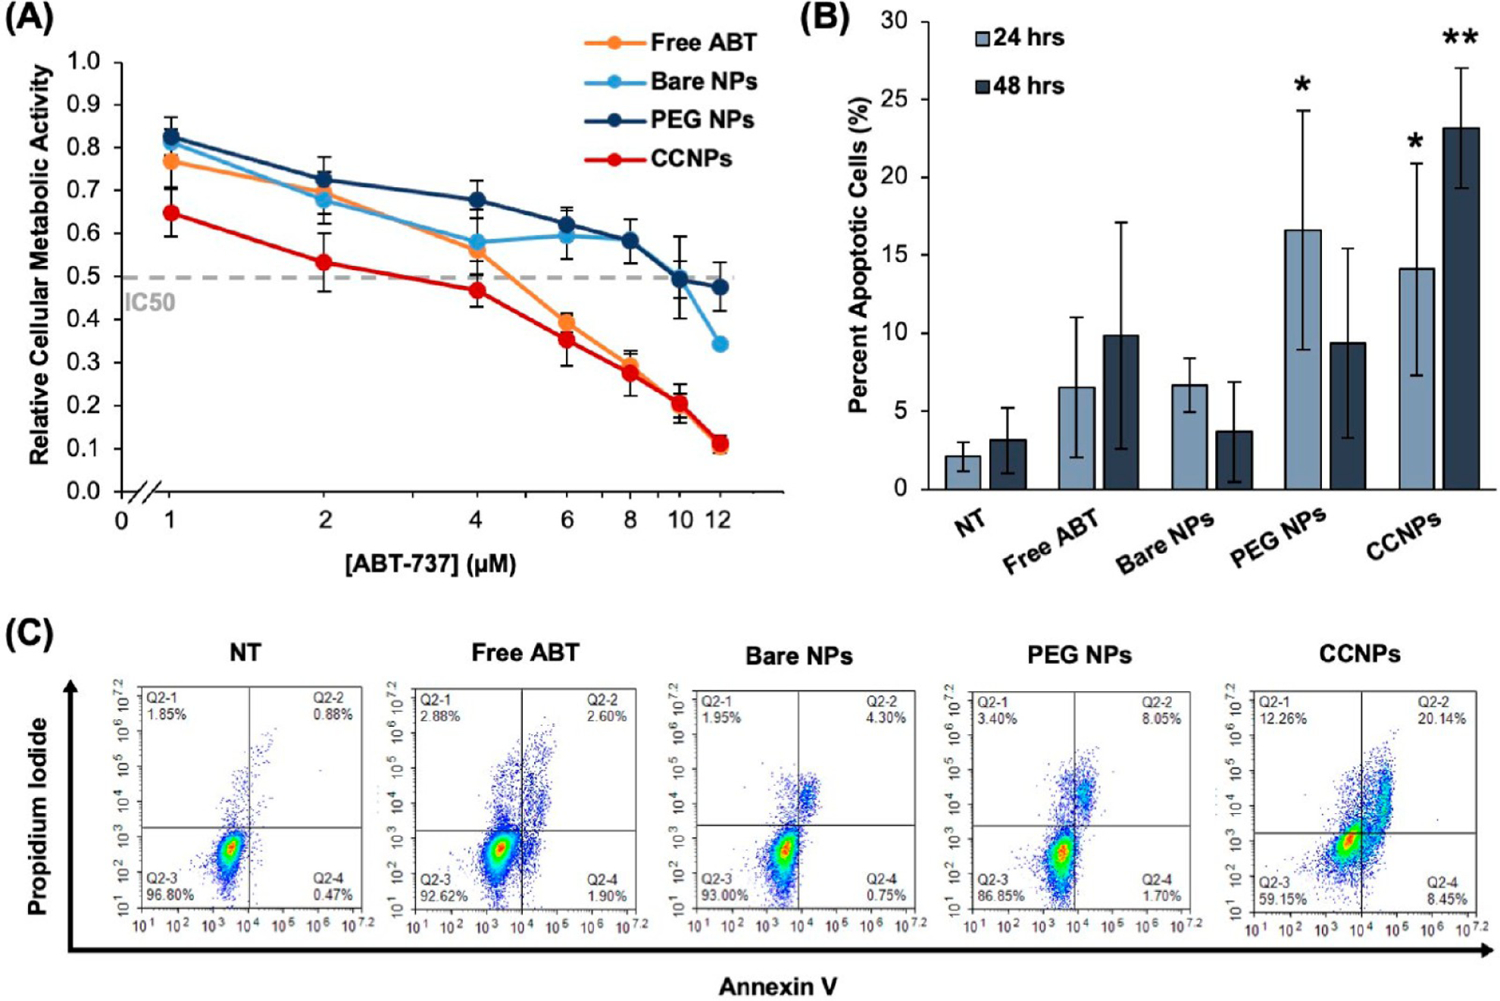
ABT CCNPs reduce TNBC cell proliferation and induce apoptosis in vitro. (A) Relative metabolic activity of 4T1 cancer cells treated with varying doses of ABT-737 delivered freely or in NPs for 72 h as measured by an MTT assay (free ABT (n = 9); bare NPs, PEG NPs, CCNPs (n = 7)). Horizontal gray dashed line indicates a reduction of metabolic activity by 50%. The concentration of ABT-737 is displayed on a logarithmic scale on the x-axis. A summary of statistical differences between groups at each ABT concentration is provided in Figure S4. (B) Percent of 4T1 cancer cells in early and late apoptosis after treatment with ABT-737 delivered freely or in NPs after 24 or 48 h as measured by an Annexin V/PI assay and flow cytometry (24 h (n = 4); 48 h (n = 3)).* indicates p < 0.01 versus NT in 24 h data and ** indicates p < 0.01 versus NT, free ABT, bare NPs, and PEG NPs in 48 h data by one-way ANOVA with post hoc Tukey–Kramer. (C) Representative scatter plots displaying fraction of 4T1 cells in early apoptosis (bottom right quadrant), late apoptosis (top right quadrant), or necrosis (top left quadrant) following 48 h of treatment with media only (NT), freely delivered ABT, or ABT delivered in NPs. Error bars in all plots represent standard deviation.
To confirm that ABT CCNPs were inducing apoptosis as would be expected in response to Bcl-2 inhibition, 4T1 cells were treated with 7 μM ABT free or within bare NPs, PEG NPs, or CCNPs for 24 or 48 h and subsequently stained with Annexin V-FITC and PI prior to flow cytometry analyses (Figure 5B,C). Cells staining positive for Annexin V only (bottom right quadrant) are undergoing early apoptosis, cells staining positive for Annexin V and PI (top right quadrant) are undergoing late apoptosis, and cells staining positive for PI only (top left quadrant) are undergoing necrosis (representative scatter plots displaying the fraction of cancer cells in each state after 48 h of treatment are shown in Figure 5C). After 24 h, ABT-loaded PEG NPs and CCNPs caused significant early and late apoptosis in 4T1 cells compared to media-only treated cells (NT) (Figure 5B). After 48 h, the effects of PEG NPs were reduced, while ABT CCNPs caused significantly greater apoptosis (~23% apoptosis) in 4T1 cells than NT, free ABT, bare NPs, and PEG NPs (Figure 5B). The increase in apoptosis from 24 to 48 h for ABT CCNP treated cancer cells may be attributed to the controlled release of the drug over this time frame, whereas bare NPs and PEG NPs may release the drug more quickly, reducing their apoptotic effect as time passes. These results confirm that ABT CCNPs have great potential as stable and therapeutic Bcl-2 inhibitor drug delivery vehicles as they can cause longer-lasting and increasing effects on apoptotic activity compared to free drugs, nontargeting NPs, or stealth-coated NPs.
Cancer Cell Membrane Wrapping Increases NP Accumulation in Orthotopic Tumors in Mice after Intravenous Administration.
After confirming that ABT CCNPs could preferentially bind and enter targeted 4T1 cells to inhibit Bcl-2 and induce apoptosis in vitro, we next investigated their tumor targeting capabilities in vivo using an orthotopic murine mammary fat pad tumor model. Female Balb/cJ mice bearing ~50–200 mm3 4T1 luciferase-expressing tumors in the fourth mammary fat pad were iv injected with 0.1 mg of DiD-loaded PEG NPs or CCNPs, or an equivalent volume of saline (100 μL) and then sacrificed ~24 h later. We did not include bare NPs in the in vivo studies because our previous experience has revealed that uncoated PLGA NPs quickly aggregate in serum conditions and are rapidly cleared from circulation after iv injection. Additionally, PEG NPs offer a more clinically relevant stealth control. After excision, the major organs and tumors were imaged with an IVIS to visualize the DiD signal in whole tissues ex vivo (Figure 6A). CCNPs exhibited remarkably more tumor accumulation than PEG NPs, which was quantified by recording tissue weight and calculating tumor radiant efficiency per tumor mass prior to homogenization (Figure 6B,C). The weight-normalized tumor radiant efficacy of CCNPs was 2.4 times that of PEG NPs, indicating that the membrane coating greatly enhanced tumor delivery (Figure 6C). After IVIS imaging, tumors and organs were weighed, homogenized, and measured for DiD fluorescence signal with a plate reader to corroborate the IVIS results. Calculation of the average fluorescence per tissue mass (mg) showed tumors of mice treated with DiD CCNPs had ~2.2 and ~4.9 times greater signal than those treated with DiD PEG NPs and saline, respectively, indicating significant tumor accumulation of CCNPs (Figure 6D). Other tissues with high CCNP and PEG NP accumulation were the spleen and liver, which was expected, as these are the normal filtration organs (Figure 6A,D). Of note, the liver is highly vascularized and the mice were not perfused at sacrifice, so the high CCNP signal may be partly due to particles remaining in circulation after 24 h. Overall, the IVIS and plate reader analyses confirm that CCNPs exhibit significant accumulation in mammary fat pad tumors after iv injection that is greater than that observed for stealth PEG NPs.
Figure 6.
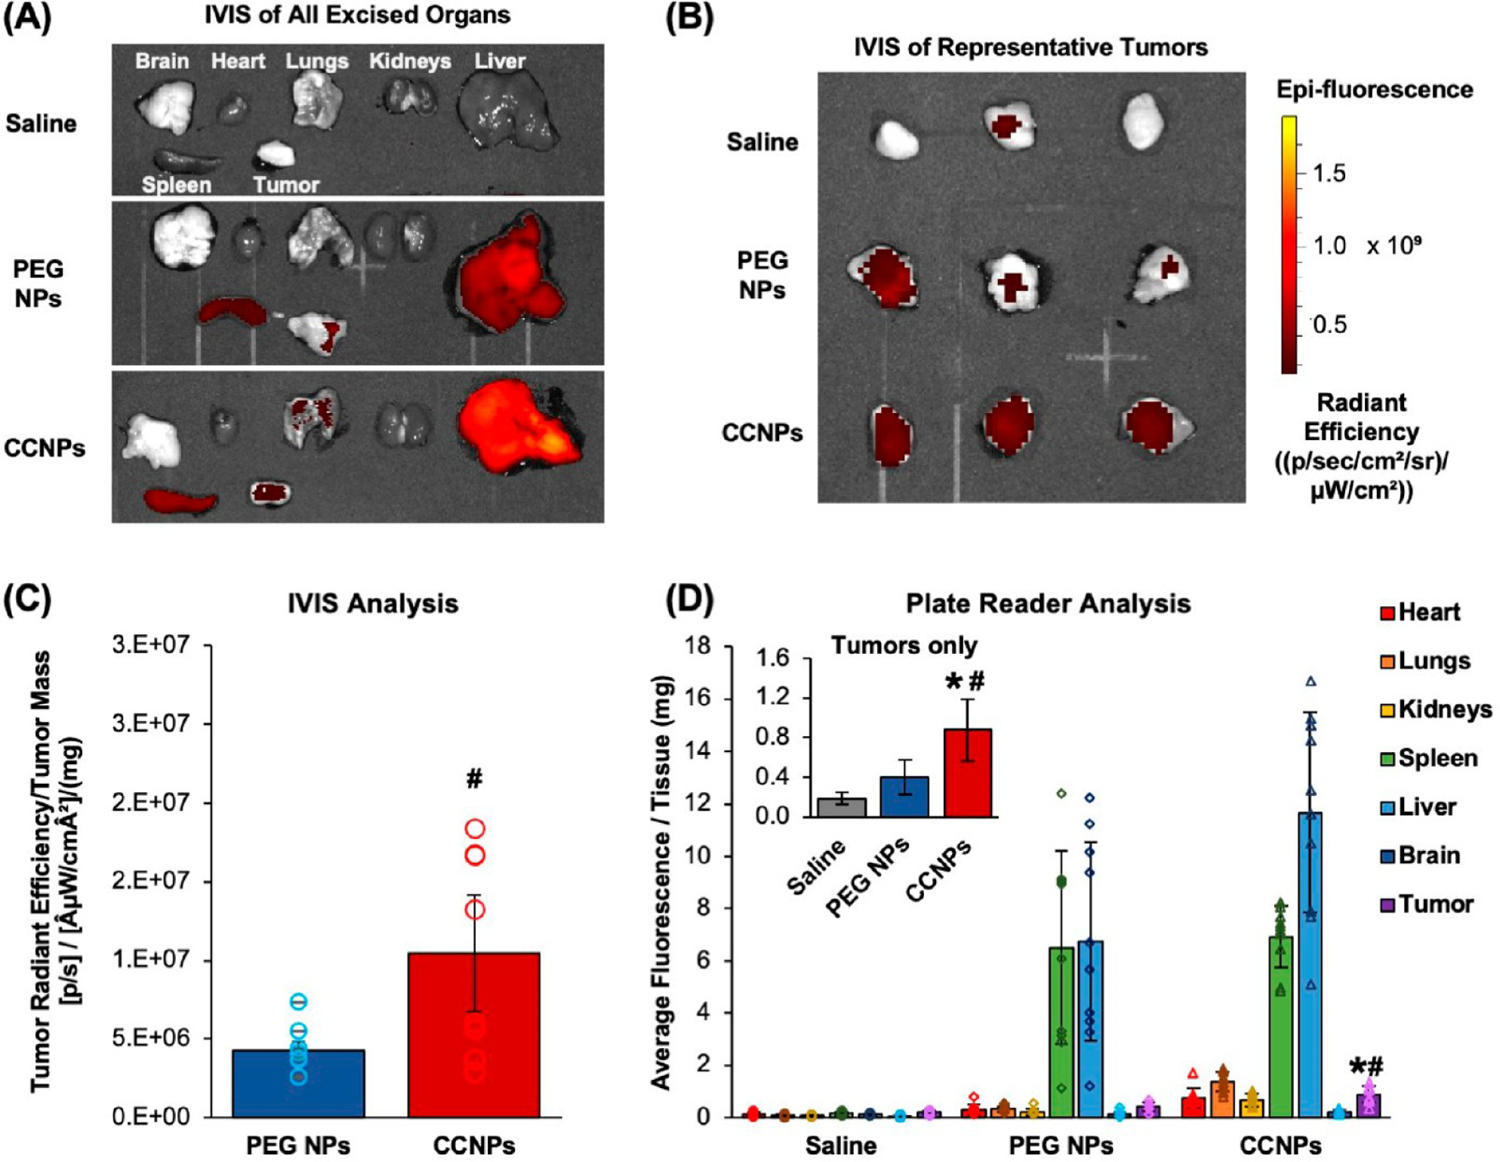
Cancer cell membrane wrapping increases the level of NP tumor accumulation after intravenous administration. (A) Representative images of DiD fluorescence in excised brain, heart, lungs, kidneys, liver, spleen, and tumors of mice injected with saline, 1 mg of PEG NPs, or 1 mg of CCNPs 24 h prior. (B) Representative images of DiD fluorescence in ex vivo tumors only. Radiant efficiency scale bar applies to images in both parts A and B. (C) Average tumor radiant efficiency measured by IVIS per milligram of excised tumor tissue (bars) plotted along with individual values for each mouse (open circles) (n = 8 per group). # indicates p < 0.05 for PEG NPs versus CCNPs as determined by one-way ANOVA with post hoc Tukey. Error bars represent standard error. (D) Average fluorescence intensity of DiD per milligram of homogenized tissues measured with a plate reader (bars) plotted along with individual values for each mouse per organ (open symbols). Inset shows tumors only for ease of comparison and is also provided in Figure S5 with individual data points for each mouse (saline (n = 8); PEG NPs (n = 10); CCNPs (n = 10)). Significance between saline and CCNPs denoted as *, and significance between PEG NPs and CCNPs denoted as #. *p < 0.01 for CCNPs versus saline and #p < 0.01 for CCNPs versus PEG NPs by one-way ANOVA with post hoc Tukey–Kramer. Error bars represent standard deviation.
ABT CCNPs Show Potential as a Safe Treatment for TNBC.
Using the same orthotopic murine mammary fat pad tumor model, we investigated the therapeutic potential and biocompatibility of ABT CCNPs in vivo. Female Balb/cJ mice bearing orthotopic 4T1 luciferase-expressing tumors of ~50–200 mm3 in the fourth mammary fat pad were iv injected twice per week for 4 weeks (eight treatments total) with saline, ABT PEG NPs or ABT CCNPs at a dose of ~2 mg of ABT-737 per kilogram. The scheme in Figure 7A displays the treatment schedule and subsequent biweekly monitoring of tumor growth with digital Vernier calipers and mouse weight measurements. Mice were euthanized if there was weight loss >20% from the day of cell injection or if tumor volume exceeded 1000 mm3 based on the tumor volume formula of ((L × W2)/2). A Kaplan–Meier survival curve was created to display the survival rate (%) of mice treated with saline or ABT-loaded PEG NPs or CCNPs (Figure S6). Over the injection period, PEG NPs and CCNPs did not cause >20% weight loss in any mouse (Figure 7B), which shows that CCNPs do not have a negative effect on body weight. ABT CCNPs modestly reduced tumor burden within the first 3 weeks of treatment, but the effects diminished at week 4 after treatment ended (Figure 7C). We postulate that increasing the concentration of ABT-737 administered per NP injection, beginning the treatment earlier, or increasing the number or frequency of doses may lead to greater tumor inhibition and volume reduction. After sacrificing mice when tumors reached >1000 mm3, blood samples were taken from each mouse via cardiac puncture for subsequent blood analyses (Figure 7D). While ABT-loaded PEG NPs reduced red blood cell counts and increased white blood cell counts compared to saline treated mice (pointing to the inherent toxicity of the drug), ABT-loaded CCNPs did not adversely affect blood composition or show signs of thrombocytopenia, a notorious side effect of ABT. This, coupled with the better maintenance of body weight observed for CCNPs compared to PEG NPs (Figure 7B), suggests that encapsulating ABT in CCNPs to facilitate targeted tumor delivery of the drug may provide a means to overcome its toxicity.
Figure 7.
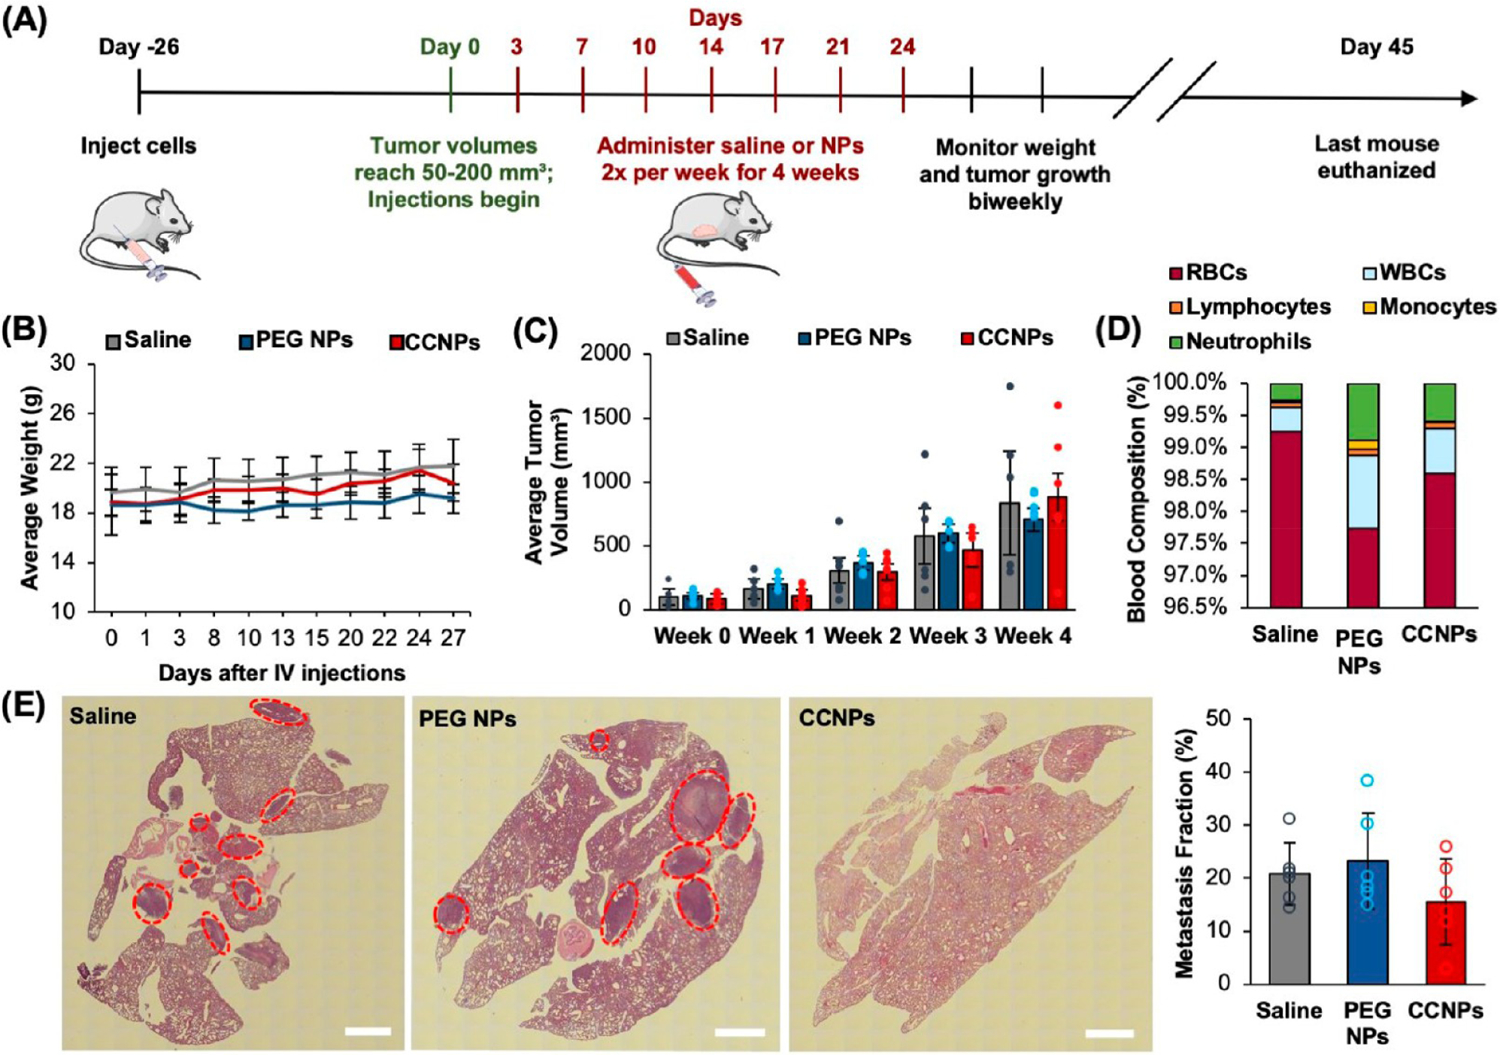
Analysis of ABT CCNP safety and impact on tumor growth and lung metastasis in a syngeneic orthotopic 4T1 murine tumor model. (A) Time line of treatment for therapeutic study. Female Balb/cJ mice were inoculated with 100,000 luciferase-expressing 4T1 cells in the 4th mammary fat pad and monitored until tumors reached 50–200 mm3. Mice were then iv injected with saline, ABT PEG NPs, or ABT CCNPs at 1 mg PLGA per mouse (corresponding to ~2 mg ABT-737/kg) twice per week for 4 weeks for a total of 8 injections. (B) Average weight of tumor-bearing mice throughout the treatment period. (C) Average tumor volume of saline or NP treated mice as measured with digital Vernier calipers (volume = (L × W2)/2) after each week of iv injections. Tumor volumes for individual mice are plotted as closed circles. (D) Average blood composition from saline or NP treated mice after euthanasia. WBC = white blood cells; RBC = red blood cells. (E) Representative H&E-stained lung sections used to measure metastatic area in lungs from mice treated with saline or ABT-loaded PEG NPs or CCNPs. Red circles in H&E sections indicate distinctive metastatic nodules. Open circles in bar graph indicate data for individual mice. Scale bars = 1 mm. For each of these studies the samples sizes were saline (n = 6), PEG NPs (n = 5), and CCNPs (n = 7). Errors bars in all graphs show standard deviation.
At the end of the study, organs and tumors were removed from mice and histological sections of tissues were stained with hematoxylin and eosin (H&E) to show tissue morphology. Since the 4T1 mammary fat pad tumor model used in this study exhibits spontaneous metastasis to the lungs, H&E-stained lung sections were analyzed for metastases and the area of tumor cells was divided by the total tissue area (both measured with ImageJ) to quantify the metastatic area (%) in lung samples from each mouse (Figure 7E). The metastatic area was 20.8% in saline mice, 23.3% in ABT PEG NP mice, and 15.6% in ABT CCNP treated mice, meaning that ABT CCNPs reduced formation of lung metastases by 25% and 33% when compared to saline and ABT PEG NP controls, respectively, although the difference was not statistically significant at the 95% confidence level. H&E-stained nontumor organs from each test group exhibited normal morphology, showing that ABT CCNPs do not cause off-target toxicity in other tissues during treatment (Figure S7). Collectively, these data indicate that ABT CCNPs have promise as TNBC therapeutics but that doses above 2 mg ABT/kg mouse weight may be necessary to eradicate primary tumors and prevent metastasis.
Molecular Effects of ABT CCNPs on the Tumor Microenvironment.
Given the observed effects of ABT CCNPs on tumor growth and metastasis, we further analyzed their impact at the molecular level in the tumor microenvironment to provide insight into how the CCNP formulation increased the anticancer effects of the encapsulated drug. Since the direct target of ABT-737 is Bcl-2, tumor sections were stained for Bcl-2 expression, and images of tumors from mice in different treatment groups that were sacrificed on the same day were analyzed in ImageJ to quantitatively compare Bcl-2 expression. As there was no single day where a mouse from all three treatment groups reached the euthanasia criteria (Figure S6), we compared CCNPs against PEG NPs on Day 29 and CCNPs against saline on Days 27 and 34. CCNPs reduced Bcl-2 expression in tumors by 2.2 times compared to PEG NP treated mice sacrificed on Day 29 (Figure 8A), and CCNPs reduced Bcl-2 expression by 2.6 and 2.9 times compared to saline treated mice sacrificed on Days 27 and 34, respectively (Figure 8B,C). Larger versions of the images of tumor centers from mice sacrificed on Days 29 and 34 are provided in Figure S8. These significant reductions in intratumoral Bcl-2 expression affirm that CCNPs can enhance the anticancer effects of ABT-737 even at low drug dosages, which we attribute to their improved accumulation in tumors after intravenous delivery (Figure 6).
Figure 8.
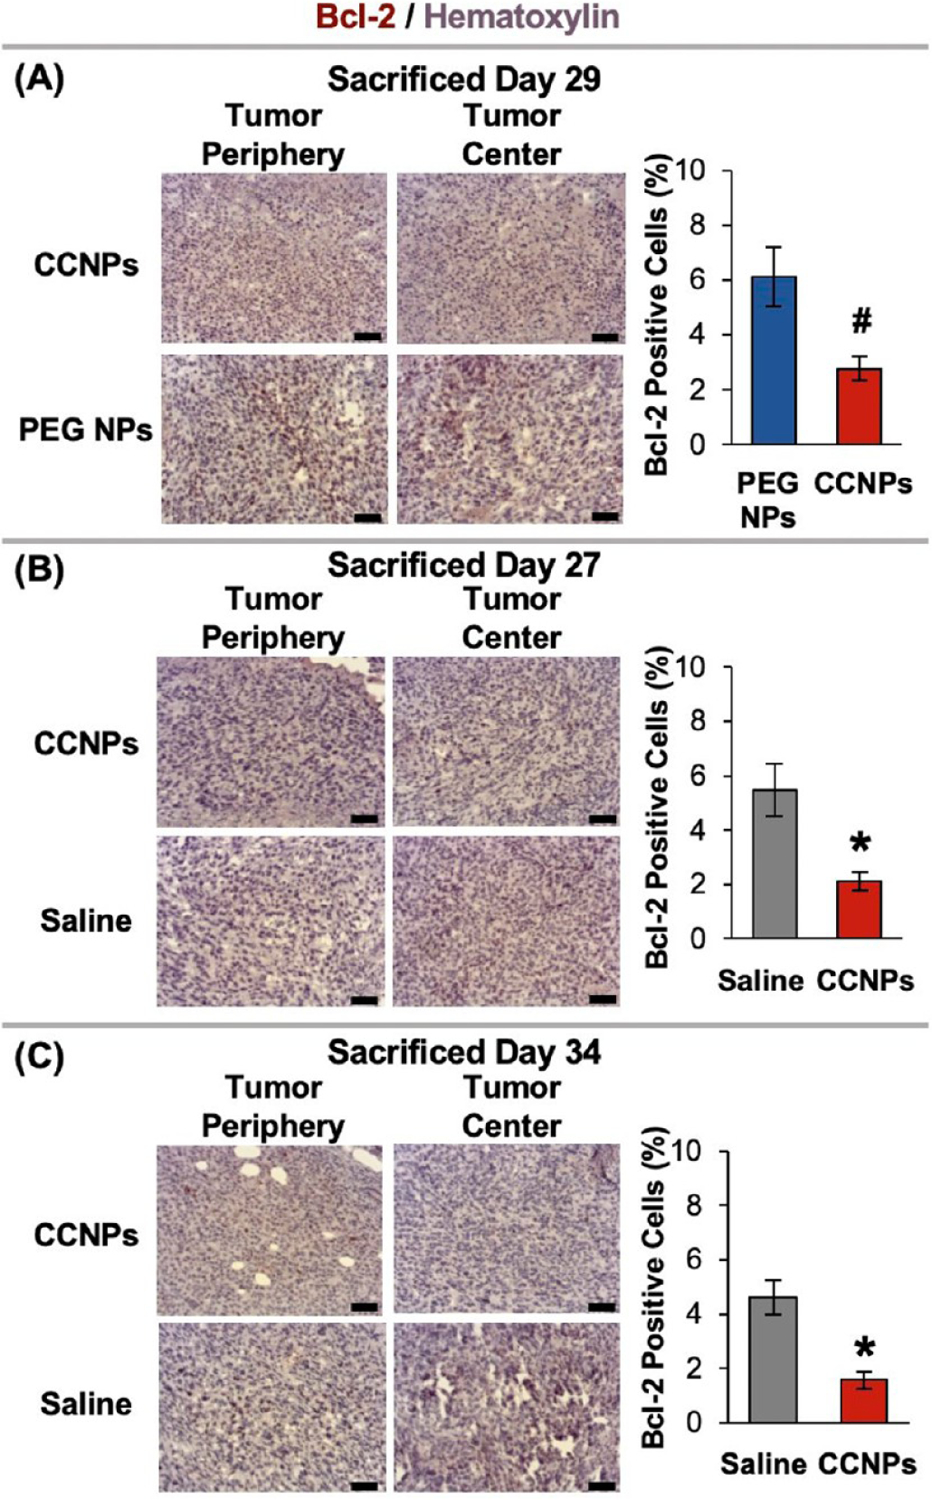
Representative Bcl-2-stained tumor sections from mice treated with saline, ABT-loaded PEG NPs, or CCNPs. Tumor sections grouped by treatment type and matched by day of sacrifice. Scale bars = 50 μm. Sample sizes were saline (n = 6), PEG NPs (n = 5), and CCNPs (n = 7). *p < 0.01 for CCNPs as compared to saline or #p < 0.01 for CCNPs as compared to PEG NPs by Student’s t test. Error bars represent standard error.
To further assess the molecular level effects of the delivered drug, additional tumor sections were stained for Ki67 (to assess tumor cell proliferation) or active caspase-3 (aCasp-3, to assess tumor cell apoptosis) using hematoxylin as a counterstain. Tumor sections stained with Ki67 (Figure 9A–C) and aCasp-3 (Figure 9D–F) were grouped based on treatment type and day of sacrifice, and the tumor periphery and tumor centers were imaged (larger images of tumor centers provided in Figure S8). ImageJ was used to count total cells in images and then individually count positive cells to report the percentage of positive cells. In mice sacrificed 29 days after treatment initiation, CCNPs significantly reduced Ki67 expression by ~2.2 times compared to PEG NP treated mice (Figure 9A). ABT CCNPs also reduced cell proliferation in mice 34 days after treatment initiation compared to saline-treated mice, although the difference was not statistically significant at this time point (Figure 9C). CCNPs increased aCasp-3 expression in tumors by 1.6 times at Day 29 compared to PEG NP treated mice (Figure 9D). Moreover, they significantly increased aCasp-3 expression by 15.8 times compared to saline treated mice at Day 27 (Figure 9E) and maintained 2.2 times increased aCasp-3 expression over saline treated mice at Day 34 (Figure 9F). These results indicate CCNPs trigger greater levels of apoptosis throughout the entirety of CCNP treated tumors even after the treatment period ended on Day 24. We hypothesize that CCNPs were able to reduce proliferation and cause greater apoptosis throughout the tumor volume compared to controls because they successfully delivered a greater amount of stable ABT-737 to and throughout the tumor site. Future work using increased doses of ABT-737 in NPs should sacrifice mice from each treatment group on the same day intentionally so that the molecular level effects in histology sections can be compared in a single cohort at the same time point.
Figure 9.
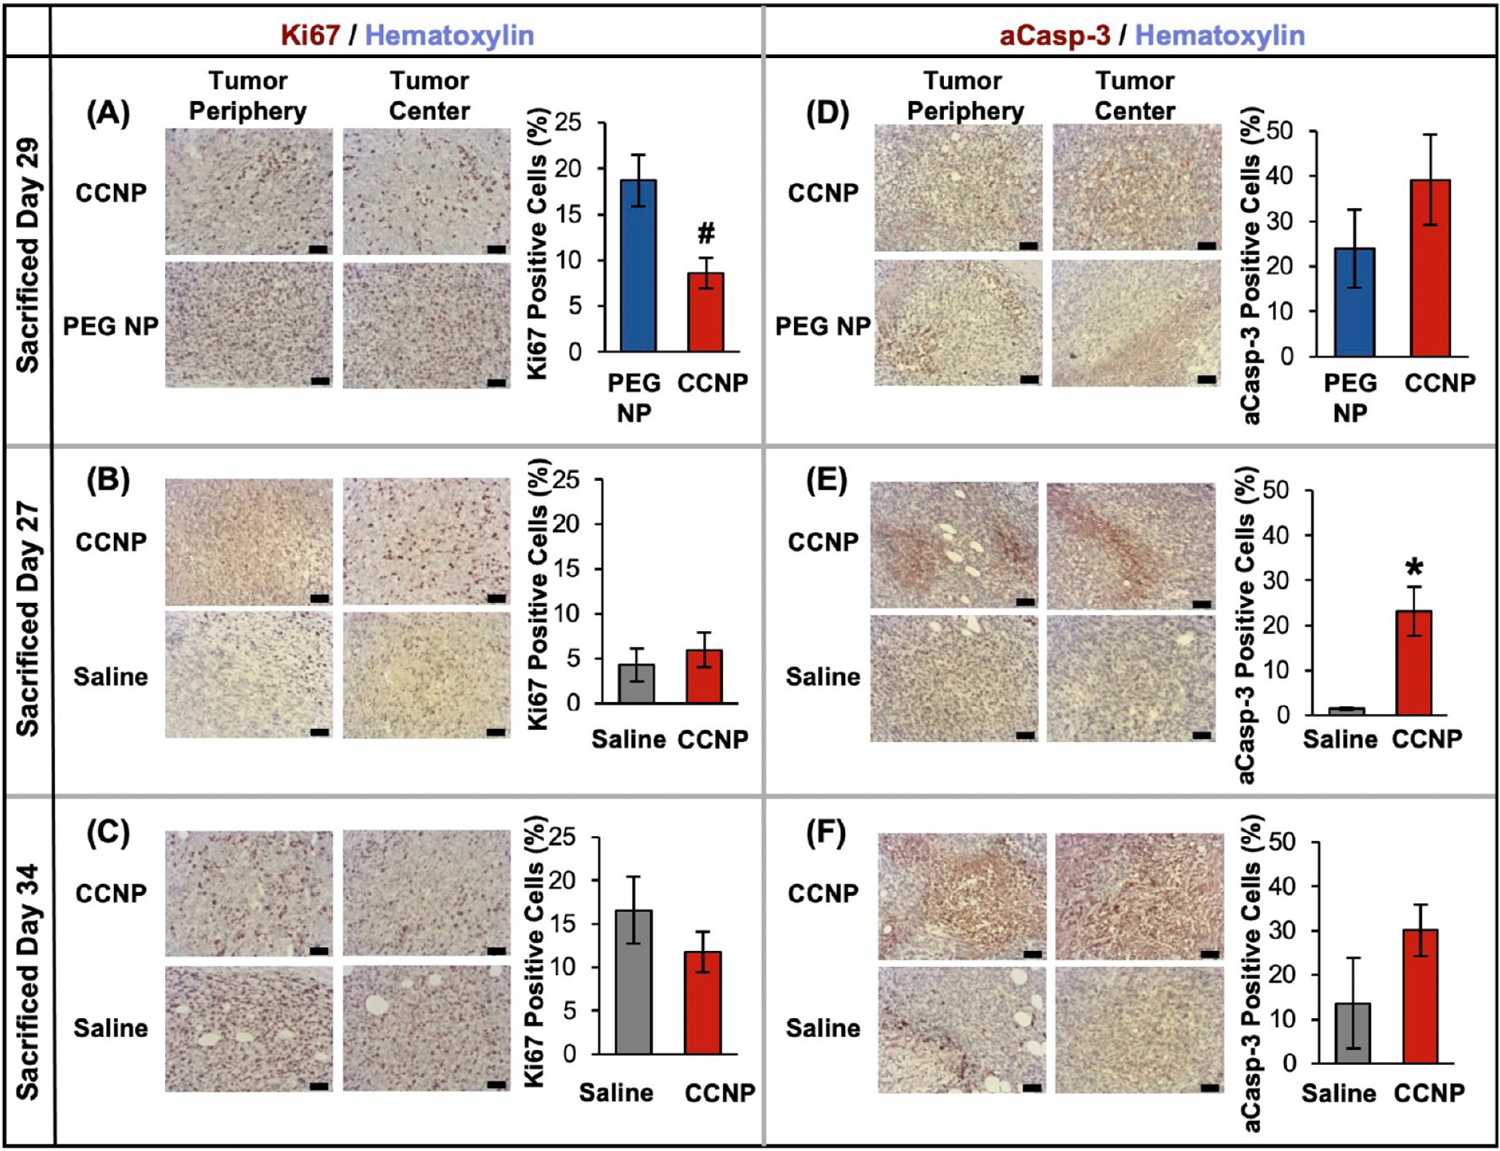
Representative stained tumor sections from mice treated with saline or ABT-loaded PEG NPs or CCNPs. Tumor sections grouped by treatment type and matched by day of sacrifice then organized by molecular marker: Ki67 (A–C), active caspase-3 (aCasp-3) (D–F). Hematoxylin = blue/light purple; Ki67, aCasp3 = brown/maroon; Scale bars = 50 μm. Sample sizes were saline (n = 6), PEG NPs (n = 5), and CCNPs (n = 7). *p < 0.01 for CCNPs as compared to saline and #p < 0.01 for CCNPs as compared to PEG NPs by Student’s t test. Error bars represent standard error.
Notably, previous studies applying ABT nanocarriers to tumor-bearing mice used doses that were 25, 20, or 5 times the amount of ABT-737 administered per mouse (mg/kg) in this study, and they also delivered ABT along with another drug or antibody therapy to induce anticancer effects in vivo.38,39,41 Our results indicate that a low dose of ~2 mg/kg ABT-737 delivered via CCNPs without additional drugs or antibody cargos can significantly increase apoptosis and decrease cell proliferation and Bcl-2 expression throughout TNBC tumor volumes while maintaining normal animal body weight and blood composition. These molecular effects translated into moderate reductions in the primary tumor volume and lung metastasis burden. These positive results are a direct benefit of the stability and homotypic targeting provided by surface markers on the CCNP cancer cell membrane exterior, which enable increased tumor accumulation. In the future, dose optimization studies may identify treatment parameters that yield complete tumor eradication rather than delayed tumor growth and provide even more robust antimetastasis effects.
CONCLUSION
In this study, we developed biomimetic NPs capable of delivering the Bcl-2 inhibitor ABT-737 to TNBC in vitro and in vivo to reinstate apoptosis in cancer cells. ABT-737-loaded CCNPs were successfully synthesized and exhibited stability in storage and physiological conditions. The membranes surrounding the NPs slowed drug release from the core in serum- and storage-based conditions compared to unwrapped NPs, improved TNBC cellular targeting in vitro, and enhanced accumulation in mammary fat pad tumors in vivo. CCNPs showed ~17 times greater uptake than bare NPs in targeted 4T1 cancer cells and ~30 times greater uptake by 4T1 cancer cells than by nontargeted epithelial cells after only 4 h of incubation in vitro. After 48 h of treatment, ABT CCNPs reduced Bcl-2 mRNA and protein expression more than all other control NP groups and free drug treatment. Congruently, ABT CCNPs reduced metabolic activity and increased apoptosis of 4T1 cells at a lower dosage of ABT-737 than drug delivered freely or in other NP controls. The preferential targeting of CCNPs was maintained in animal models, as CCNPs iv administered to mice bearing mammary fat pad tumors exhibited over 2 times greater tumor accumulation than PEG NPs after 24 h of biodistribution. When ABT CCNPs were administered to tumor-bearing mice at ~2 mg/kg ABT-737 per injection twice per week for 4 weeks, the dose was not high enough to eradicate primary tumors. However, this low dosage of ABT-737 delivered by CCNPs was still able to significantly decrease Bcl-2 expression throughout tumor volumes compared to both saline and ABT-loaded PEG NPs. Consistent with this result, the CCNPs also significantly reduced tumor proliferation compared to ABT-loaded PEG NPs and increased apoptosis throughout tumor volumes compared to saline or PEG NP treated mice. Additionally, ABT CCNPs reduced the formation of metastatic nodules in the lungs without negatively affecting blood composition, animal weight, or major organ histopathology. Overall, the in vitro and in vivo results support continued investigation of ABT CCNPs as tools to suppress Bcl-2 expression and to reinstate apoptosis in TNBC.
Future studies that build on this work can use this CCNP design as a template to synthesize a variety of nano-formulations for disease treatment applications. For example, more drug could be encapsulated in the polymer core, which would be expected to increase antitumor effects without increasing toxicity since the same mass of polymer could be administered per injection. Future studies exploring such an approach should carefully assess the maximum tolerated dose (MTD) to determine the upper limit of ABT CCNPs that can be administered without causing weight loss, thrombocytopenia, or other adverse effects. After the MTD was determined, pharmacokinetics should be evaluated to reveal where ABT-737 is located between the blood, major tissues, and tumors at various time points after iv administration. Pharmacokinetic analysis could provide valuable information to optimize the dosing regimen and schedule to increase the intratumoral ABT-737 concentration and minimize off-target toxicities.
Another way to increase efficacy would be to design CCNPs to encapsulate and deliver a variety of cargoes simultaneously, such as hydrophobic drugs or hydrophilic nucleic acids that suppress genes that drive drug resistance.50–52 For example, ABT-737 could be combined with compounds like norcantharidin or curcumin to provide synergistic combinatorial therapy of TNBC.53,54 Alternatively, CCNPs could be loaded with a more potent Bcl-2 inhibitor than ABT-737, such as ABT-199 or venetoclax, a new drug that has increased affinity for Bcl-2 and avoids binding Bcl-xL, thus reducing thrombocytopenia.32 Due to its success in preclinical trials and FDA phase I trials against various cancer types, ABT-199 may be more readily accepted as a cargo in cancer cell membrane wrapped NPs as it moves from benchtop application to clinical translation.32
Other strategies to increase CCNP efficacy might focus on the membrane exterior, which could be modified with additional ligands via lipid insertion or genetic engineering of source cells to further improve tumor cell targeting.55,56 Alternatively, hybrid membrane coatings could be created by fusing TNBC cell membranes with membranes derived from a second cell type (such as RBCs, platelets, or activated fibroblasts), in a similar approach to work described by Dehaini et al.57 Such modifications could increase circulation time, reduce immunogenicity, or enhance NP distribution throughout the tumor stroma, yielding robust antitumor effects.
Overall, this study shows promising results in that a Bcl-2 inhibitor drug (ABT-737) with poor aqueous solubility and notorious adverse side effects can be safely delivered to TNBC tumors without signs of toxicity by encapsulating it within CCNPs. There are several potential avenues by which the potency of this platform may be increased, owing to the great versatility of membrane-wrapped NP designs. In the future, Bcl-2 inhibitor drugs that were once abandoned in the clinic may achieve new success, thanks to the power of biomimetic nanotechnology.
Funding
This project was supported by the National Science Foundation under grant number DMR1752009. Funding was also provided by the National Institutes of Health (NIH) under award number R01CA211925. Histology was supported by the Delaware Center for Musculoskeletal Research (DCMR) COBRE program under NIH-NIGMS award number P20GM139760. D.E.W. acknowledges support from the University of Delaware Summer Scholars Program.
Supplementary Material
ACKNOWLEDGMENTS
We thank S. Modla for assistance with TEM sample preparation and imaging of nanoparticles. We thank C. Riley for assistance with the histological processing and staining of excised organs. We thank Dr. G. Talham and Christine Stinger for guidance and assistance with in vivo studies.
ABBREVIATIONS
- Bcl-2
B-cell lymphoma
- TNBC
triple negative breast cancer
- NP
nanoparticle
- PEG
poly(ethylene glycol)
- PLGA
poly(lactic-co-glycolic acid)
- T-ALL
T cell acute lymphoblastic leukemia
- CCNP
cancer cell membrane wrapped NP
- TEM
transmission electron microscopy
- NTA
nanoparticle tracking analysis
- DLS
dynamic light scattering
- SDS-PAGE
sodium dodecyl sulfate–polyacrylamide gel electrophoresis
- bare NP
bare ABT-737 loaded PLGA NP
- Membranes
4T1 cell membrane vesicles
- ABT CCNP
ABT-737 loaded CCNP
- EE%
encapsulation efficiency
- PEG NP
ABT-737 loaded PEG–PLGA copolymer NP
- FBS
fetal bovine serum
- iv
intravenous
- DiD
1,1′-dioctadecyl-3,3,3′,3′-tetramethylindodicarbocyanine, 4-chlorobenzenesulfonate salt
- qRT-PCR
quantitative reverse transcriptase-polymerase chain reaction
- NT
no treatment
- PI
propidium iodide
- IVIS
in vivo imaging system
- H&E
hematoxylin and eosin
- aCasp3
active caspase-3
- Dox
doxorubicin
- RBC
red blood cell
- DMSO
dimethyl sulfoxide
- DCM
dichloromethane
- PVA
poly(vinyl alcohol)
- BCS
bovine calf serum
- PBS
phosphate buffered saline
- TBS-T
tris buffer saline with 0.1% Tween-20
- EtOH
ethanol
Footnotes
Complete contact information is available at: https://pubs.acs.org/10.1021/acs.molpharmaceut.3c00009
The authors declare no competing financial interest.
Contributor Information
Mackenzie A. Scully, Department of Biomedical Engineering, University of Delaware, Newark, Delaware 19713, United States
Dana E. Wilkins, Department of Biomedical Engineering, University of Delaware, Newark, Delaware 19713, United States
Megan N. Dang, Department of Biomedical Engineering, University of Delaware, Newark, Delaware 19713, United States
Elise C. Hoover, Department of Biomedical Engineering, University of Delaware, Newark, Delaware 19713, United States
Sara B. Aboeleneen, Department of Biomedical Engineering, University of Delaware, Newark, Delaware 19713, United States
Emily S. Day, Department of Biomedical Engineering, University of Delaware, Newark, Delaware 19713, United States Department of Materials Science and Engineering, University of Delaware, Newark, Delaware 19716, United States; Helen F. Graham Cancer Center and Research Institute, Newark, Delaware 19713, United States.
REFERENCES
- (1).Aubrey BJ; Kelly GL; Janic A; Herold MJ; Strasser A How does p53 induce apoptosis and how does this relate to p53-mediated tumour suppression? Cell Death Differ. 2018, 25, 104–113. [DOI] [PMC free article] [PubMed] [Google Scholar]
- (2).Adams JM; Cory S The Bcl-2 apoptotic switch in cancer development and therapy. Oncogene 2007, 26, 1324–1337. [DOI] [PMC free article] [PubMed] [Google Scholar]
- (3).Haupt S; Berger M; Goldberg Z; Haupt Y Apoptosis - The p53 network. J. Cell Sci 2003, 116, 4077–4085. [DOI] [PubMed] [Google Scholar]
- (4).Klasa RJ; Gillum AM; Klem RE; Frankel SR Oblimersen Bcl-2 antisense: Facilitating apoptosis in anticancer treatment. Antisense and Nucleic Acid Drug Development. 2002, 12 (13), 193–213. [DOI] [PubMed] [Google Scholar]
- (5).Opydo-Chanek M; Mazur L Comparison of in vitro antileukemic activity of obatoclax and ABT-737. Tumor Biol. 2016, 37, 10839–10849. [DOI] [PMC free article] [PubMed] [Google Scholar]
- (6).Zhai D; Jin C; Satterthwait AC; Reed JC Comparison of chemical inhibitors of antiapoptotic Bcl-2-family proteins. Cell Death and Differentiation 2006, 13, 1419–1421. [DOI] [PubMed] [Google Scholar]
- (7).Baggstrom MQ; Qi Y; Koczywas M; et al. A phase II study of AT-101 (Gossypol) in chemotherapy-sensitive recurrent extensive-stage small cell lung cancer. J. Thorac. Oncol 2011, 6, 1757–1760. [DOI] [PMC free article] [PubMed] [Google Scholar]
- (8).LaBelle JL; Katz SG; Bird GH; et al. A stapled BIM peptide overcomes apoptotic resistance in hematologic cancers. J. Clin. Invest 2012, 122 (6), 2018–2031. [DOI] [PMC free article] [PubMed] [Google Scholar]
- (9).Billard C BH3 mimetics: Status of the field and new developments. Mol. Cancer Ther 2013, 12, 1691–1700. [DOI] [PubMed] [Google Scholar]
- (10).Oltersdorf T; Elmore SW; Shoemaker AR; et al. An inhibitor of Bcl-2 family proteins induces regression of solid tumours. Nature. 2005, 435 (7042), 677–681. [DOI] [PubMed] [Google Scholar]
- (11).Florent R; Weiswald L-B; Lambert B; et al. Bim, Puma and Noxa upregulation by Naftopidil sensitizes ovarian cancer to the BH3-mimetic ABT-737 and the MEK inhibitor Trametinib. Cell Death Dis. 2020, 11 (5), 380. [DOI] [PMC free article] [PubMed] [Google Scholar]
- (12).Oakes SR; Vaillant F; Lim E; et al. Sensitization of BCL-2-expressing breast tumors to chemotherapy by the BH3 mimetic ABT-737. Proc. Natl. Acad. Sci. U. S. A 2012, 109 (8), 2766–2771. [DOI] [PMC free article] [PubMed] [Google Scholar]
- (13).Pearce MC; Satterthwait AC; Zhang X; Kolluri SK Cancer therapeutics based on BCL-2 functional conversion. Apoptosis. 2019, 24, 1–2. [DOI] [PubMed] [Google Scholar]
- (14).El-Zein RA; Abdel-Rahman S; Santee KJ; Yu R; Shete S Identification of Small and Non-Small Cell Lung Cancer Markers in Peripheral Blood Using Cytokinesis-Blocked Micronucleus and Spectral Karyotyping Assays. Cytogenet. Genome Res 2017, 152, 122–131. [DOI] [PubMed] [Google Scholar]
- (15).Zinn RL; et al. Combination treatment with ABT-737 and chloroquine in preclinical models of small cell lung cancer. Mol. Cancer 2013, 12, 16. [DOI] [PMC free article] [PubMed] [Google Scholar]
- (16).Sakakibara-Konishi J; et al. Combined antitumor effect of γ-secretase inhibitor and ABT-737 in Notch-expressing non-small cell lung cancer. Int. J. Clin. Oncol 2017, 22, 257–268. [DOI] [PubMed] [Google Scholar]
- (17).Shahverdi M; Amini R; Amri J; Karami H Gene Therapy with miRNA-Mediated Targeting of Mcl-1 Promotes the Sensitivity of Non-Small Cell Lung Cancer Cells to Treatment with ABT-737. Asian Pacific J. Cancer Prev 2020, 21, 675–681. [DOI] [PMC free article] [PubMed] [Google Scholar]
- (18).Mason KD; Khaw SL; Rayeroux KC; et al. The BH3 mimetic compound, ABT-737, synergizes with a range of cytotoxic chemotherapy agents in chronic lymphocytic leukemia. Leukemia. 2009, 23, 2034–2041. [DOI] [PubMed] [Google Scholar]
- (19).Krajewski S; Krajewski M; Ehrmann J; et al. Immunohistochemical analysis of Bcl-2, Bcl-X, Mcl-1, and Bax in tumors of central and peripheral nervous system origin. Am. J. Pathol 1997, 50, 805–814. [PMC free article] [PubMed] [Google Scholar]
- (20).Potter DS; Kelly P; Denneny O; et al. BMX acts downstream of PI3K to promote colorectal cancer cell survival and Pathway inhibition sensitizes to the bh3 mimetic ABT-737. Neoplasia. 2014, 16, 147–157. [DOI] [PMC free article] [PubMed] [Google Scholar]
- (21).Raats DAE; de Bruijn MT; Steller EJA; et al. Synergistic killing of colorectal cancer cells by oxaliplatin and ABT-737. Cell. Oncol 2011, 34, 307–313. [DOI] [PubMed] [Google Scholar]
- (22).Pétigny-Lechartier C; Duboc C; Jebahi A; et al. The mTORC1/2 inhibitor AZD8055 strengthens the efficiency of the mek inhibitor trametinib to reduce the Mcl-1/[Bim and Puma] ratio and to sensitize ovarian carcinoma cells to ABT-737. Mol. Cancer Ther 2017, 16, 102–115. [DOI] [PubMed] [Google Scholar]
- (23).De Wolf E; De Wolf C; Richardson A ABT-737 and pictilisib synergistically enhance pitavastatin-induced apoptosis in ovarian cancer cells. Oncol. Lett 2018, 15, 1979–1984. [DOI] [PMC free article] [PubMed] [Google Scholar]
- (24).Gunda V; Sarosiek KA; Brauner E; et al. Inhibition of MAPKinase pathway sensitizes thyroid cancer cells to ABT-737 induced apoptosis. Cancer Lett. 2017, 395, 1–10. [DOI] [PubMed] [Google Scholar]
- (25).Mani J; Antonietti P; Rakel S; et al. Knockdown of BAG3 sensitizes bladder cancer cells to treatment with the BH3 mimetic ABT-737. World J. Urol 2016, 34, 197–205. [DOI] [PubMed] [Google Scholar]
- (26).Triple-negative Breast Cancer. American Cancer Society, 2022. Available at: https://www.cancer.org/cancer/breast-cancer/about/types-of-breast-cancer/triple-negative.html#written_by. (accessed: 11 July 2022). [Google Scholar]
- (27).Ozretic P; Alvir I; Sarcevic B; et al. Apoptosis regulator Bcl-2 is an independent prognostic marker for worse overall survival in triple-negative breast cancer patients. Int. J. Biol. Markers 2018, 33, 109–115. [DOI] [PubMed] [Google Scholar]
- (28).Tomao F; Papa A; Zaccarelli E; et al. Triple-negative breast cancer: new perspectives for targeted therapies. Onco. Targets. Ther 2015, 8, 177–193. [DOI] [PMC free article] [PubMed] [Google Scholar]
- (29).Tawfik K; Kimler BF; Davis MK; Fan F; Tawfik O Prognostic significance of Bcl-2 in invasive mammary carcinomas: a comparative clinicopathologic study between “triple-negative” and non-“triple-negative” tumors. Hum. Pathol 2012, 43, 23–30. [DOI] [PubMed] [Google Scholar]
- (30).Hwang E; Hwang S-H; Kim J; et al. ABT-737 ameliorates docetaxel resistance in triple negative breast cancer cell line. Ann. Surg. Treat. Res 2018, 95, 240–248. [DOI] [PMC free article] [PubMed] [Google Scholar]
- (31).Panayotopoulou EG; Müller A-K; Börries M; et al. Targeting of apoptotic pathways by SMAC or BH3 mimetics distinctly sensitizes paclitaxel-resistant triple negative breast cancer cells. Oncotarget. 2017, 8, 45088–45104. [DOI] [PMC free article] [PubMed] [Google Scholar]
- (32).Cang S; Iragavarapu C; Savooji J; Song Y; Liu D ABT-199 (venetoclax) and BCL-2 inhibitors in clinical development. J. Hematol. Oncol 2015, 8, 129. [DOI] [PMC free article] [PubMed] [Google Scholar]
- (33).Rudin CM; Hann CL; Garon EB; et al. Phase II Study of Single-Agent Navitoclax (ABT-263) and Biomarker Correlates in Patients with Relapsed Small Cell Lung Cancer. Am. Assoc. Cancer Res 2012, 21, 3163–3170. [DOI] [PMC free article] [PubMed] [Google Scholar]
- (34).Roberts AW; Advani RH; Kahl BS; et al. Phase 1 study of the safety, pharmacokinetics, and antitumour activity of the BCL2 inhibitor navitoclax in combination with rituximab in patients with relapsed or refractory CD20 + lymphoid malignancies. Br. J. Hamaetol 2015, 170, 669–678. [DOI] [PMC free article] [PubMed] [Google Scholar]
- (35).Kipps TJ; Eradat H; Grosicki S; et al. A phase 2 study of the BH3 mimetic BCL2 inhibitor navitoclax (ABT-263) with or without rituximab, in previously untreated B-cell chronic lymphocytic leukemia. Leuk. Lymphoma 2015, 56 (10), 2826–2833. [DOI] [PMC free article] [PubMed] [Google Scholar]
- (36).Tolcher AW; LoRusso P; Arzt J; et al. Safety, efficacy, and pharmacokinetics of navitoclax (ABT-263) in combination with irinotecan: Results of an open-label, phase 1 study. Cancer Chemother. Pharmacol 2015, 76 (5), 1041–1049. [DOI] [PubMed] [Google Scholar]
- (37).Mason KD; Carpinelli MR; Fletcher JL; et al. Programmed Anuclear Cell Death Delimits Platelet Life Span. Cell. 2007, 128, 1173–1186. [DOI] [PubMed] [Google Scholar]
- (38).Schmid D; Jarvis GE; Fay F; et al. Nanoencapsulation of ABT-737 and camptothecin enhances their clinical potential through synergistic antitumor effects and reduction of systemic toxicity. Cell Death Dis. 2014, 5, No. e1454. [DOI] [PMC free article] [PubMed] [Google Scholar]
- (39).Wu X; Wang L; Qiu Y; Zhang B; Hu Z; Jin R; et al. Cooperation of IRAK1/4 inhibitor and ABT-737 in nanoparticles for synergistic therapy of T cell acute lymphoblastic leukemia. Int. J. Nanomedicine 2017, 12, 8025–8034. [DOI] [PMC free article] [PubMed] [Google Scholar]
- (40).Kim S-W; Kyung Lee Y; Yeon Lee J; Hee Hong J; Khang D PEGylated anticancer-carbon nanotubes complex targeting mitochondria of lung cancer cells. Nanotechnology 2017, 28, 465102. [DOI] [PubMed] [Google Scholar]
- (41).Valcourt DM; Dang MN; Scully MA; Day ES Nanoparticle-Mediated Co-Delivery of Notch-1 Antibodies and ABT-737 as a Potent Treatment Strategy for Triple-Negative Breast Cancer. ACS Nano 2020, 14, 3378–3388. [DOI] [PMC free article] [PubMed] [Google Scholar]
- (42).Valcourt DM; Harris J; Riley RS; Dang MN; Wang J; Day ES Advances in targeted nanotherapeutics: From bioconjugation to biomimicry. Nano Res. 2018, 11, 4999–5016. [DOI] [PMC free article] [PubMed] [Google Scholar]
- (43).He Z; Zhang Y; Feng N Cell membrane-coated nanosized active targeted drug delivery systems homing to tumor cells : A review. Mater. Sci. Eng. C. Mater. Biol. Appl 2020, 106, 110298. [DOI] [PubMed] [Google Scholar]
- (44).Hu C-MJ; Fang RH; Luk BT; et al. ‘Marker-of-self’ functionalization of nanoscale particles through a top-down cellular membrane coating approach. Nanoscale. 2013, 5, 2664–2668. [DOI] [PMC free article] [PubMed] [Google Scholar]
- (45).Zhu JY; Zheng D-W; Zhang M-K; et al. Preferential Cancer Cell Self-Recognition and Tumor Self-Targeting by Coating Nanoparticles with Homotypic Cancer Cell Membranes. Nano Lett. 2016, 16, 5895–5901. [DOI] [PubMed] [Google Scholar]
- (46).Verhoef JJF; Anchordoquy TJ Questioning the use of PEGylation for drug delivery. Drug Delivery Transl. Res 2013, 3, 499–503. [DOI] [PMC free article] [PubMed] [Google Scholar]
- (47).Fang RH; Hu C-MJ; Luk BT; Gao W; Copp JA; Tai Y; O’Connor DE; Zhang L; et al. Cancer Cell Membrane-Coated Nanoparticles for Anticancer Vaccination and Drug Delivery. Nano Lett. 2014, 14, 2181–2188. [DOI] [PMC free article] [PubMed] [Google Scholar]
- (48).Sun H; Su J; Meng Q; et al. Cancer Cell Membrane-Coated Gold Nanocages with Hyperthermia-Triggered Drug Release and Homotypic Target Inhibit Growth and Metastasis of Breast Cancer. Adv. Funct. Mater 2017, 27, 1604300. [Google Scholar]
- (49).Sun H; Su J; Meng Q; et al. Cancer-Cell-Biomimetic Nanoparticles for Targeted Therapy of Homotypic Tumors. Adv. Mater 2016, 28, 9581–9588. [DOI] [PubMed] [Google Scholar]
- (50).Chen M; Chen M; He J Cancer cell membrane cloaking nanoparticles for targeted co-delivery of doxorubicin and PD-L1 siRNA. Artif. Cells, Nanomedicine Biotechnol 2019, 47, 1635–1641. [DOI] [PubMed] [Google Scholar]
- (51).Tian H; Luo Z; Liu L; et al. Cancer Cell Membrane-Biomimetic Oxygen Nanocarrier for Breaking Hypoxia-Induced Chemoresistance. Adv. Funct. Mater 2017, 27, 1703197. [Google Scholar]
- (52).Cai H; Wang R; Guo X; et al. Combining Gemcitabine-Loaded Macrophage-like Nanoparticles and Erlotinib for Pancreatic Cancer Therapy. Mol. Pharmaceutics 2021, 18, 2495–2506. [DOI] [PubMed] [Google Scholar]
- (53).Ren J; Li G; Zhao W; Lin L; Ye T Norcantharidin combined with ABT-737 for hepatocellular carcinoma: Therapeutic effects and molecular mechanisms. World J. Gastroenterol 2016, 22, 3962–3968. [DOI] [PMC free article] [PubMed] [Google Scholar]
- (54).Zheng R; You Z; Jia J; et al. Curcumin enhances the antitumor effect of ABT-737 via activation of the ROS-ASK1-JNK pathway in hepatocellular carcinoma cells. Mol. Med. Rep 2016, 13, 1570–1576. [DOI] [PMC free article] [PubMed] [Google Scholar]
- (55).He W; Li X; Morsch M; et al. Brain-Targeted Codelivery of Bcl-2/Bcl-xl and Mcl-1 Inhibitors by Biomimetic Nanoparticles for Orthotopic Glioblastoma Therapy. ACS Nano 2022, 16, 6293–6308. [DOI] [PubMed] [Google Scholar]
- (56).Chen Z; Zhao P; Luo Z; et al. Cancer Cell Membrane-Biomimetic Nanoparticles for Homologous-Targeting Dual-Modal Imaging and Photothermal Therapy. ACS Nano 2016, 10, 10049–10057. [DOI] [PubMed] [Google Scholar]
- (57).Dehaini D; Wei X; Fang RH; et al. Erythrocyte-Platelet Hybrid Membrane Coating for Enhanced Nanoparticle Functionalization. Adv. Mater 2017, 29 (16), 1606209. [DOI] [PMC free article] [PubMed] [Google Scholar]
Associated Data
This section collects any data citations, data availability statements, or supplementary materials included in this article.