

Abstract
Immune therapeutics hold great promise in the treatment of type 1 diabetes (T1D). Nonetheless, their progress has been hampered by limited efficacy, equipoise, or issues of safety. To address this, we developed a novel and specific nanodelivery platform for T1D that targets high endothelial venules (HEVs) presented in the pancreatic lymph nodes (PLNs) and pancreas. Our data indicate that the pancreata of non-obese diabetic (NOD) mice and patients with T1D are unique in their expression of newly formed HEVs. We encapsulated anti-CD3 mAb in PLGA-PEG nanoparticles (NPs), the surfaces of which were conjugated with MECA79 mAb that recognizes HEVs. Targeted delivery of these NPs improved accumulation of anti-CD3 mAb in both the PLNs and pancreata of NOD mice. Treatment of hyperglycemic NOD mice with MECA79-anti-CD3-NPs resulted in significant reversal of T1D compared to those that were untreated, treated with empty NPs, or provided free anti-CD3. This effect was associated with a significant reduction of T effector cell populations in the PLNs and a decreased production of pro-inflammatory cytokine in the mice treated with MECA79-anti-CD3-NPs. In sum, HEV-targeted therapeutics may be used as a means by which immune therapeutics can be delivered to PLNs and pancreata to suppress autoimmune diabetes effectively.
Keywords: targeted therapy, drug delivery, type 1 diabetes, nanomedicine, high endothelial venule
Graphical Abstract
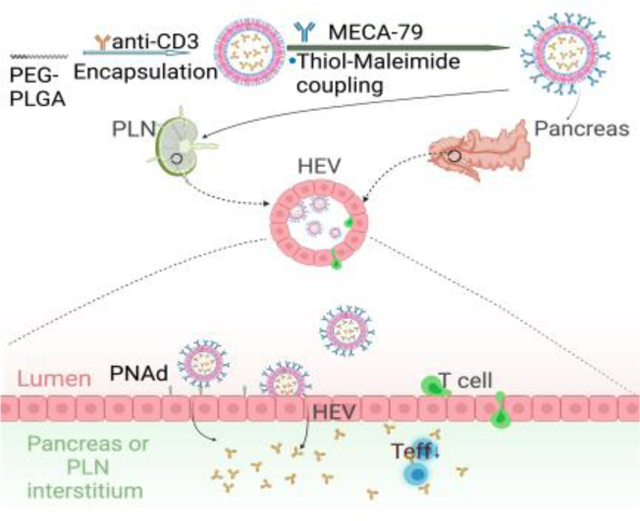
We developed a targeted delivery platform for type 1 diabetes (T1D) treatment using high endothelial venule (HEV)-targeted nanoparticles. Our HEV-targeting nanoplatform delivered anti-CD3 antibodies simultaneously to pancreatic lymph nodes and pancreata, thereby suppressing effector T cells and prolonging the reversal of T1D in non-obese diabetic mouse model.
1. Introduction
Nanoparticles (NPs) can be leveraged for the treatment of numerous diseases due to their advantages such as biocompatibility, reduced toxicity, and precise targeting.[1] As but one such example, NPs have been tested for the treatment of a variety of autoimmune disorders.[2] For example, Kelly et al. [3] encapsulated gliadin in polylactic-co-glycolic acid (PLGA)-NPs and demonstrated a tolerogenic effect sufficient to treat celiac disease in a phase 2a trial involving human patients. Chen et al.[4] developed lipid NPs carrying rapamycin and citrullinated peptide to promote immune tolerance during ongoing inflammation associated with rheumatoid arthritis. Zhang et al.[5] synthesized polylactic acid-polyethylene glycol (PLA-PEG)-NPs containing rapamycin and autoantigen HEL46–61, providing evidence of antigen-specific immunological tolerance in prevention of vitiligo. LaMothe et al.[6] designed PLGA/PLA-PEG-NPs encapsulating MHC class II peptide and rapamycin, demonstrating therapeutic efficacy in a model of relapsing experimental autoimmune encephalomyelitis. However, there are no reports on the use of targeted delivery of drugs to both LNs and inflamed organs to reestablish immune tolerance.
Approximately 1.25 million Americans have autoimmune type 1 diabetes (T1D). The incidence of T1D is increasing in the United States (average of 5 percent per year in young children), and by 2040, the population of T1D patients may approach over 2 million individuals.[7] People with T1D must adhere to a strict, lifelong regimen of exogenous insulin administration for survival, and they are at higher risk for complications that impart significant morbidity and mortality both in the short- (e.g., DKA) and long-term (e.g., retinopathy, neuropathy, etc.).[8] Immune therapeutics (ITs) hold much promise in the treatment of T1D, but their implementation faces challenges of limited long-term efficacy and the potential for high toxicity.[9] Anti-CD3 monoclonal antibody (mAb) represents one of the most extensively studied agents among T1D ITs.[10] Notably, the FDA recently approved anti-CD3 mAb (teplizumab-mzwv) to delay the onset of T1D, the first approved IT for T1D patients.[11] Anti-CD3 mAb binding to the CD3/T cell receptor (TCR) complex is thought to induce T cell anergy and/or apoptosis, thereby shifting the immunologic balance towards immunoregulation.[12] Although anti-CD3 mAb-based therapies have demonstrated reproducible efficacy in attenuating T1D, the potential for systemic side effects and lack of therapeutic durability still remain, even after incorporation of a non-Fc binder.[13]
To address these shortcomings, we sought to develop strategies designed to enhance the delivery of ITs, including anti-CD3 mAb, to the key pathogenic sites of T1D; namely, the pancreatic lymph nodes (PLNs) and the pancreata. The scientific premise for this study is supported by multiple data that underscore the critical importance of the PLNs as central loci for the priming and activation of autoreactive T cells in T1D, and subsequent trafficking of activated T cells into the pancreas resulting in insulitis and eventually the symptomatic onset of T1D.[14] We hypothesized that targeted delivery of anti-CD3 mAb to the PLNs and pancreata would increase efficacy and decrease toxicity by reducing systemic dosing.
Naïve T cells home to lymph nodes (LNs) via interactions with peripheral node addressin (PNAd) expressed by HEVs.[15] Following their entry, T cells interact with LN-resident dendritic cells (DCs).[16] In the case of T1D, autoantigens are delivered to the PLNs via afferent lymphatics and internalized by DCs, which present those autoantigens subsequently to T cells.[14b] HEVs are found in LNs as well as T1D insulitis, a faucet that renders them promising targets for T1D-specific drug delivery. MECA79 is a mAb that recognizes virtually all PNAd molecules. Here, we engineered MECA79 surface-coated NPs (abbreviated as MECA79-NPs) with the capacity to traffic to the PLNs and pancreata of non-obese diabetic (NOD) mice following intravenous (i.v.) injection. We also synthesized the first class of a MECA79-NP that encapsulates anti-CD3 mAb (abbreviated as MECA79-anti-CD3-NP) with promising preclinical results, demonstrated by the reversal of autoimmune diabetes in the NOD mouse model.
2. Results
2.1. MECA79-NPs are internalized by a clathrin-mediated pathway and extravasated to interstitium.
We synthesized MECA79-coated gold NPs (GNPs) to explore the fate of NPs in high endothelial cells (HECs) using transmission electron microscopy (TEM). At 6 hours post-intravenous (i.v.) injection of MECA79-GNPs to NOD mice, we collected and fixed PLNs. We observed GNP-endocytosed vesicles by HECs; most of the GNPs were located near the abluminal region of HECs and not in the luminal area (Figure 1A-a,b,c,e). In contrast, conventional endothelial cells exhibited no uptake of GNPs (Figure S1A). Interestingly, a portion of GNPs was detected near the basolateral membrane (Figure 1A-f) or interstitium (Figure 1A-g). These data suggest that MECA79-NPs were endocytosed by HECs and extravasated, resulting in the transfer of NPs to the interstitium of the LN through HEVs.
Figure 1. Characterization of MECA79-anti-CD3-NPs.

(A) TEM images of the PLN of a NOD mouse (12 week-old) at 6 hours post-intravenous (i.v.) injection of MECA79-GNPs. Red circle: HEV. Red boxes: magnified regions, Red arrows: MECA79-GNPs. Region “d” was magnified in bottom figures. (B) Quantification of MFI of NP in LN 1 day after i.v. injection of MECA79-IR800-NPs in naïve mice or mice pretreated with a dynamin inhibitor (Dyngo 4a). Control vs. pre-dynamin inhibition, 18247 vs. 13088, ***p < 0.001. n = 26 or 19 LNs, respectively. Significance was determined by Student’s t-test. (C) Quantification MFI of NP in LN 1 day after i.v. injection of MECA79-IR800-NP in naïve mice or caveolae (Cav-1) KO mice. Control vs. Cav-1, 34542 vs. 28979, nsp > 0.05. n = 14 or 10 LNs, respectively. Significance was determined by Student’s t-test. (D) Schematic illustration of the synthesis of MECA79-conjugated NPs encapsulating anti-CD3 mAb and the working mechanism of MECA79-anti-CD3-NP for treatment of T1D. (E) Release profiles of anti-CD3 mAb from anti-CD3-NP or MECA79-anti-CD3-NP in PBS at 37oC. n = 3 samples/group. (F–G) Hydrodynamic size (F) and zeta-potential (G) of MECA79-anti-CD3-NP in serum over time at 37oC. n = 5 samples/group.
To understand the mechanisms of how MECA79-NPs are internalized, we examined the role of clathrin-mediated and caveolae-mediated internalization. We injected a dynamin inhibitor (Dyngo 4a), a key regulator of the clathrin pathway.[17] LNs were harvested and imaged with a fluorescence imaging system (UVP iBox Explorer 2) one day following injection of MECA79-NPs labeled with IRDye 800CW, near-infrared fluorophore (abbreviated as MECA79-IR800-NPs). Compared to the untreated control group, the pre-dynamin inhibition group demonstrated a lower mean fluorescence intensity (MFI) (Figure 1B). We next tested caveolae-mediated internalization of the NPs using caveolae KO mice (Cav1tm1Mls/J) and confirmed no significant difference in trafficking of MECA79-NPs (Figure 1C). Together, these results demonstrated that MECA79-NPs are internalized by employing a clathrin-mediated pathway and extravasated to the interstitium.
2.2. MECA79- anti-CD3-NPs sustainably release anti-CD3 mAb with serum stability.
Based on these results, we then encapsulated anti-CD3 mAb in polylactic-co-glycolic acid-polyethylene glycol (PLGA-PEG)-NP using a double emulsion method. Next, MECA79 mAb was treated with tris(2-carboxyethyl)phosphine (TCEP) to reduce its disulfide bonds, resulting in free thiol groups, enabling its attachment to maleimide groups on the surface of the NP (Figure 1D, top).[18] Based on this, we believed this nanoformulation could target HEVs expressed on PLNs or pancreata in settings of T1D and sustainably release anti-CD3 mAb at the site of disease, offering an improved treatment (Figure 1D, bottom).
We characterized the morphology and size of these MECA79-anti-CD3-NPs using negative-staining TEM, which shows uniformly spherical particles with a mean diameter of 105.5 nm (Figure S1B). In dynamic light scattering (DLS) analysis, the average hydrodynamic sizes of the unconjugated anti-CD3-NP and of the MECA79-anti-CD3-NP were 114.2 nm (polydispersity index, PDI = 0.21) and 133.6 nm (PDI = 0.22), with narrow size distributions, respectively (Figure S1C). The slight increase of NP size detected following conjugation with MECA79 supports that MECA79 is present on the NP surface, as the size of MECA79 after the treatment with TCEP is around 10 nm. The NP size is larger when measured using a DLS technique, as compared with TEM imaging, since DLS measures size including the hydrodynamic shell of the NP suspension; whereas in TEM images we observed the diameter of dry NPs. The surface charge of anti-CD3-NP changed from −18.8 mV to −11.3 mV after conjugation with MECA79 (Figure S1D). Surface charges of unconjugated PLGA-PEG-NPs are known to be negative.[19] Consequently, the less negative zeta-potential of the MECA79-conjugated NPs also points to the presence of MECA79 on the surface of the NP. Next, we monitored the release kinetics of anti-CD3 mAb from the NP. Anti-CD3-NPs showed sustained release of anti-CD3 mAb over a week at 37o C in PBS (Figure 1E). We confirmed the faster release of anti-CD3 mAb in MECA79-NPs than in unconjugated NPs; the half-life of drug release was 4.5 days vs. 3.5 days for anti-CD3-NP vs. MECA79-anti-CD3-NP, respectively. Plasma stability assay was performed in NOD plasma solution for a week at 37oC. After the initial increase of hydrodynamic size of ~20 nm by the formation of protein corona on the NP surface, the size of MECA79-NP remained stable through a week at 37oC (Figure 1F). Zeta-potential of NP was also maintained at around −10 mV for a week (Figure 1G). These results validated that our NPs are sufficiently stable even in the existence of plasma proteins. MECA79-anti-CD3-NPs placed in plasma for a week at RT showed no release of anti-CD3 mAb (Figure S1E), indicating that plasma protein binding to the surface of NPs did not result in premature release of anti-CD3 mAb.
2.3. MECA79-NPs home to HEVs of PLNs of NOD mice.
We studied the delivery kinetics of MECA79-NP to NOD PLNs. Six hours and 1 day after i.v. injection of MECA79-IR800-NP, we stained the PLNs for PNAd (Figure 2A). At 6 hours post-injection, many MECA79-NPs were observed within the HEV complex. At 1 day post-injection, the extravasation of MECA79-NP from HEV to the interstitium of PLN was increased. Next, we administered unconjugated IR800-NPs or MECA79-IR800-NPs to NOD mice and after 1 day measured the NP signals in PLNs using UVP iBox Explorer 2 (Figure 2B). The MECA79-NP group showed higher MFI compared with the unconjugated NP group (Figure 2C). Furthermore, we compared the signals 1 day after the administration of IgM isotype control-conjugated IR800-NPs (IgM-NPs) or MECA79-IR800-NPs to verify specific delivery by MECA79 mAb. MECA79-NPs exhibited more robust targeting to NOD PLN, as compared with IgM-NPs (Figure S2). PLNs from the treated mice were sectioned to assess the pattern of homing of NPs (Figure 2D). MECA79-NPs significantly accumulated in the vicinity of the HEVs in the PLNs, as compared with the unconjugated NP group (Figure 2E). Additionally, we noticed that CD11b+ macrophages internalized MECA79-NPs (Figure S3), possibly facilitating their delivery to pancreas.[20]
Figure 2. Expansion of HEVs in PLN of NOD mice and PNAd-targeted nanodelivery to PLN.
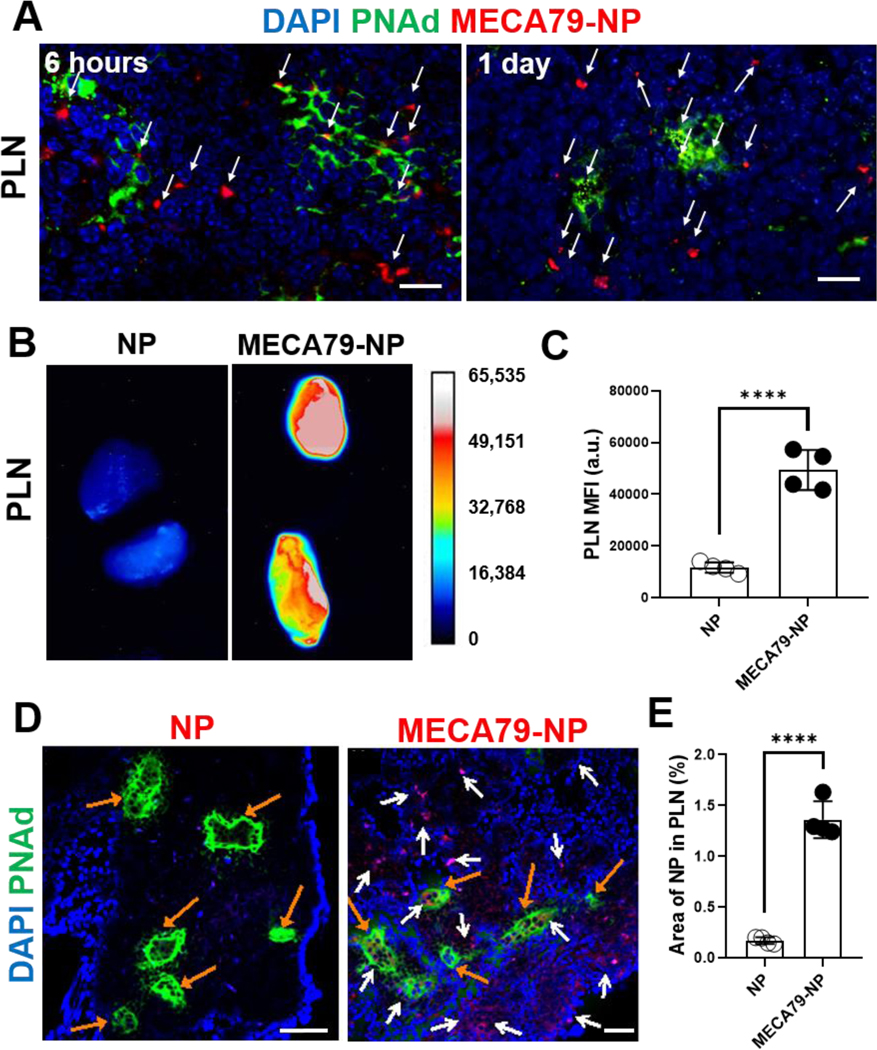
(A) Immunofluorescence images of NOD PLN 6 hours and 1 day after the administration of MECA79-IR800-NP. White arrows indicate the NPs. Scale bar: 25 μm. (B) Ex vivo fluorescence images of NOD PLN 1 day after the administration of unconjugated IR800-NP or MECA79-IR800-NP. (C) Quantification of MFI in PLNs (control vs. MECA79-NP, ****p < 0.0001, n = 4 mice/group, significance was determined by Student’s t-test). (D) Immunofluorescence images of NOD PLN 1 day after the administration of unconjugated IR800-NP or MECA79-IR800-NP. White arrows indicate the NPs, and orange arrows are for HEVs. Scale bar: 50 μm. (E) Quantification of the fluorescence signal of NPs (control vs. MECA79-NP, 0.17% vs. 1.36%, ****p < 0.0001, n = 4 mice/group, significance was determined by Student’s t-test).
2.4. MECA79-NPs home to HEVs that formed ectopically in pancreata of NOD mice.
The extent to which ectopic HEVs form within the pancreata is an important question that will determine the efficacy of drug delivery. Serial sectioning of the pancreata of NOD mice showed ectopic HEVs, indicating that the HEV may act as a gateway for targeted delivery in the pancreata. In the control group, non-diabetic BALB/c mice did not form HEVs around the islets (Figure S4).
We examined the pattern of trafficking of MECA79-NPs in NOD pancreata over time. At 1 hour and 6 hours post-injection, MECA79-NPs were primarily found within the HEVs (Figure 3A), whereas at a later time point (day 1), MECA79-NPs were observed within the interstitium of pancreata (Figure 3B). MECA79-NPs were detected in the vicinity of PNAd-expressing HEV vessels within the islets of NOD pancreas, where immune cells also notably infiltrated. In contrast, the islets of normoglycemic BALB/c mice showed no damage nor any infiltration of immune cells (Figure S4). After administering MECA79-IR800-NPs to NOD mice, we noted a significant increase in the fluorescence signal in the pancreata, as compared with unconjugated IR800-NPs (Figure 3C–D), and IgM-NPs (Figure S5).
Figure 3. Ectopic formation of HEVs in pancreas of NOD mice and PNAd-targeted nanodelivery to pancreas.

(A) Pancreatic fluorescence micrographs of NOD 1 hour and 6 hours after the administration of MECA79-IR800-NP. Scale bar: 25 μm. White arrows indicate the NPs. Scale bar: 25 μm. (B) Fluorescence micrographs of NOD pancreas 1 day after the administration of MECA79-IR800-NPs. Tissues were stained for insulin (white) and PNAd (green). White arrows point to MECA79-NPs, orange arrows indicate HEV structures, and dashed white arrow points to insulin. Scale bar: 25 μm. (C) Ex vivo images of NOD pancreas 1 day after the administration of unconjugated IR800-NP or MECA79-IR800-NP. (D) Quantification of the fluorescence NP signals from pancreata (unconjugated NP vs. MECA79-NP, 8413 vs. 38629, n = 4 mice/group, ****p < 0.0001, significance was determined by Student’s t-test). (E) In vivo T2-weighted MR images of the pancreata of NOD mice 1 day after the administration of unconjugated iron oxide (IO) NPs or MECA79-conjugated IONPs. Red lines indicate pancreata.
To verify the targeting effect to diabetic pancreata further, we synthesized MECA79-conjugated iron oxide (IO) NPs and injected them i.v. to NOD mice. After 1 day, the pancreata of the mice were imaged with a 7.0T Magnetic Resonance Imaging (MRI) instrument (Bruker, Biospec). In the in vivo T2-weighted MR images, pancreatic MR contrast of MECA79-NP group increased as compared with the mouse injected with unconjugated NPs (Figure 3E), indicating enhanced accumulation of NPs through targeting effects of surface-MECA79 mAb to diabetic pancreata.
2.5. MECA79-NPs deliver anti-CD3 mAb to both PLNs and pancreata.
To study the kinetics of anti-CD3 mAb delivery, we labeled anti-CD3 mAb with IR800 through EDC/NHS chemistry (defined as anti-CD3*) and encapsulated anti-CD3* in MECA79-NP. One day after i.v. injection to NOD mice, ex vivo anti-CD3* signals from PLNs of the mice treated with MECA79-anti-CD3*-NP were significantly higher than those that received only free anti-CD3* (Figure 4A–B).
Figure 4. Enhanced anti-CD3 mAb delivery to PLNs and pancreata in NOD through MECA79-NPs.
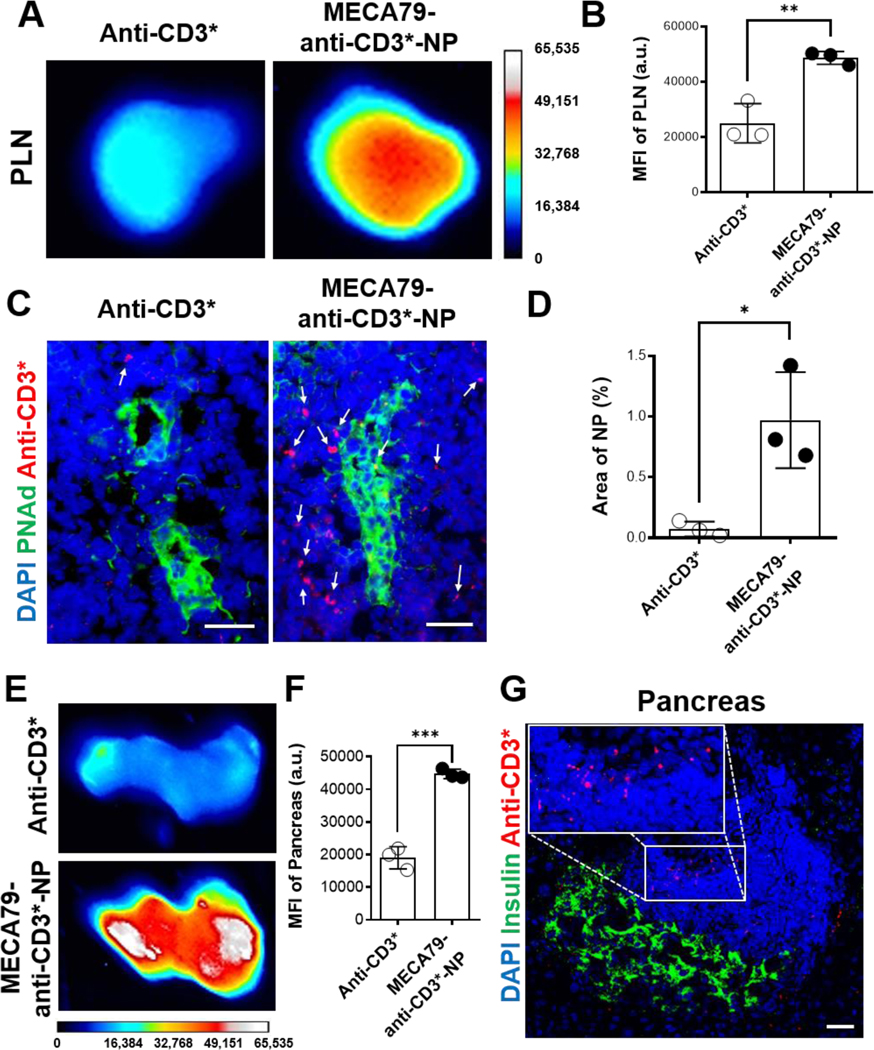
(A) Ex vivo PLN images of NOD 1 day after the administration of free anti-CD3-IR800 (anti-CD3*) or MECA79-anti-CD3*-NP. (B) Quantification of the fluorescence signal of anti-CD3 mAb in PLN (anti-CD3* vs. MECA79-anti-CD3*-NP, 24976 vs. 48637, **p < 0.01, n = 3 mice/group, significance was determined by Student’s t-test). (C) Fluorescence micrographs of NOD PLNs 1 day after the administration of anti-CD3* or MECA79-anti-CD3*-NP. (D) Quantification of the fluorescence signal of anti-CD3 mAb (anti-CD3* vs. MECA79-anti-CD3*-NP, 0.07% vs. 0.97% *p < 0.05, n = 3 mice/group, significance was determined by Student’s t-test). PLNs were stained for nuclei (blue), PNAd (green). White arrows indicate anti-CD3*. Scale bar: 25 μm. (E) Ex vivo images of NOD pancreata after the administration of free-anti-CD3* or MECA79-anti-CD3*-NP. (F) Quantification of the fluorescence signals of the pancreata (anti-CD3* vs. MECA79-anti-CD3*-NP, 19036 vs. 44719, ***p < 0.001, n = 3 mice/group, significance was determined by Student’s t-test). (G) Fluorescence micrograph of NOD pancreas after the administration of MECA79-anti-CD3*-NP. Pancreas was stained for nuclei (blue) and insulin (green). Inset highlights fluorescence signal of MECA79-anti-CD3*-NPs located in an area of islet-infiltrating immune cells. Scale bar: 25 μm.
At 1 day post-injection of MECA79-anti-CD3*-NP, anti-CD3* was largely located in the interstitium in PLN as compared with free anti-CD3* (Figure 4C–D). Even at 6 days post-injection, anti-CD3* was detected, indicating longer residence in PLN to suppress the immune response (Figure S6). We confirmed that MECA79-anti-CD3*-NP also accumulated more readily in pancreata, as compared to free anti-CD3* (Figure 4E–F). Immune cells were detected in/around islets of the NOD pancreata (Figure S7) and anti-CD3 mAbs localized to areas of the immune cells (Figure 4G). This finding suggests that MECA79-NPs deliver anti-CD3 mAb to inflamed islets, where anti-CD3 mAb could be sustainably released from NPs and interact effectively with islet-infiltrating immune cells.
2.6. Treatment with MECA79-anti-CD3-NP reverses T1D in NOD mice.
We tested the preclinical efficacy of MECA79-anti-CD3-NP in reversing hyperglycemia in NOD mice (n = 9 mice), as we described previously.[21] I.v. treatment with MECA79-anti-CD3-NP for five consecutive days was started on the second consecutive day of confirmed hyperglycemia, followed by once-a-week treatment for 3 more weeks (5 μg of anti-CD3 mAb/day/mouse) (left, Figure 5A), which is based on short-term, low-dose treatment with anti-CD3.[22] Amongst the 9 mice treated with MECA79-anti-CD3-NP, 7 responded to the treatment within a week (78% acute remission rate vs. 37% for the free anti-CD3 group [3 out of 8 mice]) (right, Figure 5A). Long-term remission rate was assessed 45 days following treatment and followed the same trend (75% for the MECA79-anti-CD3-NP and 40% for the free anti-CD3 group). No remission was noted in the untreated group and the group treated with the empty NP (0% for both untreated and empty NP groups). Importantly, treatment with MECA79-anti-CD3-NP increased the C-peptide concentration (Figure S8). The In vivo response to metabolic challenge in NOD mice pretreated with MECA79-anti-CD3-NPs was assessed by performing an intraperitoneal glucose tolerance test (Figure S9). Indeed, diabetic NOD mice that converted to normoglycemia upon treatment with MECA79-anti-CD3-NP sufficiently restored their glucose tolerance when challenged with a bolus dose of glucose; their blood glucose levels were lower at all tested time points than the untreated NOD mice (Figure S9). These data show that the therapeutic efficacy of anti-CD3 mAb increases significantly by delivery in the form of MECA79-anti-CD3-NP, as evidenced by the restoration of euglycemia in the diabetic mice which further showed improved glucose tolerance response.
Figure 5. Enhanced suppression of T cells by treatment with MECA79-anti-CD3-NPs, resulting in decreased insulitis in pancreas.

(A) Diabetes reversal in hyperglycemic NOD mice. (Left) Empty NPs, free anti-CD3, or MECA79-anti-CD3-NPs (dose of anti-CD3 mAb = 5 μg/injection) were injected i.v. daily for 5 days, starting at second day of hyperglycemia (>250 mg/dL), and then once a week for the following 3 weeks. Arrows indicate the days of the treatment (Right). Blood glucose levels of the mice treated as described in the left panel. (B) CD69+CD4+ effector T cells (Teff) in NOD PLN following no treatment or treatment with free anti-CD3 or MECA79-anti-CD3-NPs (non-treatment vs. anti-CD3 vs. MECA79-anti-CD3-NP, 20.1% vs. 15.2% vs. 10.7%, *p < 0.05, ***p < 0.001, n = 4 or 5 mice, significance was determined by one-way ANOVA with Tukey’s post-hoc test). (C) Treg/CD8+ Teff ratio in NOD PLN following no treatment or treatment with free anti-CD3 or MECA79-anti-CD3-NPs (non-treatment vs. anti-CD3 vs. MECA79-anti-CD3-NP, 1.1 vs. 1.4 vs. 2.6, nsp> 0.05, n = 3 or 5 mice, significance was determined by one-way ANOVA with Tukey’s post-hoc test). (D) CTLA-4+ Treg in NOD PLN following no treatment or treatment with free anti-CD3 or MECA79-anti-CD3-NPs (non-treatment vs. anti-CD3 vs. MECA79-anti-CD3-NP, 6.7% vs. 22.9% vs. 50.3%, *p < 0.05, n = 4 or 5 mice, significance was determined by one-way ANOVA with Tukey’s post-hoc test). (E) Expression level of insulin in NOD pancreas following no treatment or treatment with free anti-CD3 or MECA79-anti-CD3-NPs (non-treatment vs. anti-CD3 vs. MECA79-anti-CD3-NP, 12 vs. 27 vs. 85, nsp > 0.05, *p < 0.05, **p < 0.01, n = 10 islets/group, significance was determined by one-way ANOVA with Tukey’s post-hoc test). (F) Immunofluorescence CD3+ T cell images in NOD islets following no treatment or treatment with free anti-CD3 or MECA79-anti-CD3-NPs. Nuclei (blue), CD3 (green), and insulin (red) were stained. Scale bar: 25 μm. (G–J) Level of cytokines (G = TNF-α; H = eotaxin; I = MCF-1, J = IFN-γ) in plasma of NOD mice following no treatment or 6 hours post-injection with free anti-CD3 or MECA79-anti-CD3-NP (nsp > 0.05, *p < 0.05, **p < 0.01, ***p < 0.001, ****p < 0.0001, n = 5 mice/group, significance was determined by one-way ANOVA with Tukey’s post-hoc test). (K) Fluorescence micrograph of pancreas of T1D donor. Pancreas was stained for nuclei (blue), PNAd (green), and CD31 (red). White arrows indicate PNAd+ vessels; two areas are magnified in insets. Scale bar: 50 μm.
2.7. MECA79-anti-CD3-NPs suppress effector T cells and induce less cytokine release syndrome (CRS).
To demonstrate the robust suppression of T cells by MECA79-anti-CD3-NP, we treated NOD mice with MECA79-anti-CD3-NP and analyzed their PLNs and pancreata. Treatment with MECA79-anti-CD3-NPs induced depletion of activated CD69+CD4+ T effector (Teff) cells in the PLNs of treated NOD mice as compared to the untreated and free anti-CD3-treated groups (Figure 5B). Treatment with MECA79-anti-CD3-NPs also downregulated activated CD69+CD8+ Teff cells in the PLNs of the treated NOD mice, as compared to the untreated and free anti-CD3-treated groups (Figure S10). Although no significant difference was observed in the regulatory T (Treg) cell population amongst the 3 groups, treatment with MECA79-anti-CD3-NPs increased the Treg/CD8+ Teff ratio (Figure 5C). Furthermore, treatment with MECA79-anti-CD3 NPs was associated with higher populations of CTLA-4+ Tregs in the PLN, as compared to the untreated and free anti-CD3 -treated groups (Figure 5D). CTLA-4 plays an essential role in Treg-mediated immunosuppression.[23] Islet infiltration by T cells was diminished by treatment with MECA79-anti-CD3-NPs, as compared with the control groups (Figure 5E). Although no significant difference was found in the populations of memory T cells, activated Teff cells (CD69+), and exhausted Teff cells (TIM-3+ or PD-1+) in the NOD pancreata (data not shown), treatment with MECA79-anti-CD3-NP was associated with depletion of IL-17A+CD8+ Teff cells, as compared to the untreated and free anti-CD3-treated groups (Figure S11).
A surge of inflammatory cytokines, cytokine release syndrome (CRS), is a major limiting factor in the use of biologic agents, including anti-CD3 mAb.[22, 24] The slow release of anti-CD3 mAb from NPs and reduction in the amount of anti-CD3 mAb can afford much better tolerability with respect to CRS. We compared the peripheral levels of cytokines in the blood plasma 6 hours after the administration of free anti-CD3 versus MECA79-anti-CD3-NP in NOD mice. Our analysis revealed the release of higher levels of inflammatory cytokines, such as TNF-α, eotaxin, and MCF-1 in the free anti-CD3-treated group as compared to the MECA79-anti-CD3-NP-treated mice (Figure 5G–I). IFN-γ in the MECA79-anti CD3-NP group was also detected at a low extent, showing no significant difference with the non-treatment group (Figure 5J). These data point to reduced induction of systemic inflammatory cytokines upon the treatment of MECA79-anti-CD3-NP compared to mice treated with free anti-CD3 mAb.[25]
2.8. Human pancreata with T1D also form ectopic HEVs.
As stated previously, our primary intention with these efforts was to increase translatability by utilizing biocompatible NP materials, targeted delivery, and drugs with extensive data in mice and humans. We also desired to ensure that the pancreatic delivery platform could work in humans. Therefore, we examined the ectopic expression of PNAd in the pancreata of organ donors with T1D, available through the Network for Pancreatic Organ donors with Diabetes (nPOD) program. Importantly, pancreatic tissues from T1D donors showed the formation of ectopic HEVs surrounding an islet as well as the depletion of insulin, in areas around where T cells were located (Figure S12A). Figure 5K displays expression of PNAds on CD31+ vessels in the pancreas of a new-onset T1D patient. In contrast, the pancreata of healthy donors contained no HEV, and expression of insulin by beta cells was preserved (Figure S12B).
3. Discussion
While potentially subject to debate, arguments could be made that nanomedicine research, to date, has focused primarily on cancer. Therefore, we sought to extend this field of investigation by exploring its potential application to T1D.[26] We believe, based on an extensive body of literature, that PLNs are key to T1D development. In accordance with this notion, several delivery approaches have been previously used to target the LN, but virtually all rely on passive lymphatic absorption (e.g., intradermal injection).[27] On the other hand, the pancreas represents a prime target for inhibition of autoreactive effector T cells or support of the islets with growth factors. Targeted therapeutics to inflamed pancreata using platelets,[28] polymeric NPs,[29] or lipid NPs[20] have been tested for the treatment of T1D. Thus far, no systemic method of drug administration capable of simultaneous delivery to inflamed PLNs and pancreata has been identified. The significance of our delivery platform rests on the fact that newly formed HEVs in the pancreata are also recognized by MECA79 mAb; hence, it lays the groundwork for the simultaneous delivery of immune therapeutics to both PLNs and pancreata by i.v. injection of one singular product.
The ongoing epidemic of T1D represents a major public health problem.[30] T1D patients suffer from lifelong exogenous insulin treatment and increased risk for disease-associated complications.[8d] Anti-CD3 mAb remains one of the most extensively and promising therapeutics thus far tested in clinical trials and, as noted earlier, approved in 2022 by the FDA as a means for imparting a delay in T1D onset.[11, 12b, 31] In terms of a mechanism of action, anti-CD3 mAb is considered to inhibit pathogenic T cells through activation-induced cell apoptosis, amongst multiple other potential pathways for benefit.[12a] In response to this promising notion, significant efforts have been undertaken to generate newer versions of anti-CD3, including non-Fc binders to decrease cytokine release.[12a, 13c, 31h] Nonetheless, the overall efficacy of these drugs is limited, as just 42% of patients treated with anti-CD3 mAb experienced decreased insulin response to the mixed-meal tolerance test after one year.[10c] Hence, the need for improvements is obvious and forms the genesis for our studies.
HEVs are extremely specialized vessels that facilitate lymphocyte migration into the LN.[32] Naïve T cells express L-selectin, which recognizes proteins coated with the sulfated form of sialyl-Lewis X on the surface of the HEV.[32b] These sugar-coated molecules are collectively known as PNAd.[32b, 33] MECA79 is a well-characterized mAb that recognizes all PNAd molecules in the HEV.[34] Central to the pathogenesis of autoimmune T1D is the presentation of islet antigens by antigen-presenting cells to T cells in PLNs, resulting in the activation of autoreactive effector and memory T cells.[35] Accordingly, several studies indicate that PLNs are critical to the pathogenesis of autoimmune diabetes.[35a, 36] Following priming in PLNs, activated autoreactive T cells are then thought to be recruited to the pancreata, where they cause insulitis. Moreover, memory T cells represent a major barrier to tolerance induction. Altogether, these studies highlight PLNs as important target sites for immunosuppressive drug delivery in T1D.
Our data indicate that anti-CD3 mAb delivery via MECA79-NPs to PLN of NOD mice is markedly efficient in comparison with anti-CD3 mAb alone. In addition to the PLN, the formation of tertiary lymphoid organs (TLOs) following chronic inflammatory stimuli plays a critical role in the pathogenesis of immune-mediated diseases, including T1D.[37] Inflammatory signals and endothelial cell activation during insulitis promote the formation of ectopic HEVs, which are also recognized by MECA79. Thus, these NPs specifically localize to sites of immune stimulation in the LNs and immune effector function in the pancreas.
Beyond these features, we demonstrated that HECs internalized MECA79-conjugated NPs via a clathrin-mediated pathway, and these NPs sequentially were extravasated to the interstitium. NPs have three fates following intracellular uptake--degradation, escape from the endosome/lysosome, or extravasation in the recycling process[38]--or NPs could pass through endothelial cells in the adhesion molecule-mediated transcytosis pathway.[39] Further studies using primary HEV cells are needed to demonstrate the exact intracellular transport pathway for anti-CD3-MECA79-NPs. Additionally, efforts are required to monitor PNAd receptors to confirm whether PNAd could recycle during the internalization/extravasation processes. Our PLGA-based NPs sustainably released anti-CD3 mAb over a week while maintaining their serum stability. As a future study, NPs engineered for different release kinetics would enable an optimized nanoformulation with fewer injections, along with less severe CRS. Meanwhile, bispecific antibodies (bsAbs) targeting two different antigens or epitopes with novel functionalities, as have been marketed for cancers,[40] might further improve our NP formulation. BsAbs simultaneously binding CD3 and PNAd could represent another targeted approach to enhance the therapeutic index of anti-CD3 mAb for autoimmune diseases including T1D.
In the PLNs of NOD mice, MECA79-NPs mainly extravasated from HEVs at 1 day post-injection. In the pancreata of NOD mice, MECA79-NPs were detected near HEVs ectopically formed in islets. We observed increased pancreatic signals of MECA79-NP, as compared with unconjugated NPs in both an ex vivo fluorescence assay and in vivo MRI imaging. Based on the formation of ectopic HEVs in islets obtained from cases with T1D, a MECA79-conjugated MRI probe may be a promising clinical tool for T1D. In terms of reversal of hyperglycemia, the MECA79-NP’s treatment enhanced the remission rate two-fold more than treatment with free anti-CD3 mAb. MECA79-NP’s treatment resulted in better preservation of the islets, greater reductions in Teff frequencies, and increased frequencies of CTLA-4+ Treg cells, along with reduced CRS. Importantly, with respect to the efforts reported herein, the expression of PNAd molecules by HEVs is common to virtually all mammals. Furthermore, our demonstration of the ectopic expression of PNAds in the pancreata of patients with T1D reinforces its translation to humans.
PLGA polymers currently have regulatory approval and have been used in clinical settings as biocompatible and biodegradable materials (e.g., surgical sutures)[41] with an excellent safety profile. Our formulation (50:50 LA:GA ratio and 30,000 Da PLGA) led to sustained release kinetics of antibodies over a week, and the 5,000 Da mw of PEG resulted in the sufficiently extended blood circulation of the NP to target HEV-dense tissues effectively.[42] PEG on the NP surface can reduce the adsorption of proteins, ensure steric stabilization, and avoid uptake by neutrophils, leading to the persistence of the NPs in the circulation.[43] NP surface and size are critical parameters for targeted drug delivery. Most clinically approved NPs are ~100–150 nm, similar to our NP vehicles.[44] This NP size for a tissue-targeting drug delivery system has been optimized for maximized drug encapsulation efficiency and avoidance of clearance systems.[45] The slightly negative charges promote accumulation to the targeted organ more efficiently.[46] Taken together, our data utilizing NOD mice can be a starting point to achieve effective therapeutic translation of NPs to clinical management of T1D.
A key issue that remains with respect to the usage of anti-CD3 mAb is CRS.[22, 24a-c] CRS is still detected with anti-CD3 constructs, suggesting that T-cell activation may contribute to the mechanism of action of anti-CD3 antibodies and consequently, the unwanted CRS is potentially unavoidable for this class of molecules.[47] CRS can result in serious adverse effects including circulatory shock, increased vascular permeability, disseminated intravascular coagulation, and multi-organ system failure.[48] Notably, our data indicated that the delivery of anti-CD3 mAb via MECA79-NP markedly reduced CRS. A key pathogenic factor in the generation of CRS is the exposure of circulating peripheral blood lymphocytes and monocytes to anti-CD3 antibodies.[48b, 48c, 49] The encapsulation of anti-CD3 mAb into nanocarriers significantly lowered the exposure of circulating immune cells to anti-CD3 mAb. Furthermore, with an increase in targeted delivery to sites of immunologic and disease activity--PLN and pancreas--it allows significantly lowered anti-CD3 mAb dosing, which in return significantly minimizes CRS.[50] With the controlled release, the nanodelivery of anti-CD3 mAb may be an effective tool to increase time intervals between dose administration, increasing overall treatment feasibility.
In sum, we demonstrated that both NOD and human T1D pancreata contain HEVs, and that MECA79-NP bound to HEVs. Here, we have created a novel and simple delivery platform that permits the targeting of effector T cells to the PLNs and pancreas, simultaneously. We believe this represents the first targeted simultaneous delivery method of immune therapeutics to these two critical tissues in T1D following systemic administration. Therefore, this study represents a promising departure from the standard delivery method for immune therapeutics in T1D.
4. Experimental Section
Mice:
NOD/ShiLtJ (JAX# 001976), C57BL/6 (JAX# 000664), Cav1tm1Mls/J (Cav-1 KO) (JAX# 004585), and BALB/c (JAX# 000651) mice were obtained from The Jackson Laboratories. All animal experiments and methods were performed in accordance with the relevant guidelines and regulations approved by the Institutional Animal Care and Use Committee (protocols: 2016N000167/04977) of Brigham and Women’s Hospital (Boston, MA).
Human samples:
We examined pancreatic sections from non-diabetic donors and T1D donors with ongoing autoimmunity. The Network for Pancreatic Organ Donors with Diabetes (www.JDRFnPOD.org) provided pancreatic cryosections. The University of Florida Institutional Review Board has approved the collection of these organ donors (IRB201600029).
Synthesis and characterization of NPs:
The poly(d,l-lactic-co-glycolic) acid (PLGA)-based copolymers were purchased from PolySciTech®, Akina Inc. Methoxy Poly (ethylene glycol)-b-PLGA copolymer (mPEG-PLGA, MW 5,000:30,000 Da, 50:50 LA:GA (w:w)) and PLGA-b-poly(ethylene glycol)-maleimide (PLGA-PEG-MAL, Mw ~30,000–5,000 Da, 50:50 LA:GA (w:w)) were used as the core polymers. NPs were synthesized by a water/oil/water double emulsion method. PEG-PLGA (45 mg) and maleimide-PEG-PLGA (5 mg) were dissolved in ethyl acetate. IR800-anti-CD3 (anti-CD3*) was prepared by incubating anti-CD3 mAb with IRdye 800CW NHS ester (LI-COR, 929–70020) for 2 hours at RT. The crude was purified by a desalting column (Thermo Scientific Fisher, Zeba™, 7 kD MWCO). Anti-CD3 mAb (Thermo Fisher Scientific, 16–0032-82) Anti-CD3* mAb, IR800 (IRDye 800CW Carboxylate, LI-COR, 929–08972), or Alexa 594 (Alexa Fluor™ 594 Carboxylic Acid, Thermo Fisher Scientific, A33082) was added to Dulbecco’s phosphate-buffered saline (DPBS) (Mediatech, Inc., Manassas, VA), and sonicated for 30 s. The emulsified solution was mixed with a 2% aqueous solution of poly(vinyl alcohol) (PVP) (Sigma-Aldrich) under vigorous vortex and immediately sonicated for 1 minute to formulate water-soluble NPs. Then, the doubly emulsified solution was stirred for 2 hours to evaporate ethyl acetate and harden NPs. The NPs were spindowned by ultracentrifugation at 21,000 rpm for 30 minutes (Beckman, L-80). The resulting NPs were redispersed with DPBS. MECA79 mAb or isotype IgM (BioLegend 400802) was conjugated to the surface of NPs via thiol-maleimide chemistry. Tris(2-carboxyethyl)phosphine hydrochloride (TCEP, 0.5 M, Sigma-Aldrich) was used to cleave disulfide bonds in MECA79 mAb (Novous Biologics, 1 mg/mL). Thirty μg of MECA79 mAb or isotype IgM was mixed with 30μL of TCEP and incubated for 15 minutes at room temperature, then it was mixed with the NP suspension. After 1 day at 4 °C, NPs were centrifuged and redispersed in DPBS prior to use.
The hydrodynamic size and zeta-potential of synthesized NPs were measured by a particle size analyzer (NanoBrook Omni, Brookhaven). Anti-CD3-NP filtrate was analyzed by bicinchoninic acid (BCA) (Sigma-Aldrich) to calculate the encapsulation efficiency (defined as ): 27.1%. NPs were stained with 1% uranyl acetate and loaded on copper TEM grids (Ted Pella Inc.). NP images were acquired by a transmission electron microscope (Jeol 1200 EX, 80 kV) at 30,000× magnification. Anti-CD3*-NP or MECA79-anti-CD3*-NP was incubated at 37 oC, and at predetermined time points, the aliquots were taken and centrifuged. The supernatants were measured by UV-vis-NIR spectroscopy (VWR™, UV-1600PC) to quantify the released amount of anti-CD3*.
Tissue TEM:
MECA79 mAb (150 μL) was reduced by TCEP (150 μL) for 15 minutes at RT. Maleimide-terminated GNPs (1 mL, Luna Nanotech, GNP-MAL-15) were mixed with the MECA79 mAb at 4 oC overnight. The GNPs were washed by ultracentrifugation and redispersed in DPBS (100 μL) MECA79-GNPs were i.v. injected to a NOD mouse. After 6 hours, PLNs were fixed in Karnovsky’s fixative solution for 24 hours. Samples were cut into approximately 2-mm-thick pieces, subjected to a secondary fixative for 2 hours in 1% osmium tetroxide, and washed in cacodylate buffer three times, dehydrated with a series of alcohol washes, propylene oxide washes, and embedded overnight in epoxy resin. The blocks were cut onto slides and stained with Toluidine blue. The sections were then chosen and cut and centered on copper grids. These grids were dual stained with aqueous uranyl acetate and lead citrate. Sections (70-nm-thick) were then taken and imaged on a JEM-1010 (Jeol).
MRI imaging:
Amine-terminated IONPs (Ocean NanoTech, SHA25) were dispersed in DPBS (5 mg/mL). Sulfosuccinimidyl 4-(N-maleimidomethyl)cyclohexane-1-carboxylate (Sulfo-SMCC, Thermo Fisher Scientific, 22322) was prepared in DMSO (Sigma-Aldrich) with the concentration of 5 mg/mL. The IONP solution (60 μL) was mixed with sulfo-SMCC (10 μL) for 2 hours in RT. After desalting of NP solution (Thermo Scientific Fisher, Zeba™, 7 kD MWCO) to remove unreacted sulfo-SMCC, the IONP eluents were mixed with reduced MECA79 mAb (40 μL) at 4oC overnight. The IONPs were washed by ultracentrifugation and redispersed in DPBS. MECA79-IONP or unconjugated IONP was i.v. injected to NOD mice. After 1 day, the pancreata of NOD mice were scanned by 7 Tesla Biospec (Bruker). During the acquisition of images, the mice were anesthetized with isoflurane (~1%) and their temperature was maintained at 37oC.
Internalization mechanism study:
For Dyngo 4a (Abcam, ab120689) with 1 mg/kg was injected i.v. at 1 hour before i.v. injection of MECA79-IR800-NP (100 μL). 1 day after the injection of MECA79-IR800-NP, mice were euthanized and LNs were harvested for iBox imaging.
Ex vivo biodistribution of NP or anti-CD3 mAb:
NOD mice received a single i.v. injection of anti-CD3*, MECA79-anti-CD3*-NP, unconjugated IR800-NP, or MECA79-IR800-NP. Four mg of NP dispersed in 100 uL DPBS was used for the injections. At 1 day following injection, the mice were euthanized via carbon dioxide inhalation and cervical dislocation, and their major organs were harvested and imaged by using a UVP iBOX Explorer Imaging Microscope (UVP) equipped with a 750–780 nm band-pass excitation filter and an 800 nm long-pass emission filter. The mean fluorescence intensity (MFI) for each organ was measured using the region of interest (ROI) function of ImageJ (National Institutes of Health; Bethesda, MD).
Intraperitoneal glucose tolerance test:
Newly hyperglycemic NOD mice that received MECA79-anti-CD3-NP fasted for 12 hours and were subjected to glucose tolerance testing (2 g/kg of 20% d-glucose, Ricca Chemical). Blood glucose levels were obtained at 0, 5, 15, 30, 60, and 120 min post-injection.
ELISA for serum C-peptide:
C-peptide levels were assessed in serum isolated from blood samples obtained respectively from hyperglycemic NOD mice treated with MECA79 anti-CD3-NP or left untreated, using a Mouse C-peptide ELISA kit (80-CPTMS-E01, ALPCO Diagnostics, Salem, NH) according to the manufacturer’s instructions. Briefly, 10 μL of serum from each sample wasplated into their corresponding wells, and 100 μL of working strength conjugate was distributed respectively to each well. The plate was covered and incubated for 2 hours on a microplate shaker at 700 rpm. At the end of the incubation, the plate was washed 3 times with Working Strength Wash Buffer and incubated with 100 μl of TMB substrate for 10 min on a microplate shaker at 700 rpm. Then, 100 μL of stop solution was distributed into every well and the optical density was measured by a spectrophotometer at 450 nm. For data analysis, a standard curve was generated with the included controls and standards, and was used to calculate and retrieve the relative quantity of C-peptide contained in each sample.
Immunofluorescence staining:
Frozen OCT blocks of PLNs or pancreata were cut using a cryostat (Leica) into 4- or 8-μm thick sections, respectively. The samples were stained using anti-CD3 (eBioscience, 14–0032-81), anti-CD11b (BioLegend, 101202), anti-insulin (Abcam, ab63820), and anti-PNAd (Santa Cruz Biology, sc-166493) with 1:100 dilution in 3% BSA solution. Dye-conjugated secondary antibodies (Jackson ImmunoResearch, 711–585-152, 711–545-152, 712–545-150, and 712–585-153) diluted 1:200 in DPBS and were used to add the fluorescence signals. DAPI (VECTASHIELD, Vector Laboratories) was used to stain the cell nuclei. The stained tissue sections were imaged using a fluorescent confocal microscope and an EVOS FL2 auto microscope or FluoView FV-10i Olympus Laser Point Scanning Confocal Microscope (Olympus, Center Valley, PA). The fluorescent area for each color channel was measured with ImageJ.
Flow cytometry:
The populations of T cells were quantified by flow cytometric analysis. PLNs and pancreas were placed into a 70-μm cell strainer (BD Falcon), attached to a 50-mL conical tube. The PLNs and pancreas were mashed in DMEM by a strainer. The single-cell suspension was centrifuged at 300 g for 5 minutes. The pellet was resuspended in complete DMEM at 1 × 10⁷ cells/ml in 96-well v-bottom plates (Corning, NY). All samples were washed with DPBS prior to incubation with LIVE/DEAD Blue Fixable Viability Dye TM (Thermo Fisher Scientific) diluted 1:1000 in DPBS for 20 minutes at room temperature. Then, the cells were washed with FACS buffer (DPBS + 2% fetal bovine serum + 1 mM EDTA + 0.1% sodium azide) and incubated for 30 minutes in ice with BUV395 anti-CD4 (563790, BD Horizon), BUV805 anti-CD8 (612898, BD Horizon), PE anti-CD25 (102008, Biolegend), APC anti-CD44 (103012, Biolegend), and PE/Cy7 anti-CD62L (104418, Biolegend), BV605 anti-CTLA-4 (106323, Biolegend), Alexa-Fluor 488 anti-FoxP3 (126406, Biolegend), PE/CY7 anti-CD69 (104512, Biolegend), PE anti-IL-17A (506904, Biolegend), BUV605 anti-TIM-3 (753150, BD Horizon), APC anti-PD-1 (109112, Biolegend). Cell-surface and intracellular antibodies were diluted 1:200 in FACS buffer and permeabilization buffer, respectively. Flow cytometry was performed using an Aurora flow cytometer (Cytek). Flow cytometry results were analyzed by FlowJo software (FlowJo LLC, Ashland, OR).
Luminex assay:
At 6 hour-post-treatment of drugs, blood was collected in EDTA-coated tube and centrifuged at 2,000 g for 10 minutes to obtain plasma samples. The concentration of cytokines was detected using the MILLIPLEX MAP Mouse Cytokine/Chemokine Magnetic Kit (MilliporeSigma), as per manufacturer’s instructions.
Formalin-fixed paraffin-embedded (FFPE)-pancreas experimental design:
FFPE pancreas tissue sections were deparaffinized and antigen retrieval was performed according to the Miltenyi MACSima sample preparation protocol. Briefly, slides were immersed in xylene for 20 minutes, then transferred through a series of increasingly diluted ethanol washes (specifically, 100%, 95%, 80%, 70%, and 50%) for 1 minute each, followed by immersion in distilled water for one minute. Heat-induced epitope retrieval was performed by boiling slides in TRIS/EDTA/Citrate (pH 9) buffer for 20 minutes. Slides were photobleached under a light-emitting diode (LED) illuminator in bleaching solution (4.5% (w/v) H2O2 and 20 mM NaOH in PBS) overnight to quench autofluorescence. Slides were then washed three times with PBS to remove the residual bleaching solution. The MACSima imaging platform was then used to stain with the following antibodies: anti-glucagon (clone: EP3070), anti-CD3 (clone: REA1151), anti-insulin (clone: EPR17359), and anti-PNAd (clone: MECA-79). Images were preprocessed and analyzed using MACSiQ View software (version 1.1.0).
Statistical analysis:
All statistical analyses were conducted using GraphPad Prism 7 software (GraphPad Software, Inc., CA). All data are expressed as the mean ± SD. Differences between groups were analyzed by Student’s t-test or one-way ANOVA with Tukey’s post-hoc test. A p value < 0.05 was considered statistically significant (*p < 0.05, **p < 0.01, ***p < 0.001, and ****p < 0.0001).
Supplementary Material
Figure S1. (A) A TEM image of a conventional venule in PLN of NOD mouse (12 week-old) at 6 hours post-injection of MECA79-GNPs. (B) A TEM image of MECA79-anti-CD3-NP. Scale bar: 200 nm. Inset: size distribution of the NP. (C–D) Hydrodynamic size (C) and zeta-potential (D) of anti-CD3-NP before and after conjugation with MECA79 mAb. ***p < 0.001, n = 5 samples/group. Significance was determined by Student’s t-test. (E) Amount of released anti-CD3 mAb from MECA79-anti-CD3-NPs in serum over time at RT.
Figure S2. Quantification of MFI of NOD PLN 1 day after the administration of IgM-IR800-NP or MECA79-IR800-NP. **p < 0.01, n = 3 mice/group, significance was determined by Student’s t-test).
Figure S3. PLN fluorescence micrograph of NOD mouse 1 day after the administration of MECA79- NPs (red). PLNs were stained for CD11b (green). White arrows indicate CD11b+ cells; these areas are magnified in insets. Scale bar: 50 μm.
Figure S4. Fluorescence micrograph of pancreas in BALB/c mouse. Nuclei (blue), PNAd (green), and insulin (white) were stained. White arrows indicate islets. Scale bar: 25 μm.
Figure S5. Quantification of MFI of pancreas from NOD mouse 1 day after the administration of IgM-IR800-NP or MECA79-IR800-NP, **p < 0.01, n = 3 mice/group, significance was determined by Student’s t-test).
Figure S6. PLN fluorescence micrograph of NOD 6 days after the administration of MECA79-anti-CD3*-NPs. PLNs were stained for PNAd (green). White arrows indicate anti-CD3*. Scale bar: 25 μm.
Figure S7. Fluorescence micrograph of pancreas from NOD mouse 1 day after the administration of MECA79-anti-CD3*-NP. Pancreas was stained for nuclei (blue), insulin (green), CD3+ cells (gray). Scale bar: 25 μm.
Figure S8. Levels of C-peptide in newly hyperglycemic NOD mice treated with MECA79-anti-CD3-NP or left untreated.
Figure S9. Curves of blood glucose levels during intraperitoneal glucose tolerance test in newly hyperglycemic NOD mice either untreated or treated with MECA79-anti-CD3.
Figure S10. CD69+CD8+ Teff in NOD PLN following no treatment or treatment with free anti-CD3 or MECA79-anti-CD3-NPs.
Figure S11. IL-17A+CD8 Teff percentage in pancreata of NOD mice following no treatment or treatment with free anti-CD3 or MECA79-anti-CD3-NPs.
Figure S12. (A) Fluorescence micrograph of the pancreas of donor with T1D. Pancreas was stained for nuclei (blue), CD3 (green), PNAd (red), glucagon (cyan), and insulin (yellow). (B) Fluorescence micrograph of non-diabetic donor. Nuclei (blue), PNAd (green), and insulin (red) were stained. Scale bar: 50 μm.
Acknowledgments:
This work was supported in part by the National Institutes of Health (NIH) under award numbers 1R01AI164475-01A1. This work was made possible by the National Priorities Research Program award [NPRP9-350-3-074] from the Qatar National Research Fund (a member of The Qatar Foundation). This research was performed with the support of the Network for Pancreatic Organ donors with Diabetes (nPOD; RRID:SCR_014641), a collaborative type 1 diabetes research project supported by JDRF (nPOD: 5-SRA-2018-557-Q-R) and The Leona M. & Harry B. Helmsley Charitable Trust (Grant#2018PG-T1D053, G-2108-04793). The content and views expressed are the responsibility of the authors and do not necessarily reflect the official view of nPOD. Organ Procurement Organizations (OPO) partnering with nPOD to provide research resources are listed at https://npod.org/for-partners/npod-partners/.
Footnotes
Conflict of Interests
All authors declare that they have no competing interests.
Supporting Information
Supporting Information is available from the Wiley Online Library or from the author.
Contributor Information
Dr. Sungwook Jung, Transplantation Research Center and Renal Division, Brigham and Women’s Hospital, Harvard Medical School, Boston, MA 02115, USA.
Dr. Moufida Ben Nasr, Division of Nephrology, Boston Children’s Hospital, Harvard Medical School, Boston, MA 02115, USA.
Dr. Baharak Bahmani, Transplantation Research Center and Renal Division, Brigham and Women’s Hospital, Harvard Medical School, Boston, MA 02115, USA
Dr. Vera Usuelli, International Center for T1D, Pediatric Clinical Research Center Romeo ed Enrica Invernizzi, DIBIC, Università di Milano, Milan, Italy
Dr. Jing Zhao, Transplantation Research Center and Renal Division, Brigham and Women’s Hospital, Harvard Medical School, Boston, MA 02115, USA
Dr. Gianmarco Sabiu, Transplantation Research Center and Renal Division, Brigham and Women’s Hospital, Harvard Medical School, Boston, MA 02115, USA
Dr. Andy Joe Seelam, Transplantation Research Center and Renal Division, Brigham and Women’s Hospital, Harvard Medical School, Boston, MA 02115, USA
Dr. Said Movahedi Naini, Transplantation Research Center and Renal Division, Brigham and Women’s Hospital, Harvard Medical School, Boston, MA 02115, USA
Dr. Hari Baskar Balasubramanian, International Center for T1D, Pediatric Clinical Research Center Romeo ed Enrica Invernizzi, DIBIC, Università di Milano, Milan, Italy
Dr. Youngrong Park, Transplantation Research Center and Renal Division, Brigham and Women’s Hospital, Harvard Medical School, Boston, MA 02115, USA
Dr. Xiaofei Li, Transplantation Research Center and Renal Division, Brigham and Women’s Hospital, Harvard Medical School, Boston, MA 02115, USA
Dr. Salma Ayman Khalefa, International Center for T1D, Pediatric Clinical Research Center Romeo ed Enrica Invernizzi, DIBIC, Università di Milano, Milan, Italy
Dr. Vivek Kasinath, Transplantation Research Center and Renal Division, Brigham and Women’s Hospital, Harvard Medical School, Boston, MA 02115, USA
Dr. MacKenzie D. Williams, Department of Pathology, Immunology, and Laboratory Medicine, College of Medicine, Diabetes Institute, University of Florida
Dr. Ousama Rachid, Department of Pharmaceutical Sciences, College of Pharmacy, QU Health, Qatar University, Doha, Qatar
Dr. Yousef Haik, Department of Mechanical and Nuclear Engineering, University of Sharjah, Sharjah, UAE
Dr. George C. Tsokos, Division of Rheumatology and Clinical Immunology, Beth Israel Deaconess Medical Center, Harvard Medical School, Boston, MA 02115, USA
Dr. Clive H. Wasserfall, Department of Pathology, Immunology, and Laboratory Medicine, College of Medicine, Diabetes Institute, University of Florida
Dr. Mark A. Atkinson, Department of Pediatrics, University of Florida, Gainesville, FL 32610, USA
Dr. Jonathan S. Bromberg, Departments of Surgery and Microbiology and Immunology, University of Maryland School of Medicine, Baltimore, MD 21201, USA
Dr. Wei Tao, Center for Nanomedicine, Department of Anesthesiology, Perioperative, and Pain Medicine, Brigham and Women’s Hospital, Harvard Medical School, Boston, MA 02115, USA
Dr. Paolo Fiorina, Transplantation Research Center and Renal Division, Brigham and Women’s Hospital, Harvard Medical School, Boston, MA 02115, USA; Division of Nephrology, Boston Children’s Hospital, Harvard Medical School, Boston, MA 02115, USA.
Dr. Reza Abdi, Transplantation Research Center and Renal Division, Brigham and Women’s Hospital, Harvard Medical School, Boston, MA 02115, USA.
Data Availability Statement:
All data generated or analyzed for this study are available from the corresponding author upon reasonable request.
References
- [1].a) Park W, Heo Y-J, Han DK, Biomater. Res 2018, 22, 24; [DOI] [PMC free article] [PubMed] [Google Scholar]; b) Tian H, Zhang T, Qin S, Huang Z, Zhou L, Shi J, Nice EC, Xie N, Huang C, Shen Z, J. Hematol. Oncol 2022, 15, 132. [DOI] [PMC free article] [PubMed] [Google Scholar]
- [2].Carey ST, Bridgeman C, Jewell CM, Adv. Sci 2023, 10, e2205105. [DOI] [PMC free article] [PubMed] [Google Scholar]
- [3].Kelly CP, Murray JA, Leffler DA, Getts DR, Bledsoe AC, Smithson G, First MR, Morris A, Boyne M, Elhofy A, Wu TT, Podojil JR, Miller SD, Gastroenterol. 2021, 161, 66. [DOI] [PMC free article] [PubMed] [Google Scholar]
- [4].Nijhuis L, Peeters JGC, Vastert SJ, van Loosdregt J, Front. Immunol 2019, 10. [DOI] [PMC free article] [PubMed] [Google Scholar]
- [5].Zhang X, Liu D, He M, Lin M, Tu C, Zhang B, Hum. Vaccine. Immunother 2021, 17, 1923. [DOI] [PMC free article] [PubMed] [Google Scholar]
- [6].LaMothe RA, Kolte PN, Vo T, Ferrari JD, Gelsinger TC, Wong J, Chan VT, Ahmed S, Srinivasan A, Deitemeyer P, Maldonado RA, Kishimoto TK, Front. Immunol 2018, 9, 281. [DOI] [PMC free article] [PubMed] [Google Scholar]
- [7].a) Gale EA, Diabetes 2002, 51, 3353; [DOI] [PubMed] [Google Scholar]; b) Onkamo P, Vaananen S, Karvonen M, Tuomilehto J, Diabetologia 1999, 42, 1395; [DOI] [PubMed] [Google Scholar]; c) Green A, Patterson CC, Diabetologia 2001, 44 Suppl 3, B3; [DOI] [PubMed] [Google Scholar]; d) Lin J, Thompson TJ, Cheng YJ, Zhuo X, Zhang P, Gregg E, Rolka DB, Popul Health Metr 2018, 16, 9; [DOI] [PMC free article] [PubMed] [Google Scholar]; e) Type 1 Diabetes Facts, https://www.jdrf.org/t1d-resources/about/facts, accessed: January, 2023. [Google Scholar]
- [8].a) Rewers M, Gottlieb P, Diabetes Care 2009, 32, 1769; [DOI] [PMC free article] [PubMed] [Google Scholar]; b) Bresson D, von Herrath M, Diabetes Care 2009, 32, 1753; [DOI] [PMC free article] [PubMed] [Google Scholar]; c) Ludvigsson J, Krisky D, Casas R, Battelino T, Castano L, Greening J, Kordonouri O, Otonkoski T, Pozzilli P, Robert JJ, Veeze HJ, Palmer J, Engl N. J. Med 2012, 366, 433; [DOI] [PubMed] [Google Scholar]; d) Bluestone JA, Herold K, Eisenbarth G, Nature 2010, 464, 1293. [DOI] [PMC free article] [PubMed] [Google Scholar]
- [9].a) Warshauer JT, Bluestone JA, Anderson MS, Cell Metabol. 2020, 31, 46; [DOI] [PMC free article] [PubMed] [Google Scholar]; b) Eisenbarth GS, Engl N. J. Med 1986, 314, 1360; [DOI] [PubMed] [Google Scholar]; c) Rachid O, Osman A, Abdi R, Haik Y, Expert Opin. Invest. Drugs 2020, 29, 221. [DOI] [PubMed] [Google Scholar]
- [10].a) Herold KC, Bundy BN, Long SA, Bluestone JA, DiMeglio LA, Dufort MJ, Gitelman SE, Gottlieb PA, Krischer JP, Linsley PS, Marks JB, Moore W, Moran A, Rodriguez H, Russell WE, Schatz D, Skyler JS, Tsalikian E, Wherrett DK, Ziegler A-G, Greenbaum CJ, Engl N. J. Med 2019, 381, 603; [DOI] [PMC free article] [PubMed] [Google Scholar]; b) Herold KC, Gitelman SE, Ehlers MR, Gottlieb PA, Greenbaum CJ, Hagopian W, Boyle KD, Keyes-Elstein L, Aggarwal S, Phippard D, Sayre PH, McNamara J, Bluestone JA, a. t. A. S. Team, Diabetes 2013, 62, 3766; [DOI] [PMC free article] [PubMed] [Google Scholar]; c) Herold KC, Hagopian W, Auger JA, Poumian-Ruiz E, Taylor L, Donaldson D, Gitelman SE, Harlan DM, Xu D, Zivin RA, Bluestone JA, Engl N. J. Med 2002, 346, 1692. [DOI] [PubMed] [Google Scholar]
- [11].Mullard A, Nat. Rev. Drug. Discov 2022, DOI: 10.1038/d41573-022-00198-9. [DOI] [Google Scholar]
- [12].a) Penaranda C, Tang Q, Bluestone JA, Immunol J. 2011, 187, 2015; [DOI] [PMC free article] [PubMed] [Google Scholar]; b) Pescovitz MD, Greenbaum CJ, Krause-Steinrauf H, Becker DJ, Gitelman SE, Goland R, Gottlieb PA, Marks JB, McGee PF, Moran AM, Raskin P, Rodriguez H, Schatz DA, Wherrett D, Wilson DM, Lachin JM, Skyler JS, Engl N. J. Med 2009, 361, 2143. [DOI] [PMC free article] [PubMed] [Google Scholar]
- [13].a) Gaglia J, Kissler S, Biochemistry 2019, 58, 4107; [DOI] [PMC free article] [PubMed] [Google Scholar]; b) Aronson R, Gottlieb PA, Christiansen JS, Donner TW, Bosi E, Bode BW, Pozzilli P, Group DI, Diabetes Care 2014, 37, 2746; [DOI] [PMC free article] [PubMed] [Google Scholar]; c) Daifotis AG, Koenig S, Chatenoud L, Herold KC, Clin. Immunol 2013, 149, 268. [DOI] [PubMed] [Google Scholar]
- [14].a) Sandor AM, Jacobelli J, Friedman RS, Clin. Exp. Immunol 2019, 198, 314; [DOI] [PMC free article] [PubMed] [Google Scholar]; b) Höglund P, Mintern J, Waltzinger C, Heath W, Benoist C, Mathis D, J. Exp. Med 1999, 189, 331; [DOI] [PMC free article] [PubMed] [Google Scholar]; c) Gagnerault MC, Luan JJ, Lotton C, Lepault F, J. Exp. Med 2002, 196, 369. [DOI] [PMC free article] [PubMed] [Google Scholar]
- [15].Von Andrian UH, Microcirculation 1996, 3, 287. [DOI] [PubMed] [Google Scholar]
- [16].Chudnovskiy A, Pasqual G, Victora GD, Curr. Opin. Immunol 2019, 58, 24. [DOI] [PMC free article] [PubMed] [Google Scholar]
- [17].Nguyen TH, Maucort G, Sullivan RKP, Schenning M, Lavidis NA, McCluskey A, Robinson PJ, Meunier FA, Plos One 2012, 7, e36913. [DOI] [PMC free article] [PubMed] [Google Scholar]
- [18].a) Bahmani B, Uehara M, Ordikhani F, Li X, Jiang L, Banouni N, Ichimura T, Kasinath V, Eskandari SK, Annabi N, Bromberg JS, Shultz LD, Greiner DL, Abdi R, EBioMedicine 2018, 38, 79; [DOI] [PMC free article] [PubMed] [Google Scholar]; b) Bahmani B, Uehara M, Jiang L, Ordikhani F, Banouni N, Ichimura T, Solhjou Z, Furtmüller GJ, Brandacher G, Alvarez D, von Andrian UH, Uchimura K, Xu Q, Vohra I, Yilmam OA, Haik Y, Azzi J, Kasinath V, Bromberg JS, McGrath MM, Abdi R, J. Clin. Invest 2018, 128, 4770. [DOI] [PMC free article] [PubMed] [Google Scholar]
- [19].Lee NK, Wang C-PJ, Lim J, Park W, Kwon H-K, Kim S-N, Kim T-H, Park CG, Nano Converg. 2021, 8, 24. [DOI] [PMC free article] [PubMed] [Google Scholar]
- [20].Melamed JR, Yerneni SS, Arral ML, LoPresti ST, Chaudhary N, Sehrawat A, Muramatsu H, Alameh M-G, Pardi N, Weissman D, Gittes GK, Whitehead KA, Sci. Adv 2023, 9, eade1444. [DOI] [PMC free article] [PubMed] [Google Scholar]
- [21].a) Fiorina P, Vergani A, Dada S, Jurewicz M, Wong M, Law K, Wu E, Tian Z, Abdi R, Guleria I, Rodig S, Dunussi-Joannopoulos K, Bluestone J, Sayegh MH, Diabetes 2008, 57, 3013; [DOI] [PMC free article] [PubMed] [Google Scholar]; b) Vergani A, D’Addio F, Jurewicz M, Petrelli A, Watanabe T, Liu K, Law K, Schuetz C, Carvello M, Orsenigo E, Deng S, Rodig SJ, Ansari JM, Staudacher C, Abdi R, Williams J, Markmann J, Atkinson M, Sayegh MH, Fiorina P, Diabetes 2010, 59, 2253; [DOI] [PMC free article] [PubMed] [Google Scholar]; c) Azzi J, Moore RF, Elyaman W, Mounayar M, El Haddad N, Yang S, Jurewicz M, Takakura A, Petrelli A, Fiorina P, Ruckle T, Abdi R, Diabetes 2012, DOI: db11-0134[pii] 10.2337/db11-0134; [DOI] [PMC free article] [PubMed] [Google Scholar]; d) Fiorina P, Jurewicz M, Augello A, Vergani A, Dada S, La Rosa S, Selig M, Godwin J, Law K, Placidi C, Smith RN, Capella C, Rodig S, Adra CN, Atkinson M, Sayegh MH, Abdi R, J. Immunol 2009, 183, 993; [DOI] [PMC free article] [PubMed] [Google Scholar]; e) Jurewicz M, Yang S, Augello A, Godwin JG, Moore RF, Azzi J, Fiorina P, Atkinson M, Sayegh MH, Abdi R, Diabetes 2010, 59, 3139. [DOI] [PMC free article] [PubMed] [Google Scholar]
- [22].Chatenoud L, Ferran C, Reuter A, Legendre C, Gevaert Y, Kreis H, Franchimont P, Bach JF, Engl N. J. Med 1989, 320, 1420. [DOI] [PubMed] [Google Scholar]
- [23].a) Ha D, Tanaka A, Kibayashi T, Tanemura A, Sugiyama D, Wing JB, Lim EL, Teng KWW, Adeegbe D, Newell EW, Katayama I, Nishikawa H, Sakaguchi S, Proc. Natl. Acad. Sci. USA 2019, 116, 609; [DOI] [PMC free article] [PubMed] [Google Scholar]; b) Wing K, Onishi Y, Prieto-Martin P, Yamaguchi T, Miyara M, Fehervari Z, Nomura T, Sakaguchi S, Science 2008, 322, 271. [DOI] [PubMed] [Google Scholar]
- [24].a) Cosimi AB CR, Burton RC, Winn HJ, Rubin R, Goldstein G, Kung PC, Hoffman RA, Hansen WP, Russell PS., Transplant Proc. 1981, 13, 1589; [PubMed] [Google Scholar]; b) Abramowicz D SL, Goldman M, Crusiaux A, Vereerstraeten P, De Pauw L, Wybran J, Kinnaert P, Dupont E, Toussaint C., Transplant. 1989, 47, 606; [DOI] [PubMed] [Google Scholar]; c) Chatenoud L, Ferran C, Legendre C, Thouard I, Merite S, Reuter A, Gevaert Y, Kreis H, Franchimont P, Bach JF, Transplant. 1990, 49, 697; [DOI] [PubMed] [Google Scholar]; d) Murthy H, Iqbal M, Chavez JC, Kharfan-Dabaja MA, ImmunoTargets. Ther 2019, 8, 43; [DOI] [PMC free article] [PubMed] [Google Scholar]; e) Morris EC, Neelapu SS, Giavridis T, Sadelain M, Nat. Rev. Immunol 2022, 22, 85; [DOI] [PMC free article] [PubMed] [Google Scholar]; f) Shimabukuro-Vornhagen A, Gödel P, Subklewe M, Stemmler HJ, Schlößer HA, Schlaak M, Kochanek M, Böll B, von Bergwelt-Baildon MS, J. ImmunoTher. Cancer 2018, 6, 56. [DOI] [PMC free article] [PubMed] [Google Scholar]
- [25].a) Sgro C, Toxicol. 1995, 105, 23; [DOI] [PubMed] [Google Scholar]; b) Alegre ML, Vandenabeele P, Depierreux M, Florquin S, Deschodt-Lanckman M, Flamand V, Moser M, Leo O, Urbain J, Fiers W, et al. , J. Immunol. (Baltimore, Md. : 1950) 1991, 146, 1184; [PubMed] [Google Scholar]; c) Ferran C, Sheehan K, Dy M, Schreiber R, Merite S, Landais P, Noel LH, Grau G, Bluestone J, Bach JF, et al. , Eur. J. Immunol 1990, 20, 509; [DOI] [PubMed] [Google Scholar]; d) Hirsch R, Eckhaus M, Auchincloss H Jr., Sachs DH, Bluestone JA, Immunol J. (Baltimore, Md. : 1950) 1988, 140, 3766. [PubMed] [Google Scholar]
- [26].a) Mitragotri S, Burke PA, Langer R, Nat. Rev. Drug Discov 2014, 13, 655; [DOI] [PMC free article] [PubMed] [Google Scholar]; b) Rajendran L, Knolker HJ, Simons K, Nat. Rev. Drug Discov 2010, 9, 29; [DOI] [PubMed] [Google Scholar]; c) MacDiarmid JA, Amaro-Mugridge NB, Madrid-Weiss J, Sedliarou I, Wetzel S, Kochar K, Brahmbhatt VN, Phillips L, Pattison ST, Petti C, Stillman B, Graham RM, Brahmbhatt H, Nat. Biotechnol 2009, 27, 643. [DOI] [PubMed] [Google Scholar]
- [27].a) Liu H, Moynihan KD, Zheng Y, Szeto GL, Li AV, Huang B, Van Egeren DS, Park C, Irvine DJ, Nature 2014, 507, 519; [DOI] [PMC free article] [PubMed] [Google Scholar]; b) Jewell CM, Lopez SC, Irvine DJ, Proc. Natl. Acad. Sci. USA 2011, 108, 15745; [DOI] [PMC free article] [PubMed] [Google Scholar]; c) Hunter Z, McCarthy DP, Yap WT, Harp CT, Getts DR, Shea LD, Miller SD, ACS Nano 2014, 8, 2148; [DOI] [PMC free article] [PubMed] [Google Scholar]; d) Reddy ST, van der Vlies AJ, Simeoni E, Angeli V, Randolph GJ, O’Neil CP, Lee LK, Swartz MA, Hubbell JA, Nat. Biotechnol 2007, 25, 1159. [DOI] [PubMed] [Google Scholar]
- [28].Zhang X, Kang Y, Wang J, Yan J, Chen Q, Cheng H, Huang P, Gu Z, Adv. Mater 2020, 32, 1907692. [DOI] [PubMed] [Google Scholar]
- [29].Wang M, Zhang Z, Huo Q, Wang M, Sun Y, Liu H, Chang J, He B, Liang Y, ACS Appl. Mater. Interfaces 2022, 14, 11092. [DOI] [PubMed] [Google Scholar]
- [30].a) Lernmark A, Larsson HE, Nat. Rev. Endocrinol 2013, 9, 92; [DOI] [PubMed] [Google Scholar]; b) Atkinson MA, Eisenbarth GS, Michels AW, Lancet 2014, 383, 69; [DOI] [PMC free article] [PubMed] [Google Scholar]; c) National Diabetes Statistics Report, https://www.cdc.gov/diabetes/data/statistics-report/index.html, accessed: January, 2023; [Google Scholar]; d) Dabelea D, Lancet 2009, 373, 1999. [DOI] [PubMed] [Google Scholar]
- [31].a) Herold KC, Hagopian W, Auger JA, Poumian-Ruiz E, Taylor L, Donaldson D, Gitelman SE, Harlan DM, Xu D, Zivin RA, Bluestone JA, Engl N. J. Med 2002, 346, 1692; [DOI] [PubMed] [Google Scholar]; b) Bisikirska BC, Herold KC, Ann. NY. Acad. Sci 2004, 1037, 1; [DOI] [PubMed] [Google Scholar]; c) Keymeulen B, Vandemeulebroucke E, Ziegler AG, Mathieu C, Kaufman L, Hale G, Gorus F, Goldman M, Walter M, Candon S, Schandene L, Crenier L, De Block C, Seigneurin J-M, De Pauw P, Pierard D, Weets I, Rebello P, Bird P, Berrie E, Frewin M, Waldmann H, Bach J-F, Pipeleers D, Chatenoud N L. Engl. J. Med 2005, 352, 2598; [DOI] [PubMed] [Google Scholar]; d) Sherry N, Hagopian W, Ludvigsson J, Jain SM, Wahlen J, Ferry RJ, Bode B, Aronoff S, Holland C, Carlin D, King KL, Wilder RL, Pillemer S, Bonvini E, Johnson S, Stein KE, Koenig S, Herold KC, Daifotis AG, Lancet 2011, 378, 487; [DOI] [PMC free article] [PubMed] [Google Scholar]; e) Hagopian W, Ferry RJ, Sherry N, Carlin D, Bonvini E, Johnson S, Stein KE, Koenig S, Daifotis AG, Herold KC, Ludvigsson J, for I. the Protégé Trial, Diabetes 2013, 62, 3901; [DOI] [PMC free article] [PubMed] [Google Scholar]; f) Orban T, Bundy B, Becker DJ, DiMeglio LA, Gitelman SE, Goland R, Gottlieb PA, Greenbaum CJ, Marks JB, Monzavi R, Moran A, Raskin P, Rodriguez H, Russell WE, Schatz D, Wherrett D, Wilson DM, Krischer JP, Skyler JS, The Type G. 1 Diabetes TrialNet Abatacept Study, Lancet 2011, 378, 412;21719096 [Google Scholar]; g) Skyler JS, Diabetes 2013, 62, 3656; [DOI] [PMC free article] [PubMed] [Google Scholar]; h) Herold KC, Gitelman SE, Ehlers MR, Gottlieb PA, Greenbaum CJ, Hagopian W, Boyle KD, Keyes-Elstein L, Aggarwal S, Phippard D, Sayre PH, McNamara J, Bluestone JA, Ab ATEST, Diabetes 2013, 62, 3766; [DOI] [PMC free article] [PubMed] [Google Scholar]; i) Keymeulen B WM, Mathieu C, Kaufman L, Gorus F, Hilbrands R, Vandemeulebroucke E, Van de Velde U, Crenier L, De Block C, Candon S, Waldmann H, Ziegler AG, Chatenoud L, Pipeleers D, Diabetologia 2010. 53, 614; [DOI] [PubMed] [Google Scholar]; j) Gill RG, Pagni PP, Kupfer T, Wasserfall CH, Deng S, Posgai A, Manenkova Y, Bel Hani A, Straub L, Bernstein P, Atkinson MA, Herold KC, von Herrath M, Staeva T, Ehlers MR, Nepom GT, Diabetes 2016, 65, 1310. [DOI] [PMC free article] [PubMed] [Google Scholar]
- [32].a) Somers WS, Tang J, Shaw GD, Camphausen RT, Cell 2000, 103, 467; [DOI] [PubMed] [Google Scholar]; b) von Andrian UH, Mackay CR, N Engl J Med 2000, 343, 1020; [DOI] [PubMed] [Google Scholar]; c) Carlow DA, Gossens K, Naus S, Veerman KM, Seo W, Ziltener HJ, Immunol. Rev 2009, 230, 75; [DOI] [PubMed] [Google Scholar]; d) Sperandio M, Gleissner CA, Ley K, Immunol. Rev 2009, 230, 97. [DOI] [PMC free article] [PubMed] [Google Scholar]
- [33].a) Ley K, Bullard DC, Arbones ML, Bosse R, Vestweber D, Tedder TF, Beaudet AL, J. Exp. Med 1995, 181, 669; [DOI] [PMC free article] [PubMed] [Google Scholar]; b) Ley K, Tedder TF, Immunol J. 1995, 155, 525; [PubMed] [Google Scholar]; c) Tedder TF, Steeber DA, Chen A, Engel P, Faseb. J 1995, 9, 866; [PubMed] [Google Scholar]; d) Rivera-Nieves J, Olson T, Bamias G, Bruce A, Solga M, Knight RF, Hoang S, Cominelli F, Ley K, Immunol J. 2005, 174, 2343. [DOI] [PubMed] [Google Scholar]
- [34].a) Berg EL, Robinson MK, Warnock RA, Butcher EC, Cell Biol J. 1991, 114, 343; [DOI] [PMC free article] [PubMed] [Google Scholar]; b) Hirakawa J, Tsuboi K, Sato K, Kobayashi M, Watanabe S, Takakura A, Imai Y, Ito Y, Fukuda M, Kawashima H, J. Biol. Chem 2010, 285, 40864; [DOI] [PMC free article] [PubMed] [Google Scholar]; c) Hemmerich S, Butcher EC, Rosen SD, J. Exp. Med 1994, 180, 2219; [DOI] [PMC free article] [PubMed] [Google Scholar]; d) Uchimura K, Rosen SD, Trends Immunol. 2006, 27, 559; [DOI] [PubMed] [Google Scholar]; e) Rosen SD, Tsay D, Singer MS, Hemmerich S, Abraham WM, Am. J. Pathol 2005, 166, 935; [DOI] [PMC free article] [PubMed] [Google Scholar]; f) Streeter PR, Rouse BT, Butcher EC, J. Cell. Bio 1988, 107, 1853. [DOI] [PMC free article] [PubMed] [Google Scholar]
- [35].a)Höglund P, Mintern J, Waltzinger C, Heath W, Benoist C, Mathis D, J. Exp. Med 1999, 189, 331; [DOI] [PMC free article] [PubMed] [Google Scholar]; b) Roncarolo MG, Battaglia M, Nat. Rev. Immunol 2007, 7, 585. [DOI] [PubMed] [Google Scholar]
- [36].a) Clare-Salzler M, Mullen Y, Immunol. 1992, 76, 478; [PMC free article] [PubMed] [Google Scholar]; b) Fabien N, Bergerot I, Maguer-Satta V, Orgiazzi J, Thivolet C, Autoimmun J. 1995, 8, 323; [DOI] [PubMed] [Google Scholar]; c) Katz JD, Wang B, Haskins K, Benoist C, Mathis D, Cell 1993, 74, 1089; [DOI] [PubMed] [Google Scholar]; d) Turley S, Poirot L, Hattori M, Benoist C, Mathis D, J. Exp. Med 2003, 198, 1527; [DOI] [PMC free article] [PubMed] [Google Scholar]; e) Turley SJ, Lee JW, Dutton-Swain N, Mathis D, Benoist C, Proc. Natl. Acad. Sci. USA 2005, 102, 17729; [DOI] [PMC free article] [PubMed] [Google Scholar]; f) Alam C, Valkonen S, Ohls S, Tornqvist K, Hanninen A, Diabetologia 2010, 53, 346; [DOI] [PubMed] [Google Scholar]; g) Nti BK, Markman JL, Bertera S, Styche AJ, Lakomy RJ, Subbotin VM, Trucco M, Zorina TD, Cell Mol. Immunol 2012, 9, 455. [DOI] [PMC free article] [PubMed] [Google Scholar]
- [37].a) Michie SA, Streeter PR, Bolt PA, Butcher EC, Picker LJ, Am. J. Pathol 1993, 143, 1688; [PMC free article] [PubMed] [Google Scholar]; b) Xu B, Wagner N, Pham LN, Magno V, Shan Z, Butcher EC, Michie SA, J. Exp. Med 2003, 197, 1255; [DOI] [PMC free article] [PubMed] [Google Scholar]; c) Baddoura FK, Nasr IW, Wrobel B, Li Q, Ruddle NH, Lakkis FG, Am. J. Transplant 2005, 5, 510; [DOI] [PubMed] [Google Scholar]; d) Yin N, Zhang N, Xu J, Shi Q, Ding Y, Bromberg JS, Transplant. 2011, 92, 25; [DOI] [PMC free article] [PubMed] [Google Scholar]; e) Sato M, Hirayama S, Hwang DM, Lara-Guerra H, Wagnetz D, Waddell TK, Liu M, Keshavjee S, Immunol J. 2009, 182, 7307; [DOI] [PubMed] [Google Scholar]; f) Kendall PL, Yu G, Woodward EJ, Thomas JW, Immunol J. 2007, 178, 5643; [DOI] [PubMed] [Google Scholar]; g) Penaranda C, Tang Q, Ruddle NH, Bluestone JA, Diabetes 2010, 59, 1461; [DOI] [PMC free article] [PubMed] [Google Scholar]; h) Arata-Kawai H, Singer MS, Bistrup A, Zante A, Wang YQ, Ito Y, Bao X, Hemmerich S, Fukuda M, Rosen SD, Am. J. Pathol 2011, 178, 423; [DOI] [PMC free article] [PubMed] [Google Scholar]; i) Korpos É, Kadri N, Loismann S, Findeisen CR, Arfuso F, Burke GW 3rd, Richardson SJ, Morgan NG, Bogdani M, Pugliese A, Sorokin L, Diabetologia 2021, 64, 1626. [DOI] [PMC free article] [PubMed] [Google Scholar]
- [38].Rennick JJ, Johnston APR, Parton RG, Nat. Nanotechnol 2021, 16, 266. [DOI] [PubMed] [Google Scholar]
- [39].a) Kalinowska A, Losy J, European Journal of Neurology 2006, 13, 1284; [DOI] [PubMed] [Google Scholar]; b) Dan M, Cochran DB, Yokel RA, Dziubla TD, PLOS ONE 2013, 8, e81051. [DOI] [PMC free article] [PubMed] [Google Scholar]
- [40].a) Wu Y, Yi M, Zhu S, Wang H, Wu K, Exp. Hematol. Oncol 2021, 10, 56; [DOI] [PMC free article] [PubMed] [Google Scholar]; b) Labrijn AF, Janmaat ML, Reichert JM, Parren PWHI, Nat. Rev. Drug. Discov 2019, 18, 585. [DOI] [PubMed] [Google Scholar]
- [41].a) Dong Y, Feng SS, Biomaterials 2005, 26, 6068; [DOI] [PubMed] [Google Scholar]; b) Kim DH, Martin DC, Biomater. 2006, 27, 3031; [DOI] [PubMed] [Google Scholar]; c) Aguado MT, Lambert PH, Immunobiol. 1992, 184, 113; [DOI] [PubMed] [Google Scholar]; d) Kelly RJ, Rev. Surg 1970, 27, 142; [PubMed] [Google Scholar]; e) Blanco E, Shen H, Ferrari M, Nat. Biotechnol 2015, 33, 941. [DOI] [PMC free article] [PubMed] [Google Scholar]
- [42].a) Bahmani B, Uehara M, Jiang L, Ordikhani F, Banouni N, Ichimura T, Solhjou Z, Furtmuller GJ, Brandacher G, Alvarez D, von Andrian UH, Uchimura K, Xu Q, Vohra I, Yilmam OA, Haik Y, Azzi J, Kasinath V, Bromberg JS, McGrath MM, Abdi R, J. Clin. Invest 2018, 128, 4770; [DOI] [PMC free article] [PubMed] [Google Scholar]; b) Ordikhani F, Uehara M, Kasinath V, Dai L, Eskandari SK, Bahmani B, Yonar M, Azzi JR, Haik Y, Sage PT, Murphy GF, Annabi N, Schatton T, Guleria I, Abdi R, JCI insight 2018, 3. [DOI] [PMC free article] [PubMed] [Google Scholar]
- [43].a) Gref R, Lück M, Quellec P, Marchand M, Dellacherie E, Harnisch S, Blunk T, Müller RH, Colloids and Surf. B: Biointerfaces 2000, 18, 301; [DOI] [PubMed] [Google Scholar]; b) Bertrand N, Grenier P, Mahmoudi M, Lima EM, Appel EA, Dormont F, Lim J-M, Karnik R, Langer R, Farokhzad OC, Nat. Commun 2017, 8, 777. [DOI] [PMC free article] [PubMed] [Google Scholar]
- [44].a) Uster PS, Working PK, Vaage J, International Journal of Pharmaceutics 1998, 162, 77; [Google Scholar]; b) Gradishar WJ, Tjulandin S, Davidson N, Shaw H, Desai N, Bhar P, Hawkins M, O’Shaughnessy J, J. Clin. Oncol 2005, 23, 7794. [DOI] [PubMed] [Google Scholar]
- [45].Nokhodi F, Nekoei M, Goodarzi MT, J. Mater. Sci.: Mater. Med 2022, 33, 24. [DOI] [PMC free article] [PubMed] [Google Scholar]
- [46].Xiao K, Li Y, Luo J, Lee JS, Xiao W, Gonik AM, Agarwal RG, Lam KS, Biomater. 2011, 32, 3435. [DOI] [PMC free article] [PubMed] [Google Scholar]
- [47].Hansel TT, Kropshofer H, Singer T, Mitchell JA, George AJT, Nat. Rev. Drug Discov 2010, 9, 325. [DOI] [PubMed] [Google Scholar]
- [48].a) Trinklein ND, Pham D, Schellenberger U, Buelow B, Boudreau A, Choudhry P, Clarke SC, Dang K, Harris KE, Iyer S, Jorgensen B, Pratap PP, Rangaswamy US, Ugamraj HS, Vafa O, Wiita AP, van Schooten W, Buelow R, Force Aldred S, mAbs. 2019, 11, 639; [DOI] [PMC free article] [PubMed] [Google Scholar]; b) Malcolm SL, Smith EL, Bourne T, Shaw S, Immunol J. Methods 2012, 384, 33; [DOI] [PubMed] [Google Scholar]; c) Li J, Piskol R, Ybarra R, Chen YJ, Li J, Slaga D, Hristopoulos M, Clark R, Modrusan Z, Totpal K, Junttila MR, Junttila TT, Sci. Transl. Med.. 2019, 11. [DOI] [PubMed] [Google Scholar]
- [49].a) Zhang Y, Li N, Suh H, Irvine DJ, Nat. Commun 2018, 9, 6; [DOI] [PMC free article] [PubMed] [Google Scholar]; b) Shimabukuro-Vornhagen A, Gödel P, Subklewe M, Stemmler HJ, Schlößer HA, Schlaak M, Kochanek M, Böll B, von Bergwelt-Baildon MS, Immunother J. Cancer 2018, 6, 56. [DOI] [PMC free article] [PubMed] [Google Scholar]
- [50].Sousa F, Castro P, Fonte P, Kennedy PJ, Neves-Petersen MT, Sarmento B, Expert Opin. Drug deliv 2017, 14, 1163. [DOI] [PubMed] [Google Scholar]
Associated Data
This section collects any data citations, data availability statements, or supplementary materials included in this article.
Supplementary Materials
Figure S1. (A) A TEM image of a conventional venule in PLN of NOD mouse (12 week-old) at 6 hours post-injection of MECA79-GNPs. (B) A TEM image of MECA79-anti-CD3-NP. Scale bar: 200 nm. Inset: size distribution of the NP. (C–D) Hydrodynamic size (C) and zeta-potential (D) of anti-CD3-NP before and after conjugation with MECA79 mAb. ***p < 0.001, n = 5 samples/group. Significance was determined by Student’s t-test. (E) Amount of released anti-CD3 mAb from MECA79-anti-CD3-NPs in serum over time at RT.
Figure S2. Quantification of MFI of NOD PLN 1 day after the administration of IgM-IR800-NP or MECA79-IR800-NP. **p < 0.01, n = 3 mice/group, significance was determined by Student’s t-test).
Figure S3. PLN fluorescence micrograph of NOD mouse 1 day after the administration of MECA79- NPs (red). PLNs were stained for CD11b (green). White arrows indicate CD11b+ cells; these areas are magnified in insets. Scale bar: 50 μm.
Figure S4. Fluorescence micrograph of pancreas in BALB/c mouse. Nuclei (blue), PNAd (green), and insulin (white) were stained. White arrows indicate islets. Scale bar: 25 μm.
Figure S5. Quantification of MFI of pancreas from NOD mouse 1 day after the administration of IgM-IR800-NP or MECA79-IR800-NP, **p < 0.01, n = 3 mice/group, significance was determined by Student’s t-test).
Figure S6. PLN fluorescence micrograph of NOD 6 days after the administration of MECA79-anti-CD3*-NPs. PLNs were stained for PNAd (green). White arrows indicate anti-CD3*. Scale bar: 25 μm.
Figure S7. Fluorescence micrograph of pancreas from NOD mouse 1 day after the administration of MECA79-anti-CD3*-NP. Pancreas was stained for nuclei (blue), insulin (green), CD3+ cells (gray). Scale bar: 25 μm.
Figure S8. Levels of C-peptide in newly hyperglycemic NOD mice treated with MECA79-anti-CD3-NP or left untreated.
Figure S9. Curves of blood glucose levels during intraperitoneal glucose tolerance test in newly hyperglycemic NOD mice either untreated or treated with MECA79-anti-CD3.
Figure S10. CD69+CD8+ Teff in NOD PLN following no treatment or treatment with free anti-CD3 or MECA79-anti-CD3-NPs.
Figure S11. IL-17A+CD8 Teff percentage in pancreata of NOD mice following no treatment or treatment with free anti-CD3 or MECA79-anti-CD3-NPs.
Figure S12. (A) Fluorescence micrograph of the pancreas of donor with T1D. Pancreas was stained for nuclei (blue), CD3 (green), PNAd (red), glucagon (cyan), and insulin (yellow). (B) Fluorescence micrograph of non-diabetic donor. Nuclei (blue), PNAd (green), and insulin (red) were stained. Scale bar: 50 μm.
Data Availability Statement
All data generated or analyzed for this study are available from the corresponding author upon reasonable request.