

Abstract
Regulatory T cells (Treg) are conventionally viewed as suppressors of endogenous and therapy-induced antitumor immunity; however, their role in modulating responses to immune checkpoint blockade (ICB) is unclear. In this study, we integrated single-cell RNA-seq/T cell receptor sequencing (TCRseq) of >73,000 tumor-infiltrating Treg (TIL-Treg) from anti–PD-1–treated and treatment-naive non–small cell lung cancers (NSCLC) with single-cell analysis of tumor-associated antigen (TAA)–specific Treg derived from a murine tumor model. We identified 10 subsets of human TIL-Treg, most of which have high concordance with murine TIL-Treg subsets. Only one subset selectively expresses high levels of TNFRSF4 (OX40) and TNFRSF18 (GITR), whose engangement by cognate ligand mediated proliferative programs and NF-κB activation, as well as multiple genes involved in Treg suppression, including LAG3. Functionally, the OX40hiGITRhi subset is the most highly suppressive ex vivo, and its higher representation among total TIL-Treg correlated with resistance to PD-1 blockade. Unexpectedly, in the murine tumor model, we found that virtually all TIL-Treg–expressing T cell receptors that are specific for TAA fully develop a distinct TH1-like signature over a 2-week period after entry into the tumor, down-regulating FoxP3 and up-regulating expression of TBX21 (Tbet), IFNG, and certain proinflammatory granzymes. Transfer learning of a gene score from the murine TAA-specific TH1-like Treg subset to the human single-cell dataset revealed a highly analogous subcluster that was enriched in anti–PD-1–responding tumors. These findings demonstrate that TIL-Treg partition into multiple distinct transcriptionally defined subsets with potentially opposing effects on ICB-induced antitumor immunity and suggest that TAA-specific TIL-Treg may positively contribute to antitumor responses.
INTRODUCTION
Immune checkpoint blockade (ICB) induces durable clinical responses in a subset of patients with non–small cell lung cancer (NSCLC); however, most tumors do not respond (1). A major frontier in cancer immunology is understanding the many factors in the tumor microenvironment (TME) that block versus promote antitumor immunity. ICB efficacy relies on endogenous tumor-reactive T cells for tumor eradication. In our ongoing efforts to understand mechanisms of ICB response versus resistance, we recently reported on the transcriptional programming of CD8+ tumor-infiltrating lymphocytes (TILs) in resectable lung cancers treated with neoadjuvant ICB (2). We found that the breadth and frequency of CD8+ TILs recognizing antigens derived from tumor somatic mutations (neoantigens) were not associated with pathologic response, thereby suggesting the existence of immunosuppressive mechanisms that can thwart otherwise effective antitumor immunity.
One candidate immune inhibitory cell population in the TME is the regulatory T cell (Treg), characterized by expression of CD4 and the forkhead box protein P3 (FoxP3). These cells maintain systemic immune homeostasis by regulating peripheral tolerance and mitigating autoimmune disease (3) through a variety of immunosuppressive mechanisms (4). Treg depletion experiments in mice demonstrate that this population can potently suppress antitumor effector T cell responses and prevent tumor clearance by endogenous tumor-specific effector T cells (5, 6). Treg representation among total TILs in diverse murine and human cancers is generally much higher than in corresponding normal tissue and blood, and increased tumor infiltration by Treg expressing specific genes was recently correlated with poor prognosis in NSCLC (7, 8). These findings have led to multiple clinical approaches to selectively deplete or inhibit Treg in tumors, but none to date have been successful, possibly because of lack of Treg specificity or failure to inhibit key functionally relevant Treg subsets. Thus, an understanding of the phenotype and specificity of tumor-infiltrating lymphocyte Treg (TIL-Treg) is critical to target them for effective immunotherapy.
Contrary to conventional CD4 T cells (Tconv), whose self-specific repertoire is negatively selected, Treg are selected for expression of T cell receptors (TCRs) that recognize self-antigen, thereby allowing them to maintain self-tolerance via targeted immune suppression. Under certain circumstances of pathologic autoimmunity, Treg can lose FoxP3 and differentiate to acquire a Tconv program (so-called ex-Treg) and thereby exacerbate autoimmunity via interferon-γ (IFN-γ) production and recruitment of T helper 1 (TH1) cells (9). Although historically Treg were dichotomized into thymic (natural Treg) versus peripheral (induced Treg) in origin, single-cell RNA sequencing (scRNA-seq) technology has enabled more refined analysis of these cells to reveal a level of Treg heterogeneity that was not previously appreciated (10–16).
To study the transcriptional programming and function of TIL-Treg at refined resolution, we used scRNA-seq of TIL-Treg harvested from resected human lung cancers [and adjacent normal lung (NL)] from untreated patients and those treated with anti–PD-1 and, in parallel, integrated these data with an analysis of a murine tumor model wherein tumor-associated antigen (TAA)–specific Treg were tracked. We identified two distinct Treg subsets displaying opposite associations with ICB response. One is an activated, highly suppressive Treg subset, characterized by a unique tumor necrosis factor receptor superfamily (TNFRSF) expression pattern and high levels of genes encoding multiple suppressive and tumor-homing molecules, that associates with ICB nonresponsiveness. The other is a unique population of TAA-specific Treg, defined in murine tumors, that exhibits certain characteristics of “ex-Treg,” with Foxp3 down-regulation and an acquired TH1-like effector program. Using computational gene score homology analysis, we identified an analogous population in human lung cancers that was enriched in ICB-responding tumors. These findings reveal a previously unappreciated diverse substructure of TIL-Treg that consists of distinct subsets that can either inhibit or enhance antitumor responses, defining potential Treg targets for therapeutic modulation.
RESULTS
Treg transcriptional programs in resected lung cancers treated with ICB
To better understand the transcriptional programs of TIL-Treg subsets and their potential role in ICB responsiveness, we analyzed a dataset of coupled single-cell TCRseq/RNA-seq on CD3+ TIL isolated from resected lung cancers and adjacent NL tissue, derived from patients treated with neoadjuvant PD-1 blockade (NCT02259621) (17). We have previously reported on transcriptional programming of neoantigen-specific CD8+ T cells from this dataset (2). Of these 15 ICB-treated tumors, 6 had a major pathologic response (MPR), defined as ≤10% residual tumor at the time of surgery (table S1), which was recently associated with improved overall survival in lung cancers treated with neoadjuvant combination immunotherapy in the CheckMate 816 trial (NCT02998528) (18). Per standard convention, we refer to tumors with MPR as responders (R) and tumors without MPR as nonresponders (NR). In addition, coupled single-cell TCRseq/RNA-seq was performed prospectively on CD3+ T cells from tumor and adjacent NL from 10 treatment-naive patients with resectable lung cancer (table S2). After stringent quality control filtering, 851,674 CD3+ T cells passed quality control and were integrated to obtain broad CD4+ and CD8+ T cell subsets as visualized by uniform manifold approximation and projection (UMAP) dimensionality reduction (fig. S1A). Refined clustering of 375,001 CD8−, CD4+ T cells identified 11 subclusters, with three distinct Treg clusters (fig. S1B). Computational selection of FoxP3+CD8neg cells identified 73,882 Treg. Consistent with known Treg transcriptional programs (19–21), this FoxP3+CD8neg population expressed higher levels of CTLA4 and IKZF2, which encodes the zinc finger protein Helios and lower levels of IL7R (CD127) relative to conventional CD4+ TIL (fig. S1C). This large number of individual human Treg transcriptomes allowed us to cluster the TIL-Treg with extremely high resolution; thus, we identified 10 distinct Treg subclusters (Fig. 1A and table S3). Four “Activated” clusters were identified on the basis of high expression of IL2RA, CCR8, and ICOS, which are broadly associated with Treg activation (22–24) and expression of published gene sets induced by TCR activation (KEGG; Kyoto Encyclopedia of Genes and Genomes) and IL-2 signaling (BioCarta) (Fig. 1B and fig. S1D). Cluster-defining genes and select functional markers are shown in Fig. 1 (B and C) and S1E. Activated (1)/ OX40hiGITRhi had a transcriptional program consistent with a unique activated state, as evidenced by high selective expression of the TNFRSF members TNFRSF4 (OX40) and TNFRSF18 (GITR) (Fig. 1, B and C, and fig. S1E) (7). Although these molecules have been reported to be generally expressed among TIL-Treg, they have not previously been shown to be selectively expressed by a single Treg subset, representing on average 19.9% of total TIL-Treg (range, 9.75 to 41.67%; fig. S2A). A number of additional activation genes were shared with one of the other activated clusters, including LAG3 [Activated (2)] and TNFRSF9 (41BB), ICOS, and CCR8 [Activated (3)]. In contrast, there was an LN-homing cluster (SELL and S1PR1), two “resting” clusters based on expression of SESN3 and gene sets associated with resting Treg (Fig. 1, B and C, and fig. S1, D and E), and an “inactive” population with overall low differential gene expression or gene set enrichment analysis association (Fig. 1B and fig. S1D). Other distinct clusters included a type I IFN-responsive cluster enriched for IFN-inducible genes such as IFI6 and MX1 and expression of an IFN-responsive gene set and an unusual subset characterized by expression of genes typically expressed by TH1 cells, such as CCL4 (MIP-1β), CCL5 (RANTES), IFNG, and multiple granzyme genes typically found in activated CD8 cytotoxic lymphocytes (Fig. 1, B and C; fig. S1E; and table S3). Cell proportion analysis identified enriched representation of the Activated (1)/ OX40hiGITRhi (P = 0.0054), Resting (2) (P = 8.8 × 10⁻¹⁰), and Activated (4) (P = 0.014) clusters in tumor relative to adjacent NL, whereas the LN-homing cluster was enriched in adjacent NL (P = 4.5 × 10⁻⁸; fig. S2A). The distinct pathologic responses among different patients in the trial allowed us to ascertain whether specific Treg subsets were associated with ICB response, but globally, there was no difference in TIL-Treg subcluster proportions between treated and untreated tumors nor between R and NR (fig. S2B). Principal component analysis (PCA) of pseudobulk gene expression separated TIL-Treg from those derived from adjacent NL (Fig. 1D), indicating distinct global transcriptional programs in tumor-derived versus adjacent NL Treg, but could not distinguish R from NR (Fig. 1E) nor treated from treatment-naive (fig. S2C). These data suggest that more refined analyses of Treg subsets might be needed to define transcriptional programs associated with PD-1 blockade resistance.
Fig. 1. Single-cell transcriptomic profiling of Treg in treatment-naïve and neoadjuvant anti–PD-1–treated NSCLCs.

Coupled scRNA-seq/TCR-seq was performed on T cells isolated from resected tumor (n = 15), adjacent NL (n = 12), TDLN (n = 3), and a resected brain metastasis (n = 1) from patients with NSCLC treated with two doses of neoadjuvant anti–PD-1 as well as resected tumor (n = 10) and paired adjacent NL (n = 8) from treatment-naïve patients with NSCLC. (A) Two-dimensional (2D) UMAP projection of the expression profiles of the 73,882 Treg that passed QC. Treg subsets, defined by 10 unique clusters, are annotated and marked by color code. (B) Relative expression [average log2(fold change)] for top differential genes for each cluster is visualized on a heatmap. Three thousand cells (or all cells in the cluster if cluster size <3000 cells) were randomly sampled from each cluster for visualization. Differential expression tests for Treg cell subsets were performed with Wilcoxon rank sum test. Genes with >0.25 log2 fold changes, at least 25% expressed in tested groups, and genes with Bonferroni-corrected P values < 0.05 were regarded as differentially expressed. (C) The expression of canonical Treg subset marker genes and cell subset selective genes was visualized in red scale using UMAP projection. (D) PCA and canonical correlation of pseudobulk gene expression for individual tumor (yellow, n = 25) and adjacent NL (dark blue, n = 20) samples. Canonical correlation with tissue type = 0.56, P < 0.001. (E) PCA and canonical correlation of pseudobulk gene expression for individual nonresponder (red, n = 9) and responder (blue, n = 6) tumors. Canonical correlation with response status = 0.36, P = 0.50.
OX40hiGITRhi Treg are highly suppressive and correlate with ICB resistance
Although OX40 and GITR have been targeted with agonist antibodies based on their costimulatory roles on Tconv, they are also expressed by TIL-Treg (25), in which their role has yet to be clarified. Among all the TIL-Treg, the Activated (1)/OX40hiGITRhi cluster exhibited markedly increased expression of multiple genes encoding molecules that mediate suppressive activity, such as FoxP3, IL2RA, LAG3, ENTPD1 (CD39), EBI3, and LAYN (7, 23, 26–28), when compared with all other Treg clusters, suggesting a highly immunosuppressive phenotype (Fig. 1B and table S4). Unlike in prior work by Guo and colleagues (29), TNFRSF9 (4–1BB) was not particularly selective for this subset. Variations of this “activated” Treg subset have been identified in prior lung cancer studies and have consistently shown coexpression of TNFRSF4 (OX40) and TNFRSF18 (GITR) (7, 29, 30). Although bulk LAG3 expression by TIL-Treg has also been shown (7), LAG3 coexpression by this OX40hiGITRhi subset has not previously been reported. Moreover, the suppressive function of this subset and its association with ICB response are not known.
To determine whether the Activated (1)/OX40hiGITRhi Treg displayed functionally superior suppressive capacity, we sorted OX40hiGITRhi and OX40lowGITRlow Treg from ICB-treated tumors to test their ability to suppress Tconv cells ex vivo. OX40hi GITRhi Treg were markedly more suppressive than the composite remainder of TIL Treg that expressed low levels of TNFRSF4 and TNFRSF18 (Fig. 2A and fig. S3). Although the proportion of individual Treg subclusters was not different between our treatment and response groups (fig. S2B), we hypothesized that Treg activation status could be affected because of the enrichment of the Activated (1)/OX40hiGITRhi cluster in TIL compared with adjacent NL Treg (figs. S2A and S4A). We therefore developed an activated Treg score derived from the top differentially expressed genes in Activated (1) relative to all other TIL-Treg. In addition to TNFRSF4 and TNFRSF18, LAG3 stood out as the third most highly differentially expressed gene (Fig. 2B, fig. S1E, and table S4). TIL-Treg expressing the activated Treg score were localized within the Activated (1)/ OX40hiGITRhi cluster (Fig. 2C and fig. S4, B and C) and significantly more enriched in NR versus R tumors (P = 0.038; Fig. 2, C and D, and fig. S4, B and C). Treatment-naïve tumors had high representation of Treg with a high activation score, similar to ICB NRs (P = 0.670), suggesting that contraction of this subset was a consequence of successful ICB treatment in responding tumors. In contrast, the unusual TH1-like/cytotoxic cluster (Fig. 1, A and B) was not enriched in NR tumors. There was no difference in frequency of Treg with a high activation score in adjacent NL among the different groups (P = 0.620), indicating that the difference between NR and R is specific to the TME (Fig. 2D). Enrichment of activated Treg in NR tumors could be due to differentiation into a more activated, suppressive state, better maintenance of that state, and/or prevention of differentiation out of that state. Previous studies have used velocity trajectory analyses to demonstrate tumor TNFRSF+ Treg to be a terminal differentiation state (12, 15). To address this question, we assessed TCR clonal sharing between each subcluster, based on the notion that clones shared between and among clusters can serve as lineage tracing markers and thus reflect developmental connectivity. This method has been previously used to study the development and differentiation of many T cell subsets, including Treg in human and murine tumors (31–33). Of 1047 clones found in more than one cluster, 699 (66.8%) were shared between Activated (1)/OX40hiGITRhi and Activated (3) (Fig. 2E). Next, we performed diffusion trajectory and RNA velocity analysis on Treg clones shared in the Activated (1)/OX40hiGITRhi and Activated (3) clusters to better understand potential developmental relationships between these clusters in NR versus R tumors. On the basis of this analysis, we found that TIL-Treg within R tumors have a trajectory consistent with differentiating out of Activated (1)/OX40hi/GITRhi into Activated (3), contrasting with what is seen in NR tumors, in which the TIL-Treg developmental trajectory is consistent with differentiation into the Activated (1)/OX40hiGITRhi cluster with essentially no differentiation out of that state (Fig. 2F). Together, these findings indicate that the paucity of Activated (1)/OX40hiGITRhi cells in R tumors could be due to a net differentiation flux out of this subset, in contrast to NR (Fig. 2F) (34). In support of this, the proportion of Activated (1) relative to Activated (3) was significantly decreased in R tumors relative to NR (P = 0.0115) and treatmentnaïve (P = 0.0136; Fig. 2G).
Fig. 2. Activated, OX40hiGITRhi Treg are functionally suppressive and associate with nonresponse to PD-1 blockade.

(A) Functional analysis of OX40loGITRlo and OX40hiGITRhi TIL-Treg–mediated suppression of conventional CD4+T cell (Tconv) proliferation. TIL-Treg from patients MD017–0157, MD017–0092, MD017–0115, MD017–0124, and MD017–0116 were combined to ensure sufficient Treg numbers for this experiment (n = 1). (B) Volcano plot showing differential expression between the Activated (1)/OX40hiGITRhi cluster (right) versus all other Treg (left) when analyzing all tumor samples (n = 25). Each dot represents one gene. False discovery rate (FDR) < 0.05 is considered significant (blue/red dots). LAG3, TNFRSF18, and TNFRSF4 represent the top three most differentially expressed genes in the Activated (1)/OX40hiGITRhi Treg (red dots). (C) Overlay of the Activated Treg score on the TIL-Treg UMAP for each response/treatment group. Red indicates higher expression; blue indicates lower expression. (D) The frequency of Treg with a high Treg activation score is shown for tumor (left) and adjacent NL (right) from nonresponders (NR; red), responders (R; blue), and treatment-naive patients (Tx-naive; green). Comparisons were performed at the individual patient level using Wilcoxon rank test. (E) Clonotype sharing pattern across Treg subsets. The frequencies of Treg TCR clones that were detected in at least two Treg clusters were calculated and are shown on a heatmap. (F) Diffusion plot with RNA velocity for the Activated (1)/ OX40hiGITRhi and Activated (3) clusters (among which most clonotype sharing was observed). (G) Boxplots showing the relative proportion of Activated (1)/OX40hi GITRhi and Activated (3) clusters by R (blue), NR (red), and treatment-naïve status (green). (H) A violin plot shows TNFSF4 (OX40L) expression by neoantigen-specific (red) and flu-specific (blue) CD8 TILs from the same neoadjuvant-treated patients. (I) Violin plot comparing TNFSF4 (OX40L) expression by neoantigen-specific CD8+ TIL between nonresponding (red)and responding (blue) tumors. (J) Gene set enrichment analysis to evaluate differing biological functions of ex vivo OX40L, 41BBL, and GITRL agonism in sorted human TIL-Treg. TIL-Treg from patients MD043–011 and MD01–019 were combined to ensure sufficient Treg numbers for this experiment (n = 1). NF-κB, nuclear factor κB.
Beyond being markers for a highly suppressive Treg, TNFRSF4, TNFRSF18, and TNFRSF9—the three TNFRSF members most highly expressed by the Activated (1)/ OX40hi/GITRhi subset— likely play active roles in their function (34) that would be dependent on expression of their cognate ligands within the TME. We therefore broadly queried the expression of TNFR ligands on all intratumoral T cell and myeloid populations to define specific cell types that may be interacting with the TNFRSF4- and TNFRSF18-expressing Treg. We found that in treated and untreated NSCLC, expression of TNFSF18 (GITRL) was very low across all cell types in the TME, thus precluding our analysis of this ligand. However, TNFSF9 (4–1BBL) was broadly expressed on both myeloid and T cells, and TNFSF4 (OX40L) was highly expressed on a limited number of T cells, most notably on CD8+ T cells (fig. S4D). Given that expression of TNFSF4 was restricted to CD8 T cells, we queried our previously published flu-reactive and neoantigen-specific CD8+ TILs in this patient cohort (2). There was significantly higher expression of TNFSF4 on neoantigen- versus flu-reactive TILs (P < 2.2 × 10⁻¹⁶; Fig. 2H). Furthermore, TNFSF4 expression on neoantigen-specific CD8+ TILs was much higher in NR compared with R tumors (P < 2.2 × 10⁻¹⁶; Fig. 2I). There was no significant difference in expression in TNFSF9 or TNFSF18 on neoantigen- versus flu-reactive TILs, regardless of response status (fig. S4E).
To assess the effect of TNFRSF signaling on Treg transcriptional programs, we generated HEK-293T cell lines expressing each of the three TNFRSF ligands (OX40L, GITRL, and 41BBL; fig. S5). Sorted Treg from two NR tumors were cocultured with the ligand-expressing 293T cells, followed by single-cell TCRseq/RNA-seq of the Treg. In each ligand-stimulated condition, the noncanonical nuclear factor κB pathway was enriched (R-HAS-5676594, GSE18893; Fig. 2J and tables S5 to S7). Specifically, 4–1BB agonism initiated its unique gene program (BIOCARTA_41BB_PATHWAY; table S5), 4–1BB and GITR agonism showed enrichment for a gene set associated with TNFR2 signaling (R-HAS-5668541; tables S5 and S6) (35–38), and OX40 agonism strongly up-regulated a cell proliferation gene set (GO:0008283; table S7 and fig. S2J) (39). Given the particularly high expression of TNFSF4 on neoantigen-specific CD8+ T cells in NR tumors (Fig. 2I), our findings suggest that they may be providing a signal to expand this suppressive OX40hi GITRhi Treg subset, thereby subverting their own potential antitumor activity. In summary, we show here that, although OX40+ and GITR+ Treg have been identified previously in lung cancers (29, 30, 35, 40, 41), this subset is functionally highly suppressive ex vivo and is expanded in anti–PD-1 NR, possibly driven by TNFSF4 expression by neoantigen-specific CD8 T cells.
Tumor antigen-specific Treg acquire a TH1-like transcriptional signature in an ICB-responsive murine tumor model
In direct contrast to Tconv cells, Treg are selected to recognize self-antigen (42). Naturally occurring Treg are positively selected in the thymus by a broad set of self-antigens expressed in thymic epithelial cells (43–45). To model the biology of TAA-specific TIL-Treg, we developed a mouse adoptive transfer model of Treg with fixed specificity. We crossed the B6.Cg-Tg(TcrLCMV) TCR transgenic line that has a CD4+ TCR (termed SMARTA) specific for the H2-I-Ab–restricted LCMV GP61–80 epitope (46) to mice that have expression of the LCMV glycoprotein (GP) controlled by the rat insulin promoter (RIP-GP) (47, 48). It has been well documented that RIP is also active in murine thymic epithelial cells (49, 50). Consistent with the developmental biology of Treg, virtually no FoxP3+ Treg bearing the SMARTA TCR develop in the absence of GP as a self-antigen, so this mating results in offspring with a much higher frequency of LCMV GP61–80–restricted CD4+FoxP3+ Treg because of thymic expression of GP (49, 51). We then crossed these mice to CD45.1;RFP-FoxP3 mice to generate a Treg reporter mouse line with a transgenic TCR of known reactivity. CD45.1-marked transgenic CD25hiRFP-FoxP3+ Treg expressing the SMARTA TCR alpha and beta chains (Vα2.3-JαDK1 and Vβ8.3-Jβ2.5) were sorted, and 2 × 10⁵ SMARTA TCR+ Treg per mouse were adoptively transferred to recipient B6 CD45.2 mice (fig. S6, A and B). As a tumor model, we used the ICB-responsive MC38, which either did or did not express GP. MC38-GP tumors grew more slowly than MC38wt tumors and were also more sensitive to PD-1 blockade (fig. S6A). Mice adoptively transferred with CD45.1-marked transgenic CD25hiRFP-FoxP3+ Treg expressing the SMARTA TCR were inoculated with either the MC38 parental line (MC38WT), which is an ICB-responsive tumor or an MC38-GP-expressing line (52). After 14 days of tumor growth, we harvested the tumors and sorted TIL-Treg on the basis of high expression of CD25. The sorted population consisted of a mix of distinguishable tumor-reactive (TR)–Treg that were adoptively transferred (SMARTA TCR+/RFP+) and endogenous Treg (SMARTA TCRneg/RFPneg) (fig. S6C). Notably, fewer than 1% of total Treg in the spleen were from the donor SMARTA TCR+ Treg 14 days after adoptive transfer, a proportion similar to previous protocols using adoptively transferred Tconv (fig. S6D) (53).
Single-cell TCRseq/RNA-seq was performed on >30,000 murine TIL-Treg, which identified five clusters (Fig. 3, A and B, and table S8). As expected, TR-Treg accumulated in GP-expressing tumors and tumor-draining lymph nodes (TDLNs) to a significantly greater extent than in MC38WT tumors (P = 0.0159 and P = 0.0317, respectively), which indicates antigen recognition driving subsequent cell activation and proliferation (Fig. 3C).
Fig. 3. Defining the scRNA-transcriptome associated with Treg tumor antigen reactivity using a transgenic TCR mouse model.
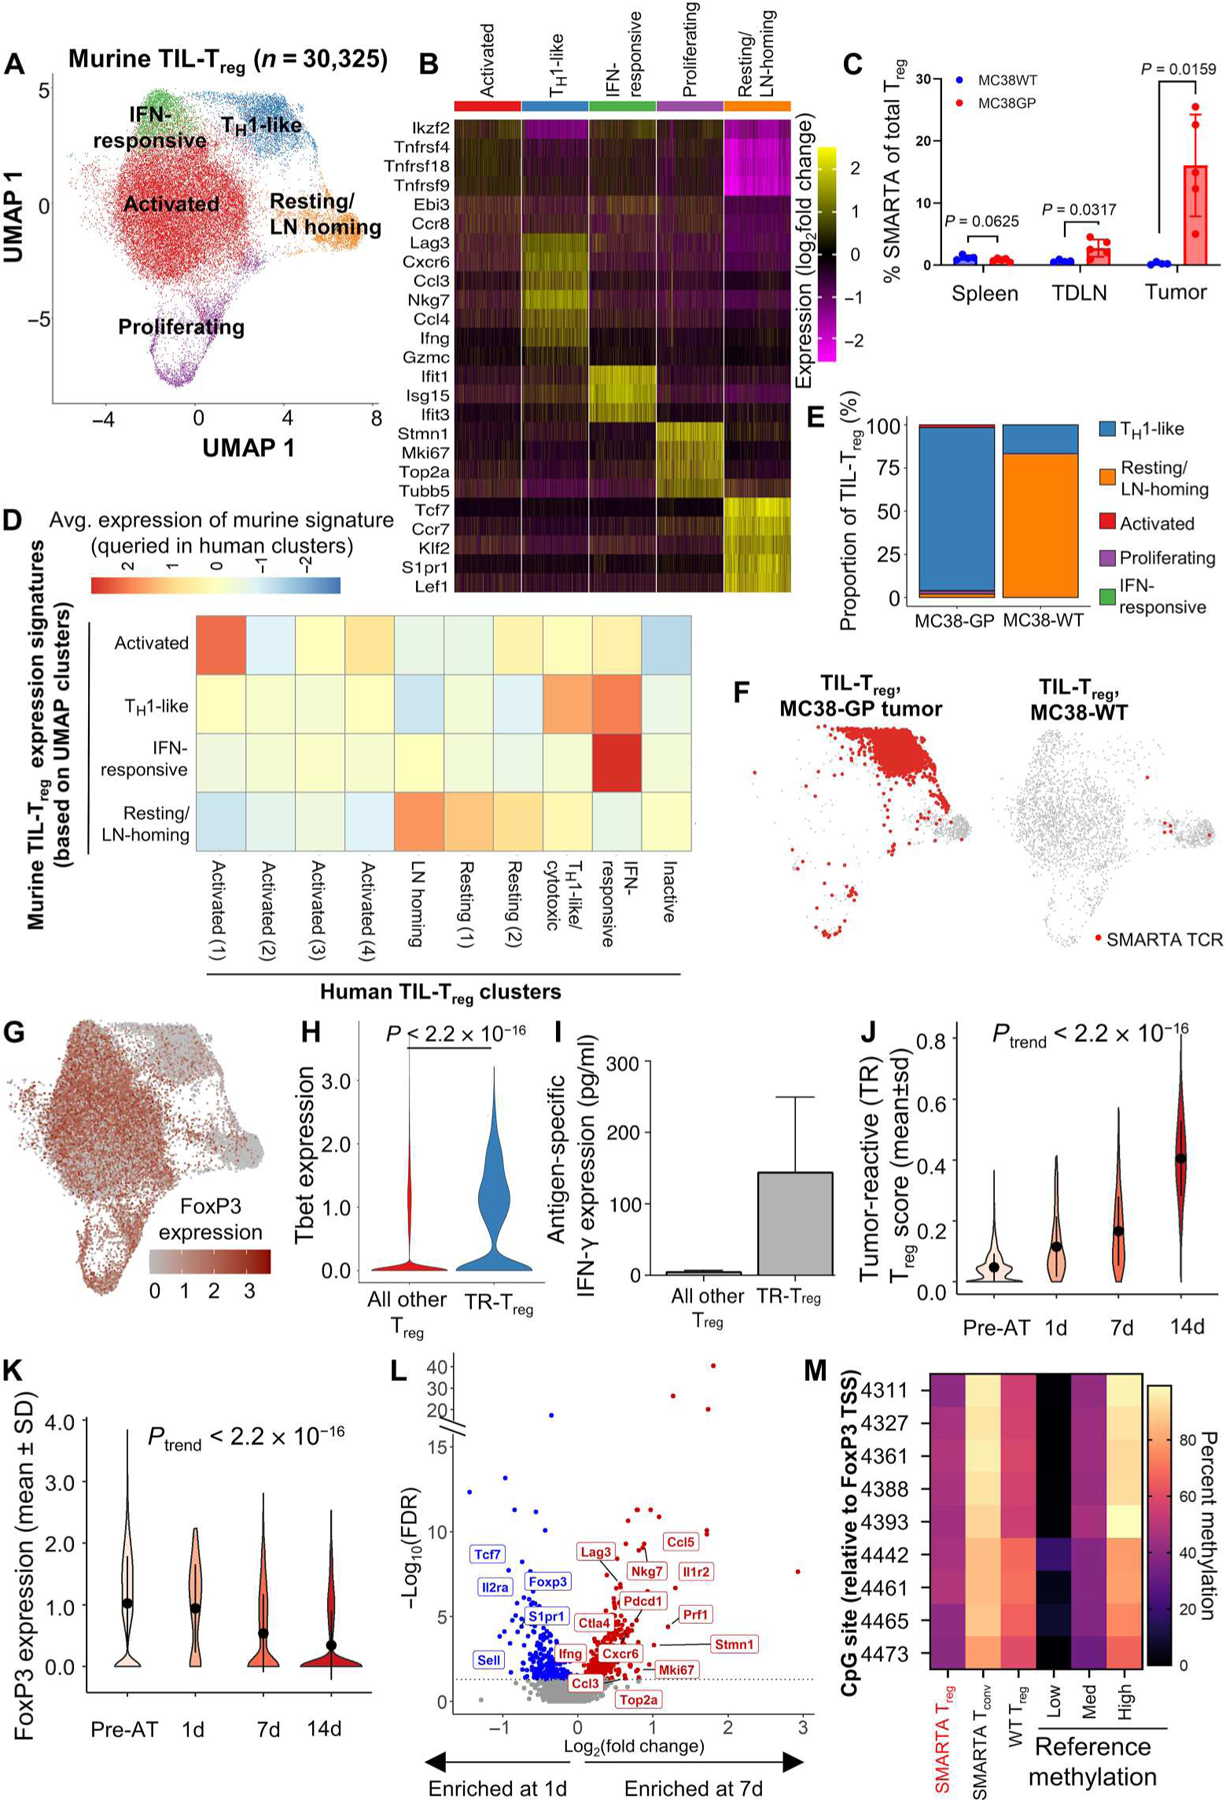
Coupled scRNA-seq/TCR-seq was performed on Treg isolated from GP-expressing MC38 (MC38-GP, n = 5 mice per experiment) or parental MC38 (MC38WT, n = 10 mice per experiment) tumors, tumor-draining inguinal lymph node, and spleens on day 14 of tumor growth. (A) 2D UMAP projection of the expression profiles of the 30,325 Treg that passed QC. Treg subsets, defined by five unique clusters, are annotated and marked by color code. (B) Relative expression of three to five differential genes for each cluster is visualized on a heatmap. (C) Comparison of the frequency of SMARTA FoxP3+ Treg of total Treg defined by expression of CD45.1, FoxP3, and the SMARTA TCR between MC38WT (blue) and MC38-GP (red) tumor-bearing mice in each tissue compartment. Means with SEM error bars are shown for each mouse (n = 5). P values were obtained using Mann-Whitney test. (D) Homology to human Treg clusters is shown by the average expression of genes scores built on the top 20 differentially expressed genes for each murine cluster queried in human clusters. (E) Quantification of cluster designation for all SMARTA clones from WT and GP-expressing MC38. (F) Cluster localization for SMARTA clones is shown with SMARTA TCR (red) overlaid on full 2D UMAP (gray) of Treg isolated from MC38-GP (left) or MC38WT (right). (G) Averaged log2-transformed and library size–normalized FoxP3 expression values are shown. Visualized in red scale using full UMAP projection. (H) TBX21 (Tbet) expression is shown for TR-Treg (blue) and all other Treg (red) from the GP-expressing MC38 tumor after 14 days in vivo. (I) Five thousand TR-Treg and non–TR-Treg were sorted and cocultured ex vivo with 1000 dendritic cells loaded with the LCMV GP peptide for 48 hours. Supernatants were harvested and assayed for IFN-γ using the Meso Scale Discovery platform. Data are shown as IFN-γ production above background, defined as Treg cocultured with dendritic cells without peptide. Mann-Whitney test was used to compare average IFN-γ production between peptide-loaded and peptide-unloaded conditions (P = 0.33; n = 2). (J) Violin plot showing the TR-Treg score of adoptively transferred SMARTA TCRpos Treg before adoptive transfer (pre-AT) and at 1, 7, and 14 days of tumor residence. (K) Violin plot showing FoxP3 expression by adoptively transferred SMARTA TCR+ Treg before adoptive transfer (pre-AT) and at 1, 7, and 14 days of tumor residence. P values obtained by Student’s t test. The P value of the trend (Ptrend) was calculated for the TR-Treg score and normalized Foxp3 expression over time by testing the linear regression slope with null and alternative hypotheses: H0: β1 = 0 (the slope is equal to zero), HA: β1 ≠ 0 (the slope is not equal to zero). N = 5 to 10 mice per time point. (L) Volcano plots showing differentially expressed genes of SMARTA TCR+ Treg in day 7 versus day 1. X axis shows log2(fold change), and y axis shows −log10(FDR). Differentially expressed genes higher at day 7 are shown in red, and differentially expressed genes higher in 1 day are shown in blue. (M) TSDR methylation profile of sorted SMARTA TCR+CD25hiRFP+ Treg from female SMARTA;RIP-GP mice compared with control values (low, medium, and high). Residue numbers denote individual CpG motifs in reference to the transcription initiation site of FoxP3. Data are an average of n = 2 experimental replicates with cells from n = 3 mice pooled per experiment. Bar colors represent 0 to 100% methylation.
To compare our murine and human TIL-Treg clusters, we used the top 20 genes from each of the murine Treg clusters to develop gene scores. We then queried our human clusters to see which human clusters corresponded most to the murine clusters identified. The murine Treg clusters were highly related to counterpart human TIL-Treg clusters (Fig. 3D). Specifically, there was notable homology in the top cluster-defining genes for the resting and LN-homing clusters (CCR7, TCF7, KLF2, and S1PR1), the IFN-induced cluster (IFIT3, ISG15, and IRF7), and the TH1-like cluster (CCL5, CCL4, and IFNG) (Fig. 3, B and D, and table S9). Murine TIL-Treg also contained an activated cluster in which the top differentially expressed genes (TNFRSF4, TNFRSF18, TNFRSF9, IZKF2, EBI3, and CCR8) represent a compilation of several of the human activated clusters and was most analogous to Activated (1)/OX40hi GITRhi with expression of many suppressive Treg genes (Fig. 3D) (23, 54). A notable difference was the proliferating cluster; although there were human TIL-Treg with proliferation signatures, these were relatively few and did not segregate out into a separate cluster as they did in the mouse. This is likely because the relative kinetics of human versus murine tumor growth allows for a greater equilibrium to develop over the years of tumor development in humans. We next queried the murine single-cell data for coexpression of the SMARTA TCR alpha and beta chain to identify the transcriptional profile of TR-Treg. In MC38-GP tumors, the TR-Treg did not localize to the Activated (1)/OX40hiGITRhi Treg cluster but rather acquired a transcriptional program characterized by up-regulation of TH1-associated cytokine and proinflammatory chemokine genes such as IFNG, CCL3 (MIP1α), and CCL4 (MIP1β) (Fig. 3B and table S10). In contrast, the rare TR-Treg cells harvested from the MC38WT tumors all resided in the resting/LN-homing cluster (Fig. 3, E and F), consistent with a lack of antigen stimulation. Because many of the genes associated with the TR-Treg after 14 days’ residence in the tumor are not typically seen in conventional suppressive Treg, we assessed the level of FoxP3 expression in each mouse Treg cluster. The TR-Treg cluster, although still RFP+ (indicating that the Foxp3 locus had been transcriptionally active), had relatively low FoxP3 mRNA expression compared with the other clusters (Fig. 3G). This is consistent with the long half-life of RFP that allows it to be detected after transcription of the linked gene is turned off (55). Antigen-dependent loss of FoxP3 expression in a minority of Treg has been observed in models of autoimmunity and is associated with loss of Treg-suppressive capacity and acquisition of Tconv activity (9). To determine whether the decreased FoxP3 mRNA was mirrored at the protein level, we sorted RFP+ Treg directly from SMARTA (TR-Treg) donor mice and compared intracellular FOXP3 protein expression with TR-Treg isolated from recipient mice after the TR-Treg had been in the MC38-GP expressing tumor for 14 days. Before adoptive transfer, an average of 94.2% (range, 92.4 to 95.3%) of the sorted population was FOXP3+, whereas only 22.8% were FOXP3+ after 14 days (fig. S6, C and E). Furthermore, the TR-Treg cluster was highly enriched for TBX21 (Tbet) expression (Fig. 3H), which is a critical transcriptional regulator of the proinflammatory function of TH1 cells and TH1-like ex-Treg observed in autoimmune settings (56–60). Although TH1 cells are known to be proinflammatory, they only kill cells indirectly through activation of nearby phagocytic cells (61). In contrast, Treg have been reported to directly kill cells through release of cytotoxic granules containing granzymes and perforin (62). Because our murine TR-Treg up-regulate some cytotoxic granule molecules and NKG7 (63, 64), we asked whether they could kill MC38-GP tumor cells induced to express MHC2 through TCR:MHC binding. We harvested TIL TR-Treg and endogenous Treg on day 14 of tumor growth and plated them at varying ratios with IFN-γ–induced, MHC2+ MC38-GP tumor cells (fig. S7A). TR-Treg did not exhibit any specific killing against MHC2+ GP-expressing tumor cells (fig. S7B), but they did functionally produce IFN-γ in an antigen-specific fashion when cocultured with LCMV GP61–80 peptide–loaded dendritic cells ex vivo, although this was not significantly higher than background IFN-γ production (P = 0.33, Mann-Whitney test), likely due to the limited numbers of TIL-Treg available for biological replicates (Fig. 3I). This observation suggests that TH1-like Treg could potentially assist antitumor immunity via a helper rather than cytotoxic mechanism. In addition, the up-regulation in the TR-Treg cluster of TBX21, whose cognate protein, Tbet, has a known role in mediating the proinflammatory function of TH1-like Treg (Fig. 3H) (56–60), supports this notion. Together, the data demonstrate that tumor antigen-reactive Treg acquire a distinct phenotype consistent with an “ex-Treg” TH1-like gene signature, accompanied by loss of FoxP3 and CD25 expression and upregulation of CCL5 and IFNG. We observed a similar trend of Treg TH1-like differentiation when adoptively transferring SMARTA TCR+ Treg into RIP mice, in which the majority of TR-Treg localized to the TH1-like cluster (fig. S7, C to E, and tables S10 and S11), thus suggesting that the additional expression of LCMV-GP in the pancreas and kidneys did not affect the TH1-like differentiation of these Treg. Moreover, the majority of TR-Treg acquired the TH1-like gene program even in the absence of CD8+ T cells, which was achieved through antibody-mediated CD8+ T cell depletion of recipient mice before adoptive transfer (fig. S8, A to C, and table S12).
To evaluate the kinetics of acquisition of this TH1-like phenotype, we performed single-cell TCRseq/RNA-seq on TR-Treg harvested 1, 7, and 14 days after adoptive transfer. Although FoxP3 levels of the SMARTA TCRpos Treg were similar to those of pre-adoptive transfer donor Treg after 1 day of tumor residence, these Treg in MC38-GP tumors significantly lost FoxP3 expression and gained the “TR-Treg” profile by day 7 (tables S8 and S13). When using the top 20 differential genes in the murine TR-Treg cluster from the original murine dataset to generate a TR-Treg score (tables S9 and 10), we observed a progressive increase in the TR-Treg score (P < 2.2 × 10⁻¹⁶; Fig. 3J) together with a progressive decrease in FoxP3 expression (P < 2.2 × 10⁻¹⁶) over time (Fig. 3K). In addition, by 7 days after AT, TR-Treg significantly up-regulate the TH1-like genes CCL5 and IFNG and proliferating genes STMN1, MKI67, and TOP2A (Fig. 3L). The enhancement of proliferating genes concords with the progressive expansion in numbers of SMARTA+ Treg over time in the MC38-GP tumors. In contrast, on day 1 of residence in the tumors, TR-Treg express multiple resting/LN-homing genes, such as TCF7 and SELL, and the conventional Treg genes FoxP3 and IL2RA (Fig. 3L and table S13). This type of Treg differentiation has been reported in the context of autoimmune disease (9, 65, 66) but has not previously been demonstrated in the context of cancer.
In these analyses, it is possible that the SMARTA+ FOXP3lo TH1-like population was derived from the small percentage of FOXP3neg Tconv cells present after SMARTA Treg sorting (fig. S6E), which could have proliferated, turned on low levels of FoxP3, and taken over the SMARTA TIL population in vivo. To rigorously address this concern, we adoptively transferred a large number (5 × 10⁵) of pure GP-reactive Tconv cells (CD4+SMARTA TCR+CD25lo RFPneg) from CD45.1+ donor mice into CD45.2+ recipient mice bearing MC38-GP or MC38WT tumors. This represented roughly 50× more tumor-reactive Tconv CD4+ T cells than would be contaminating the sorted TR-Treg used in Fig. 3. These were cells taken from the same SMARTA;RIP-GP;CD45.1;RFP-FoxP3 mice used for the Treg adoptive transfers. In comparison with 22.8% of TR-Treg expressing FOXP3 (fig. S6E), virtually none of tumor-reactive CD4+ Tconv TIL expressed FOXP3 after 14 days in vivo (fig. S9, A to C), although endogenous recipient-derived (CD45.2+ SMARTA TCRneg) FOXP3+ Treg could be readily detected in the tumor (fig. S9D). This lack of FOXP3 expression by CD4+ Tconv cells was also recapitulated in the spleen and TDLNs (fig. S9D). To further address the possibility that high-dose transgenic TCR T cell adoptive transfer could result in expansion of non-Treg, Tconv cells leading to an artificial Treg ➔ TH1-like transition (67), we looked at the frequency of tumor-reactive SMARTA TCR+CD4+ T cells in the adoptively transferred population and in the tumor 1 day after adoptive transfer. Although 92.5% of adoptively transferred Treg expressed the SMARTA (tumor-reactive) TCR, only 2.2% of the CD4+ TIL-Treg were from the adoptively transferred SMARTA TCR+ cells 1 day after adoptive transfer, with the remaining 97.8% being endogenous Treg from the recipient mouse (fig. S9E). This frequency of SMARTA TCR+ Treg in the tumor after 1 day is consistent with prior studies of adoptively transferred CD4+ T cells (53).
To further support that the cells we adoptively transferred were TR-Treg rather than Tconv cells, we performed epigenetic analysis of the Treg-specific demethylated region (TSDR) in the RFP-FoxP3+ TR-Treg and RFP-FoxP3neg TR-Tconv cells directly from the SMARTA RIP-GP;RFP-FoxP3 mice as well as control wild-type Treg (CD4+CD25hi). The rationale behind this analysis is that Tconv cells will exhibit high methylation of the TSDR. Conversely, thymically derived Treg have low levels of TSDR methylation that are in accordance with the sex of the donor from which the cells were derived, because FoxP3 TSDR methylation occurs on the inactive X chromosome (68, 69). Therefore, although FoxP3 TSDR methylation in male Treg is typically <20%, this value in female Treg ranges from 30 to 50% methylation. Conversely, Tconv cells have TSDR methylation >90% (70). To therefore confirm that the TR-Treg obtained from our female mice were Treg rather than Tconv cells, we analyzed the methylation status of TR-Treg and TR-Tconv cells obtained from the same SMARTA mouse. The TR-Treg isolated from female SMARTA mice have TSDR% methylation ranging from 39.6 to 48.9%, consistent with known FoxP3 TSDR values in Treg from female mice due to X inactivation (71). The TR-Tconv cells, however, had methylation ranging from 79.3 to 95.9%, consistent with known FoxP3 TSDR values in Tconv cells. The female donor Treg, which we used as a control, had methylation ranging from 55.1 to 69.1% (Fig. 3M and table S14). Together, we show that TR-Treg with a TH1-like signature have methylation patterns consistent with a typical female Treg profile (72). We conclude that TCR stimulation of mature self-antigen-specific Treg by TAA programs these cells to differentiate into a proinflammatory TH1-like immune cell phenotype.
Murine TR-Treg gene signature defines an orthologous human lung cancer subset enriched in anti–PD-1 R
The robust conversion of TIL-Treg from resting to a TH1-like program in MC38, which is an ICB-responsive tumor, raised the question of whether a human counterpart was associated with ICB responsiveness in our neoadjuvant cohort. To refine our search for the human ortholog to this TR-Treg cluster identified in our murine tumor model, we used the gene score based on the top 20 differential genes defining the murine TR-Treg cluster (tables S9 and 10). We identified the human TH1-like/cytotoxic Treg cluster (Fig. 1A) as the predominant population enriched for these genes (Fig. 4A and fig. S10A). To define a human transcriptional TR-Treg ortholog at higher resolution, we performed refined subclustering on the human TH1-like/cytotoxic Treg cluster and identified six distinct subclusters. One of these, SC0, was dominantly enriched in the TR-Treg gene score (Fig. 4, B and C, and fig. S10, A and B) and expressed high levels of IFNG, CCL4, and CCL5 (Fig. 4, B and C), which are three of the up-regulated genes associated with tumor reactivity in murine Treg. SC0 also expressed multiple cytotoxic genes. It was not possible to assess antigen-specific killing activity of this population in human TIL-Treg because their cognate antigens are not defined (as in the murine system) and they express no membrane molecules that would distinguish them selectively from other Treg subsets. Although FOXP3 was expressed in all subclusters of the TH1-like/cytotoxic Treg (Fig. 4C), FOXP3 (P = 6.8 × 10⁻⁹) and IL2RA (CD25; P = 1.9 × 10⁻⁹) expression were significantly decreased in SC0 relative to all other Treg, whereas TBX21 (Tbet) was significantly increased (P < 0.001) (Fig. 4D and fig. S10B; paired t test). Thus, SC0 has many TH1 hallmarks of the TR-Treg observed in the murine TIL-Treg. In contrast to the Activated (1)/ OX40hiGITRhi subset, which was enriched in NR tumors, the TR-Treg-scorehi region, SC0, was enriched in R tumors (Fig. 4, E and F, P = 0.066; Wilcoxon rank sum test). This enrichment in ICB R only occurs in the tumor and not in adjacent NL.
Fig. 4. Murine TR-Treg gene signature defines an orthologous subset among human NSCLC TIL-Treg that is enriched in anti–PD-1 R.

(A) Red scale overlay of the TR-Treg gene score, with red indicating higher expression and blue indicating low expression. Red dotted line represents the UMAP region with highest expression. Refined clustering was performed on the TH1-like/cytotoxic subset, and 2D UMAP projection of six unique subclusters (SC0-SC5) is visualized by UMAP and marked by color code. (B) Relative expression of the top 10 most differential genes for each subcluster is visualized on a heatmap. (C) The expression of biologically relevant genes from the TR-Treg score is visualized in red scale. (D) Boxplots showing differences in expression of FoxP3 (P = 6.8 × 10⁻⁹), IL2RA (CD25; P = 1.9 × 10⁻¹), and TBX21 (Tbet, P = 0.00024) by TIL-Treg in SC0 versus all other Treg. Each dot represents an individual tumor sample per patient (n = 14). Comparisons were performed at the individual patient level using paired t test. Patient-averaged log2-transformed and library size–normalized expression values are shown. (E) Cell density plots of the TH1-like/cytotoxic Treg subclusters stratified by response/treatment status. The TR-Treg scorehi population is indicated with a dotted line. Increased density is represented by red scale, and decreased density is represented by green/blue. (F) Boxplots showing the frequency of SC0 in the tumors (left) and adjacent NLs (right) of NR (red) and responders (blue). Comparisons were performed at the individual patient level using Wilcoxon rank test. (G) Diffusion map with RNA velocity between SC0, Activated (1)/OX40hiGITRhi, and LN-homing clusters for NR (left) and R (right). (H) Cross-cluster sharing of Treg TCR clonotypes detected in the SC0 subcluster with non-SC0 Treg and Tconv clusters (as shown in fig. S1C). Red indicates a higher frequency of the clone in the relevant subcluster. Tcm, central memory T cells; Tem, effector memory T cells.
To better understand the relationship between SC0 and all adjacent clusters in the global Treg UMAP [TH1-like/cytotoxic, Resting, LN homing, Activated (1)/ OX40hiGITRhi, and Activated (3)], we performed diffusion trajectory and RNA velocity. The Activated (3), Resting, and LN-homing clusters aligned along a common trajectory, with the Activated (1)/ OX40hiGITRhi and TH1-like/cytotoxic clusters diverging along two additional trajectories (Fig. 4G and fig. S10C). Because of these commonalities in diffusion trajectory and because of the relatively high clonal sharing between the TH1-like/cytotoxic and Activated (1)/OX40hiGITRhi clusters as compared with the other UMAP-adjacent clusters (fig. S10D), we further refined this analysis to strictly assess the directionality between the LN-homing, Activated (1)/OX40hiGITRhi, and the TR-Treg scorehi cluster (SC0). In RNA velocity analysis, SC0 cells in R and NR showed markedly different directionality of transcriptional gradients (Fig. 4G). In R SC0 Treg, most velocity vectors moved away from the Activated (1)/OX40hiGITRhi and LN-homing clusters, suggesting a net differentiation into the SC0 cluster (Fig. 4G). This pattern was not observed in NR, where the small number of SC0 cluster cells appeared to be differentiating toward the Activated (1)/OX40hiGITRhi cluster. Last, to further support the relationship of the TH1-like Treg in the SC0 cluster to other Treg rather than CD4+ Tconv cells, we analyzed the transcriptional heterogeneity of individual TCR clones that were found in the SC0 subcluster. If the TH1-like Treg were derived from activated Tconv CD4+ TIL rather than Treg, then one would expect a high level of TCR clonal sharing between the TH1-like Treg and Tconv CD4+ TIL. Of the 441 clones that comprised SC0, 179 (40.6%) were not detected in any other CD4+ TIL subset, whereas 262 (59.4%) were found in at least one other CD4+ T cell cluster (Fig. 4H and fig. S10, E and F). Of these “shared” clones, 173 (66.0%) were solely detected in other, non-SC0 Treg subsets, whereas only 43 shared clones (16.4%) were shared solely with Tconv subsets, and 46 clones (17.6%) were shared with both Treg and Tconv subsets. The dominant sharing by SC0 clones with non-SC0 Treg was observed across all patients, and the 16.4% of shared clones that were found in Tconv subsets were heterogeneous in nature, with no obvious predominance for a specific Tconv subset. These analyses provide support for the relative enrichment and maintenance of the TH1-like cluster in R tumors and the origination of these cells from Treg rather than Tconv CD4+ TIL.
DISCUSSION
In the present study, we resolved multiple transcriptionally distinct TIL-Treg subsets—10 in human and five in mouse—with remarkable cross-species transcriptomic matching. One of the activated subsets, characterized by selective expression of TNFRSF4 (OX40), TNFRSF18 (GITR), and high LAG3 and multiple immune suppression-associated genes such as ENTPD1 (CD39) and EBI3 (IL27B), was functionally far more suppressive in vitro than all other TIL-Treg and correlated with ICB resistance. In an ICB-responsive murine tumor model, Treg specific for a TAA down-modulated FoxP3 and progressively developed into a population resembling TH1 cells, which was dependent on expression of cognate antigen. We found a clear transcriptional ortholog to these TAA-specific Treg in human NSCLC TIL-Treg that is more highly represented among pathologic R to anti–PD-1.
Although OX40 and GITR expression by TIL-Treg has been reported for a number of human cancers (73, 74), our findings define a single specific subset that expresses these TNFRSF members along with the highest levels of multiple suppressive genes among the overall population. Guo and colleagues focused on a subset of 4–1BBhi Treg, showing that its proportion correlated with worse outcomes in patients with lung cancer treated with anti–PD-1 (29); although this subset did express TNFRSF4, TNFRSF18, and other suppressive Treg markers, LAG3 was notably absent, potentially missed with the relatively small number of Treg profiled in that study. OX40, GITR, and LAG3 have all been independently shown to mark activated Treg, and in general, activated Treg tend to be more suppressive (30, 75); however, we had the unique opportunity here to functionally study a distinct subset coexpressing all three of these molecules. The particularly high LAG3 expression, which promotes Treg suppression in murine models (76–78), on the Activated (1)/OX40hiGITRhi subset raises the possibility that the success of LAG3 blockade in human cancer immunotherapy may be related to inhibition of suppressive function by this OX40hi GITRhi Treg population. Furthermore, it is notable that a major source of TNFSF4 in the TME is the neoantigen-specific CD8+ population, with much higher expression in TILs from anti–PD-1–resistant tumors. It is probable that the TME variability between R and NR contributes to the maintenance of these Treg in NR tumors. This has been shown in studies of hepatocellular carcinoma in which TNFRSF4 expression correlated with poor prognosis overall, including association with tumor growth characteristics and the functions of macrophages, plasmacytoid dendritic cells, and Treg (79, 80).
The remarkable similarity among TIL-Treg subsets between a commonly used murine cancer and human NSCLC was validated by comparative gene set enrichment analysis. The most unexpected finding from our murine model is that when cognate antigen is expressed in the tumor, TR-Treg accumulate, down-modulate FoxP3, and progressively develop from a resting state into a population expressing TBX21, TH1-like cytokines and chemokines, and multiple cytotoxic molecules. We rigorously ruled out the possibility that the TAA-specific TH1-like Treg population comes from expansion and intratumoral accumulation from the few (<5%) TAA-specific Tconv CD4 cells contaminating the Treg at the time of adoptive transfer that might transiently up-regulate FoxP3. The development of this population in an inflamed tumor (representative of half of human NSCLC) is reminiscent of ex-Treg that develop in autoimmune settings and can exacerbate auto-inflammatory responses. Although these cells have an established functional role in the exacerbation of autoimmune responses, their contribution to antitumor immunity has not previously been studied. Apropos of this notion, the instability of FoxP3 expression by Treg is well established (81), but its association with ex-Treg phenotype and function has not been previously reported. In the present study, we find that virtually all the TAA-specific Treg make this conversion in the MC38 tumors over a 2-week period, in contrast to the minority of Treg reported to convert to ex-Treg in autoimmunity settings (48, 49, 51–53). TH1-like Tbet+ Treg have been shown to develop in inflamed tissues (79). The expression of Tbet and IFN-γ by Treg is required for the development of autoimmune colitis in murine models (59) and human multiple sclerosis (60), and this subset is enriched in patients with type 1 diabetes (56). These prior findings are consistent with the higher incidence of immune-related adverse events in immunotherapy-sensitive tumors (82). Together with the previous literature, our findings lead us to hypothesize that TR-Treg may contribute positively to antitumor immunity while also facilitating development of therapy-induced autoimmunity.
By generating a gene profile for these tumor-specific Treg in the mouse, we identified a human TIL-Treg ortholog, which, in contrast to the OX40hiGITRhi subset, is more highly represented among anti–PD-1–sensitive tumors. We acknowledge that mouse models cannot recapitulate human biology; however, the presence of distinct Treg subsets with putatively opposing function regarding antitumor immunity begs the key question of which signals in the TME drive incoming Treg to one or the other population. Elucidation of these signals will likely define important targets for immunotherapy intervention. Another key endeavor is definition of the antigen specificity of the human Treg subsets. In contrast to a recent study of melanoma TIL-Treg (83), our analysis of the more highly represented clones in the TH1-like TIL-Treg subset via TCR gene transfer and screening of predicted MHC2-binding neoantigenic peptides failed to reveal any such recognition (fig. S10G and tables S15 and S16). Fundamentally, one might expect that tumor recognition by Treg would preferentially target self-antigens rather than mutation-associated neoantigens, because the natural Treg repertoire is positively selected on self-antigens in the thymus (44, 45). Because TAA-specific Treg in the murine model differentiate exclusively into a TH1-like program rather than the activated OX40hiGITRhi program, we postulate that this suppressive subset may enter the tumor having already developed a suppressive program because of recognition of self-antigen not expressed by the tumor. The markedly different clonality between melanoma and lung cancer concurs with the apparent differences in frequency of neoantigen-specific Treg observed by Oliveira et al. (83) in melanoma as opposed to our findings in lung cancer. We postulate that the distinct repertoires of Treg antigen recognition in melanoma versus lung cancer reflect the different microenvironmental cues between the two tumor types, as witnessed by their different responses to immunotherapy.
Our in vitro overexpression system used to study TNFR super-family ligation on Treg has limitations because of the potential for supraphysiologic signaling; thus, follow-up studies will be necessary to confirm the impact of in vivo OX40 and GITR ligation on immunosuppressive Treg. In addition, it is thus far unknown how OX40hi− GITRhi Treg are induced or recruited mainly in NR patients. Given that this population is more frequent in NR and untreated tumors relative to R tumors, it is possible that this is a tumor-intrinsic characteristic unrelated to ICB treatment; however, our study is limited by the lack of paired pre- and post-ICB tumor specimens from the same patients that would enable us to make this distinction. Although others have reported on the association of generally high expression of TNFRSF4 and TNFRSF18 among Treg with immunosuppression and poor prognosis (7, 29, 30, 40, 41, 79, 80, 84–86), the coexpression of LAG3 and the association of this specific subset with ICB resistance have not previously been identified. Our conclusions are that these “Activated Treg” genes and the presence of this immunosuppressive Treg subset may be used as a prognostic marker; however, additional investigation is warranted to evaluate the specific mechanistic role they may play in the lack of response to anti–PD-1. Regarding the TH1-like Treg, although they exhibited higher expression of TBX21 than all other Treg subsets, the data shown here do not distinguish whether TBX21 expression drives the Treg transition to a more proinflammatory phenotype or is up-regulated as a consequence of other signals that drive this transition in the TME. Follow-up work should focus on understanding the role of Tbet and other transcriptional regulators in differential Treg development. Last, we are limited by the number of human TIL-Treg available to perform additional functional studies; thus, future work should aim to fully understand the function of these subsets as it relates to anti–PD-1 response. Nonetheless, a major strength of our study is the number of TIL-Treg profiled at the single-cell level, which enabled us to study refined Treg subsets at unprecedented resolution.
The primary goal of this study was to better understand the associations of Treg functional programming, especially those that are actively recognizing tumor antigens, with response to ICB in lung cancer. Our findings regarding the strong proliferative and Treg activation programs among the NSCLC TIL-Treg induced by OX40L, and previous evidence that OX40 signaling stabilizes Treg (34), support the notion that tumor-specific CD8+ T cells have the potential to directly enhance Treg suppression as a form of feedback inhibition. If so, the agonistic OX40 antibodies under clinical investigation may be counterproductive; rather, OX40 pathway blockade might be considered as an immunotherapy strategy. Moreover, as combination ICB becomes more standard, it is likely that different therapeutic regimens will differentially affect TIL-Treg function, and we postulate that targeted Treg modulation, i.e., specific inhibition of highly suppressive subsets or promotion of TH1-like Treg development, could significantly improve ICB response while decreasing toxicities related to Treg-mediated immune-related adverse events.
MATERIALS AND METHODS
Study design
The overall goal of this study was to better understand the associations of Treg functional programming, especially those that are actively recognizing tumor antigens, with response to ICB in lung cancer. The sample size for human lung cancer TIL studies was limited by the number of patients enrolled in the trial from whom viable TILs were obtained. Tumors from murine experiments were randomized by tumor size on day 7 and were combined for transcriptomic analysis. The number of mice used/tumors harvested per experimental condition was predicated on requiring >30,000 TIL-Treg from all pooled samples per experimental condition. Preliminary studies determined that to achieve this number of TIL-Treg, 5 to 10 mice per experimental group were required. The investigators were not blinded to allocation during experiments and outcome assessment.
Patients and biospecimens
This study was approved by the Institutional Review Boards (IRBs) at Johns Hopkins University and Memorial Sloan Kettering Cancer Center (IRB Number NA_00092076) and was conducted in accordance with the Declaration of Helsinki and the International Conference on Harmonization Good Clinical Practice guidelines. The patients described in this study provided written informed consent. All biospecimens were obtained from patients with stage I to IIIA NSCLC who were enrolled in a phase 2 clinical trial (NCT02259621) evaluating the safety and feasibility of administering two doses of anti–PD-1 (nivolumab) before surgical resection. Pathological response of primary tumors were done as previously reported (17, 87). Tumors with no more than 10% residual tumor cells were considered to have an MPR.
Mice
SMARTA-1 mice [B6.Cg-Ptprca Pepcb Tg(TcrLCMV)1Aox/PpmJ] have a CD4+ T cell repertoire that recognizes the H2-IAb–restricted LCMV GP61–80 epitope as previously described (46). To generate mice with a sufficient number of Treg, SMARTA-1 mice were crossed to RIP-GP mice that have the LCMV GP protein expressed under the RIP, allowing for expression of these epitopes in the β cells of the pancreas and in the thymus for positive selection. This cross allows for thymic generation of SMARTA-1 Treg as described (49, 51). SMARTA-1;RIP-GP mice were then crossed to RFP-FoxP3 reporter mice (C57BL/6-Foxp3tm1Flv/J). These mice were used for adoptive transfer into C57BL/6J wild-type mice. All mice used in this study, donors and recipients, were females 6 to 8 weeks of age. SMARTA-1, RFP-FoxP3, and C57BL/6J were obtained from Jackson Laboratories (Bar Harbor, ME). RIP-GP mice were obtained from the laboratory of M. von Herrath (La Jolla Institute, CA). All mice were housed and bred under specific pathogen–free conditions at Johns Hopkins University Animal Care and Use Facility in Cancer Research Building I under protocol number M022M67. The Institutional Animal Care and Use Facility at Johns Hopkins University approved all animal experiments. All mouse models are available by request.
Tumor cell lines
Parental MC38 (MC38WT; American Type Culture Collection) and MC38-GP (Bosselut lab, National Institutes of Health) tumor lines were grown in Dulbecco’s modified Eagle’s medium (DMEM) 10% fetal bovine serum (FBS), 10 mM Hepes (Gibco), L-glutamine (Gibco), penicillin (100 U/ml), and streptomycin (100 μg/ml; Quality Biologic). Cells were passaged once using 0.05% trypsin before flank injection. Cells (6 × 10⁵) were injected in 100 μl of phosphate-buffered saline (PBS) into each mouse flank using Intradermal TB needles (BD, 309623).
Tumor cell line growth and response to anti–PD-1
MC38WT and MC38-GP tumor lines were injected into C57BL/6J mice as above. Mice were randomized into anti–PD-1–treated and anti–PD-1–untreated (isotype control) groups on day 8 of tumor growth. The anti–PD-1 treatment course began 2 days after tumor volume reached an average of ~100 mm3 (MC38WT: days 10, 12, 14, and 16; MC38-GP: days 14, 16, 18, and 20). One hundred micrograms of in vivo monoclonal antibody (mAb) anti-mouse PD-1 (BioXCell; BE0146) or in vivo mAb rat IgG2a isotype control (BioXCell; BE0089) was injected intraperitoneally into each mouse every other day for a total of four doses. Tumor growth was measured every other day for the duration of the experiment. Pre-treatment time point is day −2 of first anti–PD-1 dose, and post-treatment time point is day +4 of the last anti–PD-1 dose.
Coupled single-cell TCRseq/RNA-seq
Cryobanked T cells were thawed and washed twice with pre-warmed RPMI with 20% FBS and gentamicin. Cells were resuspended in PBS and stained with a viability marker (LIVE/DEAD Fixable Near-IR; Thermo Fisher Scientific) for 15 min at room temperature in the dark. Cells were then incubated with Fc block for 15 min on ice and stained with antibody against CD3 (BV421, clone SK7) for 30 min on ice. After staining, highly viable CD3+ T cells were sorted into 0.04% bovine serum albumin in PBS using a BD FACSAria II Cell Sorter. Sorted cells were manually counted using a hemocytometer and prepared at the desired cell concentration (1000 cells/μl) when possible. The Single-Cell 5’ V(D)J and 5’ digital gene expression (DGE) kits (10X Genomics) were used to capture immune repertoire information and gene expression from the same cell in an emulsion-based protocol at the single-cell level. Cells and barcoded gel beads were partitioned into nanoliter-scale droplets using the 10X Genomics Chromium platform to partition up to 10,000 cells per sample followed by RNA capture and cell-barcoded cDNA synthesis using the manufacturer’s standard protocols. Libraries were generated and sequenced on an Illumina NovaSeq instrument using 2 × 150-bp paired end sequencing. The 5’ VDJ libraries were sequenced to a depth of ~5000 reads per cell, for a total of 5 million to 25 million reads. The 5’ DGE libraries were sequenced to a target depth of ~50,000 reads per cell. Further detail can be found in Supplementary Materials and Methods.
Jurkat reporter cell line
A gBlock was created with the full TCRα and TCRβ chains separately and human constant regions and was synthesized [Integrated DNA Technologies (IDT)]. To generate a Jurkat reporter cell in which we could transfer our TCRs of interest, the endogenous TCR α and β chains were knocked out of a specific Jurkat line that contains a luciferase reporter driven by a nuclear factor of activated T cells (NFAT)–response element (Promega) using the Alt-R CRISPR system (IDT). Two sequential rounds of CRISPR knockout were performed using crDNA targeting the TCRα constant region (AGAGTCTCTCAGCTGGTACA) and the TCRβ constant region (AGAAGGTGGCCGAGACCCTC). crDNA and tracrRNA (IDT) were resuspended at 100 μM with Nuclear-Free Duplex Buffer. They were duplexed at a 1:1 molar ratio according to the manufacturer’s instructions. The duplexed RNA was cooled to room temperature before mixing with Cas9 nuclease at a 1.2:1 molar ratio for 15 min. Forty picomoles of Cas9 RNP complexed with gRNA was mixed with 500,000 cells in 20 μl of OptiMEM, loaded into a 0.1-cm cuvette (Bio-Rad), and electroporated at 90 V and 15 ms using an ECM 2001 (BTX, Holliston, MA). Cells were transferred to complete growth medium and expanded for 7 days. Limiting dilution was used to acquire single-cell clones, and genomic DNA was harvested using the Quick-DNA 96 Kit (Zymo Research, Irvine, CA). The regions flanking the CRISPIR cut sites were polymerase chain reaction–amplified (TCRα forward primer: GCCTAAGTTGGGGAGACCAC, reverse primer: GAAGCAAGGAAACAGCCTGC; TCRβ forward primer: TCGCTGTGTTTGAGCCATCAGA, reverse primer: ATGAACCACAGGTGCCCAATTC) and Sanger-sequenced. Only TCRα−/β− clones were selected. Complete knockout was confirmed by failure to restore CD3 expression on electroporation with only a TCRα or TCRβ chain and successful CD3 expression on electroporation with both TCR chains.
CD8 was transduced into the TCRα−/β− Jurkat reporter cells using the murine stem cell virus (MSCV) retroviral expression system (Clontech). gBlocks (IDT) encoding CD8α and CD8β chains separated by a T2A self-cleaving peptide were cloned into the pMSCVpuro retroviral vector by HiFi DNA assembly (New England Biolabs). The plasmid was then cotransfected with a pVSV-G envelope vector into the GP2–293 packaging cell line per the manufacturer’s instructions. The viral supernatant was harvested 48 hours after transfection and concentrated 20-fold using Retro-X Concentrator (Clontech). For transduction, nontissue cultured treated 48-well plates were coated with 150 μl of retronectin (Clontech) in PBS at 10 μg/ml overnight at 4°C. Plates were then blocked with 10% FBS for 1 hour at room temperarture followed by washing once with PBS. After removing PBS, viral particles and 2 × 10⁵ of TCRα−/β− Jurkat reporter cells were added to each well in a total volume of 500 μl of cell culture media. Plates were spun at 2000g for 1 hour at 20°C and then incubated at 37°C. Selection with puromycin (1 μg/ml; Thermo Fisher Scientific) began 3 days later. Single-cell clones were established by limiting dilution, and clones were subsequently screened for CD8 expression by flow cytometry. To generate a Jurkat reporter line that expresses both CD4 and CD8, CD4 viral particles were produced and transduced into the CD8-expressing Jurkat reporter cells using similar procedures.
Jurkat TCR transfer
TCRs of interest were introduced into the CD4/CD8 TCRα−/β− Jurkat reporter line by cloning the TCRα and TCRβ chains separately into the pCI vector (Promega) by HiFi DNA assembly (New England Biolabs). The two plasmids were co-electroporated into the TCRα−/β− Jurkat reporter line using 4-mm cuvettes (Bio-Rad) and 275 V for 10 ms for three pulses at a 0.1 interval between pulses. Cells were rested in RPMI 10% FBS at 37° for 24 hours. TCR expression efficiency was assessed by CD3 expression using flow cytometry. After a 24-hour rest, live Jurkat cells were counted and plated at a 1:1 ratio with a patient-matched lymphoblastoid cell line and peptide pools (JPT Peptide Technologies and Sigma-Aldrich). Neoantigen peptides were plated and pooled (three to five peptides per pool) at 50 μg/ml per peptide to assess TCR reactivity to neoantigens. A peptide pool (20 μg/ml) spanning the S protein of SARS-CoV-2 (JPT) was used to stimulate a known SARS-CoV-2–reactive TCR as positive control (88). Cells and peptide were cocultured for 24 hours. TCR activity was assessed by NFAT-luciferase reporter readout using the Bio-Glo Luciferase Assay System (Promega).
Statistics
All statistics were performed in R (version 4.2.1) and GraphPad Prism (version 9.3.0). Wilcoxon signed rank test or t test (Student’s and paired) was used to determine significance when relevant. Benjamini-Hochberg adjustment was done when needed. Specific statistical information for each experiment is found in the relevant figure legends and Supplementary Methods section. Additional methodology can be found in Supplementary Materials and Methods.
Supplementary Material
Acknowledgments:
We thank the Experimental and Computational Genomics Core (ECGC) and the FEST and TCR Immunogenomics Core at the Sidney Kimmel Comprehensive Cancer Center; The Johns Hopkins Upper Aerodigestive Biorepository and the Genetic Resources Core Facility (GCRF); and K. Maly, L. Hartman, R. Carlson, and our respective administrative teams, as well as clinical support from Iiasha Beadles and Chanice Barkley. We would like to thank M. von Herrath at the La Jolla Institude for Allergy and Immunology for providing the RIP-GP mice and R. Bosselut at the National Cancer Institute, NIH for providing the MC38-GP tumor line.
Funding:
This work was supported by the Mark Foundation for Cancer Research; Bloomberg-Kimmel Institute for Cancer Immunotherapy; the Mark Foundation Center for Advanced Genomics and Imaging; Bristol Myers Squibb; Lung Cancer Foundation of America; LUNGevity; American Lung Association; Swim Across America; Commonwealth Foundation; National Institutes of Health grants R37CA251447 (K.N.S.), R01HG010889 (H.J.), R01HG009518 (H.J.), R01EB029455 (J.B.S.), CA121113 (V.A.), R01CA142779 (J.T.), and P30 CA006973; the Department of Defense (W81XWH-21-1-0891 to J.B.S.); the V Foundation; and the Juvenile Diabetes Research Foundation (1-INO-2020-923-A-N to J.B.S.). D.V. is the recipient of an ARCS Foundation Metro-Washington Chapter Scholar award and a National Science Foundation Graduate Research Fellowship Program award.
Footnotes
Supplementary Materials
This PDF file includes:
Other Supplementary Material for this manuscript includes the following:
Data file S1
Competing interests: V.A. receives research funding to Johns Hopkins University from Astra Zeneca and Personal Genome Diagnostics, has received research funding to Johns Hopkins University from Bristol-Myers Squibb and Delfi Diagnostics in the past 5 years, and is an advisory board member for Neogenomics. V.A. is an inventor on patent applications (63/276,525, 17/779,936, 16/312,152, 16/341,862, 17/047,006, and 17/598,690) submitted by Johns Hopkins University related to cancer genomic analyses, ctDNA therapeutic response monitoring, and immunogenomic features of response to immunotherapy that have been licensed to one or more entities. Under the terms of these license agreements, the University and inventors are entitled to fees and royalty distributions. J.M.T. receives research funding from Bristol-Myers Squibb and serves a consulting/advisory role for Bristol-Myers Squibb, Merck, and Astra Zeneca. J.R.B. serves an advisory/consulting role for Amgen, AstraZeneca, Bristol-Myers Squibb, Genentech/Roche, Eli Lilly, GlaxoSmithKline, Merck, Sanofi, and Regeneron; receives research funding from AstraZeneca, Bristol-Myers Squibb, Genentech/Roche, Merck, RAPT Therapeutics Inc., and Revolution Medicines; and is on the Data and Safety Monitoring Board of GlaxoSmithKline, Janssen, and Sanofi. P.M.F. receives research support from AstraZeneca, BioNtech, Bristol-Myers Squibb, Novartis, and Regeneron; has been a consultant for AstraZeneca, Amgen, Bristol-Myers Squibb, Iteos, Novartis, Star, Surface, Genentech, G1, Sanofi, Daiichi, Regeneron, Tavotek, VBL Therapeutics, Sankyo, and Janssen; and serves on a data safety and monitoring board for Polaris. S.Y. receives research funding from Bristol-Myers Squibb/Celgene, Janssen, and Cepheid; has served as a consultant for Cepheid; and owns founders’ equity in Brahm Astra Therapeutics and Digital Harmonic. K.N.S. and D.M.P. have filed for patent protection on the MANAFEST technology (serial no. 16/341,862). D.M.P. is a consultant for Compugen, Shattuck Labs, WindMIL, Tempest, Immunai, Bristol-Myers Squibb, Amgen, Janssen, Astellas, Rockspring Capital, Immunomic, and Dracen; owns founders’ equity in ManaT Bio Inc., WindMIL, Trex, Jounce, Enara, Tizona, Tieza, and RAPT; and receives research funding from Compugen, Bristol-Myers Squibb, and Enara. K.N.S. has received travel support/honoraria from Illumina Inc.; receives research funding from Bristol-Myers Squibb, Anara, and Astra Zeneca; and owns founder’s equity in ManaT Bio Inc. J.T. received research funding from Akoya Biosciences and BMS. J.T. is a consultant/advisory board member for BMS, Merck, Astra Zeneca, Genentech, Akoya Biosciences, Lunaphore, and Compugen. J.T. received equipment, reagents, and stock options from Akoya Biosciences. D.P. is an inventor on patents licensed by BMS and is entitled to royalties. The terms of all these arrangements are being managed by Johns Hopkins University in accordance with its conflict-of-interest policies. All other authors declare that they have no competing interests.
Data and materials availability: Processed and de-identified single-cell data for all untreated human samples are available in the Gene Expression Omnibus with accession number GSE235500. All processed and de-identified single-cell data from the neoadjuvant-treated human samples are available in the Gene Expression Omnibus with accession number GSE176022. All processed single-cell data for murine samples are available in the Gene Expression Omnibus with accession number GSE235603. In addition to the processed single-cell data, we have also made the raw scRNA-seq–TCR-seq data available in the European Genome-Phenome Archive with accession number EGAS00001005343. Owing to the personal, sensitive, and inherently identifying nature of raw genomic data, access to raw RNA-seq–TCR-seq data is controlled and may require institutional data use agreements. Full instructions to apply for data access can be found at https://ega-archive.org/access/data-access. All data needed to evaluate the conclusions in the manuscript are present in the paper or the Supplementary Materials. Scripts to reproduce the analyses used in this study are available at https://github.com/BKI-immuno/neoantigen-specific-T-cells-NSCLC.
REFERENCES AND NOTES
- 1.Kanwal B, Biswas S, Seminara RS, Jeet C, Immunotherapy in advanced non-small cell lung cancer patients: Ushering chemotherapy through the checkpoint inhibitors? Cureus 10, e3254 (2018). [DOI] [PMC free article] [PubMed] [Google Scholar]
- 2.Caushi JX, Zhang J, Ji Z, Vaghasia A, Zhang B, Hsiue EH-C, Mog BJ, Hou W, Justesen S, Blosser R, Tam A, Anagnostou V, Cottrell TR, Guo H, Chan HY, Singh D, Thapa S, Dykema AG, Burman P, Choudhury B, Aparicio L, Cheung LS, Lanis M, Belcaid Z, El Asmar M, Illei PB, Wang R, Meyers J, Schuebel K, Gupta A, Skaist A, Wheelan S, Naidoo J, Marrone KA, Brock M, Ha J, Bush EL, Park BJ, Bott M, Jones DR, Reuss JE, Velculescu VE, Chaft JE, Kinzler KW, Zhou S, Vogelstein B, Taube JM, Hellmann MD, Brahmer JR, Merghoub T, Forde PM, Yegnasubramanian S, Ji H, Pardoll DM, Smith KN, Transcriptional programs of neoantigen-specific TIL in anti-PD-1-treated lung cancers. Nature 596, 126–132 (2021). [DOI] [PMC free article] [PubMed] [Google Scholar]
- 3.Turner JA, Stephen-Victor E, Wang S, Rivas MN, Abdel-Gadir A, Harb H, Cui Y, Fanny M, Charbonnier L-M, Fong JJH, Benamar M, Wang L, Burton OT, Bansal K, Bry L, Zhu C, Li Q-Z, Clement RL, Oettgen HC, Crestani E, Rachid R, Sage PT, Chatila TA, Regulatory T cell-derived TGF-β1 controls multiple checkpoints governing allergy and autoimmunity. Immunity 53, 1202–1214.e6 (2020). [DOI] [PMC free article] [PubMed] [Google Scholar]
- 4.Miyara M, Sakaguchi S, Natural regulatory T cells: Mechanisms of suppression. Trends Mol. Med 13, 108–116 (2007). [DOI] [PubMed] [Google Scholar]
- 5.Nagai H, Horikawa T, Hara I, Fukunaga A, Oniki S, Oka M, Nishigori C, Ichihashi M, In vivo elimination of CD25+ regulatory T cells leads to tumor rejection of B16F10 melanoma, when combined with interleukin-12 gene transfer. Exp. Dermatol 13, 613–620 (2004). [DOI] [PubMed] [Google Scholar]
- 6.Dannull J, Su Z, Rizzieri D, Yang BK, Coleman D, Yancey D, Zhang A, Dahm P, Chao N, Gilboa E, Vieweg J, Enhancement of vaccine-mediated antitumor immunity in cancer patients after depletion of regulatory T cells. J. Clin. Invest 115, 3623–3633 (2005). [DOI] [PMC free article] [PubMed] [Google Scholar]
- 7.De Simone M, Arrigoni A, Rossetti G, Gruarin P, Ranzani V, Politano C, Bonnal RJP, Provasi E, Sarnicola ML, Panzeri I, Moro M, Crosti M, Mazzara S, Vaira V, Bosari S, Palleschi A, Santambrogio L, Bovo G, Zucchini N, Totis M, Gianotti L, Cesana G, Perego RA, Maroni N, Ceretti AP, Opocher E, De Francesco R, Geginat J, Stunnenberg HG, Abrignani S, Pagani M, Transcriptional landscape of human tissue lymphocytes unveils uniqueness of tumor-infiltrating T regulatory cells. Immunity 45, 1135–1147 (2016). [DOI] [PMC free article] [PubMed] [Google Scholar]
- 8.Petersen RP, Campa MJ, Sperlazza J, Conlon D, Joshi M-B, Harpole DHJ, Patz EFJ Jr., Tumor infiltrating Foxp3+ regulatory T-cells are associated with recurrence in pathologic stage I NSCLC patients. Cancer 107, 2866–2872 (2006). [DOI] [PubMed] [Google Scholar]
- 9.Bailey-Bucktrout SL, Martinez-Llordella M, Zhou X, Anthony B, Rosenthal W, Luche H, Fehling HJ, Bluestone JA, Self-antigen-driven activation induces instability of regulatory T cells during an inflammatory autoimmune response. Immunity 39, 949–962 (2013). [DOI] [PMC free article] [PubMed] [Google Scholar]
- 10.Luo Y, Xu C, Wang B, Niu Q, Su X, Bai Y, Zhu S, Zhao C, Sun Y, Wang J, Liu M, Sun X, Song G, Cui H, Chen X, Huang H, Wang H, Han M, Jiang E, Shi L, Feng X, Single-cell transcriptomic analysis reveals disparate effector differentiation pathways in human Treg compartment. Nat. Commun 12, 3913 (2021). [DOI] [PMC free article] [PubMed] [Google Scholar]
- 11.Zemmour D, Zilionis R, Kiner E, Klein AM, Mathis D, Benoist C, Single-cell gene expression reveals a landscape of regulatory T cell phenotypes shaped by the TCR. Nat. Immunol 19, 291–301 (2018). [DOI] [PMC free article] [PubMed] [Google Scholar]
- 12.Cillo AR, Kürten CHL, Tabib T, Qi Z, Onkar S, Wang T, Liu A, Duvvuri U, Kim S, Soose RJ, Oesterreich S, Chen W, Lafyatis R, Bruno TC, Ferris RL, Vignali DAA, Immune landscape of viral- and carcinogen-driven head and neck cancer. Immunity 52, 183–199.e9 (2020). [DOI] [PMC free article] [PubMed] [Google Scholar]
- 13.Oh DY, Kwek SS, Raju SS, Li T, McCarthy E, Chow E, Aran D, Ilano A, Pai C-CS, Rancan C, Allaire K, Burra A, Sun Y, Spitzer MH, Mangul S, Porten S, Meng MV, Friedlander TW, Ye CJ, Fong L, Intratumoral CD4+ T cells mediate anti-tumor cytotoxicity in human bladder cancer. Cell 181, 1612–1625.e13 (2020). [DOI] [PMC free article] [PubMed] [Google Scholar]
- 14.Eschweiler S, Clarke J, Ramírez-Suástegui C, Panwar B, Madrigal A, Chee SJ, Karydis I, Woo E, Alzetani A, Elsheikh S, Hanley CJ, Thomas GJ, Friedmann PS, Sanchez-Elsner T, Ay F, Ottensmeier CH, Vijayanand P, Intratumoral follicular regulatory T cells curtail anti-PD-1 treatment efficacy. Nat. Immunol 22, 1052–1063 (2021). [DOI] [PMC free article] [PubMed] [Google Scholar]
- 15.Miragaia RJ, Gomes T, Chomka A, Jardine L, Riedel A, Hegazy AN, Whibley N, Tucci A, Chen X, Lindeman I, Emerton G, Krausgruber T, Shields J, Haniffa M, Powrie F, Teichmann SA, Single-cell transcriptomics of regulatory T cells reveals trajectories of tissue adaptation. Immunity 50, 493–504.e7 (2019). [DOI] [PMC free article] [PubMed] [Google Scholar]
- 16.Delacher M, Simon M, Sanderink L, Hotz-Wagenblatt A, Wuttke M, Schambeck K, Schmidleithner L, Bittner S, Pant A, Ritter U, Hehlgans T, Riegel D, Schneider V, Groeber-Becker FK, Eigenberger A, Gebhard C, Strieder N, Fischer A, Rehli M, Hoffmann P, Edinger M, Strowig T, Huehn J, Schmidl C, Werner JM, Prantl L, Brors B, Imbusch CD, Feuerer M, Single-cell chromatin accessibility landscape identifies tissue repair program in human regulatory T cells. Immunity 54, 702–720.e17 (2021). [DOI] [PMC free article] [PubMed] [Google Scholar]
- 17.Forde PM, Chaft JE, Smith KN, Anagnostou V, Cottrell TR, Hellmann MD, Zahurak M, Yang SC, Jones DR, Broderick S, Battafarano RJ, Velez MJ, Rekhtman N, Olah Z, Naidoo J, Marrone KA, Verde F, Guo H, Zhang J, Caushi JX, Chan HY, Sidhom J-W, Scharpf RB, White J, Gabrielson E, Wang H, Rosner GL, Rusch V, Wolchok JD, Merghoub T, Taube JM, Velculescu VE, Topalian SL, Brahmer JR, Pardoll DM, Neoadjuvant PD-1 blockade in resectable lung cancer. N. Engl. J. Med 378, 1976–1986 (2018). [DOI] [PMC free article] [PubMed] [Google Scholar]
- 18.Forde PM, Spicer J, Lu S, Provencio M, Mitsudomi T, Awad MM, Felip E, Broderick SR,Brahmer JR, Swanson SJ, Kerr K, Wang C, Ciuleanu T-E, Saylors GB, Tanaka F, Ito H, Chen K-N, Liberman M, Vokes EE, Taube JM, Dorange C, Cai J, Fiore J, Jarkowski A, Balli D, Sausen M, Pandya D, Calvet CY, Girard N; CheckMate 816 Investigators, Neoadjuvant nivolumab plus chemotherapy in resectable lung cancer. N. Engl. J. Med 386, 1973–1985 (2022). [DOI] [PMC free article] [PubMed] [Google Scholar]
- 19.Akimova T, Beier UH, Wang L, Levine MH, Hancock WW, Helios expression is a marker of T cell activation and proliferation. PLOS ONE 6, e24226 (2011). [DOI] [PMC free article] [PubMed] [Google Scholar]
- 20.Zheng Y, Manzotti CN, Burke F, Dussably L, Qureshi O, Walker LSK, Sansom DM, Acquisition of suppressive function by activated human CD4+ CD25− T cells is associated with the expression of CTLA-4 not FoxP3. J. Immunol 181, 1683–1691 (2008). [DOI] [PMC free article] [PubMed] [Google Scholar]
- 21.Liu W, Putnam AL, Xu-Yu Z, Szot GL, Lee MR, Zhu S, Gottlieb PA, Kapranov P, Gingeras TR, Fazekas de St Groth B, Clayberger C, Soper DM, Ziegler SF, Bluestone JA, CD127 expression inversely correlates with FoxP3 and suppressive function of human CD4+ T reg cells. J. Exp. Med 203, 1701–1711 (2006). [DOI] [PMC free article] [PubMed] [Google Scholar]
- 22.Villarreal DO, L’Huillier A, Armington S, Mottershead C, Filippova EV, Coder BD, Petit RG, Princiotta MF, Targeting CCR8 induces protective antitumor immunity and enhances vaccine-induced responses in colon cancer. Cancer Res 78, 5340–5348 (2018). [DOI] [PubMed] [Google Scholar]
- 23.Whiteside SK, Grant FM, Gyori DS, Conti AG, Imianowski CJ, Kuo P, Nasrallah R, Sadiyah F, Lira SA, Tacke F, Eil RL, Burton OT, Dooley J, Liston A, Okkenhaug K, Yang J, Roychoudhuri R, CCR8 marks highly suppressive Treg cells within tumours but is dispensable for their accumulation and suppressive function. Immunology 163, 512–520 (2021). [DOI] [PMC free article] [PubMed] [Google Scholar]
- 24.Yujiro K, Wataru N, Yoshiaki Y, Atsunari K, Atsushi T, Yudai S, Yumi T, Kunitaka N, Reimi M, Masaki H, Motonao O, Keiji D, Takayuki K, Azumi U, Mai Y, Tetsuya Y, Mitsunobu M, Kanji H, Satomi S, Hiroshi Y, Michinari H, Miya H, Yamami N, Daisuke M, Daisuke O, Yasuko S, Makoto K, Tatsusada O, Taigo K, Koji H, Motohide U, Ryoichi I, Kazunori Y, Atsushi T, Yasushi S, Tadashi K, Norio N, Hisashi W, Masaki M, Yuichiro D, Naganari O, Shimon S, CCR8-targeted specific depletion of clonally expanded Treg cells in tumor tissues evokes potent tumor immunity with long-lasting memory. Proc. Natl. Acad. Sci. U.S.A 119, e2114282119 (2022). [DOI] [PMC free article] [PubMed] [Google Scholar]
- 25.Freeman ZT, Nirschl TR, Hovelson DH, Johnston RJ, Engelhardt JJ, Selby MJ, Kochel CM, Lan RY, Zhai J, Ghasemzadeh A, Gupta A, Skaist AM, Wheelan SJ, Jiang H, Pearson AT, Snyder LA, Korman AJ, Tomlins SA, Yegnasubramanian S, Drake CG, A conserved intratumoral regulatory T cell signature identifies 4–1BB as a pan-cancer target. J. Clin. Invest 130, 1405–1416 (2020). [DOI] [PMC free article] [PubMed] [Google Scholar]
- 26.Moser B, Chemokine receptor-targeted therapies: Special case for CCR8. Cancers (Basel) 14, 511 (2022). [DOI] [PMC free article] [PubMed] [Google Scholar]
- 27.Collison LW, Workman CJ, Kuo TT, Boyd K, Wang Y, Vignali KM, Cross R, Sehy D, Blumberg RS, Vignali DAA, The inhibitory cytokine IL-35 contributes to regulatory T-cell function. Nature 450, 566–569 (2007). [DOI] [PubMed] [Google Scholar]
- 28.Sullivan JA, Tomita Y, Jankowska-Gan E, Lema DA, Arvedson MP, Nair A, Bracamonte-Baran W, Zhou Y, Meyer KK, Zhong W, Sawant DV, Szymczak-Workman AL, Zhang Q, Workman CJ, Hong S, Vignali DAA, Burlingham WJ, Treg-cell-derived IL-35-coated extracellular vesicles promote infectious tolerance. Cell Rep 30, 1039–1051.e5 (2020). [DOI] [PMC free article] [PubMed] [Google Scholar]
- 29.Guo X, Zhang Y, Zheng L, Zheng C, Song J, Zhang Q, Kang B, Liu Z, Jin L, Xing R, Gao R, Zhang L, Dong M, Hu X, Ren X, Kirchhoff D, Roider HG, Yan T, Zhang Z, Global characterization of T cells in non-small-cell lung cancer by single-cell sequencing. Nat. Med 24, 978–985 (2018). [DOI] [PubMed] [Google Scholar]
- 30.Liu B, Hu X, Feng K, Gao R, Xue Z, Zhang S, Zhang Y, Corse E, Hu Y, Han W, Zhang Z, Temporal single-cell tracing reveals clonal revival and expansion of precursor exhausted T cells during anti-PD-1 therapy in lung cancer. Nat. Cancer 3, 108–121 (2022). [DOI] [PubMed] [Google Scholar]
- 31.Zheng C, Zheng L, Yoo J-K, Guo H, Zhang Y, Guo X, Kang B, Hu R, Huang JY, Zhang Q, Liu Z, Dong M, Hu X, Ouyang W, Peng J, Zhang Z, Landscape of infiltrating T cells in liver cancer revealed by single-cell sequencing. Cell 169, 1342–1356.e16 (2017). [DOI] [PubMed] [Google Scholar]
- 32.Zhang L, Yu X, Zheng L, Zhang Y, Li Y, Fang Q, Gao R, Kang B, Zhang Q, Huang JY, Konno H, Guo X, Ye Y, Gao S, Wang S, Hu X, Ren X, Shen Z, Ouyang W, Zhang Z, Lineage tracking reveals dynamic relationships of T cells in colorectal cancer. Nature 564, 268–272 (2018). [DOI] [PubMed] [Google Scholar]
- 33.Bhatt D, Kang B, Sawant D, Zheng L, Perez K, Huang Z, Sekirov L, Wolak D, Huang JY, Liu X, DeVoss J, Manzanillo PS, Pierce N, Zhang Z, Symons A, Ouyang W, STARTRAC analyses of scRNAseq data from tumor models reveal T cell dynamics and therapeutic targets. J. Exp. Med 218, e20201329 (2021). [DOI] [PMC free article] [PubMed] [Google Scholar]
- 34.Vasanthakumar A, Liao Y, Teh P, Pascutti MF, Oja AE, Garnham AL, Gloury R, Tempany JC, Sidwell T, Cuadrado E, Tuijnenburg P, Kuijpers TW, Lalaoui N, Mielke LA, Bryant VL, Hodgkin PD, Silke J, Smyth GK, Nolte MA, Shi W, Kallies A, The TNF receptor superfamily-NF-κB axis is critical to maintain effector regulatory T cells in lymphoid and non-lymphoid tissues. Cell Rep 20, 2906–2920 (2017). [DOI] [PubMed] [Google Scholar]
- 35.Lubrano di Ricco M, Ronin E, Collares D, Divoux J, Grégoire S, Wajant H, Gomes T, Grinberg-Bleyer Y, Baud V, Marodon G, Salomon BL, Tumor necrosis factor receptor family costimulation increases regulatory T-cell activation and function via NF-κB. Eur. J. Immunol 50, 972–985 (2020). [DOI] [PMC free article] [PubMed] [Google Scholar]
- 36.Qu Y, Wang X, Bai S, Niu L, Zhao G, Yao Y, Li B, Li H, The effects of TNF-α/TNFR2 in regulatory T cells on the microenvironment and progression of gastric cancer. Int. J. Cancer 150, 1373–1391 (2022). [DOI] [PMC free article] [PubMed] [Google Scholar]
- 37.Chen Y, Jia M, Wang S, Xu S, He N, Antagonistic antibody targeting TNFR2 inhibits regulatory T cell function to promote anti-tumor activity. Front. Immunol 13, 835690 (2022). [DOI] [PMC free article] [PubMed] [Google Scholar]
- 38.Jiang M, Yang Y, Niu L, Li P, Chen Y, Liao P, Wang Y, Zheng J, Chen F, He H, Li H, Chen X, MiR-125b-5p modulates the function of regulatory T cells in tumor microenvironment by targeting TNFR2. J. Immunother. Cancer 10, e005241 (2022). [DOI] [PMC free article] [PubMed] [Google Scholar]
- 39.Kumar P, Arbieva ZH, Maienschein-Cline M, Ganesh BB, Ramasamy S, Prabhakar BS, Induction of antigen-independent proliferation of regulatory T-cells by TNF superfamily ligands OX40L and GITRL. Methods Mol. Biol 2248, 63–71 (2021). [DOI] [PubMed] [Google Scholar]
- 40.Devi-Marulkar P, Fastenackels S, Karapentiantz P, Goc J, Germain C, Kaplon H, Knockaert S, Olive D, Panouillot M, Validire P, Damotte D, Alifano M, Murris J, Katsahian S, Lawand M, Dieu-Nosjean M-C, Regulatory T cells infiltrate the tumor-induced tertiary lymphoïd structures and are associated with poor clinical outcome in NSCLC. Commun. Biol 5, 1416 (2022). [DOI] [PMC free article] [PubMed] [Google Scholar]
- 41.Hui Z, Zhang J, Ren Y, Li X, Yan C, Yu W, Wang T, Xiao S, Chen Y, Zhang R, Wei F, You J, Ren X, Single-cell profiling of immune cells after neoadjuvant pembrolizumab and chemotherapy in IIIA non-small cell lung cancer (NSCLC). Cell Death Dis 13, 607 (2022). [DOI] [PMC free article] [PubMed] [Google Scholar]
- 42.Hsieh C-S, Liang Y, Tyznik AJ, Self SG, Liggitt D, Rudensky AY, Recognition of the peripheral self by naturally arising CD25+ CD4+ T cell receptors. Immunity 21, 267–277 (2004). [DOI] [PubMed] [Google Scholar]
- 43.Itoh M, Takahashi T, Sakaguchi N, Kuniyasu Y, Shimizu J, Otsuka F, Sakaguchi S, Thymus and autoimmunity: Production of CD25+CD4+ naturally anergic and suppressive T cells as a key function of the thymus in maintaining immunologic self-tolerance. J. Immunol 162, 5317–5326 (1999). [PubMed] [Google Scholar]
- 44.Malchow S, Leventhal DS, Nishi S, Fischer BI, Shen L, Paner GP, Amit AS, Kang C, Geddes JE, Allison JP, Socci ND, Savage PA, Aire-dependent thymic development of tumor-associated regulatory T cells. Science 339, 1219–1224 (2013). [DOI] [PMC free article] [PubMed] [Google Scholar]
- 45.Leonard JD, Gilmore DC, Dileepan T, Nawrocka WI, Chao JL, Schoenbach MH, Jenkins MK, Adams EJ, Savage PA, Identification of natural regulatory T cell epitopes reveals convergence on a dominant autoantigen. Immunity 47, 107–117.e8 (2017). [DOI] [PMC free article] [PubMed] [Google Scholar]
- 46.Oxenius A, Bachmann MF, Zinkernagel RM, Hengartner H, Virus-specific MHC-class II-restricted TCR-transgenic mice: Effects on humoral and cellular immune responses after viral infection. Eur. J. Immunol 28, 390–400 (1998). [DOI] [PubMed] [Google Scholar]
- 47.Ohashi PS, Oehen S, Buerki K, Pircher H, Ohashi CT, Odermatt B, Malissen B, Zinkernagel RM, Hengartner H, Ablation of “tolerance” and induction of diabetes by virus infection in viral antigen transgenic mice. Cell 65, 305–317 (1991). [DOI] [PubMed] [Google Scholar]
- 48.Gupta A, De Felice KM, Loftus EV Jr., Khanna S, Systematic review: Colitis associated with anti-CTLA-4 therapy. Aliment. Pharmacol. Ther 42, 406–417 (2015). [DOI] [PubMed] [Google Scholar]
- 49.Jolicoeur C, Hanahan D, Smith KM, T-cell tolerance toward a transgenic beta-cell antigen and transcription of endogenous pancreatic genes in thymus. Proc. Natl. Acad. Sci. U.S.A 91, 6707–6711 (1994). [DOI] [PMC free article] [PubMed] [Google Scholar]
- 50.Yanagihara T, Tomino T, Uruno T, Fukui Y, Thymic epithelial cell–specific deletion of Jmjd6 reduces Aire protein expression and exacerbates disease development in a mouse model of autoimmune diabetes. Biochem. Biophys. Res. Commun 489, 8–13 (2017). [DOI] [PubMed] [Google Scholar]
- 51.Attridge K, Walker LSK, Homeostasis and function of regulatory T cells (Tregs) in vivo: Lessons from TCR-transgenic Tregs. Immunol. Rev 259, 23–39 (2014). [DOI] [PMC free article] [PubMed] [Google Scholar]
- 52.Magen A, Nie J, Ciucci T, Tamoutounour S, Zhao Y, Mehta M, Tran B, McGavern DB, Hannenhalli S, Bosselut R, Single-cell profiling defines transcriptomic signatures specific to tumor-reactive versus virus-responsive CD4+ T cells. Cell Rep 29, 3019–3032.e6 (2019). [DOI] [PMC free article] [PubMed] [Google Scholar]
- 53.Kearney ER, Walunas TL, Karr RW, Morton PA, Loh DY, Bluestone JA, Jenkins MK, Antigen-dependent clonal expansion of a trace population of antigen-specific CD4+ T cells in vivo is dependent on CD28 costimulation and inhibited by CTLA-4. J. Immunol 155, 1032–1036 (1995). [PubMed] [Google Scholar]
- 54.Van Damme H, Dombrecht B, Kiss M, Roose H, Allen E, Van Overmeire E, Kancheva D, Martens L, Murgaski A, Bardet PMR, Blancke G, Jans M, Bolli E, Martins MS, Elkrim Y, Dooley J, Boon L, Schwarze JK, Tacke F, Movahedi K, Vandamme N, Neyns B, Ocak S, Scheyltjens I, Vereecke L, Nana FA, Merchiers P, Laoui D, Van Ginderachter JA, Therapeutic depletion of CCR8+ tumor-infiltrating regulatory T cells elicits antitumor immunity and synergizes with anti-PD-1 therapy. J. Immunother. Cancer 9, e001749 (2021). [DOI] [PMC free article] [PubMed] [Google Scholar]
- 55.He L, Binari R, Huang J, Falo-Sanjuan J, Perrimon N, In vivo study of gene expression with an enhanced dual-color fluorescent transcriptional timer. eLife 8, e46181 (2019). [DOI] [PMC free article] [PubMed] [Google Scholar]
- 56.McClymont SA, Putnam AL, Lee MR, Esensten JH, Liu W, Hulme MA, Hoffmüller U, Baron U, Olek S, Bluestone JA, Brusko TM, Plasticity of human regulatory T cells in healthy subjects and patients with type 1 diabetes. J. Immunol 186, 3918–3926 (2011). [DOI] [PMC free article] [PubMed] [Google Scholar]
- 57.Kitz A, de Marcken M, Gautron A-S, Mitrovic M, Hafler DA, Dominguez-Villar M, AK-Tisoforms modulate Th1-like Treg generation and function in human autoimmune disease. EMBO Rep 17, 1169–1183 (2016). [DOI] [PMC free article] [PubMed] [Google Scholar]
- 58.Oldenhove G, Bouladoux N, Wohlfert EA, Hall JA, Chou D, Dos Santos L, O’Brien S, Blank R, Lamb E, Natarajan S, Kastenmayer R, Hunter C, Grigg ME, Belkaid Y, Decrease of Foxp3+ Treg cell number and acquisition of effector cell phenotype during lethal infection. Immunity 31, 772–786 (2009). [DOI] [PMC free article] [PubMed] [Google Scholar]
- 59.Di Giovangiulio M, Rizzo A, Franzè E, Caprioli F, Facciotti F, Onali S, Favale A, Stolfi C, Fehling H-J, Monteleone G, Fantini MC, Tbet expression in regulatory T cells is required to initiate Th1-mediated colitis. Front. Immunol 10, 2158 (2019). [DOI] [PMC free article] [PubMed] [Google Scholar]
- 60.Dominguez-Villar M, Baecher-Allan CM, Hafler DA, Identification of T helper type 1-like, Foxp3+ regulatory T cells in human autoimmune disease. Nat. Med 17, 673–675 (2011). [DOI] [PMC free article] [PubMed] [Google Scholar]
- 61.Bogen B, Fauskanger M, Haabeth OA, Tveita A, CD4+ T cells indirectly kill tumor cells via induction of cytotoxic macrophages in mouse models. Cancer Immunol. Immunother 68, 1865–1873 (2019). [DOI] [PMC free article] [PubMed] [Google Scholar]
- 62.Grossman WJ, Verbsky JW, Barchet W, Colonna M, Atkinson JP, Ley TJ, Human T regulatory cells can use the perforin pathway to cause autologous target cell death. Immunity 21, 589–601 (2004). [DOI] [PubMed] [Google Scholar]
- 63.Ng SS, De Labastida Rivera F, Yan J, Corvino D, Das I, Zhang P, Kuns R, Chauhan SB, Hou J, Li X-Y, Frame TCM, McEnroe BA, Moore E, Na J, Engel JA, Soon MSF, Singh B, Kueh AJ, Herold MJ, Montes de Oca M, Singh SS, Bunn PT, Aguilera AR, Casey M, Braun M, Ghazanfari N, Wani S, Wang Y, Amante FH, Edwards CL, Haque A, Dougall WC, Singh OP, Baxter AG, Teng MWL, Loukas A, Daly NL, Cloonan N, Degli-Esposti MA, Uzonna J, Heath WR, Bald T, Tey S-K, Nakamura K, Hill GR, Kumar R, Sundar S, Smyth MJ, Engwerda CR, The NK cell granule protein NKG7 regulates cytotoxic granule exocytosis and inflammation. Nat. Immunol 21, 1205–1218 (2020). [DOI] [PMC free article] [PubMed] [Google Scholar]
- 64.Li X-Y, Corvino D, Nowlan B, Aguilera AR, Ng SS, Braun M, Cillo AR, Bald T, Smyth MJ, Engwerda CR, NKG7 is required for optimal antitumor T-cell immunity. Cancer Immunol. Res 10, 154–161 (2022). [DOI] [PubMed] [Google Scholar]
- 65.Bailey-Bucktrout S, Zhou X, Rosenthal W, Bluestone J, Auto-reactive exTreg cells are generated during the initiation of autoimmune inflammation. (115.23). J. Immunol 186, 115.23 (2011). [Google Scholar]
- 66.Joller N, Kuchroo VK, Good guys gone bad: exTreg cells promote autoimmune arthritis. Nat. Med 20, 15–17 (2014). [DOI] [PubMed] [Google Scholar]
- 67.Jenkins MK, The in vivo response of naive CD4+ T cells. J. Immunol 193, 3829–3831 (2014). [DOI] [PubMed] [Google Scholar]
- 68.Santegoets SJ, Duurland CL, Jordanova ES, van Ham JJ, Ehsan I, van Egmond SL, Welters MJP, van der Burg SH, Tbet-positive regulatory T cells accumulate in oropharyngeal cancers with ongoing tumor-specific type 1 T cell responses. J. Immunother. Cancer 7, 14 (2019). [DOI] [PMC free article] [PubMed] [Google Scholar]
- 69.Tommasini A, Ferrari S, Moratto D, Badolato R, Boniotto M, Pirulli D, Notarangelo LD, Andolina M, X-chromosome inactivation analysis in a female carrier of FOXP3 mutation. Clin. Exp. Immunol 130, 127–130 (2002). [DOI] [PMC free article] [PubMed] [Google Scholar]
- 70.Ganguly S, Ross DB, Panoskaltsis-Mortari A, Kanakry CG, Blazar BR, Levy RB, Luznik L, Donor CD4+ Foxp3+ regulatory T cells are necessary for posttransplantation cyclophosphamide-mediated protection against GVHD in mice. Blood 124, 2131–2141 (2014). [DOI] [PMC free article] [PubMed] [Google Scholar]
- 71.Lyon MF, Lyonisation of the X Chromosome. Lancet (London, England) 282, 1120–1121 (1963). [DOI] [PubMed] [Google Scholar]
- 72.Bégin P, Schulze J, Baron U, Olek S, Bauer RN, Passerini L, Baccheta R, Nadeau KC, Human in vitro induced T regulatory cells and memory T cells share common demethylation of specific FOXP3 promoter region. Clin. Transl. Allergy 5, 35 (2015). [DOI] [PMC free article] [PubMed] [Google Scholar]
- 73.Granier C, De Guillebon E, Blanc C, Roussel H, Badoual C, Colin E, Saldmann A, Gey A, Oudard S, Tartour E, Mechanisms of action and rationale for the use of checkpoint inhibitors in cancer. ESMO Open 2, e000213 (2017). [DOI] [PMC free article] [PubMed] [Google Scholar]
- 74.Sugamura K, Ishii N, Weinberg AD, Therapeutic targeting of the effector T-cell co-stimulatory molecule OX40. Nat. Rev. Immunol 4, 420–431 (2004). [DOI] [PubMed] [Google Scholar]
- 75.Huang C-T, Workman CJ, Flies D, Pan X, Marson AL, Zhou G, Hipkiss EL, Ravi S, Kowalski J, Levitsky HI, Powell JD, Pardoll DM, Drake CG, Vignali DAA, Role of LAG-3 in regulatory T cells. Immunity 21, 503–513 (2004). [DOI] [PubMed] [Google Scholar]
- 76.Thaker YR, Andrews LP, Workman CJ, Vignali DAA, Sharpe AH, Treg-specific LAG3 deletion reveals a key role for LAG3 in regulatory T cells to inhibit CNS autoimmunity. J. Immunol. 200, 101.7 (2018). [Google Scholar]
- 77.Do J, Visperas A, Sanogo YO, Bechtel JJ, Dvorina N, Kim S, Jang E, Stohlman SA, Shen B, Fairchild RL, Baldwin III WM, Vignali DAA, Min B, An IL-27/Lag3 axis enhances Foxp3+ regulatory T cell–suppressive function and therapeutic efficacy. Mucosal Immunol 9, 137–145 (2016). [DOI] [PMC free article] [PubMed] [Google Scholar]
- 78.Zhang Q, Beres A, Vignali D, Regulatory T cells use LAG-3 as the “brake” in autoimmune diabetes but the “accelerator” in tumor environment (IRC4P.487). J. Immunol 192, 60.14 (2014). [Google Scholar]
- 79.Piconese S, Timperi E, Pacella I, Schinzari V, Tripodo C, Rossi M, Guglielmo N, Mennini G, Grazi GL, Di Filippo S, Brozzetti S, Fazzi K, Antonelli G, Lozzi MA, Sanchez M, Barnaba V, Human OX40 tunes the function of regulatory T cells in tumor and nontumor areas of hepatitis C virus-infected liver tissue. Hepatology 60, 1494–1507 (2014). [DOI] [PubMed] [Google Scholar]
- 80.Xie K, Xu L, Wu H, Liao H, Luo L, Liao M, Gong J, Deng Y, Yuan K, Wu H, Zeng Y, OX40 expression in hepatocellular carcinoma is associated with a distinct immune microenvironment, specific mutation signature, and poor prognosis. Onco. Targets. Ther 7, e1404214 (2018). [DOI] [PMC free article] [PubMed] [Google Scholar]
- 81.Delgoffe GM, Woo S-R, Turnis ME, Gravano DM, Guy C, Overacre AE, Bettini ML, Vogel P, Finkelstein D, Bonnevier J, Workman CJ, Vignali DAA, Stability and function of regulatory T cells is maintained by a neuropilin-1-semaphorin-4a axis. Nature 501, 252–256 (2013). [DOI] [PMC free article] [PubMed] [Google Scholar]
- 82.Toi Y, Sugawara S, Kawashima Y, Aiba T, Kawana S, Saito R, Tsurumi K, Suzuki K, Shimizu H, Sugisaka J, Ono H, Domeki Y, Terayama K, Nakamura A, Yamanda S, Kimura Y, Honda Y, Association of immune-related adverse events with clinical benefit in patients with advanced non-small-cell lung cancer treated with nivolumab. Oncologist 23, 1358–1365 (2018). [DOI] [PMC free article] [PubMed] [Google Scholar]
- 83.Oliveira G, Stromhaug K, Cieri N, Iorgulescu JB, Klaeger S, Wolff JO, Rachimi S, Chea V, Krause K, Freeman SS, Zhang W, Li S, Braun DA, Neuberg D, Carr SA, Livak KJ, Frederick DT, Fritsch EF, Wind-Rotolo M, Hacohen N, Sade-Feldman M, Yoon CH, Keskin DB, Ott PA, Rodig SJ, Boland GM, Wu CJ, Landscape of helper and regulatory antitumour CD4+ T cells in melanoma. Nature 605, 532–538 (2022). [DOI] [PMC free article] [PubMed] [Google Scholar]
- 84.Wu F, Fan J, He Y, Xiong A, Yu J, Li Y, Zhang Y, Zhao W, Zhou F, Li W, Zhang J, Zhang X, Qiao M, Gao G, Chen S, Chen X, Li X, Hou L, Wu C, Su C, Ren S, Odenthal M, Buettner R, Fang N, Zhou C, Single-cell profiling of tumor heterogeneity and the microenvironment in advanced non-small cell lung cancer. Nat. Commun 12, 2540 (2021). [DOI] [PMC free article] [PubMed] [Google Scholar]
- 85.Zhang L, Zhang Z, Recharacterizing tumor-infiltrating lymphocytes by single-cell RNA sequencing. Cancer Immunol. Res 7, 1040–1046 (2019). [DOI] [PubMed] [Google Scholar]
- 86.Wlosik J, Fattori S, Rochigneux P, Goncalves A, Olive D, Chretien AS, in Seminars in Immunopathology (Springer, 2022), pp. 1–13. [DOI] [PMC free article] [PubMed] [Google Scholar]
- 87.Cottrell TR, Thompson ED, Forde PM, Stein JE, Duffield AS, Anagnostou V, Rekhtman N, Anders RA, Cuda JD, Illei PB, Gabrielson E, Askin FB, Niknafs N,Smith KN, Velez MJ, Sauter JL, Isbell JM, Jones DR, Battafarano RJ, Yang SC, Danilova L, Wolchok JD, Topalian SL, Velculescu VE, Pardoll DM, Brahmer JR, Hellmann MD, Chaft JE, Cimino-Mathews A, Taube JM, Pathologic features of response to neoadjuvant anti-PD-1 in resected non-small-cell lung carcinoma: A proposal for quantitative immune-related pathologic response criteria (irPRC). Ann. Oncol. Off. J. Eur. Soc. Med. Oncol 29, 1853–1860 (2018). [DOI] [PMC free article] [PubMed] [Google Scholar]
- 88.Dykema AG, Zhang B, Woldemeskel BA, Garliss CC, Cheung LS, Choudhury D, Zhang J, Aparicio L, Bom S, Rashid R, Caushi JX, Hsiue EH-C, Cascino K, Thompson EA, Kwaa AK, Singh D, Thapa S, Ordonez AA, Pekosz A, D’Alessio FR, Powell JD, Yegnasubramanian S, Zhou S, Pardoll DM, Ji H, Cox AL, Blankson JN, Smith KN, Functional characterization of CD4+ T cell receptors crossreactive for SARS-CoV-2 and endemic coronaviruses. J. Clin. Invest 131, e146922 (2021). [DOI] [PMC free article] [PubMed] [Google Scholar]
- 89.Stuart T, Butler A, Hoffman P, Hafemeister C, Papalexi E, Mauck III WM, Hao Y, Stoeckius M, Smibert P, Satija R, Comprehensive integration of single-cell data. Cell 177, 1888–1902.e21 (2019). [DOI] [PMC free article] [PubMed] [Google Scholar]
- 90.O’Flanagan CH, Campbell KR, Zhang AW, Kabeer F, Lim JLP, Biele J, Eirew P, Lai D, McPherson A, Kong E, Bates C, Borkowski K, Wiens M, Hewitson B, Hopkins J, Pham J, Ceglia N, Moore R, Mungall AJ, McAlpine JN; The CRUK IMAXT Grand Challenge Team, S. P. Shah, S. Aparicio, Dissociation of solid tumor tissues with cold active protease for single-cell RNA-seq minimizes conserved collagenase-associated stress responses. Genome Biol 20, 210 (2019). [DOI] [PMC free article] [PubMed] [Google Scholar]
- 91.van den Brink SC, Sage F, Vértesy Á, Spanjaard B, Peterson-Maduro J, Baron CS, Robin C, van Oudenaarden A, Single-cell sequencing reveals dissociation-induced gene expression in tissue subpopulations. Nat. Methods 14, 935–936 (2017). [DOI] [PubMed] [Google Scholar]
- 92.Korsunsky I, Millard N, Fan J, Slowikowski K, Zhang F, Wei K, Baglaenko Y, Brenner M, Loh P-R, Raychaudhuri S, Fast, sensitive and accurate integration of single-cell data with Harmony. Nat. Methods 16, 1289–1296 (2019). [DOI] [PMC free article] [PubMed] [Google Scholar]
- 93.Hotelling H, Relations between two sets of variates*. Biometrika 28, 321–377 (1936). [Google Scholar]
- 94.Härdle W, Simar L, Applied Multivariate Statistical Analysis (2003). [Google Scholar]
- 95.Kolde R, Pheatmap: Pretty heatmaps. 2015. R Packag version 1 (2017). [Google Scholar]
- 96.Collison LW, Vignali DAA, In vitro Treg suppression assays. Methods Mol. Biol 707, 21–37 (2011). [DOI] [PMC free article] [PubMed] [Google Scholar]
- 97.Spangler JB, Tomala J, Luca VC, Jude KM, Dong S, Ring AM, Votavova P, Pepper M, Kovar M, Garcia KC, Antibodies to interleukin-2 elicit selective T cell subset potentiation through distinct conformational mechanisms. Immunity 42, 815–825 (2015). [DOI] [PMC free article] [PubMed] [Google Scholar]
- 98.Boyman O, Kovar M, Rubinstein MP, Surh CD, Sprent J, Selective stimulation of T cell subsets with antibody-cytokine immune complexes. Science 311, 1924–1927 (2006). [DOI] [PubMed] [Google Scholar]
- 99.Melville J, uwot: The uniform manifold approximation and projection (UMAP) method for dimensionality reductionR Packag version 15 (2020). [Google Scholar]
- 100.McInnes L, Healy J, Melville J, UMAP: Uniform Manifold Approximation and Projection for Dimension Reduction. arXiv.1802.03426 [stat.ML] (2018). [Google Scholar]
- 101.Hao Y, Hao S, Andersen-Nissen E, Mauck WM, Zheng S, Butler A, Lee MJ, Wilk AJ, Darby C, Zager M, Hoffman P, Stoeckius M, Papalexi E, Mimitou EP, Jain J, Srivastava A, Stuart T, Fleming LM, Yeung B, Rogers AJ, McElrath JM, Blish CA, Gottardo R, Smibert P, Satija R, Integrated analysis of multimodal single-cell data. Cell 184, 3573–3587.e29 (2021). [DOI] [PMC free article] [PubMed] [Google Scholar]
- 102.Korotkevich G, Sukhov V, Budin N, Shpak B, Artyomov MN, Sergushichev A, Fast gene set enrichment analysis. bioRxiv, 60012 (2021). 10.1101/060012. [DOI] [Google Scholar]
- 103.Zheng Y, Josefowicz S, Chaudhry A, Peng XP, Forbush K, Rudensky AY, Role of conserved non-coding DNA elements in the Foxp3 gene in regulatory T-cell fate. Nature 463, 808–812 (2010). [DOI] [PMC free article] [PubMed] [Google Scholar]
Associated Data
This section collects any data citations, data availability statements, or supplementary materials included in this article.