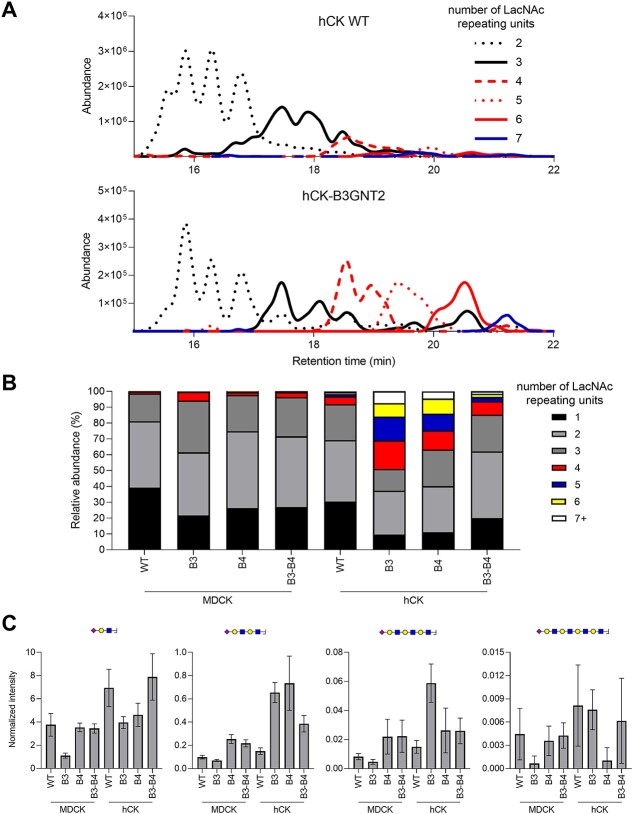
Fig. 3.
N-glycan analysis of WT and B3GNT2/B4GALT1 knock-in MDCK and hCK cells using MS. The N-glycans from WT and B3GNT2/B4GALT1 knock-in MDCK and hCK cells were measured using HILIC-IMS-QTOF positive mode MS. a) Chromatograms of hCK WT and hCK-B3GNT2 cells were constructed for the glycans with at least 2 and at most 7 LacNAc repeating units. The extracted-ion-counts for the 10 most abundant glycan features per LacNAc repeating unit group were summed to yield a chromatogram. b) The N-glycans found in HILIC-IMS-QTOF positive mode MS with at least 1 LacNAc repeating unit were analyzed for the number of LacNAc repeating units present and the relative abundance was calculated. Further analysis is presented in Fig. S5. Full glycan feature lists for each cell line are presented in Tables SII–SIX. c) Analysis of the N-glycans was additionally performed by LC–MS/MS, followed by analysis of the glycan oxonium ions (Table SX). Sia capped (repeating) LacNAc oxonium ions with masses (from left to right) 657.2349, 1,022.3671, 1,387.4993, and 1,752.6315 were identified and the amounts detected were normalized to the core fragments. Mean and standard errors (n = 3) are shown. Further analysis is shown in Fig. S6 and annotated spectra are present in Fig. S7.

