Abstract
The therapeutic efficacy of photodynamic therapy is limited by the ability of light to penetrate tissues. Due to this limitation, Cerenkov luminescence (CL) from radionuclides has recently been proposed as an alternative light source in a strategy referred to as Cerenkov radiation induced therapy (CRIT). Semiconducting polymer nanoparticles (SPNs) have ideal optical properties, such as large absorption cross-sections and broad absorbance, which can be utilized to harness the relatively weak CL produced by radionuclides. SPNs can be doped with photosensitizers and have nearly 100% energy transfer efficiency by multiple energy transfer mechanisms. Herein, we investigated an optimized photosensitizer doped SPN as a nanosystem to harness and amplify CL for cancer theranostics. We found that semiconducting polymers significantly amplified CL energy transfer efficiency. Bimodal PET and optical imaging studies showed high tumor uptake and retention of the optimized SPNs when administered intravenously or intratumorally. Lastly, we found that photosensitizer doped SPNs have excellent potential as a cancer theranostics nanosystem in an in vivo tumor therapy study. Our study shows that SPNs are ideally suited to harness and amplify CL for cancer theranostics, which may provide a significant advancement for CRIT that are unabated by tissue penetration limits.
Keywords: Semiconducting polymers, Cerenkov radiation, nanomaterials, cancer theranostics, positron emission tomography, multimodal imaging, drug delivery
Graphical Abstract
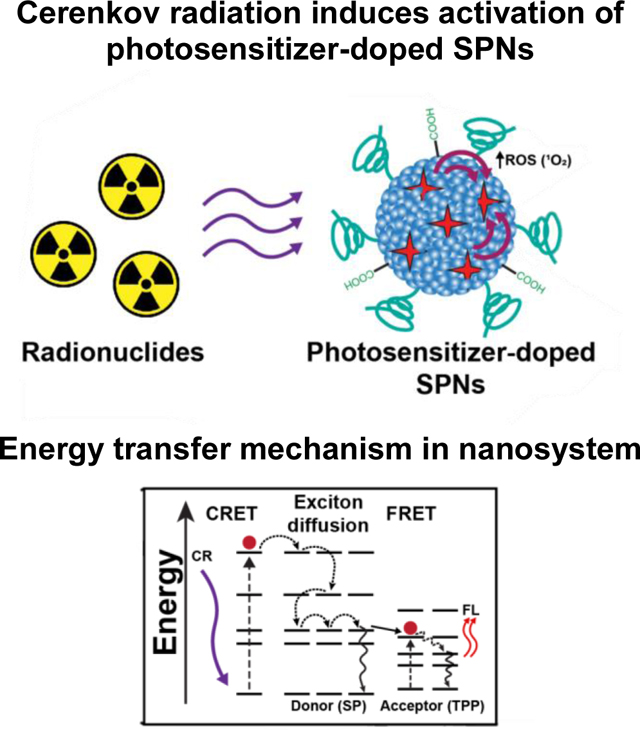
Cerenkov radiation induced activation of nanosystems is a strategy that aims to eliminate the tissue penetration limits of traditional photodyanamic therapy by light emitted from radionuclides as an activation source. Our approach advances this therapeutic strategy using photosensitizer-doped semiconducting polymer nanoparticles (SPNs), which are ideally suited to harness and amplify energy emitted from radionuclides due to their optical properties.
1. Introduction
Radiolabeled agents have been widely used for disease diagnosis and therapy, establishing the field of theranostics. Many radioisotopes used in biomedical applications emit Cerenkov radiation (CR), first described by physicist Pavel Cerenkov nearly 100 years ago. [1] CR is produced when charged particles emitted during the decay processes of radionuclides, such as beta (β) particles that include positrons (β+) and electrons (β-), travel faster than the phase velocity of light in a dielectric medium. [2] The molecules in the medium are polarized when the super-relativistic charged beta particles pass them. As the polarized molecules relax to equilibrium, Cerenkov luminescence (CL) in the ultraviolet-visible (UV-VIS) light range is emitted due to constructive interference (250–800 nm). [3] The intensity of CL is inversely proportional to the wavelength, such that it is highest at the UV-blue end of the spectrum. In biomedical applications, the medium is nearly always water or tissue, which dictates the kinetic energy threshold for CL. [3] While the Cerenkov phenomenon has been widely used in experimental particle physics, CL was only recently employed in biomedical applications for optical imaging of a radiotracer. [4] It has since been shown that CL is emitted from most biomedically relevant radionuclides, such as fluorine-18 (F-18), copper-64 (Cu-64), zirconium-89 (Zr-89), yttrium-90 (Y-90), gallium-68 (Ga-68), among several others. [5] Numerous subsequent studies have shown the utility of CL in diagnostic imaging. [6] While CL has been widely investigated for imaging purposes, [7] therapeutic strategies activated by CL, termed Cerenkov radiation-induced therapy (CRIT), have rarely been reported despite its potential as a cancer treatment strategy.
Nanomaterials are ideal candidates for CL-based applications due to their large optical cross-sections. Therapeutic opportunities using the CL-nanoparticle pairing are possible because the CL produced from radionuclides can be used as a light source for nanophotosensitizers. [8] By harnessing the emitted CL, nanomaterials can be activated to generate toxic reactive oxygen species (ROS). [9] Since radioisotopes are used as the light source, the tissue penetration limitation of visible/near-infrared light used for conventional photodynamic therapy (PDT) is eliminated. While a promising therapeutic strategy, CRIT strategies have been limited by the weak intensity and blue-weighted visible light emitted as CL.
Semiconducting polymer nanoparticles (SPNs) are novel nanomaterials because of their superior optical properties, photostability, and biocompatibility for biomedical applications. [10] SPNs are prepared from semiconducting polymers (SPs), which are hydrophobic polymers that are fluorescent owing to their π-electron delocalized backbones. [11] The typical preparation of SPNs involves collapsing the polymer chains by rapid transfer from an organic solvent to water under sonication, a process called nanoprecipitation. [12] SPNs have been widely used in a variety of biomedical applications, such as fluorescent and photoacoustic imaging, gene and drug delivery, cell tracking, biosensors, as well as photothermal and photodynamic therapies. [13] Due to the aforementioned advantages, SPNs may overcome the limitations of existing CRIT strategies.
Herein, we designed a nanoplatform based on SPNs doped with a photosensitizing fluorophore for amplified CRIT. Our design was found to be a highly effective cancer theranostic system because SPNs are ideally suited to maximize CL activation, with broad absorbance peaks centered in the most intense region (or the UV-blue end) of the CL spectrum, superior absorbance cross-section, and near-perfect energy transfer to the photosensitizers due to multiple energy transfer mechanisms. This design is a significant milestone for therapeutic strategies activated by CL by developing a nanosystem with ideal optical properties for amplified CRIT, which has tremendous potential as a cancer theranostics nanosystem that overcomes tissue penetration limits of conventional PDT.
2. Results and Discussion
Many studies have explored the interaction of CL with nanomaterials, such as gold nanoparticles, quantum dots, and titanium oxide nanoparticles, [14] which have since established radio-nanomedicine as a promising branch of nuclear medicine. CL is typically paired with fluorescent nanoparticles that redshift the blue-weighted CL spectrum for deeper tissue penetration, termed Cerenkov radiation energy transfer (CRET), or for CRIT activation of nanoparticles. These strategies offer inherent advantages such as decreased autofluorescence background, higher signal-to-noise ratio, and increased light penetration compared to using an external light source. [8] Many advantages for improved optical imaging using CRET have been established, but CRIT as a cancer therapy strategy remains relatively unexplored with tremendous potential. Nanoparticles are ideal for CRIT applications because their optical cross-sections are much higher than small-molecule photosensitizers. [9a] To be activated for CRIT, the radionuclide and nanomaterial must colocalize in vivo. CRIT activation can only occur when the radionuclide (energy donor) and nanomaterial (acceptor) are sufficiently close (less than 1 mm for most clinically used radioisotopes). [7] As such, the CL emitter can be i) delivered separately from the nanoparticle, ii) bound to the nanosystem surface using a chelator or prosthetic group, or iii) directly incorporated into the nanoparticle lattice by including the isotope during synthesis or by ionic exchange. [9a] Through proper design, efficient CRIT using nanomaterials can eliminate the superficial tissue penetration limits associated with external light sources used in conventional PDT. However, developed CRIT nanosystems have limitations, such as separate administration of nanomaterials and radionuclide or the need for external forces (e.g., magnetism). [14b, 15] Amplification of CL for efficient CRIT must be achieved using novel nanomaterials to overcome these limitations.
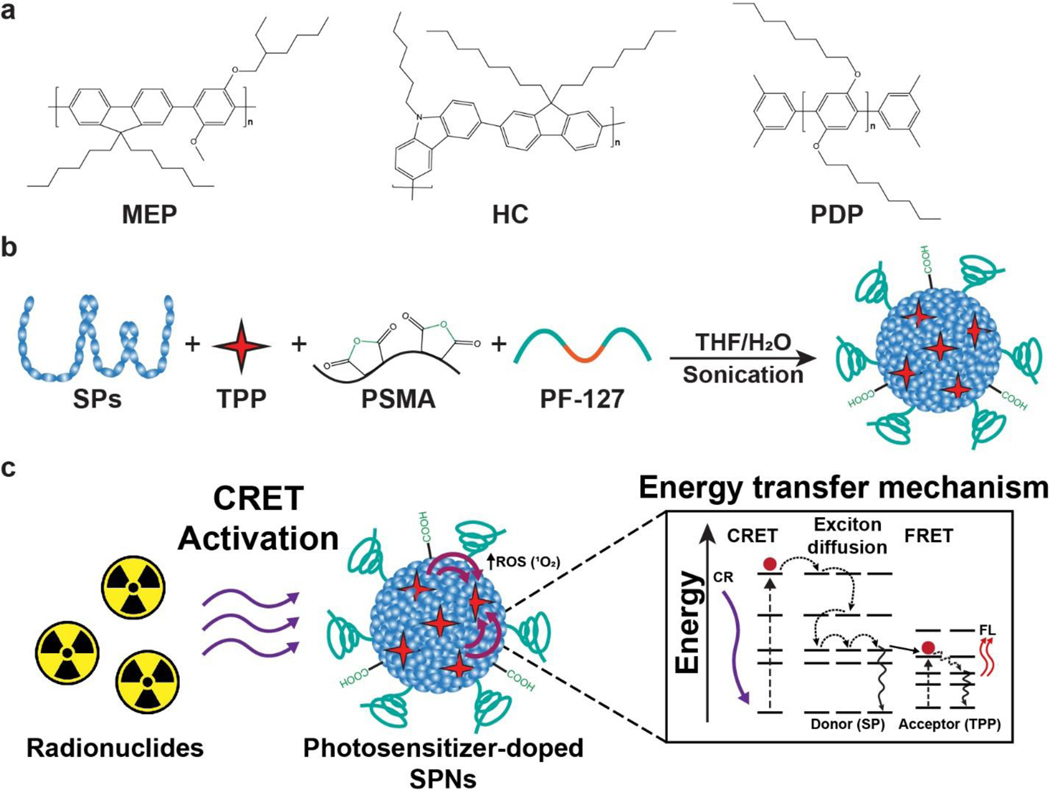
We designed a nanosystem for amplified CRIT using a photosensitizer doped SPNs. Three SPs were selected as candidates to determine an optimal nanosystem (Figure 1a). Importantly, all the SPs used had highly hydrophobic backbones with π-electron clouds, but their overall structure and molecular weights varied. Each SPs candidate had a broad absorbance peak centered in the 300–370 nm range with an intense fluorescence (FL) emission in the 400–450 nm range, which overlaps with absorbance of many photosensitizers (Figure S1). Moreover, semiconducting polymers varied in their molar absorbtivity, which determined to be approximately 3,400,000 M−1cm−1 (HC), 638,000 M−1cm−1 (PDP), and 3,650,000 M−1cm−1 (MEP). The photosensitizer meso-tetraphenylporphine (TPP) was selected since it has a peak absorbance (420 nm) that overlaps with the emission of all the selected SPs, emits red-shifted visible light for multimodal imaging, and generates singlet oxygen (1O2) for cancer therapy. Additionally, the amphiphilic triblock copolymer poly(ethylene glycol)-block-poly(propylene glycol)-block-poly(ethylene glycol) (PF-127) and poly(styrene-co-maleic anhydride) (PSMA) were included in the formulation to enhance nanoparticle circulation by reducing nonspecific uptake in the mononuclear phagocyte system and to provide functional groups for further functionalization, respectively (Figure 1b). [16] Energy transfer from a radionuclide will activate the photosensitizer in the SPNs formulation to initiate CRIT with enhanced efficiency (Figure 1c). The photophysical phenomena involved in the activation of dye doped SPNs are complex, composed of Förster energy transfer (FRET) and exciton diffusion (intra- and interchain photoexcitation transport). [17] Due to the multiple energy transfer mechanisms, the energy transfer in similar nanosystems has been reported to be highly efficient (>90%). [17–18] Moreover, other photosensitizer doped SPNs have been found to have singlet oxygen quantum efficiency of up to 50%. [17, 19] Due to these advantages, we hypothesize that SPNs doped with a fluorescent photosensitizer will be an excellent CRIT nanosystem.
Figure 1.
Semiconducting polymer nanoparticles (SPNs) harness and amplify Cerenkov luminescence for cancer theranostics. (a) Three semiconducting polymers (SPs) were selected as candidates to determine an optimal photosensitizer doped SPNs: MEP, HC, and PDP. (b) Photosensitizer doped SPNs were prepared using SPs, TPP, PSMA, and PF-127 in a nanoprecipitation process. (c) Schematic of energy transfer processes involved in Cerenkov radiation induced therapy using photosensitizer doped SPNs. The energy transfer phenomenon is a multi-step process that begins with Cerenkov radiation energy transfer (CRET) that activates the SP in the nanoparticle. Combinations of exciton diffusion within the SP and Förster resonance energy transfer (FRET) to the photosensitizer result in fluorescence emission from the dopant and reactive oxygen species (ROS) generation.
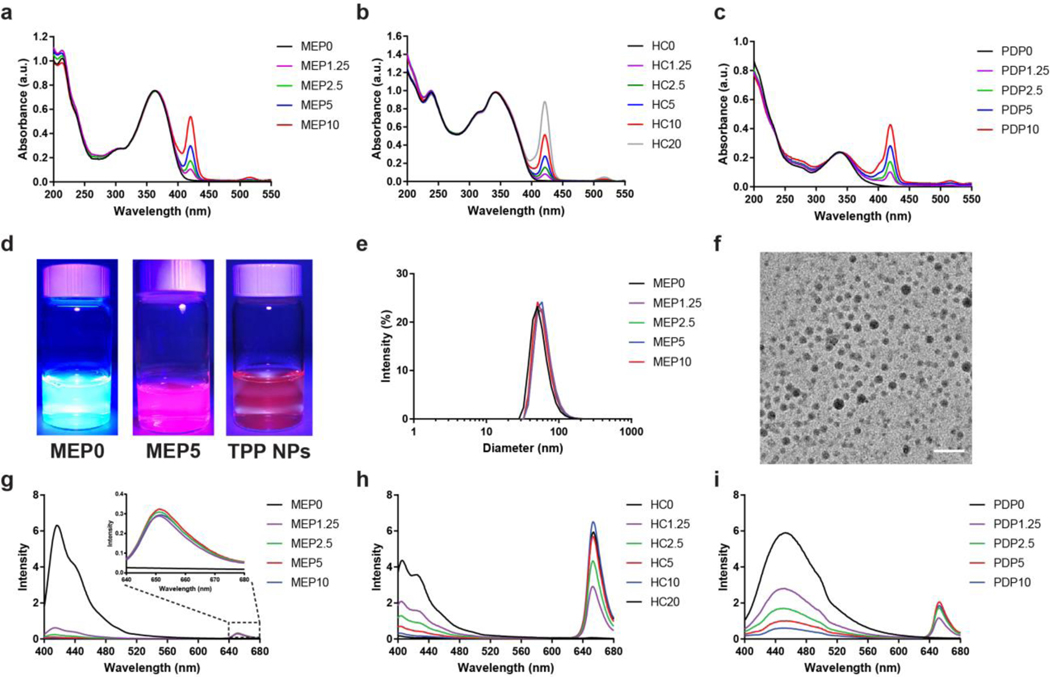
The photosensitizer doped SPNs were prepared using a nanoprecipitation method as described previously. [20] The TPP percentage in the SPNs, as indicated by the number following the SPs abbreviation, was controlled by varying the concentration in the initial THF solution, which was confirmed using UV-VIS spectroscopy (Figure 2a–c). For comparison to the photosensitizer alone, the same nanoprecipitation procedure was performed, but the SPs were omitted, thus creating TPP NPs. Using a FL light, the FL emission from the photosensitizer doped SPNs was much brighter compared to TPP NPs (Figure 2d). The hydrodynamic diameter of the SPNs was measured using dynamic light scattering (DLS) (Figure 2e; Figure S2). The particle size analysis found that MEP, HC, and PDP SPNs had approximate diameters in the range of 40–65 nm, which did not vary significantly with the TPP doping percentage. In comparison, TPP NPs had a hydrodynamic diameter of approximately 26 nm (Figure S3a). Transmission electron microscopy (TEM) imaging of a representative photosensitizer doped SPNs confirmed the diameter to be approximately 24 nm (Figure 2f; Figure S4). While the overall size of the nanosystems was comparable, structural differences in the SPs may vary the packing density and overall number of polymer molecules per nanoparticle and influence the physical properties of the nanosystem.[17, 21] Zeta potential measurements determined that the surface of the photosensitizer-doped SPNs was highly negatively charged (−31.6 ± 1.0 mV), attributed to surface carboxyl groups and polyethylene glycol (Figure S5a). In comparison, the surface zeta potential for TPP NPs was found to be −17.7 ± 1.5 mV (Figure S3b). FL spectroscopy was used to determine the optimal TPP doping percentage for each of the SPNs by exciting them at their respective peak excitation wavelength and measuring the emission spectra (Figure 2g–i; Figure S6). The FL from the SPs was increasingly quenched as additional TPP was added, indicating efficient energy transfer. Notably, MEP SPNs exhibited higher quenching efficiency (i.e., high quenching at low TPP percentages) than either PDP SPNs or HC SPNs. Differences in the apparent quenching efficiency between the nanosystem may be attributed to structural differences that influence packing densities and molar absorptivity of the SP utilized. The optimized TPP doping percentage was considered when the FL intensity from TPP at 650 nm reached a maximum. The optimized TPP doping percentages were found to be MEP5, HC10, and PDP5. Beyond these percentages, additional TPP decreases the FL intensity because of the formation of dye aggregates. [17] The three optimized TPP doped SPNs were then used in the following studies to investigate their interaction with CL.
Figure 2.
Characterization and optimal TPP doping percentage in semiconducting polymer nanoparticles (SPNs). UV-VIS spectra of (a) MEP, (b) HC, and (c) PDP photosensitizer doped SPNs. The number following the SPs abbreviation indicates TPP doping percentage weight fraction relative to the respective SPs during formation. (d) Photos comparing representative SPNs, photosensitizer doped SPNs, and TPP NPs under UV light (λex = 395 nm). (e) DLS size distribution and (f) TEM image characterizing the diameter of representative photosensitizer doped SPNs (scale = 100 nm). The optimal TPP doping percentage in (g) MEP, (h) HC, and (i) PDP SPNs was determined by the FL intensity of TPP after exciting the respective SPNs.
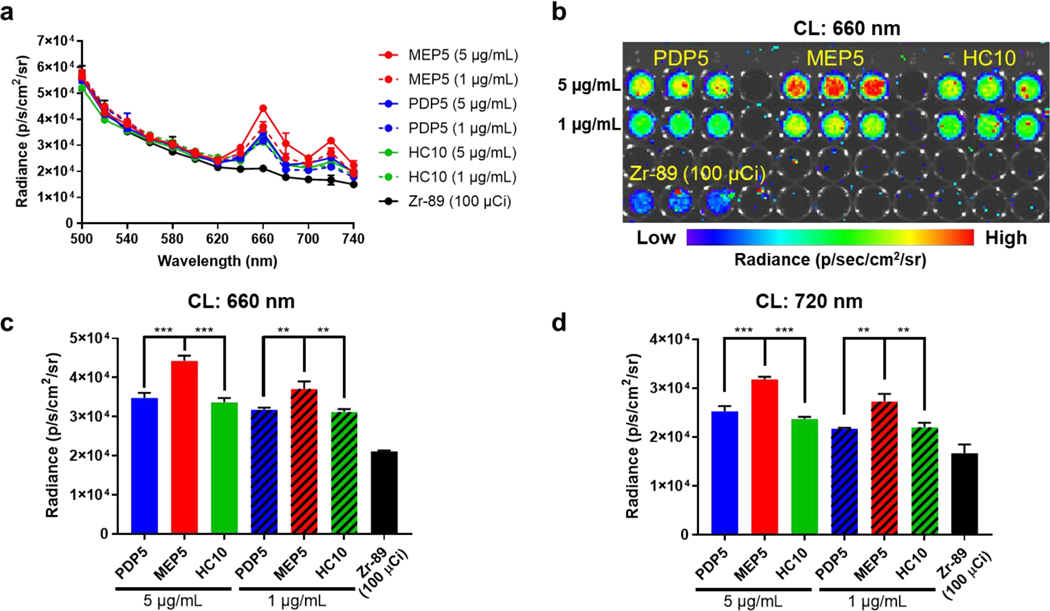
Radionuclide selection is critically important in CRIT applications, which depends on the type of energy emitted, the energy of emitted particles, and the half-life. [9a, 21] For example, Y-90 (Eβ-,avg=2,279 keV) or Ga-66 (Eβ+,max=4.15 MeV) produce CL with much higher intensity than F-18 (Eβ+,max=634 keV) or Cu-64 (Eβ+,max=653, Eβ-,max=579 keV). [22] The abundance of β particle emission during radionuclide decay will significantly impact the intensity of the CL spectrum. While the β particle energy of F-18 is much less than Zr-89 (Eβ+,max=902 keV), the CL intensity per activity is higher because the β+ abundance of the overall decay is much higher for F-18 (100%) compared with Zr-89 (22.7%). [22] The radioactive decay half-life of the isotope must also be considered. Due to the low intensity of CRIT compared to lasers used in conventional PDT, many applications will require prolonged radionuclide activation for effective CRIT. Factoring in these aspects, the interaction of CL with photosensitizer doped SPNs was investigated using both Zr-89 (t1/2=78.4 h, β+=22.7%, Eβ+,max=897) and Cu-64 (t1/2=12.7 h, β+=17.5%, β− = 38.5%, Eβ+,max=653, Eβ-,max=579 keV), which are both widely used in biomedical applications. [23] With the selection of Zr-89 and Cu-64 as the photoelectronic energy sources and the optimized SPNs formulations, their interactions through CL were evaluated. The CRET from each TPP doped SPNs was measured using IVIS when incubated with Zr-89 (Figure 3) or Cu-64 (Figure S7) and compared to the radioisotope alone. CRET measurements (excitation: closed, emission: 660 nm or excitation: closed, emission: 720 nm) showed that all TPP doped SPNs successfully amplified the CRET signal compared to the radionuclide alone at the TPP emission peaks. The intensity of CRET from each SPNs at equivalent TPP concentrations was compared to select the most efficient nanosystem. Using Zr-89 and Cu-64 for excitation, the CRET signal from MEP5 was the most intense and dependent upon concentration. Since MEP5 most dramatically amplified the CL signal through efficient energy transfer, it was selected for further investigation.
Figure 3.
Determining optimal SPNs nanosystem for CL amplification. (a) Zr-89 (100 μCi) was used to compare the CRET spectra of optimized TPP doped SPNs (MEP5, PDP5, and HC10) at equivalent TPP concentrations. (b) CRET images of optimized TPP doped SPNs at 660 nm, the most intense emission peak of TPP. The CRET intensity of MEP5, PDP5, and HC10 at (c) 660 nm and (d) 720 nm was used to determine the optimal TPP doped SPNs.
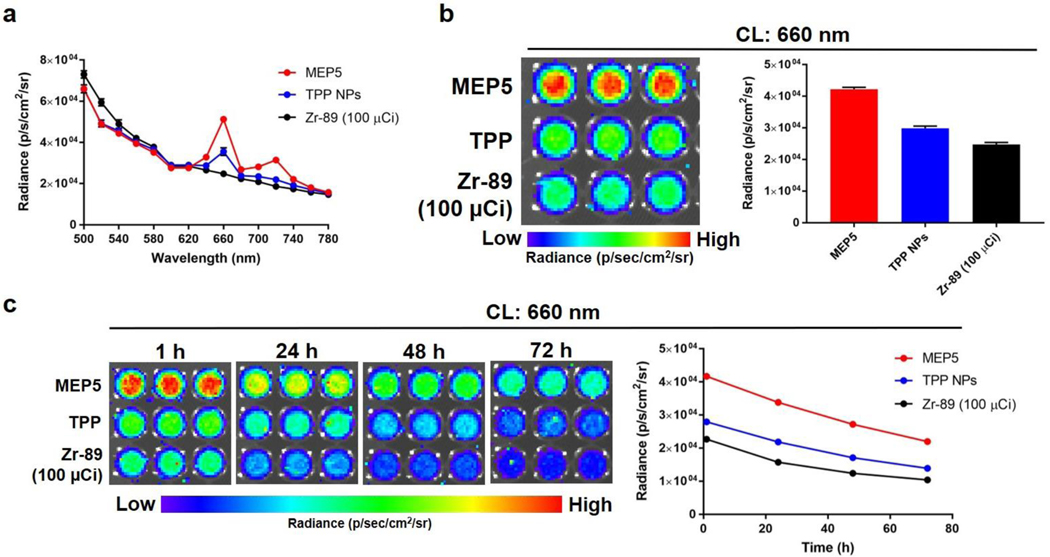
With MEP5 identified as the optimal TPP doped SPNs, we compared it to TPP NPs to determine the influence of SPs in the nanoparticle formulation on the CRIT efficiency using Zr-89 and Cu-64 (Figure 4; Figure S8). The CRET spectra following radionuclide activation were collected using the IVIS system and showed that MEP5 had higher FL emission from TPP at 660 nm and 720 nm than the TPP NPs. We also evaluated the CRET enhancement over 72 h of incubation, which showed increased FL intensity compared to TPP NPs at all time points and no significant quenching of MEP5. Due to their optical properties, our optimized SPNs harvest CL efficiently compared to nanosystems without semiconducting polymers.
Figure 4.
Evaluating the ability of MEP5 to amplify CL compared to TPP NPs. (a) CRET spectra of MEP5 and TPP NPs at equivalent TPP concentrations when activated by 100 μCi of Zr-89. (b) Comparison of CRET for MEP5 and TPP NPs at 660 nm, the FL emission peaks of TPP. (c) The CRET emission at 660 nm was compared for MEP5 and TPP NPs over 72 h.
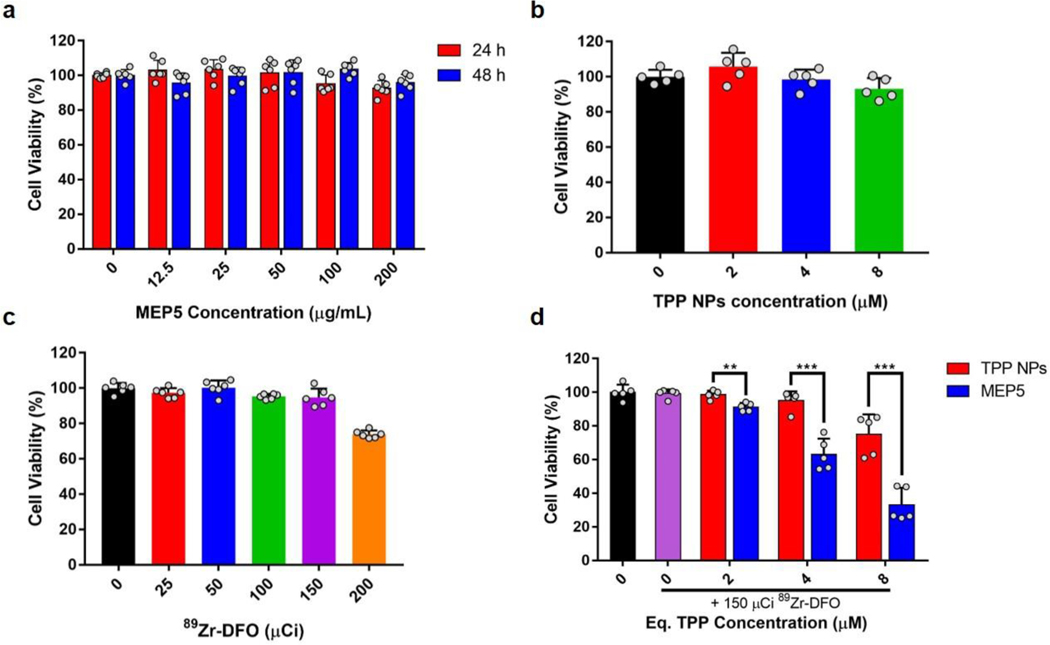
The cytotoxicity of MEP5 and TPP NPs was evaluated with an MTT assay using 4T1 cancer cells. No significant cytotoxicity was observed for MEP5 up to 200 μg/mL at either 24 or 48 h (Figure 5a). Equivalent concentrations of TPP NPs (up to 8 μM) also did not affect cell viability (Figure 5b). Zr-89 was used as the CL source to determine the effect of CRIT on cell viability by activating MEP5 or TPP NPs. Initial studies using 89Zr-oxalate had significant cell-killing effects at low activities (< 25 μCi) when diluted with HEPES buffer (not published). Zr-89 was radiolabeled with desferrioxamine (89Zr-DFO) and used for MEP5 or TPP NPs activation to limit radionuclide-associated toxicity. The in vitro toxicity of 89Zr-DFO on 4T1 cells was evaluated at various activities (Figure 5c). The viability of 4T1 cells was not affected up to 150 μCi, but slight toxicity was observed at higher activity levels. The IC50 value of 89Zr-DFO-MEP5 was calculated to be 4.4 μM. As such, 150 μCi of 89Zr-DFO was used to evaluate the CRIT efficacy of MEP5 and TPP NPs (Figure 5d). Significantly increased cell killing was observed for MEP5 compared to TPP NPs at equivalent TPP concentrations. Thus, CRIT efficacy was enhanced considerably by including SPNs into the nanosystem formulation.
Figure 5.
Cytotoxicity and in vitro CRIT efficacy of MEP5 and TPP NPs. Cell viability of 4T1 cancer cells was measured by adding (a) MEP5, (b) TPP NPs, or (c) 89Zr-DFO to the culture media at various concentrations or radioactivity levels. (d) CRIT efficacy of MEP5 and TPP NPs was compared at equivalent TPP concentrations when activated by 150 μCi of Zr-89.
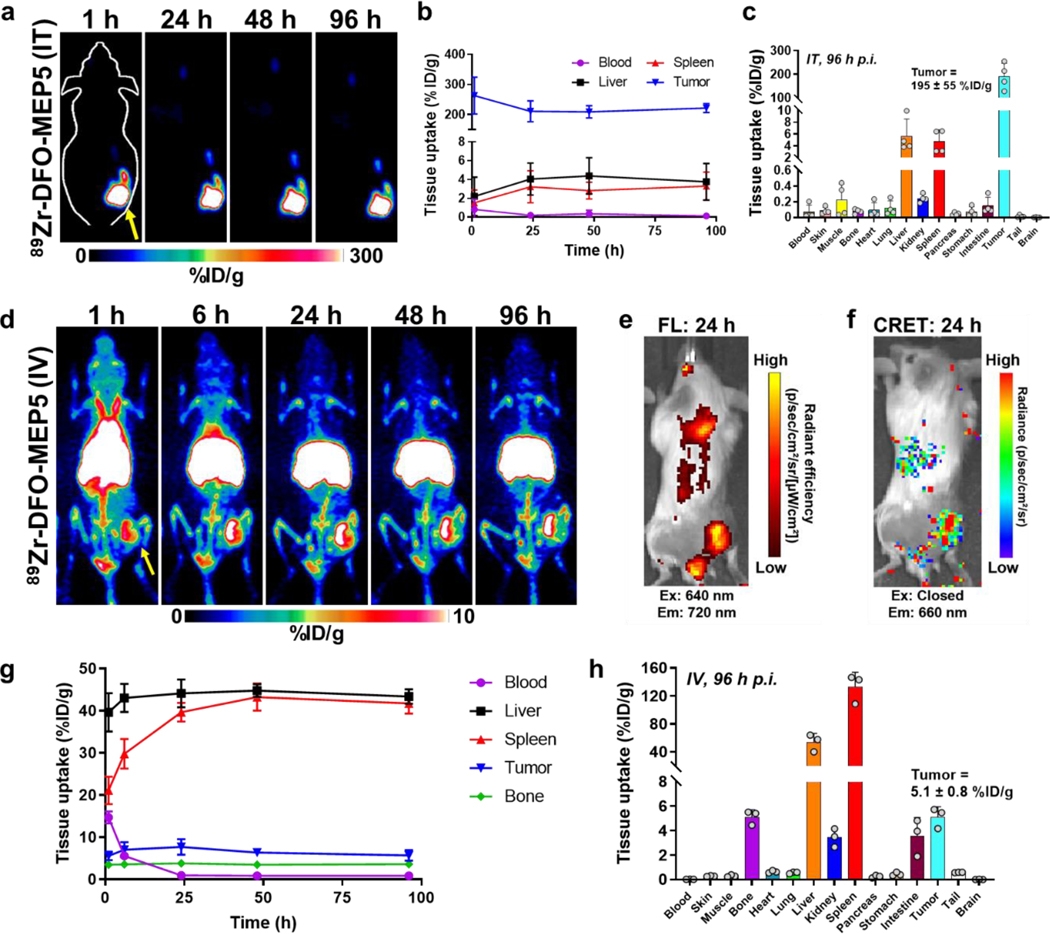
Encouraged by the increased CRET and CRIT efficiency of MEP5 compared to TPP NPs, PET imaging assessed its potential as a theranostic agent (Figure 6). To ensure the radionuclide and nanomaterial colocalize in vivo, DFO was conjugated to carboxyl groups on the surface of MEP5 formed through the hydrolysis of anhydride groups on PSMA (DFO-MEP5). [24] DFO conjugation did not influence nanoparticle diameter as measured by DLS, which was found to be approximately 65 nm. (Figure S9). The surface charge of DFO-MEP5 slightly increased after conjugation (−25.9 ± 1.2 mV; Figure S5b). Radiolabeling DFO-MEP5 with Zr-89 (89Zr-DFO-MEP5) had an efficiency of 88.8 ± 1.6 % (n=3; Figure S10). 89Zr-DFO-MEP5 was intratumorally or intravenously injected into Balb/c mice bearing subcutaneous 4T1 tumors and tracked by serial PET imaging up to 96 h post-injection (p.i.). PET imaging of intratumorally (I.T.) injected 89Zr-DFO-MEP5 showed high and sustained tumor uptake, and minimal uptake in other tissues. Quantification of the uptake by regions-of-interest (ROIs) analysis showed prominent tumor uptake that peaked at 1 h p.i. (263 ± 61 %ID/g), with little leakage into the blood pool, liver, or spleen up to 96 h p.i. (all uptake < 5 %ID/g). Ex vivo biodistribution studies following the final imaging timepoint further confirmed uptake of 89Zr-DFO-MEP5 following I.T. administration remained in the tumor (195 ± 55 %ID/g) compared to other tissues (< 10 %ID/g).
Figure 6.
In vivo imaging of semiconducting polymer nanoparticles (SPNs). PET imaging studies using Balb/c mice implanted with subcutaneous 4T1 tumors investigated the biodistribution of 89Zr-DFO-MEP5. (a) PET images following intratumor (IT) administration of 89Zr-DFO-MEP5. (b) ROI analysis was performed to quantify 89Zr-DFO-MEP5 in major organs of interest following IT delivery (n=4). (c) Ex vivo biodistribution studies in 4T1 tumor bearing mice at 96 h p.i. (n=4). (d) Additional PET studies investigated the biodistribution of 89Zr-DFO-MEP5 following intravenous (IV) administration. (e) FL and (f) CRET images confirmed tumor uptake of 89Zr-DFO-MEP5 and in vivo activation of MEP5 using Zr-89. (g) ROI analysis was performed to quantify 89Zr-DFO-MEP5 in major organs of interest following IV delivery (n=3). (h) Ex vivo biodistribution studies in 4T1 tumor bearing mice at 96 h p.i. (n=3).
As another administration route, PET imaging was performed for intravenously (I.V.) administered 89Zr-DFO-MEP5. Following I.V. administration, 89Zr-DFO-MEP5 showed uptake in the blood pool up to 6 h p.i. and tumor uptake was delineated as rapidly as 1 h p.i., with uptake attributed to the enhanced permeability and retention (EPR) effect. The nonspecific uptake of 89Zr-DFO-MEP5 in the reticuloendothelial system (RES) was prominent, most likely due to the hydrophobic nature of the SPs and TPP, overall negative charge, and size. [13] Due to the FL properties of TPP included in MEP5, PET imaging could be correlated using optical imaging. Excitation of TPP (ex: 640 nm, em: 720 nm) incorporated in MEP5 confirmed uptake of 89Zr-DFO-MEP5 in the tumor. Additionally, Zr-89 activation of MEP5 in vivo was investigated by measuring the CRET (ex: closed, em: 660 nm) based on the luminescence produced from TPP excitation. Notably, the CRET signal from 89Zr-DFO-MEP5 was evident in the tumor and correlated with FL signal.
The uptake of 89Zr-DFO-MEP5 in the major organs (blood, liver, spleen, kidney, and bone) throughout the PET imaging study was analyzed by quantifying ROIs (Figure 6d). The circulation half-life was calculated to be 3.22 ± 0.02 h, which is relatively long for nanomaterials. The tumor uptake reached a maximum of 7.7 ± 1.8 %ID/g at 24 h p.i., which decreased slightly to 5.7 1.3 %ID/g at the final time point of 96 h p.i. Significant uptake of 89Zr-DFO-MEP5 was observed in the liver and spleen, which reached maximums of 44.8 ± 1.5 %ID/g and 43.2 ± 3.2 %ID/g at 48 h p.i., respectively. Following the last PET scan at 96 h, the mice were euthanized for ex vivo biodistribution studies (Figure 6h). The major organs of the mouse were collected, and the activity was measured using a gamma counter for comparison to ROIs. The ex vivo tumor uptake of 89Zr-DFO-MEP5 was determined to be 5.1 ± 0.8 %ID/g, in agreement with the image quantification. The liver and spleen had prominent 89Zr-DFO-MEP5 uptake, which was determined to be 53.9 ± 12.4 %ID/g and 132.7 ± 21.0 %ID/g, respectively. The drastic difference between ROI analysis and ex vivo quantification of the spleen is likely due to partial volume effects stemming from its small size in mice. [25] Overall, high tumor uptake of 89Zr-DFO-MEP5 was apparent following I.T. and I.V. injection in these PET studies. Both routes of administration may be suitable as options in therapeutic studies.
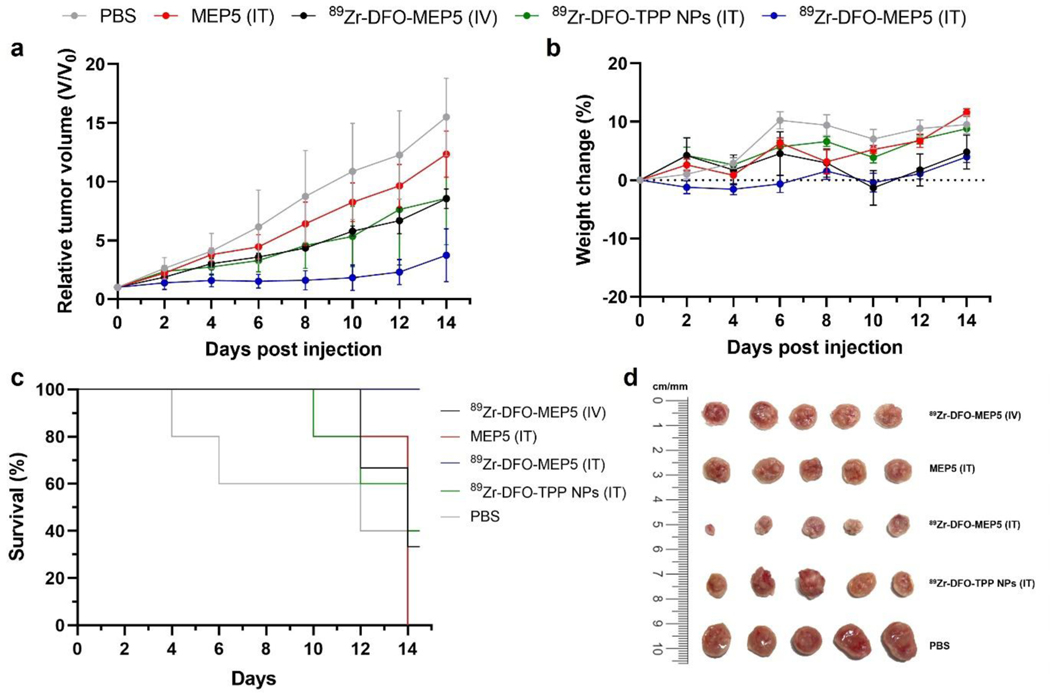
Encouraged by the promising in vivo imaging studies, the therapeutic potential of MEP5 was evaluated in a 4T1 tumor model. Mice were treated with 89Zr-DFO-MEP5 via I.V. injection as well as PBS, MEP5, 89Zr-DFO-MEP5, and 89Zr-DFO-TPP NPs via I.T. administration. Tumor volume and body weight of mice were monitored regularly over 14 days after treatments. Remarkably, I.T. treatment with 89Zr-DFO-MEP5 induced significant inhibitory effects on tumor growth (Figure 7a), whereas the other groups showed obvious tumor progression post treatments. The control groups (i.e., PBS and non-radiolabeled SPNs) exhibited rampant and unhindered tumor growth. Importantly, I.T. with 89Zr-DFO-MEP5 suppressed the growth more effectively compared to 89Zr-DFO-TPP NPs. Notably, the tumor volume curves were not statistically significantly different between I.V. with 89Zr-DFO-MEP5 and I.T. with 89Zr-DFO-TPP NPs groups. The lower therapeutic efficacy of 89Zr-DFO-MEP5 in this case may be due to the lower tumor uptake from I.V. administration. Moreover, no significant weight loss was observed in any group over the observation period (Figure 7b), indicating minimal treatment toxicities. In addition, I.T. with 89Zr-DFO-MEP5 significantly improved the survival of mice (100%), as none of them met the criterion for sacrifice, while all other groups had reduced survival (PBS: 0%, MEP5: 0%, 89Zr-DFO-TPP NPs: 40%, 89Zr-DFO-MEP5 (IV): 33%) by the end of the study (Figure 7c). Ex vivo tumor photographs and weights were recorded at the conclusion of the study (Figure 7d; Figure S11). Consistent with the in vivo results, I.T. with 89Zr-DFO-MEP5 demonstrated high antitumor effect with the smallest size and lowest average tumor weight among all groups. The tumor weight of 89Zr-DFO-MEP5 was found to be statistically significantly lower than that of I.T. with 89Zr-DFO-TPP NPs. Overall, our findings suggest that 89Zr-DFO-MEP5 can greatly improve the therapeutic outcome of CRIT (or PDT) due to amplified CL and enhanced CRET without inducing any adverse side effects.
Figure 7.
Cerenkov radiation induced therapy mediated by radionuclide activated SPNs. (a) Therapeutic response was monitored by measuring the relative tumor volume in Balb/c mice bearing 4T1 tumors (n=3–5). Study treatment groups were PBS, MEP5 (IT), 89Zr-DFO-MEP5 (IV), 89Zr-DFO-TPP NPs (IT), and 89Zr-DFO-MEP5 (IT). (b) Body weights were measured to evaluate treatment toxicity. (c) Kaplan-Meier curves demonstrating animal survival for 14 days after treatment. (d) Photograph of tumors extracted from the mice at the end of the study.
3. Conclusion
CR can be used as an excitation source for nanophotosensitizer activation but is limited by the weak intensity of this light produced by radionuclides. We found that the CRET efficiency was significantly enhanced by using photosensitizer doped SPNs compared to the photosensitizer alone. Multimodal imaging studies showed tumor uptake of photosensitizer doped SPNs. Due to this, the CRIT efficacy was improved in vitro and in vivo. Photosensitizer doped SPNs can efficiently harness and amplify CR for CRET and CRIT applications, which can overcome tissue penetration limits associated with traditional PDT, thus presenting immense potential as a cancer theranostics nanosystem.
4. Experimental section
Materials.
Poly[2,5-dioctyl-1,4-phenylene] capped with dimethylphenyl (PDP; MW = 5,000–20,000) and poly[(9,9-dihexylfluorenyl-2,7-diyl)-alt-co-(2-methoxy-5-{2-ethylhexyloxy}−1,4-phenylene)] (MEP; MW = 15,000–75,000) were purchased from ADS Dyes (Quebec, Canada). Poly[(9,9-dioctylfluorenyl-2,7-diyl)-alt-(9-hexyl-3,6-carbazole)] (HC; MW = 10,000–50,000) was purchased from Lumtec (New Taipei City, Taiwan). Meso-tetraphenylporphine was purchased from Frontier Scientific (Logan, UT). Sulfo-NHS was purchased from Thermo Scientific (Waltham, MA). Pluronic F-127 (PF-127), Poly(styrene-co-maleic anhydride) (PSMA), Deferoxamine mesylate (DFO), N-(3-Dimethylaminopropyl)-N’-ethylcarbodiiamide hydrochloride (EDC), and anhydrous tetrahydrofuran (THF) were purchased from Sigma Aldrich (St. Louis, MO). All reagents were used without any purification.
Characterization.
Ultraviolet-visible light spectroscopy (UV-Vis) measurements were recorded on an Agilent Cary 60 spectrophotometer. Dynamic light scattering (DLS) and zeta-potential measurements were performed on a Zetasizer (Malvern Instruments Ltd.). FL plate measurements were taken on a ClarioStar plate reader (BMG labtech). A Hitachi F-3010 fluorescence spectrophotometer was used to record fluorescence spectra. Transmission electron microscopy (TEM) images were taken using a FEI Tecnai T12 microscope with an accelerating voltage of 120 kV.
Preparation of SPNs.
SPNs were prepared using the commercially available SPs (PDP, HC, and MEP) using methods previously described. [26] Briefly, SPs, PF-127, and PSMA were dissolved in THF to final concentrations of 400 μg/mL, 8 mg/mL, and 40 μg/mL. Additionally, TPP was doped into the SPNs formulation at various concentrations up to 40 μg/mL, based on the weight fraction relative to the SPs. SPNs were formed by injecting 1 mL of the THF solution into 11 mL of double distilled water under ultrasonication for 2 min. THF was removed from the solution by evaporation overnight. Lastly, the SPNs were purified by filtration with a 0.22 μm filter and washed three times using ultrafiltration at 4˚C.
Determining optimal TPP doping percentage.
Fluorescence spectroscopy was used to determine the optimized TPP doping for each SPNs nanosystem. Each of the SPNs doped with TPP up to 20% (by weight) of the SPs concentration. These formulations were excited at the peak excitation wavelength of the SPNs, and their emission spectra were collected. The optimal doping percentage was determined as the formulation that yielded the maximum FL intensity from TPP at 650 nm. Additionally, the FL measurements were confirmed using a FL plate reader.
Determining an optimal CRET nanosystem.
Zr-89 was used as a photoelectronic energy source to evaluate the interactions of the SPNs nanosystems with CL. An IVIS spectrum in vivo imaging system was used to characterize CRET efficiency. Using an in vivo imaging system (IVIS), the CL spectra and CRET at the peaks of TPP (660 nm, 720 nm) were measured for the optimized TPP doped SPNs when incubated with Zr-89 or Cu-64. Free radioisotope was used for comparison for all TPP doped SPNs. The optimized TPP doped SPNs (MEP5) were compared to TPP NPs (without SPs) to confirm the enhancement of CRET.
Cell culture.
Cell studies were performed using 4T1 cancer cells. 4T1 cells were cultured using Roswell Park Memorial Institute 1640 (RMPI-1640) media supplemented with 10% fetal bovine serum (FBS) and 1% penicillin/streptomycin. Cells were grown on 75 cm2 flasks (Corning) and incubated at 37°C and 5% CO2
Cytotoxicity assessment.
The cytotoxicity of MEP5 and TPP NPs was determined using a 2-(4,5-dimethyl-2-thiazolyl)-3,5-diphenyl-2H-tetrazolium, monobromide (MTT) assay. 4T1 cancer cells were seeded in a 96 well plate at a density of 5×10³ cells/well when cultured for 24 h or 3×10³ cells/well when culture for 48 h at 37°C and 5% CO2. Culture media with various concentrations of MEP5 or an equivalent concentration of TPP NPs (based on TPP) were added to the cells. Cell viability was measured after 24 h or 48 h of incubating MEP5 or TPP NPs with 4T1 cells. Cells treated with PBS were used as a control and fixed as 100% cell viability.
CRIT efficacy assessment.
An MTT assay was used to evaluate the in vitro CRIT efficacy when using 89Zr-DFO as an energy source for MEP5. The enhancement of CRIT efficacy was confirmed using TPP NPs at equivalent TPP concentrations. Cells treated with 89Zr-DFO, 89Zr-DFO + MEP5, or 89Zr-DFO + TPP had their viability normalized to cells treated with PBS as a control. Cells incubated with 89Zr-DFO were used to confirm that CRIT is specific to Zr-89 activation of MEP5. The cell viability was measured using the MTT assay at 24 h after adding the sample to the 4T1 cell culture media.
DFO conjugation to MEP5.
DFO was conjugated using carbodiimide chemistry to carboxyl groups on the surface of MEP5 formed through hydrolysis of anhydride groups on PSMA for PET imaging studies. The reaction was initiated by activating the carboxyl groups on MEP5 by adding EDC and sulfo-NHS and adjusting the pH to ~5 using 0.5 M HCl (ratio of -COOH to EDC to sulfo-NHS was 1:5:5) for 30 min. Subsequently, DFO was added to the reaction (-COOH to DFO was 1:1), and the pH was adjusted to ~ 7 using 0.5 M NaOH. Following an overnight reaction, the SPNs were purified by filtration with a 0.22 μm filter and washed three times using ultrafiltration at 4˚C.
Radiolabeling of DFO and DFO-MEP5.
Zr-89 was chosen as the radionuclide for PET imaging because of its long half-life for prolonged in vivo tracking. In a radiolabeling reaction, 200 μg of DFO-MEP5 was added to 1 mCi (37 MBq) of 89Zr-oxalate in 1 M HEPES. The reaction was conducted at 50˚C for 1 h. Free Zr-89 was removed using a PD-10 desalting column (GE Healthcare). Radiolabeling yield of Zr-89 was determined using an autoradiograph of a thin layer chromatography (TLC) plate.
Animal studies.
All animal studies were conducted under protocol #M005630 approved by the Institutional Animal Care and Use Committee at the University of Wisconsin-Madison. Balb/c mice were purchased from Envigo.
Tumor model.
A subcutaneous 4T1 tumor model was established using 5–6 weeks old Balb/c mice. 4T1 cancer cells were cultured to 70% confluency and then implanted subcutaneously in PBS (~5×10⁵ cells/mouse). Tumor volume was measured calculated as (1/2) x length x width2. Mice were used for PET/CT imaging studies once tumors reached 150–200 mm3. Mice were used for therapy studies once tumors reached 50–100 mm3.
PET imaging of 89Zr-DFO-MEP5.
PET imaging was performed using an Inveon μPET/CT small animal imaging system. After radiolabeling with Zr-89, the in vivo biodistribution of 89Zr-DFO-MEP5 was investigated using PET imaging following intravenous tail vein injection. Serial PET images were taken at various times post-injection (p.i.) (1 h, 6 h, 24 h, 48 h, and 96 h). PET images were reconstructed using the OSEM3D/MAP algorithm. Regions of interest (ROIs) were quantified using the Inveon Research Workstation software. Results were calculated as percent injected dose per gram of tissue (%ID/g). Following the last PET scan at 96 h p.i., mice were euthanized and radioactivity in the major organs was determined once collected for ex vivo biodistribution studies.
In vivo therapy studies.
Mice were randomized prior to beginning therapy studies. Groups used to evaluate CRIT were PBS (IT), MEP5 (IT), 89Zr-DFO-MEP5 (IT and IV) and 89Zr-DFO-TPP NPs (IT). I.T. injections were given in 20 – 50 μL with radioactive doses of 50–110 μCi (1.85–4.07 MBq). I.V. injections were given in 100 – 200 μL with radioactive doses of ~200 μCi (7.4 MBq). Tumor volumes were measured by calipers every other day over a 14 day therapy study. Tumor volumes were reported as relative tumor volume (V/V0) where V0 represents the initial tumor volume and V is the tumor volume at the time measured. Toxicity associated with therapies were monitored by measuring body weight. Animals with tumor length or width surpassing 10.5 mm at any given time were considered non-surviving. Following the end of the therapy study, mice were euthanized and tumor tissues were photographed and harvested for weighing.
Statistical Analysis.
Statistical comparison was performed using a Student’s two-tailed t-test for two groups or one-way ANOVA with Tukey’s honest significant difference post-hoc test for three or more groups. Quantitative data are expressed as mean ± standard deviation. Significance is indicated with probability values (P): P < 0.05 (*), P < 0.01 (**), P < 0.001 (***), or P < 0.0001 (***).
Supplementary Material
Acknowledgements
Z.T.R. and J.C.H. contributed equally to this work. This work was supported, in part, by the University of Wisconsin-Madison, the National Institutes of Health (P30CA014520). The authors wish to acknowledge the Small Animal Imaging and Radiotherapy (SAIRF) facility at UW-Madison maintaining facilities for acquiring PET/CT, including support through the Cancer Center Support Grant NCI P30CA014520. The authors wish to acknowledge the Analytical Instrumentation Center of the School of Pharmacy, UW-Madison, for support in obtaining spectrophotometric data as well as the use of facilities and instrumentation supported by NSF through the University of Wisconsin Materials Research Science and Engineering Center (DMR-1720415). Research reported in this publication was supported by the National Cancer Institute of the National Institutes of Health under Award Number T32CA009206. The content is solely the responsibility of the authors and does not necessarily represent the official views of the National Institutes of Health. Research reported in this publication was supported by the Society of Nuclear Medicine and Molecular Imaging by the Bradley-Alavi Student Fellowship.
Footnotes
Supporting Information
Supporting Information is available from the Wiley Online Library or from the author.
Conflict of Interest
Weibo Cai declares conflict of interest with the following corporations: Actithera, Inc., Rad Source Technologies, Inc., Portrai, Inc., rTR Technovation Corporation, and Four Health Global Pharmaceuticals, Inc. All other authors declare no conflict of interest.
Contributor Information
Zachary T Rosenkrans, University of Wisconsin-Madison, Department of Pharmaceutical Sciences, 600 Highland Ave., K6/562, Madison, WI 53792, USA.
Jessica C. Hsu, University of Wisconsin-Madison, Departments of Radiology and Medical Physics, Madison, WI 53705, USA
Eduardo Aluicio-Sarduy, University of Wisconsin-Madison, Departments of Radiology and Medical Physics, Madison, WI 53705, USA.
Todd E. Barnhart, University of Wisconsin-Madison, Departments of Radiology and Medical Physics, Madison, WI 53705, USA
Jonathan W. Engle, University of Wisconsin-Madison, Departments of Radiology and Medical Physics, Madison, WI 53705, USA University of Wisconsin-Madison, Carbone Cancer Center, Madison, WI 53705, USA.
Weibo Cai, University of Wisconsin-Madison, Department of Pharmaceutical Sciences, 600 Highland Ave., K6/562, Madison, WI 53792, USA; University of Wisconsin-Madison, Departments of Radiology and Medical Physics, Madison, WI 53705, USA; University of Wisconsin-Madison, Carbone Cancer Center, Madison, WI 53705, USA.
Data Availability Statement
The data that support the findings of this study are available from the corresponding author upon reasonable request.
References
- [1].Cerenkov P, (Dokl.) CR Acad. Sci URSS. 1934, 2, 451. [Google Scholar]
- [2].Jelley J, Br. J. Appl. Phys. 1955, 6, 227. [Google Scholar]
- [3].Ciarrocchi E, Belcari N, EJNMMI Phys. 2017, 4, 14. [DOI] [PMC free article] [PubMed] [Google Scholar]
- [4].Robertson R, Germanos MS, Li C, Mitchell GS, Cherry SR, Silva MD, Phys. Med. Biol. 2009, 54, N355. [DOI] [PMC free article] [PubMed] [Google Scholar]
- [5].a) Xu Y, Liu H, Cheng Z, J. Nucl. Med. 2011, 52, 2009; [DOI] [PubMed] [Google Scholar]; b) Madru R, Tran TA, Axelsson J, Ingvar C, Bibic A, Ståhlberg F, Knutsson L, Strand S-E, Am. J. Nucl. Med. Mol. Imaging 2013, 4, 60. [PMC free article] [PubMed] [Google Scholar]
- [6].Thorek DL, Robertson R, Bacchus WA, Hahn J, Rothberg J, Beattie BJ, Grimm J, Am. J. Nucl. Med. Mol. Imaging 2012, 2, 163. [PMC free article] [PubMed] [Google Scholar]
- [7].Mitchell GS, Gill RK, Boucher DL, Li C, Cherry SR, Philos. Trans. R. Soc., A 2011, 369, 4605. [DOI] [PMC free article] [PubMed] [Google Scholar]
- [8].Ferreira CA, Ni D, Rosenkrans ZT, Cai W, Angew. Chem., Int. Ed. 2019, 58, 13232. [DOI] [PMC free article] [PubMed] [Google Scholar]
- [9].a) Shaffer TM, Pratt EC, Grimm J, Nat. Nanotechnol. 2017, 12, 106; [DOI] [PMC free article] [PubMed] [Google Scholar]; b) Zheleznyak A, Mixdorf M, Marsala L, Prior J, Yang X, Cui G, Xu B, Fletcher S, Fontana F, Lanza G, Achilefu S, Theranostics 2021, 11, 7735. [DOI] [PMC free article] [PubMed] [Google Scholar]
- [10].Wu C, Chiu DT, Angew. Chem., Int. Ed. 2013, 52, 3086. [DOI] [PMC free article] [PubMed] [Google Scholar]
- [11].Zhu C, Liu L, Yang Q, Lv F, Wang S, Chem. Rev. 2012, 112, 4687. [DOI] [PubMed] [Google Scholar]
- [12].Howes P, Green M, Levitt J, Suhling K, Hughes M, J. Am. Chem. Soc. 2010, 132, 3989. [DOI] [PubMed] [Google Scholar]
- [13].a) Li J, Rao J, Pu K, Biomaterials 2018, 155, 217; [DOI] [PMC free article] [PubMed] [Google Scholar]; b) Pu K, Chattopadhyay N, Rao J, J. Controlled Release 2016, 240, 312. [DOI] [PMC free article] [PubMed] [Google Scholar]
- [14].a) Thorek DLJ, Ogirala A, Beattie BJ, Grimm J, Nat. Med. 2013, 19, 1345; [DOI] [PMC free article] [PubMed] [Google Scholar]; b) Kotagiri N, Sudlow GP, Akers WJ, Achilefu S, Nat. Nanotechnol. 2015, 10, 370; [DOI] [PMC free article] [PubMed] [Google Scholar]; c) Sun X, Huang X, Guo J, Zhu W, Ding Y, Niu G, Wang A, Kiesewetter DO, Wang ZL, Sun S, Chen X. J. Am. Chem. Soc. 2014, 136, 1706. [DOI] [PMC free article] [PubMed] [Google Scholar]
- [15].a) Kotagiri N, Cooper ML, Rettig M, Egbulefu C, Prior J, Cui G, Karmakar P, Zhou M, Yang X, Sudlow G, Marsala L, Chanswangphuwana C, Lu L, Habimana-Griffin L, Shokeen M, Xu X, Weilbaecher K, Tomasson M, Lanza G, DiPersio JF, Achilefu S, Nat. Commun. 2018, 9, 275; [DOI] [PMC free article] [PubMed] [Google Scholar]; b) Kamkaew A, Cheng L, Goel S, Valdovinos HF, Barnhart TE, Liu Z, Cai W, ACS Appl. Mater. Interfaces 2016, 8, 26630; [DOI] [PMC free article] [PubMed] [Google Scholar]; c) Ni D, Ferreira CA, Barnhart TE, Quach V, Yu B, Jiang D, Wei W, Liu H, Engle JW, Hu P, Cai W, J. Am. Chem. Soc. 2018, 140, 14971; [DOI] [PMC free article] [PubMed] [Google Scholar]; d) Guo R, Jiang D, Gai Y, Qian R, Zhu Z, Gao Y, Jing B, Yang B, Lan X, An R, Eur. J. Nucl. Med. Mol. Imaging 2023, 50, 508. [DOI] [PubMed] [Google Scholar]
- [16].Suk JS, Xu Q, Kim N, Hanes J, Ensign LM, Adv. Drug Delivery Rev. 2016, 99, 28. [DOI] [PMC free article] [PubMed] [Google Scholar]
- [17].Wu C, Zheng Y, Szymanski C, McNeill J, J. Phys. Chem. C 2008, 112, 1772. [DOI] [PMC free article] [PubMed] [Google Scholar]
- [18].a) Miao Q, Xie C, Zhen X, Lyu Y, Duan H, Liu X, Jokerst JV, Pu K, Nat. Biotechnol. 2017, 35, 1102; [DOI] [PubMed] [Google Scholar]; b) Wu C, Bull B, Szymanski C, Christensen K, McNeill J, ACS Nano 2008, 2, 2415. [DOI] [PMC free article] [PubMed] [Google Scholar]
- [19].Grimland JL, Wu C, Ramoutar RR, Brumaghim JL, McNeill J, Nanoscale 2011, 3, 1451. [DOI] [PubMed] [Google Scholar]
- [20].Szymanski C, Wu C, Hooper J, Salazar MA, Perdomo A, Dukes A, McNeill J, The J Phys. Chem. B 2005, 109, 8543. [DOI] [PubMed] [Google Scholar]
- [21].Pratt EC, Shaffer TM, Zhang Q, Drain CM, Grimm J, Nat. Nanotechnol. 2018, 13, 418. [DOI] [PMC free article] [PubMed] [Google Scholar]
- [22].National Nuclear Data Center, 2019.
- [23].a) Wei W, Rosenkrans ZT, Liu J, Huang G, Luo Q-Y, Cai W, Chem. Rev. 2020, 120, 3787; [DOI] [PMC free article] [PubMed] [Google Scholar]; b) Anderson CJ, Ferdani R, Cancer Biother. Radiopharm. 2009, 24, 379; [DOI] [PMC free article] [PubMed] [Google Scholar]; c) Yin Z, Hao H, Weibo C, Curr. Radiopharm. 2011, 4, 131.22191652 [Google Scholar]
- [24].Yu J, Wu C, Zhang X, Ye F, Gallina ME, Rong Y, Wu I-C, Sun W, Chan Y-H, Chiu DT, Adv. Mater. 2012, 24, 3498. [DOI] [PMC free article] [PubMed] [Google Scholar]
- [25].Soret M, Bacharach SL, Buvat I, J. Nucl. Med. 2007, 48, 932. [DOI] [PubMed] [Google Scholar]
- [26].a) Wu C, Szymanski C, McNeill J, Langmuir 2006, 22, 2956; [DOI] [PubMed] [Google Scholar]; b) Pu K, Shuhendler AJ, Jokerst JV, Mei J, Gambhir SS, Bao Z, Rao J, Nat. Nanotechnol. 2014, 9, 233. [DOI] [PMC free article] [PubMed] [Google Scholar]
Associated Data
This section collects any data citations, data availability statements, or supplementary materials included in this article.
Supplementary Materials
Data Availability Statement
The data that support the findings of this study are available from the corresponding author upon reasonable request.


