Abstract
Computer-based Fourier-transform infrared spectroscopy (FT-IR) was used to identify food-borne, predominantly fermentative yeasts. Dried yeast suspensions provided the films suitable for FT-IR measurement. Informative windows in the spectrum were selected and combined to achieve optimal results. A reference spectrum library was assembled, based on 332 defined yeast strains from international yeast collections and our own isolates. All strains were identified with conventional methods using physiological and morphological characteristics. In order to assess identification quality, another 722 unknown yeast isolates not included in the reference spectrum library were identified both by classical methods and by comparison of their FT-IR spectra with those of the reference spectrum library. Ninety-seven and one-half percent of these isolates were identified correctly by FT-IR. Easy handling, rapid identification within 24 h when starting from a single colony, and a high differentiation capacity thus render FT-IR technology clearly superior to other routine methods for the identification of yeasts.
Yeasts not only provided humans with the first biotechnologically produced food such as wine, bread, and fermented milk products but are also responsible for food spoilage (19), and some species are of medical importance. Therefore, a reliable method of yeast identification is economically significant (40). Furthermore, until now about 700 yeast species have been described. Since only a few habitats have been investigated in detail so far, a wide range of yeasts is likely to be discovered in the future (6). Exploration of new species includes the identification of a large number of isolates in order to eliminate duplicates and to discover unusual forms. For such tasks, a rapid, simple, low-cost identification method is needed. Conventional differentiation systems using morphological characters as well as patterns of the assimilation and fermentation of carbon sources (4, 22, 35) do not fulfil these requirements (9, 33, 38, 40). They are tedious and time-consuming, and, quite often, their capacity is limited since many species are distinguished from one another by a single physiological reaction which is often controlled by only one mutable marker (4, 20).
Alternative methods such as fatty acid analysis (1, 31), electrophoretic karyotyping (10), restriction fragment length polymorphism, and DNA fingerprinting (26, 37) have already been evaluated (8). Restriction enzyme analysis of PCR-amplified rDNA (2), randomly amplified polymorphic DNA (3, 27), and nucleic acid hybridization with oligonucleotide probes (21, 24) have also been used. While some of these techniques do provide satisfactory results, molecular methods in general are still difficult to perform on a routine basis in laboratories of the food industry.
Fourier-transform infrared (FT-IR) spectroscopy is used for the identification of substances in chemical analyses (14). The wavelength of infrared radiation ranges from 1 μm to 1 mm (32). In general, the wave number ν, the reciprocal of the wavelength, is used as a physical unit for FT-IR spectroscopy. Infrared radiation is divided into near (ν = 12,500 to 4,000 cm−1), middle (ν = 4,000 to 200 cm−1), and far (ν = 200 to 10 cm−1) infrared. In this work, only the middle infrared section was used. FT-IR spectroscopy involves the observation of vibrations of molecules that are excited by an infrared beam. Molecules are able to absorb the energy of distinct light quanta and start a rocking or rotation movement. The FT-IR spectrum uses only vibrations that lead to a change in the dipole moment (14). An infrared spectrum represents a fingerprint which is characteristic for any chemical substance.
The composition of biological material and, thus, of its FT-IR spectrum, is exceedingly complex, representing a characteristic fingerprint. Some years ago, Naumann and coworkers suggested identifying microorganisms by FT-IR spectroscopy (28–30). In principle, a reference spectrum library is assembled based on well-characterized strains and species. The FT-IR spectrum of any unidentified isolate is then measured under the same conditions as those used for the reference spectra and is compared to spectra in the reference spectrum library. If the library contains an identical or a very similar spectrum, an identification is possible. The success of the method is, therefore, directly dependent on the complexity of the reference spectrum library. The application of FT-IR spectroscopy has been reported for some species of the genera Lactobacillus (7), Actinomyces (15), Listeria (18), Streptococcus (13), and Clostridium (11). There are two reports which present preliminary data indicating that eukaryotic microorganisms such as yeasts may also be identified by FT-IR (17, 36). However, all these studies are based on a very limited number of species and isolates. For verification of the method only a few strains, which often were part of the reference spectrum library as well, were used. It was, therefore, still unclear whether FT-IR spectroscopy indeed was a competitive identification method.
The aim of this study was to develop a standardized sample preparation procedure for yeasts (suitable for the normal laboratory), to select the most significant spectral windows for efficient identification, and to assemble a spectral reference library of sufficient complexity. Last, the identification of a great variety of unknown yeast isolates by FT-IR spectroscopy and conventional techniques had to be done in order to verify the method.
MATERIALS AND METHODS
Yeast strains.
One hundred and seventy-four strains from international yeast culture collections provided the reference material. This collection was supplemented by 158 isolates from the Weihenstephan Yeast Collection (housed at our institute), representing a wide variety of habitats. All strains were identified by using miniature test samples in microtiter plates and conventional methods (35, 39), which test for about 100 physiological and morphological characters. The computer program of Barnett (5) was used to evaluate the results. The 332 reference yeasts of the resulting spectrum library represent 74 species of 18 genera.
Sample preparation.
A single colony of yeast cells was transferred to an agar plate with a platinum loop, distributed with a Drigalski spatula, and incubated for 24 ± 1 h at 27 ± 2°C on YGCA (standard agar for yeasts in the food industry; Merck, Darmstadt, Germany) containing 5.0 g of yeast extract, 20.0 g of glucose, 0.1 g of chloramphenicol, and 14.9 g of agar per liter. For sample preparation, one loopful (1-mm-diameter platinum loop) of yeast cells scraped from this confluent lawn was suspended in 100 μl of distilled water. An aliquot of 35 μl was transferred to a ZnSe optical plate (sample holder) and dried at 42 ± 2°C for 1 h to yield transparent films, which were used directly for FT-IR spectroscopy. One sample holder accommodates 15 different samples. Measurement and comparison of the spectrum with the reference spectrum library containing spectra of defined strains take less than 2 min. In total, starting from a single yeast colony, identification is completed within 24 to 26 h.
FT-IR spectroscopy.
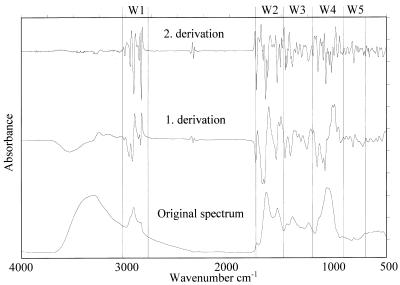
All spectra between wave numbers 4,000 and 500 cm−1 were recorded with an IFS-28B FT-IR spectrometer (Bruker, Karlsruhe, Germany). For data processing, the software OPUS, version 2.2, for microbiological identification (Bruker) was used. The adjustment of instrument parameters was done according to the suggestions of the FT-IR workgroup of the Robert-Koch-Institut, Berlin, Germany (12). To diminish the difficulties arising from unavoidable baseline shifts and to improve the resolution of complex bands, the digitized original spectra were smoothed by the second derivation (16).
In principle, the five spectral windows W1 to W5 shown in Fig. 1 are potentially informative (16, 29, 30). Ranges of wave numbers can sometimes be associated with special chemical bonds. W1 is the so-called fatty acid region (3,050 to 2,800 cm−1), where peaks mark the vibrations of the CH2 and CH3 groups of fatty acids. The W2 region is the amide section (1,750 to 1,500 cm−1), where protein and peptide bands dominate. W3, which ranges from 1,500 to 1,200 cm−1, is a mixed region containing vibrations of fatty acids, proteins, and polysaccharide. W4 (1,200 to 900 cm−1) is dominated by polysaccharide peaks. Until now an exact correlation between peaks and molecules in this section was not possible. The so-called fingerprint region W5 ranges from 900 to 700 cm−1. This window contains bands which are most characteristic at the species level. Again, just a few peaks can be assigned to the vibrations of special substances.
FIG. 1.
Original spectrum as well as first and second derivations of an FT-IR measurement of an S. cerevisiae strain. Potentially informative spectral windows (W1 to W5) are indicated.
Selection of spectral windows.
Cluster analysis was used to identify optimal windows (Fig. 1). For this purpose, windows were varied systematically until FT-IR identification was in accordance with the results of conventional microbiological identification. This variation included window size, the number of windows used, and the weighting factors imposed on each window. Best results were obtained with windows in the 3,030 to 2,830, 1,350 to 1,200, and 900 to 700 cm−1 ranges (all weighting factors were 1), and this configuration was therefore used as the standard. To cope with distances caused by unavoidable physical and biological variations such as slightly different growth in different batches due to medium preparation and variation in the dry microorganism film on the sample holder, each strain was measured at least three times in independent assays using different growth medium preparations of the standard agar. Then, an average spectrum was calculated and added to the reference spectrum library.
Cluster analysis and hit list identification.
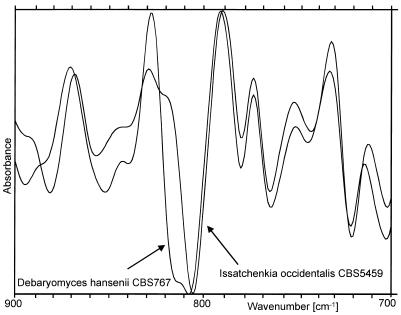
The spectral distance (also called the d value) is a measure of the similarity of the spectra of two isolates and reflects the size of nonoverlapping areas (29) of both spectra (for an example, see Fig. 2). d values between all spectra were calculated. The resulting distance matrix provided the basis for cluster analysis (construction of dendrograms by average linkage). By using identification analysis, the spectrum of an unknown isolate was compared to all spectra of the library. A hit list of 10 strains exhibiting the closest spectral distances was printed along with the d values. In Table 1, three identifications of different Saccharomyces cerevisiae strains are given.
FIG. 2.
Comparison of the fingerprint regions of two normalized FT-IR spectra. The d value is equivalent to the area which is covered by only one of the spectra.
TABLE 1.
Examples of hit lists of different identification quality for FT-IR identification of three Saccharomyces isolates preidentified by conventional methodsa
| Sample hit no. |
S. cerevisiae ze61204
|
S. cerevisiae mü70403
|
S. cerevisiae Kefir 438
|
|||
|---|---|---|---|---|---|---|
| d value | Reference strain | d value | Reference strain | d value | Reference strain | |
| 1 | 0.35 | S. cerevisiae WSYC G1383 | 0.69 | S. cerevisiae WSYC G1526 | 1.28 | S. cerevisiae WSYC G1526 |
| 2 | 0.54 | S. cerevisiae WSYC D19 | 1.75 | S. cerevisiae WSYC G1383 | 1.28 | S. cerevisiae DSM 70514 |
| 3 | 0.55 | S. cerevisiae WSYC D9 | 2.01 | S. cerevisiae WSYC D9 | 1.46 | S. cerevisiae WSYC 117 |
| 4 | 0.67 | S. cerevisiae WSYC G1526 | 2.22 | S. cerevisiae WSYC D19 | 1.47 | S. cerevisiae WSYC G1383 |
| 5 | 0.77 | S. cerevisiae WSYC 117 | 2.34 | S. cerevisiae WSYC 117 | 1.50 | S. cerevisiae WSYC D9 |
| 6 | 1.03 | S. cerevisiae WSYC G1305 | 2.47 | S. cerevisiae DSM 70509 | 1.62 | S. cerevisiae WSYC G1305 |
| 7 | 1.72 | S. cerevisiae DSM 70509 | 2.53 | S. cerevisiae DSM 70514 | 1.70 | S. cerevisiae WSYC G1466 |
| 8 | 1.78 | S. pombeb CBS 356 | 2.61 | S. cerevisiae WSYC M240 | 1.71 | S. cerevisiae DSM 70509 |
| 9 | 1.80 | K. marxianus CBS 6432 | 2.64 | S. cerevisiae WSYC G1305 | 1.91 | S. cerevisiae WSYC G1461 |
| 10 | 1.82 | S. cerevisiae WSYC M240 | 2.76 | S. unisporus CBS 1575 | 1.99 | S. cerevisiae DSM 1333 |
CBS, Centraalbureau voor Schimmelcultures, Delft, The Netherlands; DSM, Deutsche Sammlung für Mikroorganismen, Braunschweig, Germany; WSYC, Weihenstephan Yeast Collection, Institut für Mikrobiologie, FML Freising-Weihenstephan, Germany.
S. pombe, Schizosaccharomyces pombe.
RESULTS AND DISCUSSION
Reproducibility of measurements.
FT-IR spectra are influenced by variation of plating methods, growth temperature, incubation time, and even the drying method of the microorganism suspension located on the sample holder. For a high level of reproducibility it was necessary to develop the standardized preparation procedure given in the sample preparation section above. The significance level of spectral distances is given by the d values observed for multiple, independent measurements of one strain. This level was always characterized by a d value less than 0.3 and turned out to be species dependent. In some cases, the d value was as low as 0.1.
Changes of the agar medium used had pronounced influences on the spectra. Any newly purchased charge of an identical medium produced slightly different spectra and had to be verified by recording the spectra of a standard set of seven yeast strains which had been shown to be especially sensitive to medium variations. A new charge of medium can only be considered suitable for FT-IR measurements if distances between the new spectra and the reference spectra, both taken from the standard species test set, are below 0.3. While this procedure can be performed easily in any research laboratory, “FT-IR grade” standard media have to be commercially available if the FT-IR technique is to be adopted for routine microbiological analysis.
FT-IR spectroscopy as a general taxonomic tool?
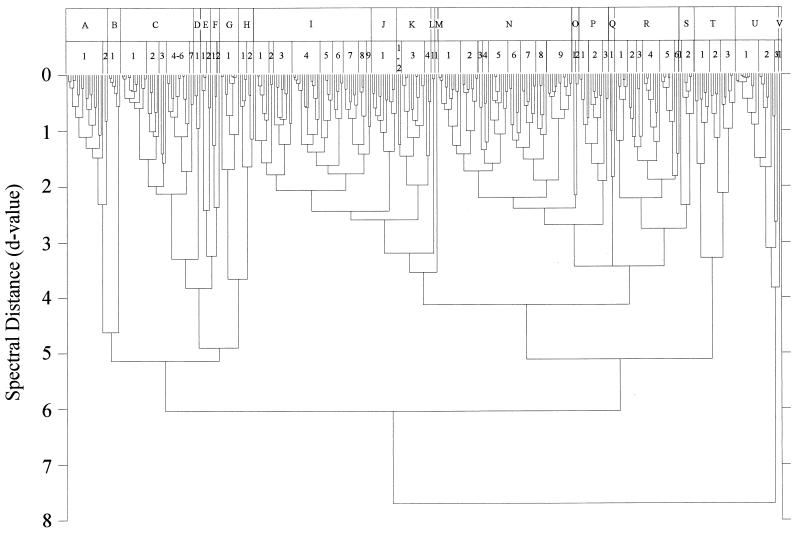
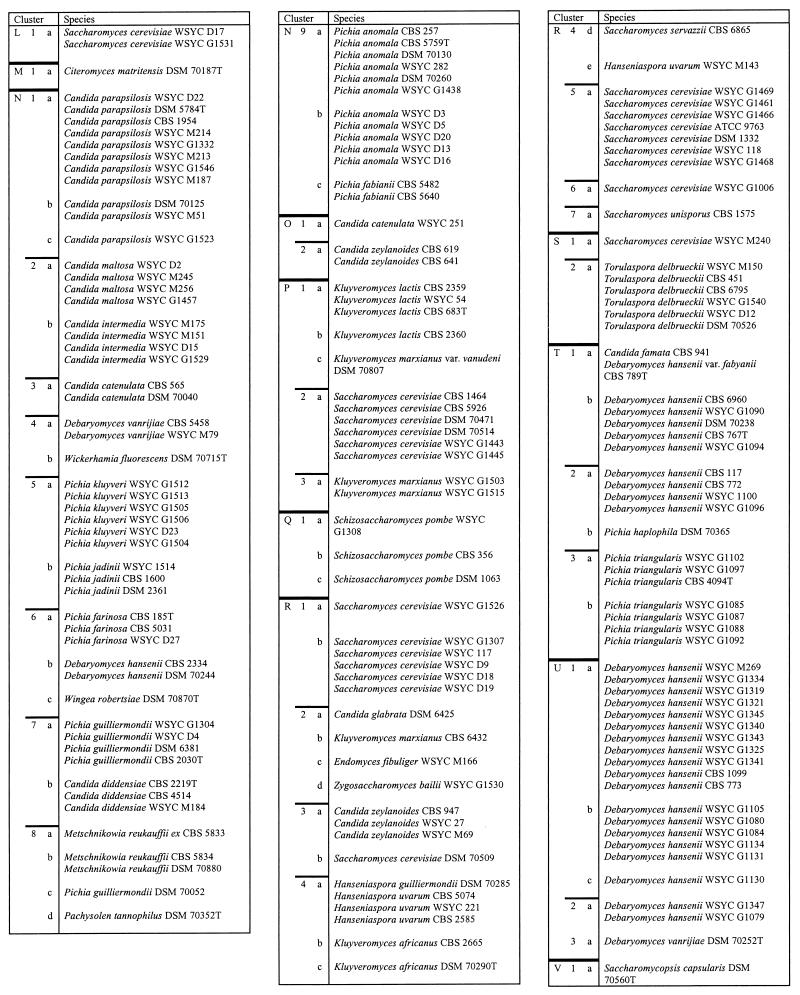
A dendrogram of 332 well-characterized reference yeasts calculated from FT-IR spectra is shown in Fig. 3. It provides a graphic impression of the distances dealt with in Table 2, where the isolates and cluster levels are listed in detail. Three arbitrary cluster levels were defined in order to divide the dendrogram into spectrally related groups. The 22 groups (A to V) of level 1 are separated by spectral distances of 2.0 to 2.5. The subclusters of those groups (level 2) have d values of 1.25 to 1.75, while level 3 is characterized by d values of 0.5 to 0.75. It is not possible to assign taxonomic interpretations to these levels. The first clear result emerging from the data presented in Fig. 3 and Table 2 is that different species of the same genus generally did not cluster. This is most obvious for the genera Pichia and Candida, for which a variety of species were available. Other algorithms for cluster analysis also do not cluster all species of a single genus.
FIG. 3.
Dendrogram of the mean spectra of the 332 yeast strains forming the reference spectrum library used for identification of unknown isolates. The dendrogram was calculated by an average-linkage algorithm and is divided into 22 major clusters (A to V). Each of those is further subdivided into second-order (1 to 9) and third-order (a to h; not listed) clusters. In Table 2, this nomenclature is also employed and can be used to identify individual strains.
TABLE 2.
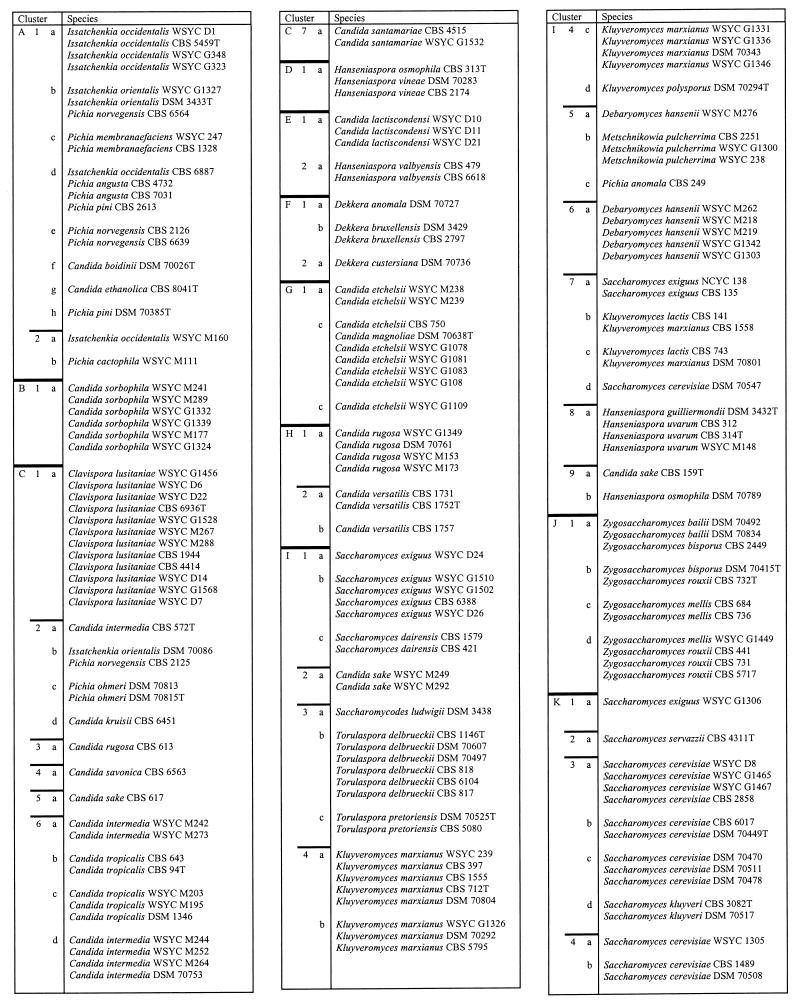
The 322 yeast strains used to create the FT-IR reference spectrum librarya
The arrangement of strains in clusters is in accordance with Fig. 1. For abbreviations used in strain designations, see footnote a to Table 1. T, type strain. The cluster designations indicate spectral distances as follows: for A to V, d = 2.0 to 2.5; for 1 to 9, d = 1.25 to 1.75; for a to h, d = 0.5 to 0.75.
Since the taxonomy of yeasts is far from being finally settled and relies largely on phenotypic characters, one might suppose that molecular data may turn out to be in agreement with FT-IR spectroscopy. Some sequences do not confirm this idea. For instance, according to 18S rRNA, Candida tropicalis, Candida parapsilosis, and Candida maltosa are very closely related (see the phylogenetic tree in reference 21). However, C. tropicalis clusters far away from the other two species (cluster C6b versus clusters N1a and N2a in Fig. 3). At this stage, however, the relation between FT-IR and molecular taxonomy cannot be assessed conclusively, but we doubt that FT-IR can be used as a general taxonomic tool above the species level.
Strains of the same species may appear in different clusters.
As is shown in Table 2, strains of many species cluster at level 3. However, there are a number of exceptions to this rule. For example, strains of Issatchenkia orientalis and Issatchenkia occidentalis fell into different clusters (clusters A1, A2, and C2b). They appear together with, e.g., Pichia membranaefaciens and Pichia norvegensis. It is interesting that these species are also difficult to separate with physiological markers (31). The same is true for Kluyveromyces marxianus and Kluyveromyces lactis (clusters I7b and -c), Hanseniaspora uvarum and Hanseniaspora guilliermondii (clusters I8a and R4a and -e) and Hanseniaspora vineae and Hanseniaspora osmophila (clusters D1a and I9b). A clear identification of these species was not always possible by physiological and morphological characteristics (unpublished data; see also reference 40).
During the creation of the reference spectrum library, it often happened that a new strain of a species clustered far away from the other strains already investigated. However, when more strains were included, it became clear that such an “aberrant” strain just represented the first example of a new cluster including several representatives. Therefore, species with many strains often formed more than one independent cluster. Typical examples are S. cerevisiae, K. marxianus, and Debaryomyces hansenii. The taxonomic significance of this finding has not been studied in detail so far and must be assessed in the future by using molecular taxonomic markers (compare references 3 and 20).
Optimization of spectral windows used for closely related yeast groups.
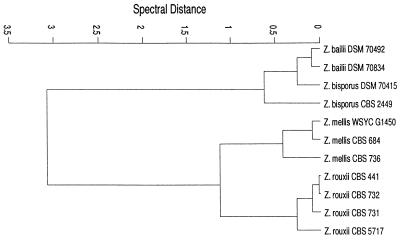
There are several possible causes which may account for the formation of different clusters by strains of the same species. First, the window combination used for FT-IR spectroscopy may have been suboptimal in some cases. For instance, strains of Zygosaccharomyces bisporus, Zygosaccharomyces bailii, Zygosaccharomyces rouxii, and Zygosaccharomyces mellis (cluster J1) do not form species clusters. By conventional methods it is often difficult to identify these species (33, 40). Growth rates in the presence of 50 or 60% glucose and 1% acetic acid are the only criteria used to distinguish between these Zygosaccharomyces species (4). Analysis of 18S rRNA reflected a very close relationship between Z. bailii and Z. bisporus and a slightly greater distance between Z. rouxii and Z. mellis (20). Specific problems such as the identification of Zygosaccharomyces strains by FT-IR may be solved by optimizing the spectral window combination. For example, the windows characterized by wave numbers of 1,710 to 1,690, 1,213 to 1,202, and 777 to 767 cm−1 yielded the dendrogram shown in Fig. 4, which corresponds exactly to the results of the 18S rRNA analysis. This example demonstrates that a separation of yeasts which are difficult to identify by the general yeast identification window setting is possible by a stepwise optimization of spectral window selection. However, to do so, the “real” relationship of the isolates according to genomic DNA sequences, in this case 18S rRNA, must be known beforehand.
FIG. 4.
Cluster analysis (average linkage) of four Zygosaccharomyces species. Spectral windows have been set at the following wave number ranges: 1,710 to 1,690, 1,213 to 1,202, and 777 to 767 cm−1. The pattern shown in this figure corresponds closely to that derived from 18S rRNA sequences.
Detection of novel species, subspecies, or mutants by FT-IR?
Another reason why strains of the same species do not cluster may be the existence of new subspecies or species. For instance, separate clusters for one species may be due to “habitat variants” (34). Successful adaptation to completely different habitats may result in the evolution of subspecies which may have different FT-IR spectra. One example is D. hansenii: strains from clusters U1a to -c, U2a, and T2a and -b were isolated from cheese and brine, while strains within cluster T1b come from beer, cattle, and yogurt. A second example is provided by strains of S. cerevisiae: those contained in clusters K3a to -c and L1a (Table 2) are from beer, wine, and must, while the strains combined in clusters P2a and R1a and -b were isolated from yogurt, diseased nails, and other sources. It is well known that strains of S. cerevisiae fall into different groups (3, 20, 25), but it is not clear whether these groups represent isolates from certain habitats.
Another indication for the existence of different subspecies or even species is extremely different degrees of homogeneity in the spectral distances between strains. This is, for instance, the case when clusters of D. hansenii, Pichia anomala, and Torulaspora delbrueckii are compared. While the P. anomala cluster and the two T. delbrueckii clusters exhibit an internal spectral distance of approximately 0.7, the distances between D. hansenii strains within the three species clusters were more than 1.7 (clusters T1 and T2 and U1 and U2; Table 2). Again, Kurtzman (23) noted that D. hansenii is a heterogeneous species according to a taxonomy based on physiological markers.
While such data are in accordance with the hypothesis of different taxonomic forms, molecular data are clearly needed to clarify the situation. In particular, there might be other reasons for single strains clustering independently, e.g., slow-growing mutants, strains with mutations of a biochemical character such as slime production, and strains with fast ascospore formation. Such mutants most probably would have significantly different FT-IR spectra due to major differences in cellular composition (11).
Validation of FT-IR identification.
It appears that the use of FT-IR spectroscopy for taxonomic purposes is limited. This fact, however, does not prevent it from being a powerful identification system. To evaluate this potential, the method has been tested with 722 independent yeast isolates, which were obtained from different habitats, mostly from the food industry. They were not included in the reference spectrum library and constituted 36 yeast species belonging to 11 genera (Table 3). All isolates were identified in parallel by physiological and morphological characters. An identification by FT-IR spectroscopy was considered to be successful if the d value of the first recommended reference strain in the hit list (Table 1) was below 1.5 and, in addition, either the next similar hits were three strains of the same species or the distance between the first hit and the next species was larger than 0.25. Table 1 shows example hit lists as a result of three identity tests with three unknown isolates.
TABLE 3.
Field isolates of yeast strains which are not included in the FT-IR reference spectrum librarya
| Speciesb | No. of isolates |
|---|---|
| C. boidinii | 1 |
| C. etchellsii | 6 |
| C. glabrata | 6 |
| C. intermedia | 28 |
| C. oleophila | 7 |
| C. parapsilosis | 16 |
| C. rugosa | 2 |
| C. sorbophila | 6 |
| C. tropicalis | 17 |
| C. versatilis | 2 |
| C. zeylanoides | 2 |
| Clavispora lusitaniae | 49 |
| Debaryomyces hansenii | 47 |
| H. uvarum | 15 |
| H. vineae | 4 |
| H. valbyensis | 1 |
| Issatchenkia occidentalis | 39 |
| K. lactis | 14 |
| K. marxianus | 40 |
| Metschnikowia pulcherrima | 5 |
| P. anomala | 100 |
| P. cactophila | 3 |
| P. guilliermondii | 10 |
| P. jadinii | 1 |
| P. membranaefaciens | 2 |
| P. kluyveri | 9 |
| P. pseudocactophila | 2 |
| P. triangularis | 12 |
| S. cerevisiae | 185 |
| S. servazzii | 3 |
| S. unisporus | 14 |
| Sterigmatomyces haplophilus | 2 |
| Torulaspora delbrueckii | 56 |
| Yarrowia lipolytica | 3 |
| Zygosaccharomyces sp. | 4 |
| Z. rouxii | 2 |
| No identification possible | 5 |
These 722 isolates had been identified by conventional methods and were used subsequently for validation of the FT-IR identification. Five of 722 isolates could not be identified by conventional methods (last line of the table).
C., Candida; H., Hanseniaspora; K., Kluyveromyces; P., Pichia; S., Saccharomyces.
Five of 722 isolates were not identifiable by conventional methods. These strains may be mixed cultures which are difficult to purify, defective mutants, or novel species. They have not been investigated in further detail. Twelve isolates (1.7% of 717 strains) could be identified only when a subjective decision based on personal experience with yeast taxonomy (habitats and morphology, etc.) was used to evaluate the unclear FT-IR hit list. Another 6 of 717 strains could not be identified by FT-IR at all. In summary, 699 of 717 strains were identified correctly by FT-IR spectroscopy, which corresponds to an identification rate of 97.5%.
Conclusion.
With an identification time of 24 to 26 h starting from a single colony and an identification rate of about 97%, FT-IR spectroscopy provides a superior, rapid alternative to conventional identification systems for food-borne yeasts, which take several days. Identification is limited only by the quality of the reference spectrum library, which can be improved steadily by adding further yeast isolates to the database. The method is easy to use, and we now routinely identify yeasts by FT-IR.
ACKNOWLEDGMENTS
This work was supported by the Bundesministerium für Wirtschaft through the Arbeitsgemeinschaft industrieller Forschungsvereinigungen “Otto von Guericke” e.V. (AiF), grant no. AiF-FV-10768N.
The comments of three reviewers led to a significantly improved presentation of the data.
REFERENCES
- 1.Augustyn O P H, Kock J L F, Ferreira D. Differentiation between yeast species, and strains within a species, by cellular fatty acid analysis. Syst Appl Microbiol. 1992;15:105–115. [Google Scholar]
- 2.Baleiras Couto M M, Vogels J T W E, Hofstra H, Huis in’t Veld J H J, van der Vossen J M B M. Random amplified polymorphic DNA and restriction enzyme analysis of PCR amplified rDNA in taxonomy: two identification techniques for food-borne yeasts. J Appl Bacteriol. 1995;79:525–535. doi: 10.1111/j.1365-2672.1995.tb03173.x. [DOI] [PubMed] [Google Scholar]
- 3.Baleiras Couto M M, Eijsma B, Hofstra H, Huis in’t Veld J H J, van der Vossen J M B M. Evaluation of molecular typing techniques to assign genetic diversity among Saccharomyces cerevisiae strains. Appl Environ Microbiol. 1996;62:41–46. doi: 10.1128/aem.62.1.41-46.1996. [DOI] [PMC free article] [PubMed] [Google Scholar]
- 4.Barnett J A, Payne R W, Yarrow D. Yeasts: characteristics and identification. 2nd ed. Cambridge, United Kingdom: Cambridge University Press; 1990. [Google Scholar]
- 5.Barnett J A. Yeast identification program. J. A. Norwich, England: Barnett; 1996. [Google Scholar]
- 6.Boekhout T, Kurtzman C P. Principles and methods in yeast classification, and an overview of currently accepted yeast genera. In: Wolf K, editor. Nonconventional yeasts in biotechnology. Berlin, Germany: Springer-Verlag; 1996. pp. 1–81. [Google Scholar]
- 7.Curk M C, Peladan F, Hubert J C. Fourier-transform infrared (FTIR) spectroscopy for identifying Lactobacillus species. FEMS Microbiol Lett. 1994;123:241–248. [Google Scholar]
- 8.Deak T, Beuchart L R. Identification of foodborne yeasts. J Food Prot. 1987;50:243–264. doi: 10.4315/0362-028X-50.3.243. [DOI] [PubMed] [Google Scholar]
- 9.Deak T, Beuchart L R. Evaluation of simplified and commercial systems for identification of foodborne yeasts. Int J Food Microbiol. 1988;7:135–145. doi: 10.1016/0168-1605(88)90006-2. [DOI] [PubMed] [Google Scholar]
- 10.Donhauser S, Springer R, Vogeser G. Identifizierung und Klassifizierung von Brauereihefen durch Chromosomenanalyse mit der Pulsfeldgelelektrophorese. Monatsschr Brauwissensch. 1990;12:392–400. [Google Scholar]
- 11.Franz M. Identifizierung von Clostridien mittels FT-IR-Spektroskopie. Dtsch Milchwirtsch. 1994;3:130–132. [Google Scholar]
- 12.FT-IR workgroup RKI/BIAM. Anleitung zur Charakterisierung von Mikroorganismen mit IFS 25/B und Opus. Berlin, Germany: Robert-Koch-Institut; 1992. [Google Scholar]
- 13.Goodacre R, Timmins É, Rooney P J, Rowland J J, Kell D. Rapid identification of Streptomyces species using diffuse reflectance-absorbance Fourier-transform infrared spectroscopy and artificial neural networks. FEMS Microbiol Lett. 1996;140:233–239. doi: 10.1016/0378-1097(96)00186-3. [DOI] [PubMed] [Google Scholar]
- 14.Günzer H, Heisse H M. IR-Spektroskopie. 3. Auflage. Weinheim, Germany: VCH-Verlag; 1996. [Google Scholar]
- 15.Haag H, Gremlich H-G, Bergmann R, Sanglier J-J. Characterization and identification of actinomycetes by FT-IR spectroscopy. J Microbiol Methods. 1996;27:157–163. [Google Scholar]
- 16.Helm D, Labischinski H, Schallehn G, Naumann D. Classification and identification of bacteria by Fourier-transform infrared spectroscopy. J Gen Microbiol. 1991;13:69–79. doi: 10.1099/00221287-137-1-69. [DOI] [PubMed] [Google Scholar]
- 17.Henderson D O, Mu R, Gunasekaran M. A rapid method for the identification of Candida at the species level by Fourier-transform infrared spectroscopy. Biochem Lett. 1996;51:223–228. [Google Scholar]
- 18.Holt C, Hirst D, Sutherland A, MacDonald F. Discrimination of species in the genus Listeria by Fourier transform infrared spectroscopy and canonical variate analysis. Appl Environ Microbiol. 1995;61:377–378. doi: 10.1128/aem.61.1.377-378.1995. [DOI] [PMC free article] [PubMed] [Google Scholar]
- 19.Jakobsen M, Narvhus J. Yeasts and their possible beneficial and negative effects on the quality of dairy products. Int Dairy J. 1996;6:755–768. [Google Scholar]
- 20.James S A, Cai J, Roberts I N, Collins M D. A phylogenetic analysis of the genus Saccharomyces based on 18S rRNA gene sequences: description of Saccharomyces kunashirensis sp. nov. and Saccharomyces martiniae sp. nov. Int J Syst Bacteriol. 1997;47:453–460. doi: 10.1099/00207713-47-2-453. [DOI] [PubMed] [Google Scholar]
- 21.Kosse D, Seiler H, Amann R I, Ludwig W, Scherer S. Identification of yoghurt-spoiling yeasts with 18S-rRNA-targeted oligonucleotide probes. Syst Appl Microbiol. 1997;20:468–480. [Google Scholar]
- 22.Kreger-van Rij N J W. The yeasts, a taxonomic study. Amsterdam, The Netherlands: Elsevier Science Publishers; 1984. [Google Scholar]
- 23.Kurtzman C P. Molecular taxonomy of yeasts. Yeasts. 1994;10:1727–1740. doi: 10.1002/yea.320101306. [DOI] [PubMed] [Google Scholar]
- 24.Lischewski A, Amann R I, Harmsen D, Merkert H, Hacker J, Morschhäuser J. Specific detection of Candida albicans and Candida tropicalis by fluorescent in situ hybridization with an 18S rRNA-targeted oligonucleotide probe. Microbiology. 1996;142:2731–2740. doi: 10.1099/13500872-142-10-2731. [DOI] [PubMed] [Google Scholar]
- 25.Martini A V, Kurtzman C P. Deoxyribonucleic acid relatedness among species of the genus Saccharomyces sensu stricto. Int J Syst Bacteriol. 1985;35:508–511. [Google Scholar]
- 26.Meaden P. DNA fingerprinting of brewer’s yeast: current perspectives. J Inst Brew. 1990;96:195–200. [Google Scholar]
- 27.Messner R, Prillinger H, Altmann F, Lopandic K, Wimmer K, Molnar O, Weigang F. Molecular characterization and application of random amplified polymorphic DNA analysis of Mrakia and Sterigmatomyces species. Int J Syst Bacteriol. 1994;44:694–703. doi: 10.1099/00207713-44-4-694. [DOI] [PubMed] [Google Scholar]
- 28.Naumann D. The ultra rapid differentiation and identification of pathogenic bacteria using FT-IR techniques. SPIE Fourier Comput Infrared Spectrosc. 1985;553:268–269. [Google Scholar]
- 29.Naumann D, Fijala V, Labischinski H, Giesbrecht P. The rapid differentiation and identification of pathogenic bacteria using Fourier-transform infrared spectroscopic and multivariate statistical analysis. J Mol Struct. 1988;174:165–170. [Google Scholar]
- 30.Naumann D, Labischinski H, Helm D, Giesbrecht P. The characterization of microorganisms by Fourier-transform infrared spectroscopy (FT-IR) In: Nelson W H, editor. Modern techniques for rapid microbiological analysis. New York, N.Y: VCH Publishers; 1990. pp. 43–96. [Google Scholar]
- 31.Noronha-da-Costa P, Rodrigues C, Spencer-Martins I, Loureiro V. Fatty acid patterns of film-forming yeasts and new evidence for the heterogeneity of Pichia membranaefaciens. Lett Appl Microbiol. 1996;23:79–84. doi: 10.1111/j.1472-765x.1996.tb00035.x. [DOI] [PubMed] [Google Scholar]
- 32.Perkamps H-H. Parat-Lexikon der Spektroskopie. 1st ed. Weinheim, Germany: VCH-Verlag; 1993. [Google Scholar]
- 33.Praphailong W, Van Gestel M, Fleet G H, Heard G M. Evaluation of the Biolog system for identification of food and beverage yeasts. Lett Appl Microbiol. 1997;24:455–459. doi: 10.1046/j.1472-765x.1997.00057.x. [DOI] [PubMed] [Google Scholar]
- 34.Roostita R, Fleet G H. Growth of yeasts in milk and associated changes to milk composition. Int J Food Microbiol. 1996;31:205–219. doi: 10.1016/0168-1605(96)00999-3. [DOI] [PubMed] [Google Scholar]
- 35.Seiler H, Busse M. Identifizierung von Hefen mit Mikrotiterplatten. Forum Mikrobiol. 1988;11:505–509. [Google Scholar]
- 36.Serfas O, Standfuss G, Flemming I, Naumann D. FT-IR-Spektroskopie in der Bioanalytik. BioTec Analytik. 1991;3:42–47. [Google Scholar]
- 37.Tichy H-V, Simon R. Effiziente Analyse von Mikroorganismen mit PCR-Fingerprint-Verfahren. Bioforum. 1994;17:499–505. [Google Scholar]
- 38.Tötök T, King A D., Jr Comparative study on the identification of food-borne yeasts. Appl Environ Microbiol. 1991;57:1207–1212. doi: 10.1128/aem.57.4.1207-1212.1991. [DOI] [PMC free article] [PubMed] [Google Scholar]
- 39.Valdés-Stauber N, Scherer S, Seiler H. Identification of yeasts and coryneform bacteria from the surface microflora of brick cheeses. Int J Food Microbiol. 1997;34:115–129. doi: 10.1016/s0168-1605(96)01171-3. [DOI] [PubMed] [Google Scholar]
- 40.Welthagen J J, Viljoen B C. The value of certain chemotaxonomic methods in the identification of food related yeasts. Food Microbiol. 1997;14:231–245. [Google Scholar]


