Abstract
Oligodendrocytes, the myelinating cells of the central nervous system (CNS), are generated from oligodendrocyte precursor cells (OPCs) that express neurotransmitter receptors. However, the mechanisms that affect OPC activity in vivo and the physiological roles of neurotransmitter signaling in OPCs are unclear. Here, we generate a transgenic mouse line that expresses membrane-anchored GCaMP6s in OPCs and use longitudinal two-photon microscopy to monitor OPC calcium (Ca2+) dynamics in the cerebral cortex. OPCs exhibit high rates of spontaneous activity characterized by focal and transient Ca2+ increases within their processes that are enhanced during locomotion-induced increases in arousal. The Ca2+ transients occur independently of excitatory neuron activity, rapidly decline when OPCs differentiate, and are inhibited by anesthesia, sedative agents, or norepinephrine antagonists. Conditional knockout of α1A adrenergic receptors in OPCs suppresses spontaneous and locomotion-induced Ca2+ increases as well as OPC proliferation. Our results suggest that OPCs are directly modulated by norepinephrine in vivo to enhance Ca2+ dynamics and promote lineage homeostasis during arousal.
Introduction
The adult central nervous system (CNS) contains a population of oligodendrocyte precursor cells (OPCs) that provides the means to generate new oligodendrocytes in response to changes in life experience1,2 and regenerate oligodendrocytes lost through injury or diseases such as multiple sclerosis3. However, OPCs are found in brain regions devoid of myelin4, can engulf cellular debris5, present exogenous antigen6,7, and prune axons and synapses during development8, suggesting that they may have broader roles in tissue surveillance and homeostasis. In support of this hypothesis, genetic depletion of these cells from the CNS results in impaired circuit functions9, such as impaired sensory information processing10 and homeostatic control of metabolism11. However, the mechanisms used to control the behavior of these ubiquitous progenitors within neural circuits remain poorly understood.
Physiological studies of OPCs indicate that they express a diverse array of neurotransmitter receptors and Ca2+ permeable ion channels9, suggesting that they are subject to acute neuromodulation. Transcriptional mRNA profiling at the bulk and single cell level support this hypothesis and have further expanded the range of potential receptors expressed by these ubiquitous progenitors12–14. OPCs form direct synapses with neurons5,15, in which they serve as a postsynaptic target, enabling transient activation of ionotropic glutamate or GABAA receptors in their processes15–17. Activation of these receptors can influence their proliferation, differentiation, and response to injury, providing a means to link neural activity to proliferation and lineage progression18–21. In addition, in vitro screens in both mouse and human have shown that OPCs dynamics can be influenced by compounds that act on ligand gated receptors, including neuropeptide and acetylcholine receptors22,23. Manipulation of these receptors in vivo can exert similar changes in lineage progression22,23. However, we know little about the activity patterns exhibited by OPCs in the intact brain under physiological conditions, the mechanisms that control signaling with these cells, or the behavioral states in which these cells become activated.
OPCs can exist in many different states as they progress through the stages of cell division, transform into premyelinating oligodendrocytes, or activate apoptotic pathways24, highlighting the need to relate activity patterns to cell behavior. Recent studies in the developing spinal cord of larval zebrafish revealed that OPCs exhibit periodic increases in intracellular Ca2+ that varied depending on soma location in the spinal cord25, with cell activity higher in sparsely myelinated regions25. Moreover, in vivo imaging in anesthetized mice showed that activation of olfactory neurons with odorants results in Ca2+ increases within OPCs in activated glomeruli within the olfactory bulb26, a phenomenon that also appears to be independent of myelination. These results raise the possibility that OPCs can exist in distinct physiological states and exhibit regional differences in their response to neuronal activity. To define the mechanisms used to control the activity of OPCs in vivo during different behavioral states and at distinct cell stages, we generated a novel transgenic mouse line to enable visualization of dynamic Ca2+ signals within OPC processes and performed, time-lapse, two-photon (2P) imaging in the cerebral cortex of awake mice.
Results
OPC Ca2+ signaling detected in vivo with novel mGCaMP6s mice
OPCs extend fine processes that ramify extensively within the surrounding neuropil5,24. To examine Ca2+ changes within these small compartments in vivo, we generated a transgenic mouse line that enables conditional expression of a membrane anchored form of the calcium indicator GCaMP6s27 (Rosa26-lsl-mGCaMP6s mice, mGCaMP6s) (Extended Data Fig. 1a), which were then bred to PDGFRα-CreER mice28 to express mGCaMP6s in OPCs. Administration of tamoxifen (TAM) to young adult PDGFRα-CreER;mGCaMP6s mice resulted in mGCaMP6s expression in the majority of OPCs, as assessed by co-localization between NG2 and GFP (Extended Data Fig. 1b-e). Comparison of mGCaMP6s expression with cytosolic GCaMP6s in PDGFRα-CreER;R26-lsl-GCaMP6s mice, revealed that mGCaMP6s was more abundant than cytosolic GCaMP6s in their processes (Extended Data Fig. 1f,g), suggesting that it may improve resolution of signaling events.
OPCs exhibit transient Ca2+ increases in their processes
To assess whether OPCs in the mammalian brain exhibit dynamic Ca2+ signaling, we implanted chronic cranial windows over the visual cortex of young adult PDGFRα-CreER;mGCaMP6s mice (see Methods) and performed 2P imaging under awake conditions (Fig. 1a). Time lapse imaging in layer I of area V1 revealed that OPCs experienced frequent local increases in mGCaMP6s fluorescence in their processes, indicative of intracellular Ca2+ elevation (Fig. 1b, c, Supplementary Video 1, 2). These Ca2+ transients were highly variable in amplitude, time course, location, and size, and often propagated within an individual process (Fig. 1d). In animals that were quietly resting, this activity was remarkably consistent (Fig. 1e), with Ca2+ transients observed in all visible processes within the imaging plane (Fig. 1f). Ca2+ transients occurred with an average frequency of 37 events/min within the imaging volume, with each event lasting for ~ 6 s (Extended Data Fig. 2a). mGCaMP6s-detected events were more frequent and larger in area than those measured with cytosolic GCaMP6s (Extended Data Fig. 2a), supporting the hypothesis that membrane tethering enhances the ability to resolve Ca2+ changes within the fine processes of OPCs.
Figure 1. In vivo 2P imaging reveals that OPCs exhibit dynamic Ca2+ activity.
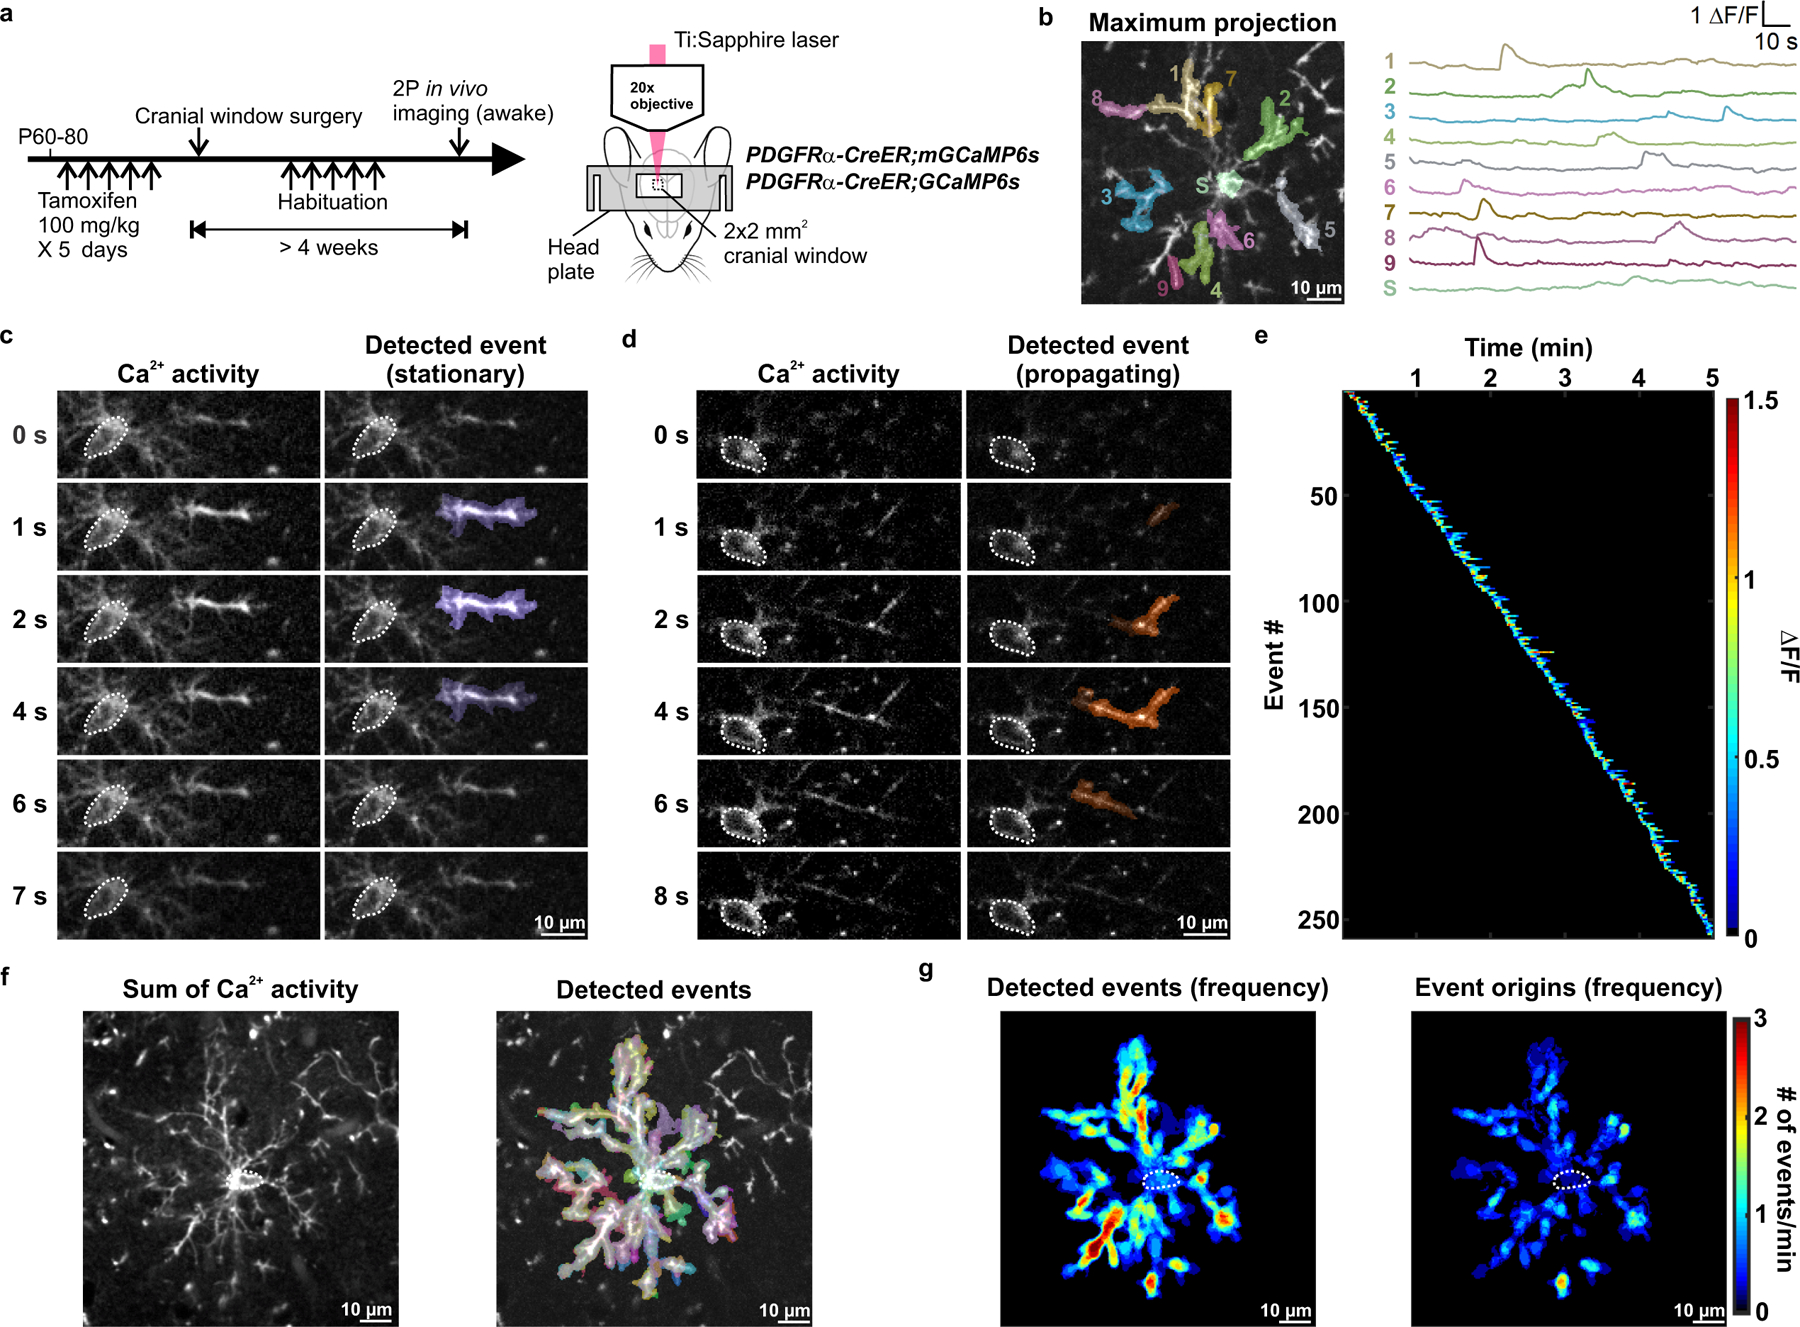
a, Schematic illustrations of the research design. Expression of membrane anchored or cytosolic GCaMP6s or in PDGFRα+ OPCs was induced between P60–80. OPC Ca2+ activity in the visual cortex of head-fixed, awake mice was observed through a chronic cranial window using 2P excitation from a Ti:Sapphire laser. See Methods for details. b, Example ΔF/F traces of OPC membrane Ca2+ events detected and randomly pseudocolored by AQuA software61. Example Ca2+ events were overlaid on an mGCaMP6s-expressing OPC visualized by projecting a total of 601 frames over 5 min onto a single image plane (Maximum projection). 1–9: process events. S: soma event. c-d, Frame-by-frame views of a stationary (c) and a propagating (d) OPC membrane Ca2+ event. Dotted white circles delineate the OPC cell body. e, Heatmap showing all Ca2+ events detected in an OPC over a 5-minute recording, sorted according to the time of event onset. Note absence of an increase of Ca2+ activity, which would suggest artificial photoactivation. f, Summation of all membrane Ca2+ activities and events (randomly pseudocolored by AQuA) exhibited by an OPC during a 5-minute recording. Note how the events are widespread throughout OPC soma and processes. g, Heatmaps showing overall event frequency and event origins (defined as the location where an event reaches 20% of the amplitude) of the OPC in f. Data from b-g is representative from 6 independent experiments that yielded similar results.
Ca2+ events were not restricted to certain regions of the processes (see Fig. 1f); however, regions of enhanced Ca2+ activity were apparent in maps of event frequency and event origin (the location when the event reached 20% of the peak ΔF/F) (Fig. 1g), suggesting that select regions are specialized to support this form of signaling. Propagating and non-propagating events occurred in the same processes, with propagating events comprising 39% of all Ca2+ transients (Extended data Fig. 3a). Some regions did not consistently produce propagating events (Extended Data Fig. 3b) and the distance that an event traveled was not correlated with its amplitude (Extended Data Fig. 3c), suggesting that propagation arises through active rather than passive processes. Moreover, events did not move in a consistent direction (i.e. to or from the soma) (Extended Data Fig. 3d), highlighting the variable nature of these events.
Less than 10% of all events occurred within the soma (mGCaMP6s: 6.8 ± 1.6%; GCaMP6s: 8.1 ± 1.0%) (Extended Data Fig. 2b). If somatic events arise as a result of activity in the processes, there should be a temporal relationship between activity in these domains. However, somatic events were not preceded or followed by a consistent Ca2+ increase or pattern of Ca2+ transients in the processes (Extended Data Fig. 3e, solid lines), suggesting that somatic Ca2+ increases arise from independent signaling events.
OPC Ca2+ activity is suppressed during anesthesia
To assess whether OPC Ca2+ activity is affected by changes in brain state, we compared OPC Ca2+ activity before, during and after isoflurane-induced anesthesia. Anesthesia dramatically reduced the frequency of Ca2+ events by 72%, while the event area was reduced by ~50% (Fig. 2a, b). However, neither the amplitude nor the duration of Ca2+ transients were affected by anesthesia, suggesting that mechanisms responsible for internal Ca2+ regulation remain functional. Normal Ca2+ activity patterns remained suppressed one hour after ceasing anesthesia, consistent with the lingering effects of general anesthetics on neuronal and astrocyte activity29, but recovered fully within 24 hours (Fig. 2b). These results indicate that OPC Ca2+ signaling is highly sensitive to anesthetics and correlated with overall brain activity.
Figure 2. OPC Ca2+ activity is significantly suppressed during anesthesia.
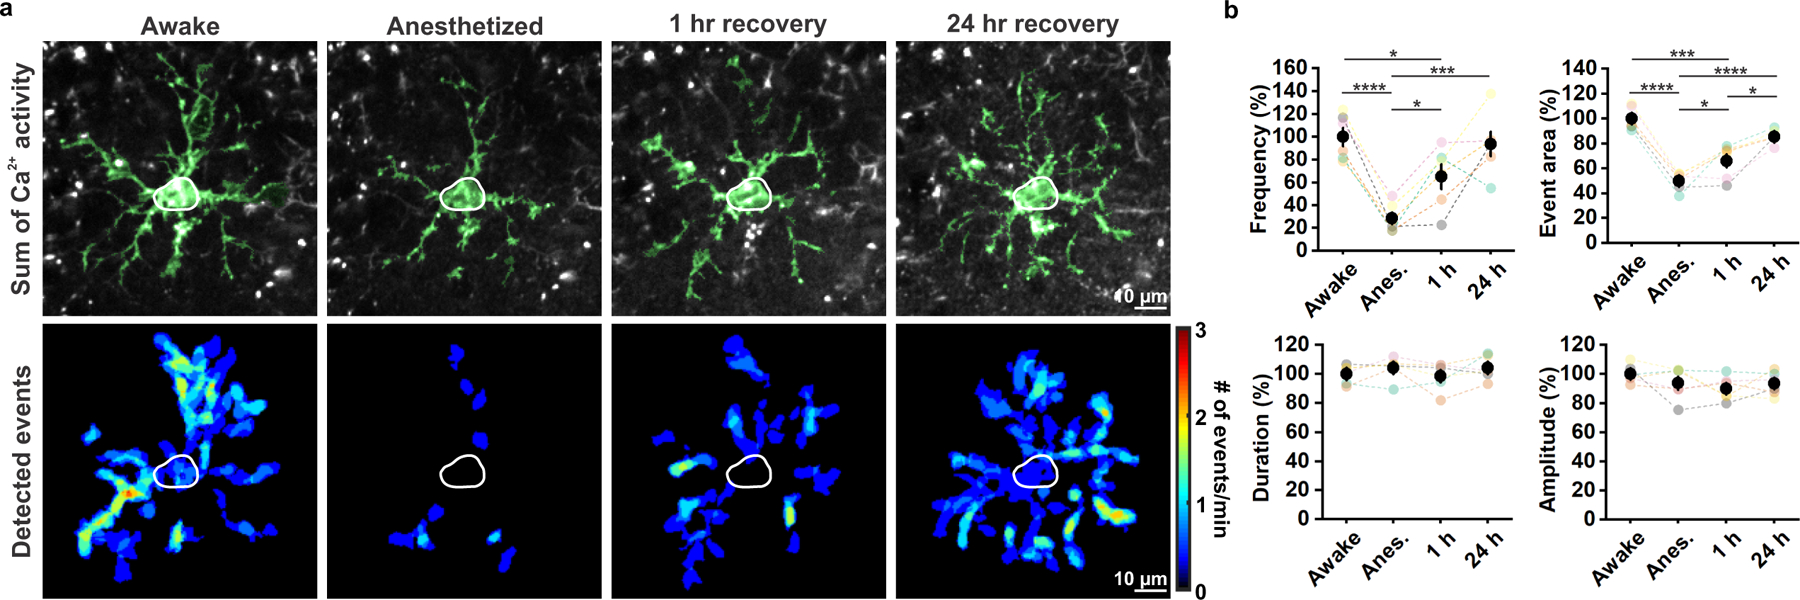
a, Representative images of an mGCaMP6s-expressing OPC exhibiting decreased Ca2+ activity during general anesthesia. OPC morphology was visualized by summing a total of 361 frames (3 minutes) (Sum of Ca2+ activity) and highlighted in green. Heatmaps show Ca2+ event frequency (Detected events). b, Quantification of Ca2+ activity. Black filled circles and error bars represent mean ± SEM. n = 6 OPCs from 6 mice (mice are color-coded throughout). One-Way Repeated Measure ANOVA. Frequency: F = 91.3457, p = 0.0019; Event area: F = 81.9459, p = 0.0022; Duration: F = 1.2328, p = 0.4337; Amplitude: F = 0.7940, p = 0.5729. Post-hoc: Tukey. *: p < 0.05; **: p < 0.01; ***: p < 0.001; ****: p < 0.0001 throughout.
Enforced locomotion stimulates OPC Ca2+ activity in V1
OPCs express Ca2+-permeable ion channels and receive direct synaptic input from glutamatergic and GABAergic neurons9. To address whether OPC Ca2+ transients arise through local neuronal activity, we activated neurons in visual cortex by exposing the contralateral eye to brief pulses of blue light in head-fixed, awake animals, while monitoring OPC Ca2+ activity in layer II of V1 (Extended Data Fig. 4a, b). Unexpectedly, Ca2+ transients in OPCs were unaffected by this intense visual stimulation (Extended Data Fig. 4c-e), suggesting that local synaptic activity does not substantially contribute to the forms of OPC Ca2+ activity assessed here. However, OPC Ca2+ activity was enhanced when light stimulation startled the mice and induced ambulation. To better define the influences of arousal/locomotion on OPC Ca2+ activity, we used a motorized rotating platter to induce periodic enforced locomotion (Fig. 3a), a manipulation that reliably increases arousal and triggers widespread release of norepinephrine (NE)30. OPC Ca2+ activity was consistently enhanced during bouts of enforced locomotion (Fig. 3b, c and Supplementary Video 3) throughout OPC processes and soma within seconds in response to this stimulation (Fig. 3d-f), and lasted for ~15–20 s, suggesting that the increased arousal state was responsible for the increased of Ca2+ activity in OPCs30. Event amplitude was not increased by enforced locomotion (Fig. 3e, f), suggesting that this behavioral manipulation primarily increases the probability that a Ca2+ transient will occur. Together, these data indicate that intracellular Ca2+ levels in OPCs vary with brain state.
Figure 3. Enforced locomotion enhances OPC Ca2+ activity in the mouse visual cortex.
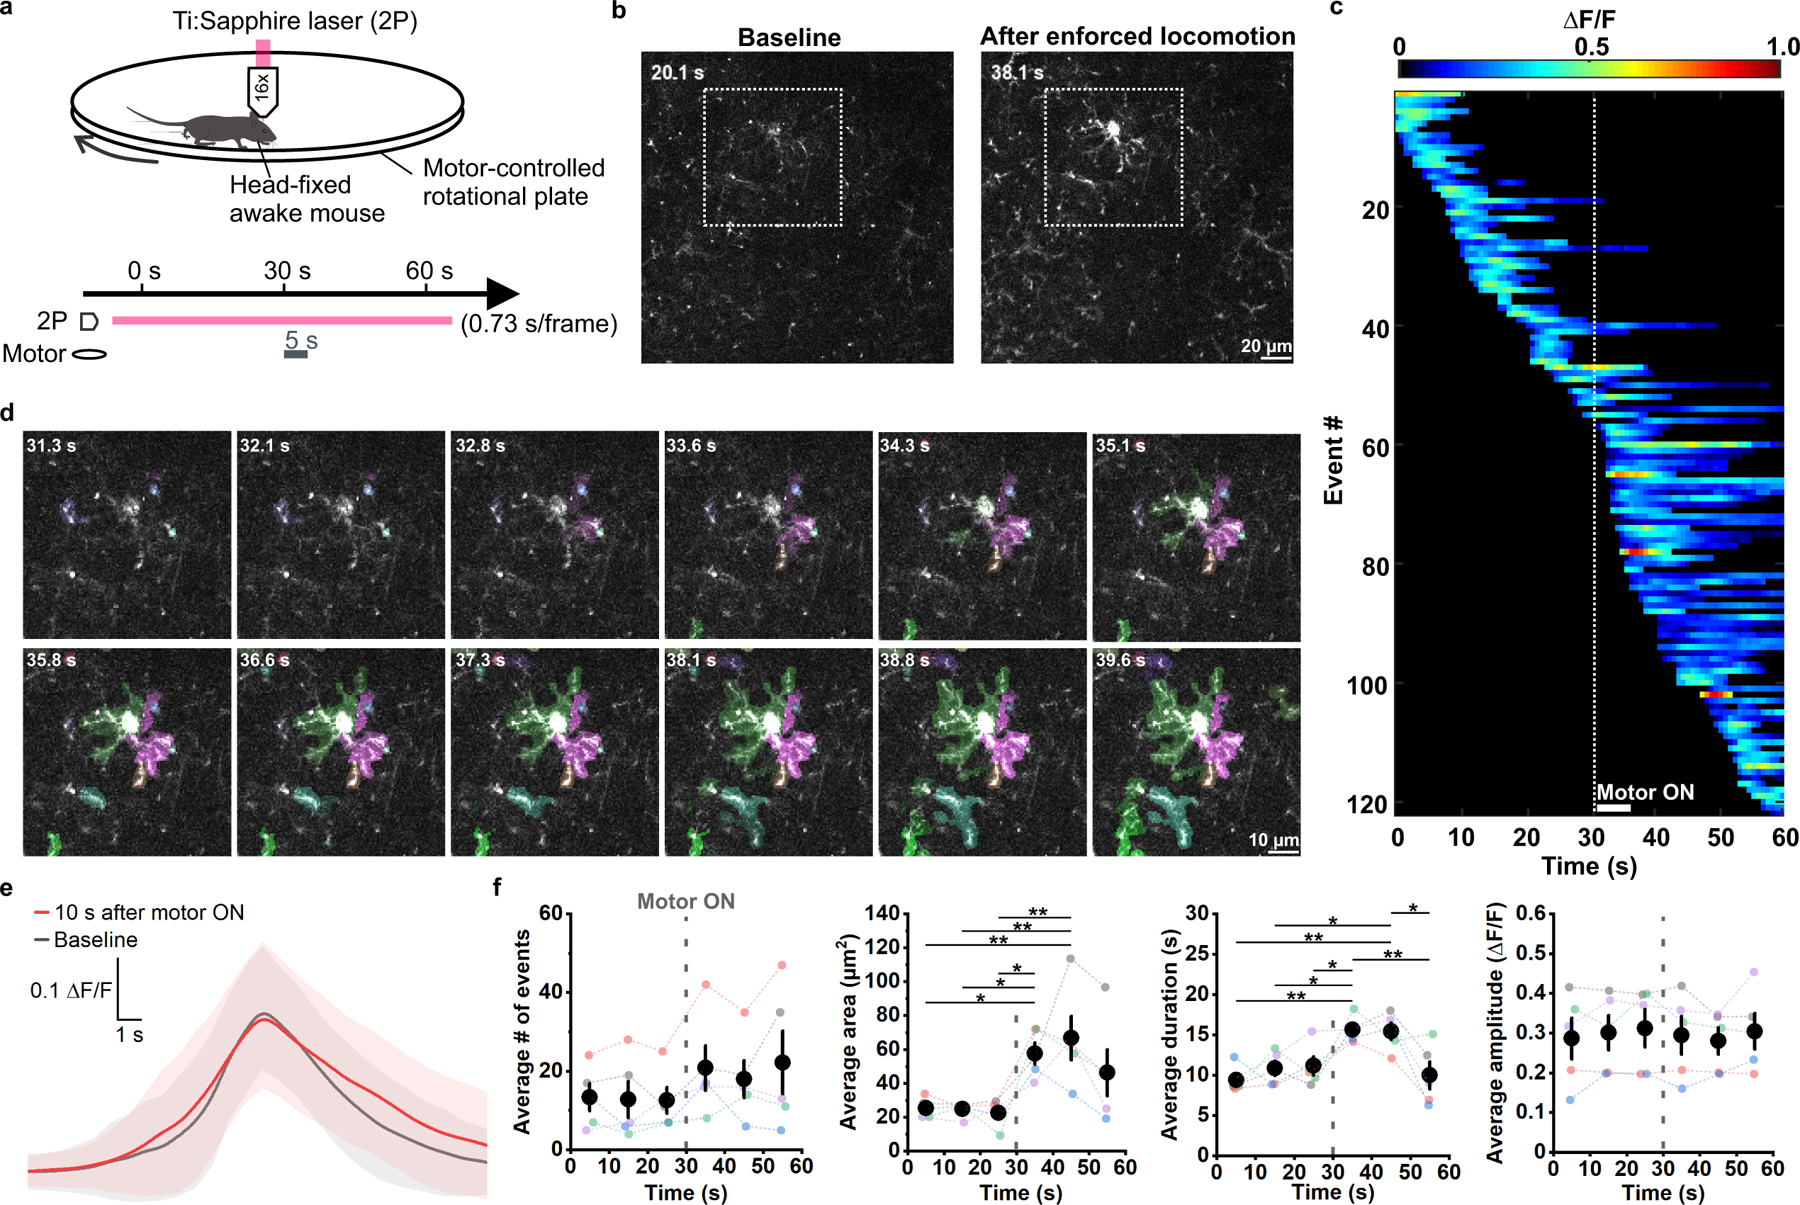
a, Schematic illustration of the experiment setup and design. During a 1 min recording window, enforced locomotion was triggered (Motor ON) at 30 s for 5 s. b, Representative 2P images showing OPC Ca2+ activity at baseline (20.1 s) and after enforced locomotion was triggered (38.1 s). c, A representative heatmap showing OPC Ca2+ events sorted according to their time of onset during the 1 min recording. Dotted line indicates the time when locomotion was induced. d, Frame-by-frame views of Ca2+ events (randomly pseudocolored) triggered by enforced locomotion. Cell highlighted by the white square in b. e, Average ΔF/F traces of Ca2+ events that occurred during baseline (gray) and 10 s after onset of enforced locomotion (red) aligned to their peaks. Shaded areas represent standard deviation. n = 114 baseline events and 131 enforced locomotion events in 5 mice. f, Quantification of the average number, area, amplitude, and duration of OPC Ca2+ events during the recording (binned by a 10-second interval). Gray dashed lines indicate onset of enforced locomotion. Black filled circles and error bars represent mean ± SEM. One-Way Repeated Measure ANOVA. Average # of events: F = 2.0814, p = 0.1013; Average area: F = 1.5205, p = 0.0300; Average duration: F = 1.8837, p = 0.0173; Average amplitude: F = 1.5530, p = 0.5725. Post-hoc: Tukey. n = 5 recordings from 5 mice.
NE release during arousal enhances OPC Ca2+ activity
The enhancement of OPC activity during enforced locomotion suggests that these cells may be impacted by neuromodulators. Indeed, in quietly resting mice, OPC Ca2+ event frequency was suppressed 20 minutes after administration of chlorprothixene (CPX) (Fig. 4 and Extended Data Fig. 5), a sedative that inhibits a variety of neuromodulatory receptors. As CPX strongly antagonizes α1 adrenergic receptors31, which have been shown through in vitro pharmacology32, transcriptional profiling12 and reporter gene expression33 to be expressed by OPCs, we examined the involvement of noradrenergic signaling. In vivo administration of Prz, an antagonist of α1 adrenergic receptors, or dexmedetomidine (Dex), an α2 adrenergic receptor agonist that inhibits NE release, both suppressed OPC Ca2+ event frequency (Fig. 4), suggesting that NE modulates OPC Ca2+ activity in vivo. Similar to the effects of isoflurane-induced anesthesia, neither event amplitude nor duration were affected by these pharmacological manipulations, suggesting that adrenergic receptors primarily influence the probability of an event occurring, rather than the spatial and temporal profile of Ca2+ induced during an event.
Figure 4. OPC Ca2+ activity is reduced when noradrenergic signaling is inhibited.
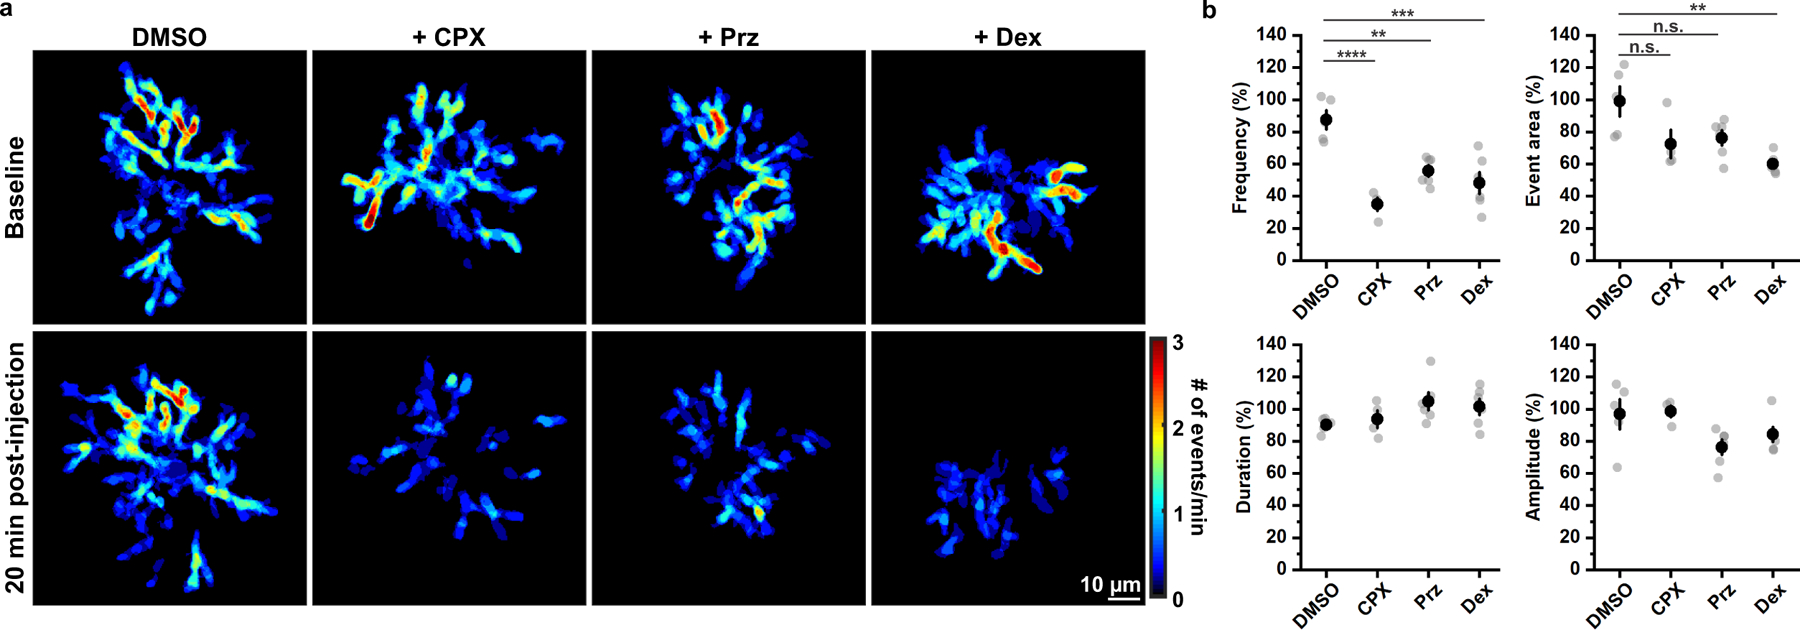
a, Representative heatmaps showing suppression of OPC Ca2+ activity by chlorprothixene (CPX, 5 mg/kg), prazosin (Prz, 3 mg/kg) and dexmedetomidine (Dex, 0.1 mg/kg), respectively. DMSO was used as the solvent control. b, Quantification of the effects on noradrenergic modulators. Black filled circles and error bars represent mean ± SEM. n = 5 OPCs from 5 mice for DMSO, 4 OPCs from 4 mice for CPX, 6 OPCs from 6 mice for Prz and 6 OPCs from 6 mice for Dex. Frequency: F = 15.1469, p = 0.0000 (One-Way ANOVA); Event area: Chi-Square = 10.4329, p = 0.0152 (Kruskal-Wallis ANOVA); Duration: F = 1.9732, p = 0.1563; Amplitude: F = 3.13557, p = 0.0528 (One-Way ANOVA). Post-hoc: Tukey. n.s.: not significant.
OPCs are directly responsive to NE
To determine if NE has direct excitatory effects on OPCs, we measured the response of OPCs to adrenergic receptor agonists in acute cortical brain slices prepared from PDGFRα-CreER;mGCaMP6s mice. OPCs imaged across all layers in different cortical regions (visual and somatosensory cortex) exhibited similar focal Ca2+ transients in their processes; however, these events were less frequent and more prolonged compared to events in vivo (Fig. 5a), differences that may reflect the lower temperature (room temperature vs. body temperature), and the preparation, in which connections with other brain areas are severed. To determine if these Ca2+ transients were dependent on synaptic activity, we exposed slices to tetrodotoxin (TTX, 1 μM), NBQX (10 μM), CPP (10 μM) and SR 95531 (20 μM) to block voltage-gated Na+ channels, AMPA receptors, NMDA receptors and GABA-A receptors, respectively. Remarkably, exposure to these antagonists did not alter the frequency, area, or duration of spontaneous Ca2+ events in OPCs (Fig. 5b), suggesting that these events arise primarily from intrinsic processes, rather than engagement of neurotransmitter receptors during neuronal activity.
Figure 5. OPC Ca2+ transients evoked by the α1 adrenergic receptor agonist are independent of synaptic activity in vitro.
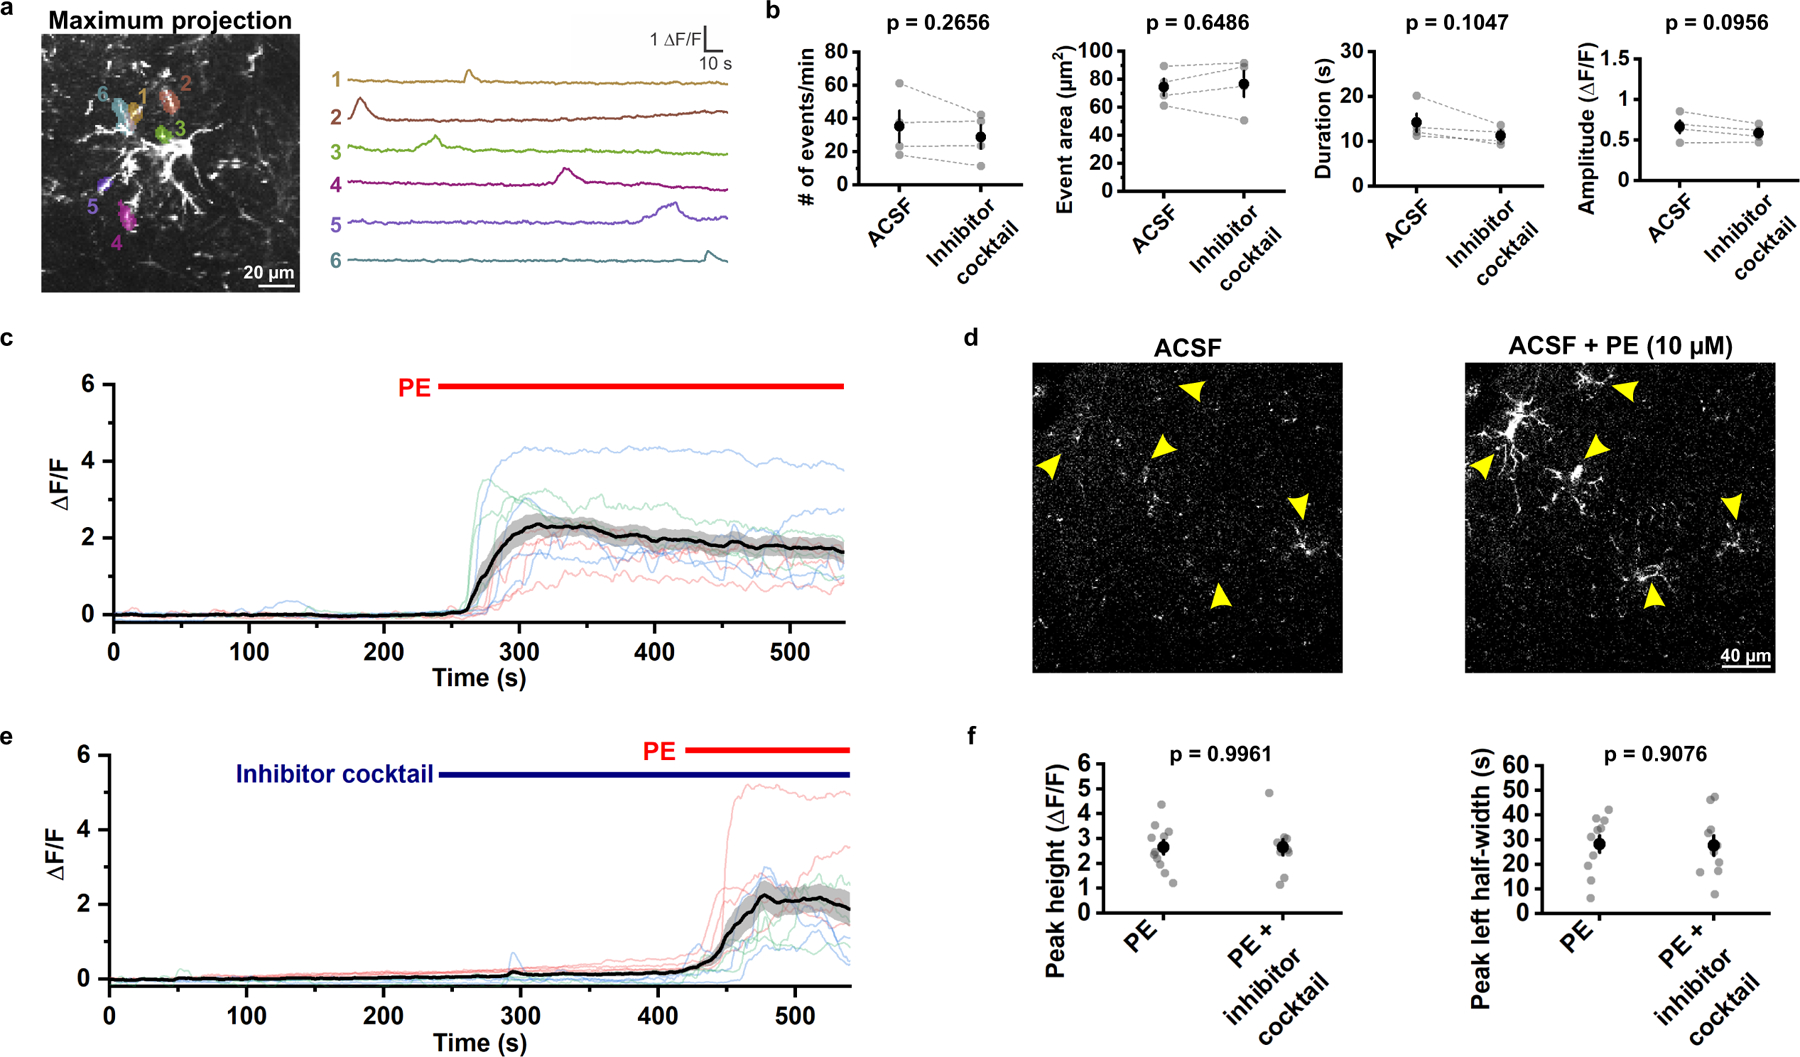
a, Example ΔF/F traces of OPC membrane Ca2+ transients observed in layer I of acute cortical slices (close to somatosensory cortex) in ACSF at RT. The morphology of mGCaMP6s-expressing OPC was visualized by perfusing 10 μM phenylephrine (PE) at the end of the recording (also see in c). b, Comparison of average event frequency, area, amplitude and duration of OPC membrane Ca2+ transients across all cortical layers with and without the inhibitor solution containing: TTX (1 μM), NBQX (10 μM), CPP (10 μM) and SR 95531 (20 μM). Black filled circles and error bars represent mean ± SEM. n = 4 recordings from 4 mice. Paired sample Student’s t-test, two-sided. c, Quantification of PE-evoked Ca2+ transients induced in OPCs (see text for details). The black line and the shaded area represent mean ± SEM. n = 11 OPCs from 3 mice. d, Representative images showing evoked Ca2+ increases in mGCaMP6s-expressing OPCs (yellow arrowheads) after exposure to PE (ACSF + PE) compared to ACSF alone (ACSF). e, ΔF/F quantification from 10 OPCs in 3 mice when exposed to PE in the presence of the inhibitor solution. The black line and the shaded area represent mean ± SEM. f, Quantification of PE-evoked OPC Ca2+ increase in the presence and absence of the inhibitor solution. Black filled circles and error bars represent mean ± SEM. n = 11 OPCs from 3 mice for PE; 10 OPCs from 3 mice for PE + inhibitor solution. Student’s t-test, two-sided.
To determine if direct activation of adrenergic receptors on OPCs is sufficient to alter Ca2+ activity, we exposed OPCs to the α1 adrenergic receptor agonist phenylephrine (PE, 10 μM). PE induced a dramatic increase in Ca2+ throughout the cell (Fig. 5c, d and Supplementary Video 4). To determine if synaptic release of glutamate and GABA contribute to the PE-induced OPC Ca2+ influx, PE was administered in the presence of the neuronal activity inhibitor cocktail (TTX, NBQX, CPP, SR 95531) (Fig. 5e). Neuronal activity inhibitors did not affect the amplitude (peak height) and the rise time (left half-width) of the PE-induced OPC Ca2+ increase (Fig. 5f), consistent with the lack of change in OPC Ca2+ levels to local activity in vivo (see Extended Data Fig. 4), Together, these results suggest that cortical OPCs express functional α1 adrenergic receptors that can increase intracellular [Ca2+], providing an explanation for the increase in OPC Ca2+ activity observed during periods of enhanced arousal in vivo.
NE enhances OPC Ca2+ activity via α1A adrenergic receptors
To assess which α adrenoceptors contribute to OPC Ca2+ levels in vivo, we examined the transcriptional profile of mouse cortical OPCs12,14. Among the nine different subtypes of adrenergic receptors, transcripts for Gq-coupled α1A adrenergic receptors (Adra1a) were most abundant in OPCs12,14. Single molecule fluorescence in situ hybridization (smFISH) in visual cortex revealed that Adra1a mRNA co-localized with Pdgfra mRNA (Extended Data Fig. 6a), in accordance with the presence of EGFP+ OPCs in transgenic α1A-AR-EGFP reporter mice33. However, transcriptional profiling12,14, in situ hybridization (see Extended Data Fig. 6a), and functional analyses34 indicate that α1A adrenergic receptors are not exclusively expressed by OPCs. To determine if α1A adrenergic receptors in OPCs mediate their responsiveness to NE, we conditionally knocked out Adra1a in OPCs by crossing Adra1afl/fl mice34 with PDGFRα-CreER;Rosa26-lsl-mGCaMP6s mice (OPC α1A cKO mice). In acute slices prepared from these mice after TAM administration (see Methods), PE no longer elicited a rise in Ca2+ in neuronal activity blockers (TTX, NBQX, CPP, SR 95531), although Ca2+ could still be elevated by ionomycin (Fig. 6a, b). To assess whether loss of α1A adrenergic receptors altered OPC Ca2+ activity in vivo, we analyzed their responses using 2P imaging. OPC α1A cKO mice that were in a quiet resting state exhibited ~50% fewer Ca2+ events compared to controls (Fig. 6c, d), suggesting that OPCs are subject to modulation by NE in the resting state; the amplitude, area and duration of these events were not affected, providing further evidence that NE primarily increases the probability of an event occurring, rather than being directly coupled to the Ca2+ rise itself. Deletion of Adra1a from OPCs also prevented enhancement of OPC Ca2+ activity during enforced locomotion (Fig. 6e, f), indicating that activation of OPC α1A adrenoceptors is responsible for enhancing OPC Ca2+ activity during periods of arousal.
Figure 6. Deletion of Adra1a from OPCs eliminates alpha adrenoceptor mediated Ca2+ signaling.
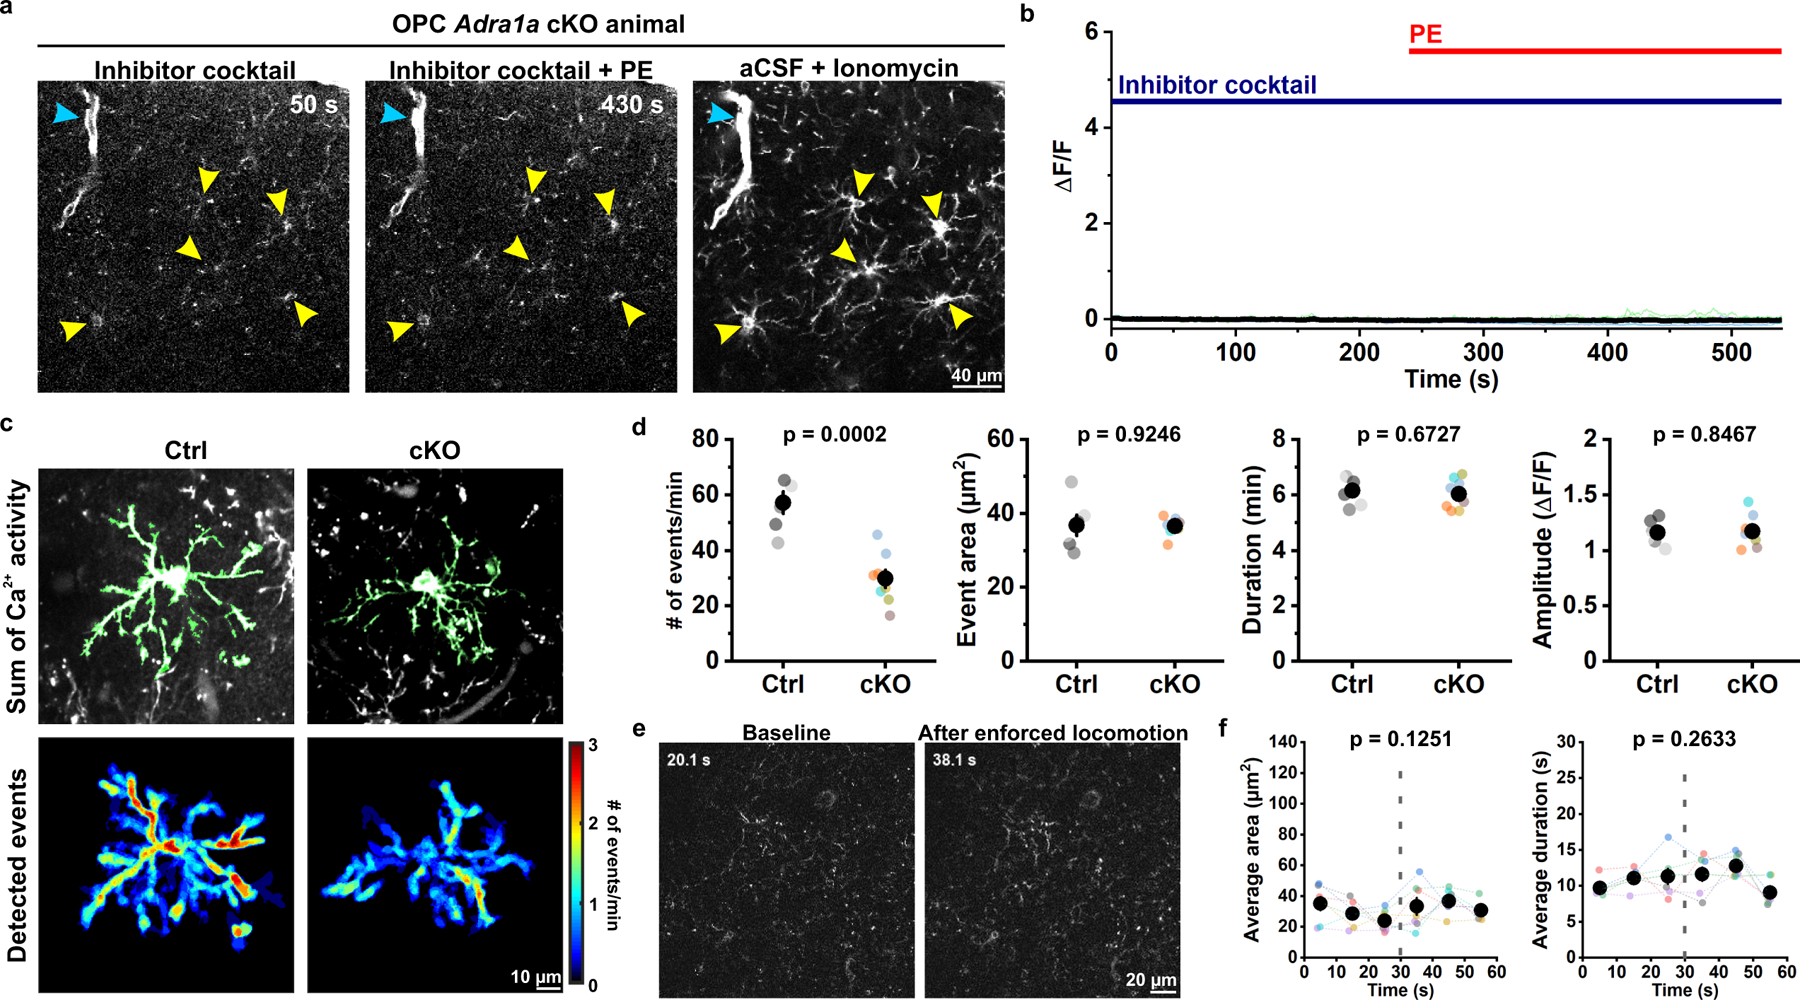
a, Representative images showing that PE failed to evoke Ca2+ increases in mGCaMP6s-expressing OPCs (yellow arrowheads) in acute cortical slices from PDGFRα-CreER;Rosa26-lsl-mGCaMP6s;Adra1acKO/cKO animals (cKO). Note that PDGFRα+ perivascular fibroblasts (cyan arrowheads) were stimulated by PE, while Adra1a cKO OPCs were not. Ionomycin was applied at the end of the recording to identify mGCaMP6s-expressing OPCs. b, Quantification of the response of OPCs to PE. Black line and shaded area represent mean ± SEM. n = 18 OPCs, 3 mice. c, Representative images of summed Ca2+ activity and heatmaps of detected events showing cKO OPCs exhibited less frequent membrane Ca2+ transients than control (Ctrl, PDGFRα-CreER;Rosa26-lsl-mGCaMP6s;Adra1awt/wt) animals. d, Quantification of the response of OPCs to PE. Black filled circles and error bars represent mean ± SEM. n = 6 OPCs from 6 mice for Ctrl; 8 OPCs from 6 mice for cKO. Student’s t-test, two-sided. e, Representative images showing OPC Ca2+ activity in Adra1a cKO mice was not increased after enforced locomotion. f, Quantification of response of OPCs to enforced locomotion. Gray dotted lines indicate the onset of enforced locomotion. Black filled circles and error bars represent mean ± SEM. n = 7 recordings from 7 mice (color-coded). One-Way Repeated Measure ANOVA. Average area: F = 7.2384. Average duration: F = 3.0761. Post-hoc: Tukey.
OPCs Ca2+ activity declines as they differentiate
Adra1a expression decreases as OPCs differentiate, and is very low in mature oligodendrocytes12,14, suggesting that OPCs may be particularly sensitive to NE modulation. Indeed, smFISH in cortical brain sections revealed that Adra1a mRNA was less abundant in premyelinating oligodendrocytes (Extended Data Fig. 6b, c), identified by their expression of lncOL1, a long noncoding RNA specifically expressed by pre-myelinating oligodendrocytes35. To determine if noradrenergic modulation of Ca2+ activity declines with oligodendrocyte lineage progression, we performed longitudinal 2P Ca2+ imaging in vivo to monitor the Ca2+ activity of individual OPCs for at least 28 days. Since OPCs continue to differentiate in the adult cortex, we predicted that some tracked cells would begin this transition during the imaging period. Of nine OPCs imaged from seven animals, four OPCs exhibited persistent Ca2+ activity (Fig. 7a, b, green cell; Fig 7d, green lines). Four other OPCs exhibited a precipitous decline in Ca2+ events (frequency, amplitude, and duration) that began at different times during the imaging period (Fig. 7a, c, red cell; Fig. 7d, red lines). The Ca2+ activity of one additional OPC also declined, but was followed by a dramatic increase of fluorescence, somatic swelling, and process fragmentation, consistent with cell death (Extended Data Fig. 7; Fig. 7d, gray line).
Figure 7. Spontaneous Ca2+ transients in OPCs progressively decline as they differentiate into myelinating oligodendrocytes.
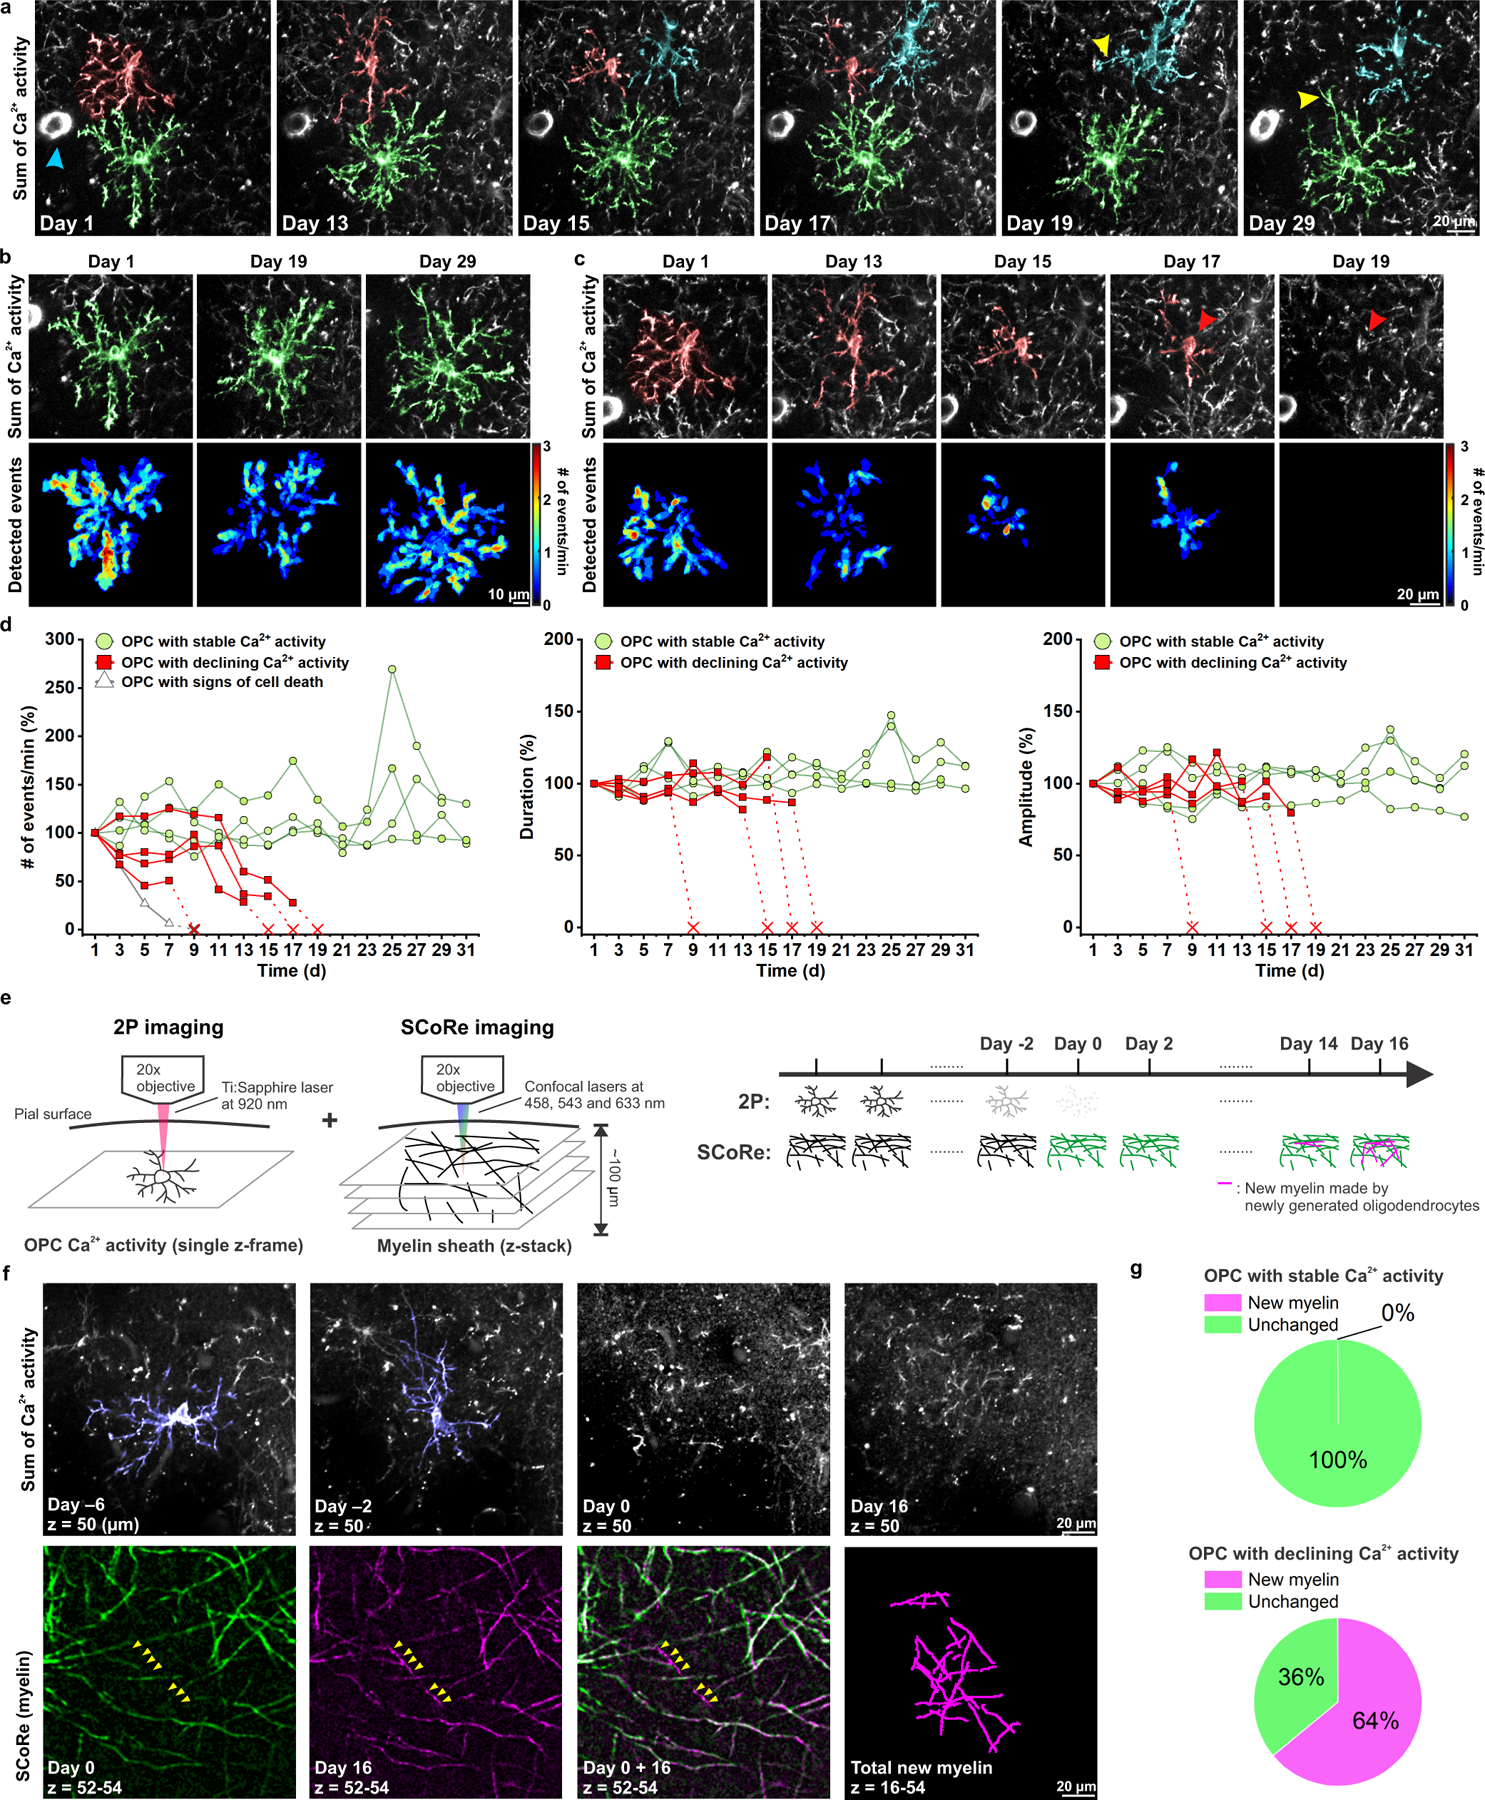
a, Representative images showing diverse Ca2+ dynamics within different OPCs. Cyan arrowhead indicates PDGFRα+ perivascular fibroblasts, which were used as landmarks to register images across different time points. The OPC highlighted in green persisted throughout the recording. The OPC highlighted in red became undetectable at Day 19, while a nearby OPC (cyan) extended its processes (yellow arrowhead) to the space now left unoccupied by the absent OPC. A similar phenomenon was also seen with the neighboring OPC highlighted in green on Day 29 (yellow arrowhead). b, Heatmaps showing the Ca2+ activity of the OPC highlighted in green on Day 1, 19 and 29. c, Heatmaps showing the Ca2+ activity of the OPC highlighted in red on Day 1, 13, 15, 17 and 19. The red arrowhead indicates the position of the cell body of the disappearing OPC (red) on Day 17. d, Quantification of the OPC Ca2+ event frequency, amplitude, and duration over time (n = 9 cells from 6 mice). e, Schematic illustration of the dual longitudinal imaging experiment using both 2P to detect Ca2+ changes and SCoRe imaging to detect changes in myelin (see Methods). f, An example of an OPC (blue) with declining activity, and the local myelin pattern surrounding its cell body on the day the OPC became undetectable (Day 0, green), and 16 days after the disappearance (Day 16, magenta). Yellow arrowheads indicate the new myelin found 16 days after the disappearance of the OPC. g, Quantification of f. n = 18 cells (7 stable and 11 declining) from 4 mice.
OPCs maintain discrete territories in the CNS through repulsive interactions, and loss of one cell through differentiation or death is accompanied by rapid invasion of the territory of the lost cell by neighboring OPCs24. If the decline in Ca2+ activity observed in OPCs was due to cell loss due to death or differentiation, territory invasion should be observed. Indeed, this behavior occurred consistently for cells with declining Ca2+ activity (Fig. 7a, cyan and green cells, yellow arrowheads), suggesting that these changes in activity reflect loss of OPCs through differentiation and death.
To test the hypothesis that Ca2+ signaling rapidly declines during oligodendrocyte lineage progression, we simultaneously monitored Ca2+ activity within individual OPCs and local formation of myelin sheaths, by pairing in vivo 2P Ca2+ imaging in mice with SCoRE imaging36, which allows visualization of myelin sheaths by reflectance. Layer I OPCs were chosen for this analysis, because myelin sheaths in this layer are predominantly oriented horizontal to the cortical surface and thus optimal for SCoRE imaging36. Once Ca2+ activity in OPCs became undetectable (designated as Day 0), local myelin patterns were visualized for another 14–16 days, the period required for myelin sheath production4,37. For OPCs that exhibited stable Ca2+ activity (7/18 cells), no change in myelin patterns were detected (Extended Data Fig. 8; Fig. 7g). In contrast, for 11 cells that exhibited a progressive decline in Ca2+ activity, new myelin sheaths appeared in 7 cells (64%) within the imaging volume 14–16 days later (Fig. 7f, g). Ca2+ transients were not detected in premyelinating cells over this period (Extended Data Fig. 9a). Furthermore, when mGCaMP6s was expressed specifically in oligodendrocytes (Extended Data Fig. 9b-c), only rare Ca2+ transients were detected in myelin sheaths (Supplementary Video 5 and Extended Data Fig. 9d-i), suggesting that this dynamic Ca2+ behavior is primarily associated with the progenitor state. As OPCs differentiated, the frequency of Ca2+ events decreased, but their amplitude and duration were unaffected (see Fig. 7d), consistent with a decline in adrenergic modulation (see Fig. 4 and Fig. 6d). The four OPCs that did not produce new myelin sheaths may also differentiated, but failed to stably integrate2. Together, these results reveal that OPC Ca2+ activity rapidly declines as they mature into myelinating oligodendrocytes.
Alpha adrenergic signaling enhances OPC proliferation
To determine if NE directly modulates OPC behavior, we performed an unbiased, transcriptomic-based assessment of biological processes altered in OPCs by activation of α1 adrenergic receptors. Primary cultures of OPCs were exposed to PE (20 μM) for 1 hour, and total RNA was extracted and subjected to bulk RNA sequencing. Gene ontology (GO) enrichment analysis revealed that the top 5 biological processes (BP) up-regulated in OPCs by PE were: DNA replication, DNA metabolic process, G1/S transition of mitotic cell cycle, DNA-dependent DNA replication, and cell cycle G1/S phase transition (Extended Data Fig. 10a), suggesting that activation of α1 adrenergic signaling in OPCs promotes mitosis. In contrast, the top biological process down-regulated was oligodendrocyte differentiation (Extended Data Fig. 10b). Indeed, expression of several transcription factors required for oligodendrocyte differentiation, such as Myrf (myelin regulatory factor), Sox10 (SRY-related HMG-box 8), and Sox8 (SRY-related HMG-box 8), were significantly decreased after PE exposure (Log2 fold change > −0.25, false discovery rate < 0.05) (Extended Data Fig. 10c). Consistent with the RNAseq and GO enrichment analysis, live cell imaging of primary cultured OPCs revealed that 77± 7% of OPCs divided within 24 hours after PE stimulation (+ PE) compared to 22 ± 6% of OPCs in control (Extended Data Fig. 10d,e). Fewer than five OPCs differentiated among the 100–200 cells that were tracked during each experiment (n = 3). PE did not alter OPC differentiation when PDGF was withdrawn from the culture medium38 (Extended Data Fig. 10f, g). As there is extensive evidence of convergence between G-protein coupled receptors and receptor tyrosine kinase signaling cascades39, α1A receptors may modulate the sensitivity or efficacy of PDGF receptor signaling in OPCs to promote proliferation.
To test whether engagement of α1 adrenergic receptors on OPCs promotes their proliferation in vivo, we compared the proliferation rate of OPCs in control and OPC α1A cKO mice, by exposing mice to the nucleotide analog EdU (5-ethynyl-2’-deoxyuridine). Administration of a single dose of TAM led to sparse Cre-dependent recombination in OPCs, allowing assessment of the integration of EdU in recombined OPCs (GFP+PDGFRα+) and non-recombined OPCs (GFP−PDGFRα+) in the same microenvironment (Fig. 8a, b). Fewer EdU+GFP+PDGFRα+ cells were observed in α1A cKO than control mice (Fig. 8b, c), indicating that OPCs lacking Adra1a were less likely to proliferate. If OPCs lacking Adra1a expression are less proliferative, over time there should be fewer α1A cKO OPCs overall and fewer α1A cKO oligodendrocytes generated from these altered progenitors. Consistent with this hypothesis, fewer recombined OPCs (GFP+PDGFRα+) and fewer newly formed oligodendrocytes (GFP+CC1+) were observed two months after TAM-induced recombination in α1A cKO mice (Fig. 8d, e). Together, these results indicate that NE acts on OPC α1A adrenoceptors to promote proliferation of oligodendrocyte progenitors in vivo.
Figure 8. Selective deletion of Adra1a from OPCs reduces their proliferation.
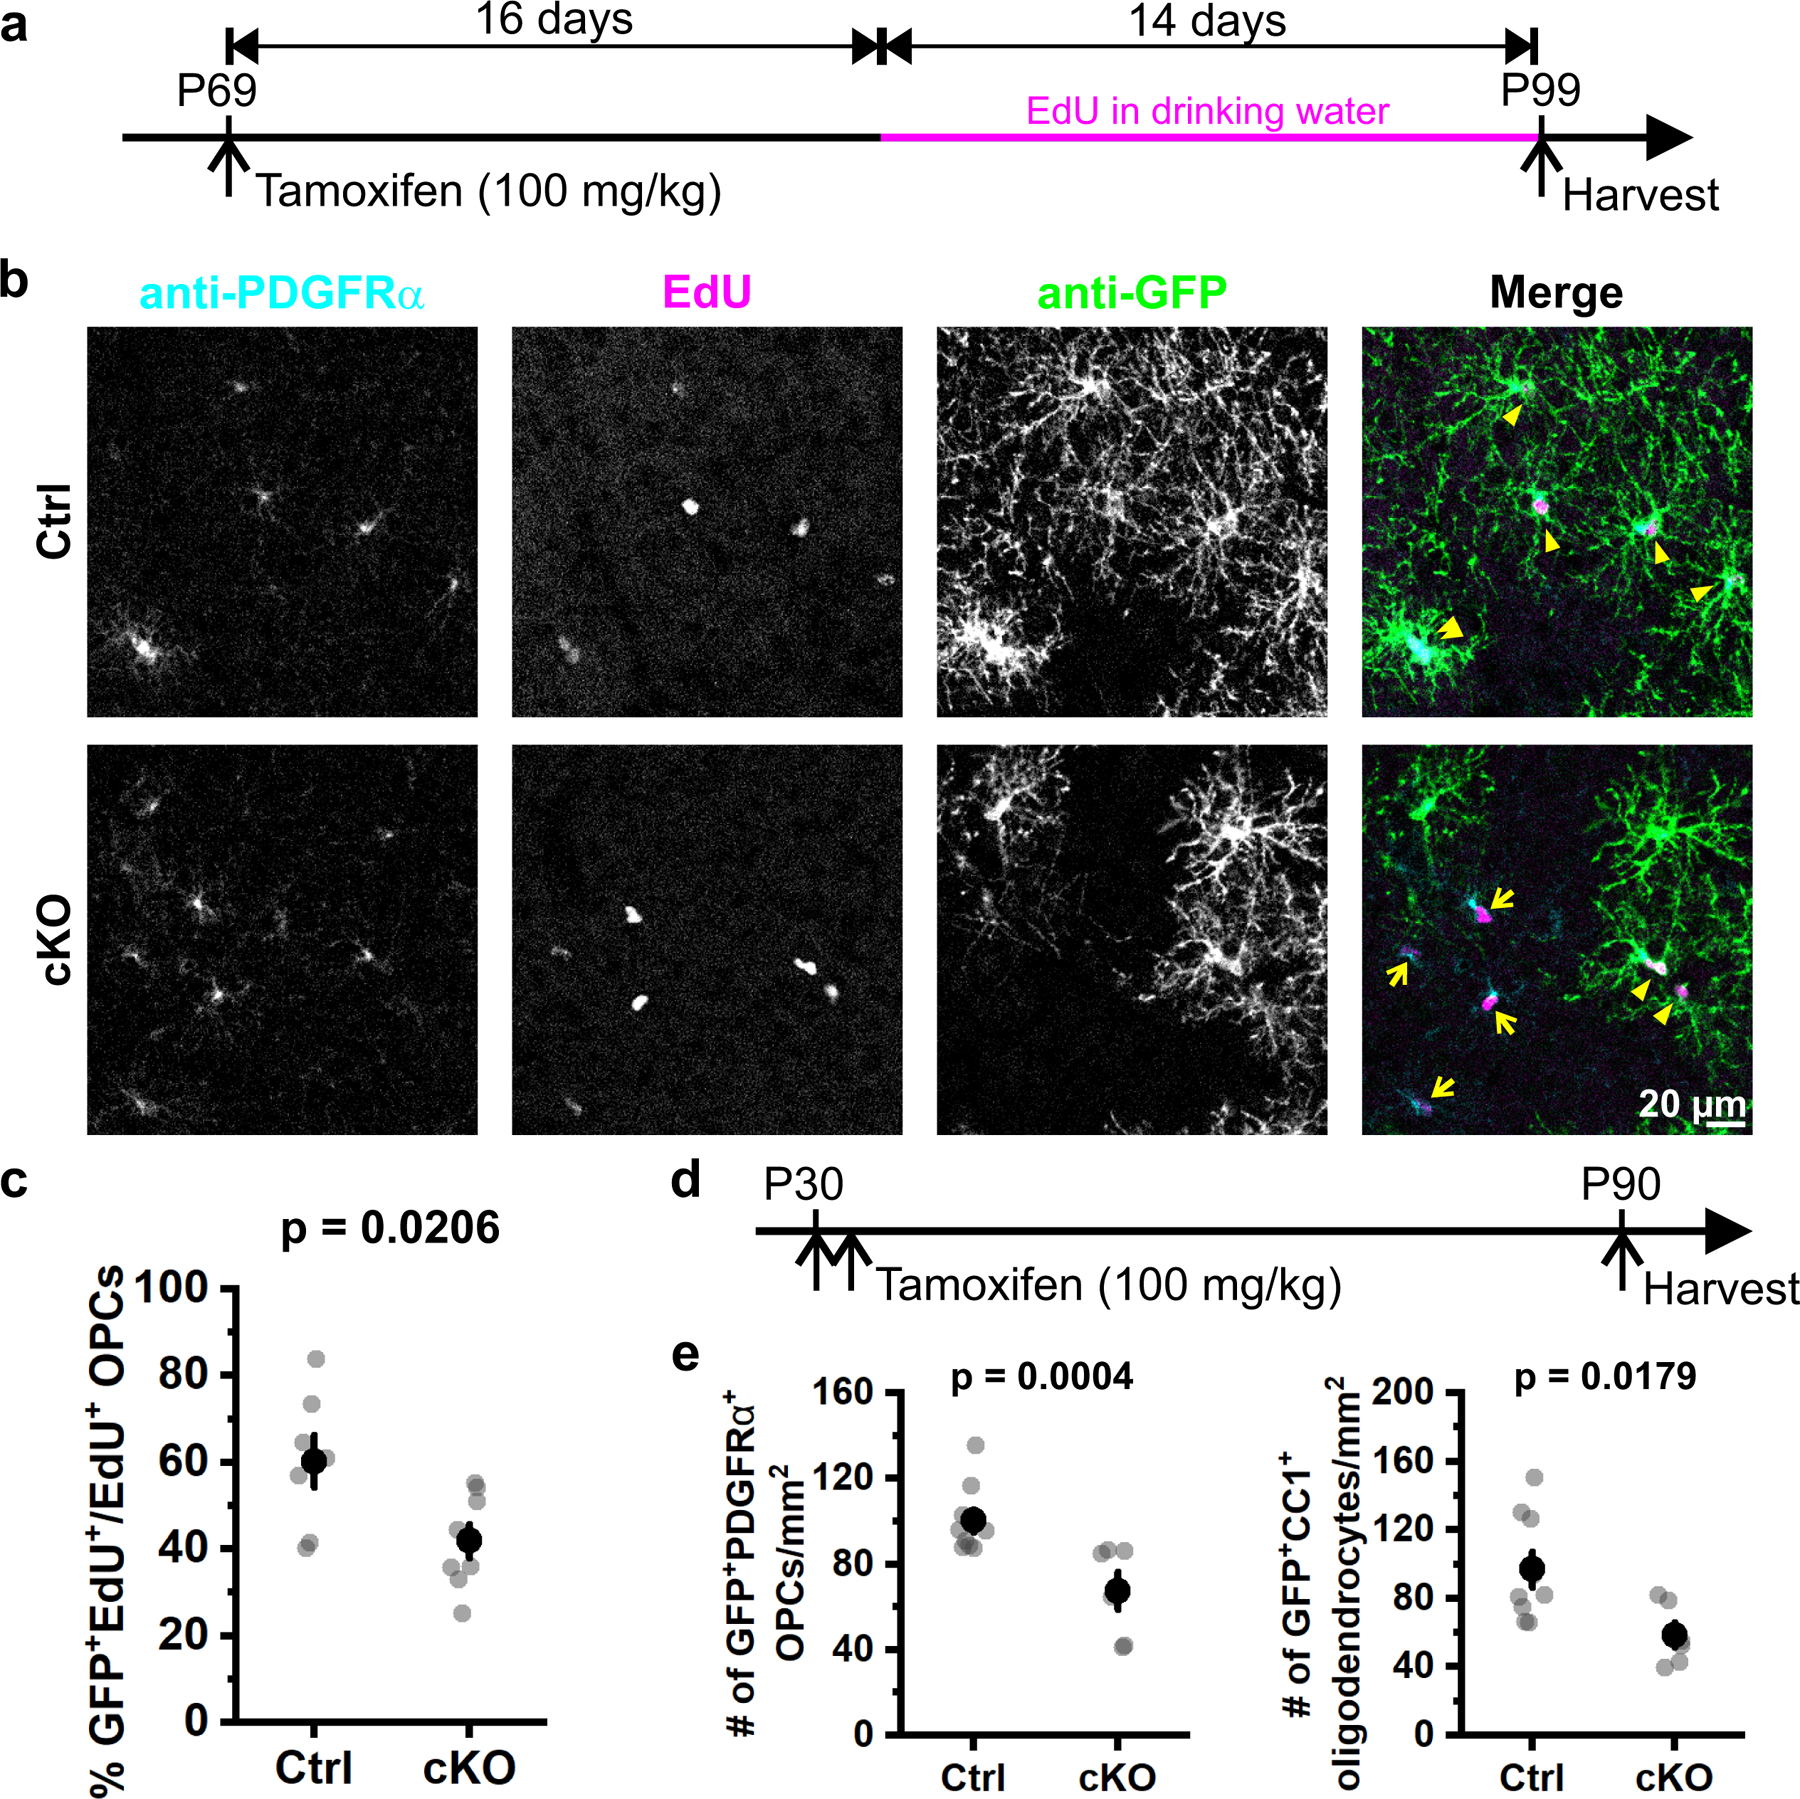
a, Schematic illustration of the research design. Both control (Ctrl, PDGFRα-CreER;Rosa26-lsl-mGCaMP6s;Adra1awt/wt) and Adra1a cKO animals (cKO, PDGFRα-CreER;Rosa26-lsl-mGCaMP6s;Adra1afl/fl) were given one injection (i.p.) of tamoxifen at P69 to sparsely induce Cre-mediated recombination in OPCs. EdU (5-ethynyl-2’-deoxyuridine) was administered in drinking water 16 days later to label proliferating cells before brains were harvested at P99. b, Representative images illustrating EdU+ OPCs (PDGFRα+EdU+) in the mouse visual cortex. Yellow arrows highlight OPCs that were not recombined (still expressing ADRA1A) and proliferated during P85 – P99 (PDGFRα+EdU+GFP−). c, Quantification of OPC proliferation. Each data point (gray dot) represents an average of 3–4 cortical slices per animal. Black filled circles and error bars represent mean ± SEM. Ctrl: n = 7 mice; cKO: n = 8 mice. Student’s t-test, two-sided. d, Schematic illustration of the research design for OPC fate-mapping. e, Quantification of OPCs (GFP+PDGFRα+) and oligodendrocytes (GFP+CC1+) in control and Adra1a cKO mice. Each data point (gray dot) represents an average from 3–4 cortical slices per animal. Black filled circles and error bars represent mean ± SEM. Ctrl: n = 9 mice; cKO: n = 6 mice. Student’s t-test, two-sided.
Discussion
Neurotransmitters enable rapid signaling between neurons, enabling sensory processing, motor control and higher cognitive functions. Although glial cells are also responsive to neurotransmitters, we know comparatively little about the mechanisms used for neuron-glial communication or the consequences of this intercellular signaling. OPCs express a remarkable diversity of neurotransmitter receptors and their proliferation and differentiation are profoundly influenced by neural activity, suggesting that neurotransmitter signaling serves as a nexus to modify their homeostatic and regenerative behaviors. OPCs are unique among glial cells in that they form direct synapses with neurons, serving exclusively as a postsynaptic partner15. Prior studies have shown that direct activation of Ca2+-permeable ionotropic receptors19,40,41 or indirect activation of Ca2+ channels through depolarization42 can lead to cytosolic Ca2+ changes within OPC processes, and that Ca2+ signaling can modulate their migration, proliferation and differentiation18,42,43, as well as oligodendrocyte regeneration after CNS injury20. Thus, it is surprising that this imaging with mGCaMP6s did not reveal focal Ca2+ transients within OPC processes in V1 when mice were exposed to intense light (see Extended Data Fig. 4) or neuronal activity-associated OPC Ca2+ events in acute brain slices (see Fig. 5). However, detecting Ca2+ influx through AMPA receptors is challenging, because they become inactivate rapidly, producing highly focal Ca2+ transients, and GCaMP must compete with endogenous buffers that may exhibit faster binding rates. Moreover, synaptic activation of AMPA receptors only leads to small depolarizations15, due to the high resting membrane K+ conductance of OPCs44, which may limit activation of voltage-gated Ca2+ channels. It is also possible that these receptors are only activated in response to specific patterns of activity, such as burst firing, which may not have been present in these studies. Ca2+ influx through AMPA receptors occurs only when GluA2 subunits are absent. The expression of GluA2, and other Ca2+ permeable channels, such as NMDA receptors and voltage gated Ca2+ channels vary among OPCs45 and has not been assessed functionally in this region of the adult cerebral cortex. Future studies using more sensitive Ca2+ sensors or Ca2+ sensors placed closer to AMPA receptors may yet reveal their contribution to OPC Ca2+ signaling.
In the cerebral cortex, NE is released from varicosities along highly ramified axons that extend from neurons that have somata located in the locus coeruleus (LC)46. By utilizing a volume rather than direct synaptic mode of transmission, LC neurons can simultaneously modulate the activity of diverse targets near these projections. Previous studies indicate that glial cells are a key target of noradrenergic signaling30,47,48, suppressing filopodial dynamics in microglia by activating β2-adrenergic receptors47, enhancing neurogenesis by activating β3-adrenergic receptors on radial glia in the hippocampus48, and triggering Ca2+ elevations in astrocytes by activating Gq-coupled α1A adrenoceptors34. Engagement of astrocyte adrenergic receptors has been demonstrated in vivo in response to state transitions, such as sleep-wake49 and novel or unexpected experiences30,50, elevating intracellular Ca2+ throughout the astrocyte network in concert with cortical neuron depolarization. Although activation of α1A adrenoceptors on OPCs in vitro leads to cell-wide increases in Ca2+ similar to astrocytes (see Fig. 5), NE release in vivo primarily enhances the magnitude of localized transients within OPC processes, amplifying intrinsic activity patterns (see Fig. 3). The distinct characteristics of OPC α1A adrenoceptor signaling in the intact brain suggests that the concentration of NE that reaches these receptors in vivo is lower than can be achieved through exposure to exogenous agonists. Although our genetic studies suggest that α1A adrenergic receptors are primarily responsible for the NE-induced Ca2+ signaling and proliferation, and the response to PE was abolished in OPCs in α1A adrenoceptor cKO mice (see Fig. 6b), transcriptional profiling indicates that OPCs also express α1B and α1D adrenoceptor mRNA12,51, raising the possibility that multiple α1 adrenoceptors could act synergistically to modulate OPC behavior.
Suppressing NE release or preventing OPC responsiveness to NE reduced, but did not abolish, OPC Ca2+ transients, and these events persisted in acute slices where LC axons are severed and neuronal activity was blocked, suggesting that the primary effect of NE is to modulate a separate, endogenous internal Ca2+ release process. As enhanced process activity was not correlated with or predictive of somatic events, unlike neuronal dendrites, these results suggest that the target of noradrenergic modulation is located within discrete domains of OPC processes. Astrocytes also exhibit intrinsically generated ‘microdomain’ Ca2+ transients that are mediated, in part, through release from mitochondria during respiration52. Additional studies well be necessary to determine if OPC Ca2+ events also involve mitochondria.
As expected from the widespread activation of LC neurons during state transitions, OPCs throughout the imaging field exhibited similar Ca2+ activity enhancement during quiescence-active transitions (see Fig. 3), indicating that NE can exert a widespread modulatory effect on these progenitors. The activation of LC neurons is also associated with periods of wakefulness, with the highest tonic discharge occurring during sleep-wake transitions53, suggesting that OPC proliferation is subject to rhythmic changes in NE during the circadian cycle. Indeed, prior studies assessing cell cycle proteins54 and transcriptomic profiling of OPCs55 indicated that OPCs preferably enter S phase (DNA replication) during daytime (sleep/motor inactive phase)54,55. In primary cultures, OPC cell cycle length was estimated to be about 20–24 hours56 and a dividing cell usually spends 40–50% of time in G1 phase57, indicating that there is an 8–12 hour delay between the beginning of the cell cycle and when a cell enters S phase. Thus, cumulative activation of OPC α1 adrenoceptors during nighttime (awake/motor active phase) during the G0/G1 phase would be predicted to lead to S phase primarily during the daytime, consistent with our observation that PE significantly up-regulated genes involved in cell cycle G1/S transition in OPCs (see Extended Data Figure 10a). Future studies will be required to assess cell cycle length of individual OPCs in vivo and define how adrenergic receptors and Ca2+ activity alter these cell cycle transitions. Assessments of transcriptional changes using translating ribosome affinity purification (TRAP) and mRNA microarray analysis55, as well as microscopic structural studies58, also indicate that OPCs preferably to differentiate during nighttime (awake)55 and chronic sleep loss impairs myelin health58. Although we did not observe significant changes in OPC differentiation directly downstream of α1 adrenergic signaling (see Extended Data Figure 10f,g), NE may indirectly affect oligodendrogenesis through other mechanisms, such as promoting the release of pro-differentiation molecules.
Recent studies indicate that other neurotransmitter receptors, including Kappa opioid receptors22 and metabotropic M1 acetylcholine receptors23 expressed by OPCs can also influence their lineage progression, suggesting that these progenitors have the ability to sense the activity patterns of distinct subsets of neurons. Although it is not yet clear how OPCs integrate these diverse signals, behavioral manipulations such as intense motor learning can mobilize these progenitors to differentiate and produce additional myelin59, a phenomenon termed adaptive myelination. Such training paradigms induce a heightened state of arousal and are associated with increased activation of the LC and cortical NE release60. Expression of α1A adrenoceptors by OPCs may enable these progenitors to sense state changes associated with enhanced oligodendrogenesis, promoting resilient homeostasis in response to changes in life experience.
Methods
Animal care and use
Female and male adult mice were used for experiments and randomly assigned to experimental groups. No noticeable sex-specific behavioral or physiological phenotypes were observed throughout the research. All mice were healthy and none were excluded from the analysis. Mice that were used in this study were housed in groups no larger than five, and received food and water ad libitum. The vivarium was maintained at 18–23°C with 40–60% humidity and on a 12-hour light/dark cycle. All animal experiments were conducted in accordance with the National Institute of Health Guide for the Care and Use of Laboratory Animals and protocols approved by the Animal Care and Use Committee at Johns Hopkins University (#MO20M344). Mouse strains used in this study: CD-1 P4–7 wild-type and C57Bl/6N adult (8 weeks) wild-type mice were purchased from Charles River. PDGFRα-CreER; R26-lsl-mGCaMP6s mixed background, PDGFRα-CreER; R26-lsl-GCaMP6s mixed background, PDGFRα-CreER; R26-lsl-mGCaMP6s; Adra1afl/fl mixed background, and Mobp-iCreER; R26-lsl-mGCaMP6s mixed background mice were generated during this study and used from 8 weeks to 6 months old.
Generation of ROSA26 targeted conditional membrane-tethered and cytosolic GCaMP6s reporter mouse line
To localize GCaMP6s to the plasma membrane, we fused the gene sequence encoding the first 8 amino acids of the modified MARCKS sequence (MGCCFSKT) to the first methionine of GCaMP6s sequence (termed mGCaMP6s). CMV-βactin hybrid (CAG) promoter, which consists of three gene regulatory elements namely: 5′ cytomegalovirus early enhancer element, chicken β-actin promoter and rabbit b-globin intron, was used to enhance mGCaMP6s expression. A loxP flanked 3X SV40 polyA with FRT flanked Neomycin gene (loxP-STOP-loxP, “LSL”) “stopper” cassette was placed upstream of the coding sequence, preventing expression until cyclic recombinase (Cre) excises this gene sequence. Woodchuck hepatitis virus posttranscriptional regulatory element (WPRE) was sub-cloned at the 3′ end to further enhance mGCaMP6s expression (see Extended Data Fig. 1). The mGCaMP6s transgenic construct was targeted to the ubiquitously expressed ROSA26 locus. For a homologous recombination in mouse embryonic stem (ES) cells, gene-targeting vectors for mGCaMP6s was assembled into a ROSA26 targeting plasmid containing a 2.3 kb 5′ homology arm, 4.3 kb 3′ homology arm, and PGK-DTA (Diphtheria toxin fragment A, downstream of 3′ homology arm) for negative selection. ES cells, derived from a SV129 mouse strain, were electroporated with the AsiSI linearized targeting vectors. A nested PCR screening strategy along the 5′ homology arm was used to identify ES cell clones harboring the correct genomic targeting event. After confirmation of the karyotypes, correctly targeted ES cell clones were used to generate chimeric mice by injection into blastocysts derived from SV129 females at the Johns Hopkins University Transgenic Core Laboratory. Germ line transmission was achieved by breeding male chimeric founders to C57Bl/6N wild-type female mice. Routine genotyping of Rosa26-lsl-mGCaMP6s mice was performed by PCR using following primers: ROSA26-s (5′-ctctgctgcctcctggcttct-3′), ROSA26-as (5′-cgaggcggatcacaagcaata- 3′), CaM-s (5′-cacgtgatgacaaaccttgg-3′) and WPRE-as (5′-ggcattaaagcagcgtatcc-3′). These primers amplify a 327bp DNA fragment for the wildtype and a 245 bp fragment for mGCaMP6s targeted ROSA26 alleles in a Rosa26-lsl-mGCaMP6s transgenic mice. Rosa26-lsl-GCaMP6s was generated the same way without the insertion of the modified MARCKS sequence.
Tamoxifen preparation and administration
To induce GCaMP6s expression in PDGFRα-CreER;GCaMP6s, PDGFRα-CreER;mGCaMP6s, and Mobp-iCreER;mGCaMP6s transgenic mice, TAM (Sigma-Aldrich, T5648) was freshly prepared on the first day of the injection at 10 mg/mL in sunflower seed oil (Sigma-Aldrich, S5007) through intermittent sonication at room temperature (RT). Adult (> 8 weeks) mice were injected intraperitoneally (i.p.) with a dosage of 100 mg/kg body weight (b.w.) for five consecutive days, once per day. Every injection was at least 20 hours (hrs) apart. The remaining tamoxifen solution was stored at 4°C in the dark for no more than 5 days. All experiments were performed at least 2 weeks after the last tamoxifen injection. The experiments comparing the Ca2+ activity between control (PDGFRα-CreER;mGCaMP6s) and Adra1a conditional knockout (PDGFRα-CreER;mGCaMP6s;Adra1afl/fl) animals were all performed at least 4 weeks after the last tamoxifen injection unless specified.
Head plate installation and cranial window surgery
The day before cranial window surgery, dexamethasone (VetOne, NDC#13985-037-02) was given through drinking water to the mice (1 mg/kg. The next day, animals were anesthetized with inhaled isoflurane (0.25–5%) and placed in a custom-made stereotaxic frame. Surgery was performed under standard and sterile conditions. After hair removal and lidocaine application (1%, VetOne, NDC 13985-222-04), the mouse’s skull surrounding the right visual cortex was exposed and the connective tissue was carefully removed. Vetbond™ (3M) was used to close the incision site. A custom-made metal head plate was fixed to the cleaned skull using dental cement (C&B Metabond, Parkell Inc.). A 2 × 2 mm2 square craniotomy was then performed using a high-speed dental drill bit. The center of the craniotomy was located 2 mm lateral to lambda. Dura was left intact and the cranial window was then sealed with a custom-made 2 × 2 mm2 square #1 (0.17 mm) coverslip using Vetbond™. A layer of cyanoacrylate (Krazy Glue) was applied on top of the Vetbond to secure the coverslip. For the LED stimulation experiment, a 014 and a 015 Viton O-ring 75A were stacked on top of the head plate with the cranial window at the center and glued to the head plate with black dental cement (Ortho-Jet™, Lang Dental). Animals recovered in their home cages for at least 4 weeks before imaging.
In vivo 2P laser scanning microscopy for OPC Ca2+ activity
Two-photon laser scanning microscopy was performed with a Zeiss LSM 710 microscope equipped with a GaAsP detector, which uses a mode-locked Ti-Sapphire laser (Coherent Chameleon Ultra II) tuned to 920 nm. The power at the sample level during imaging was 60 – 100 mW depending on the depth of imaging. Higher intensities caused photoactivation of OPC Ca2+ activity. The head of the mouse was immobilized by attaching the head plate to a custom-made stage mounted on a vibration isolation table, and the body of the mouse was housed in a custom-made plastic restrainer. The thickness of dura was measured by autofluorescence and needed to be < 30 μm to clearly visualize OPC Ca2+ activity in the fine processes. Fluorescence images were collected 50 – 150 μm below dura using a coverslip-corrected Zeiss 20x/1.0 W Plan-Apochromat objective with a pixel dwelling time of 1.58 μs and scanning speed of 2 Hz, set via ZEN 2.3 Blue (Zeiss LLC). We did not detect any Ca2+ events shorter than 0.5 s when scanning individual processes at 10 Hz (Supplementary Fig. 1), indicating that sampling at 2 Hz adequately represented Ca2+ event time courses. Vascular structure and PDGFRα+ perivascular fibroblasts expressing GCaMP6s were used as landmarks to identify and follow individual OPCs over longitudinal imaging sessions. Mice were kept on the stage for no more than one hour and all in vivo imaging experiments were performed during the day. For longitudinal imaging experiments, the same cell was imaged at approximately the same time of the day. For enforced locomotion experiments, a custom-made acrylic plate was connected to an electric motor controlled by custom-made Arduino scripts and placed under a Bergamo II multiphoton microscope (Thorlabs, Inc.) equipped with a mode-locked Ti-Sapphire laser (Coherent Chameleon Discovery NX) tuned to 920 nm. Mice were head fixed during imaging using T horImage LS Imaging Software 4.1 (Thorlabs, Inc.) under a Nikon LWD 16x/0.8 W objective with a pixel dwelling time of 1.8 μs and a frame rate of ~1.4 frames per second.
Longitudinal imaging with 2P microscopy and spectral confocal reflectance (SCoRe) microscopy
Both 2P microscopy and SCoRe microscopy were performed in the same imaging session using a Zeiss LSM 710 microscope as follows: The bottom of the dura (z = 0) was determined using 2P excitation as described above. A 3 min 1024 × 1024 pixel time-lapse video of OPC Ca2+ activity was then recorded at the desired depth at 1 Hz. Before ScoRe images were collected, the bottom of dura was re-registered as z = 0 with visible lasers to align with 2P images later in the analysis. Then a 1024 × 1024 pixel z stack from the bottom of dura to at least 70 μm below the dura was collected with a step size of 2 μm using visible lasers at 488, 543 and 633 nm simultaneously. Light reflected by myelin at each wavelength was collected in sections of 487–490, 543–545 and 632–635 nm, respectively. Laser intensities were kept minimal to prevent tissue damage. Since anesthesia dramatically disrupts OPC Ca2+ activity (see Fig. 2), mice were kept awake during SCoRe imaging. Myelin structure was obtained by adding all the reflective signals collected from 487–490, 543–545 and 632–635 nm ranges. Background noise was subtracted using ImageJ. SCoRe image stacks across different days were registered with ImageJ function Correct 3D Drift and then aligned with Fijiyama between two different time points.
Calcium image processing and analysis
Images containing time-lapse sequences of OPC Ca2+ activity were first registered using moco (Motion Corrector)62. The background noise was then reduced using the Kalman filter63. Next, images were imported into AQuA software package v1.0.1 (latest updates on Feb. 5, 2020) run under MATLAB R2018b. We used the following parameters to optimize the detection of OPC Ca2+ events and kept them consistent throughout the study: Intensity threshold scaling factor: 3, Smoothing: 2, Minimum pixel size: 3, Temporal cut threshold: 3, Growing z threshold: 1, Rising time uncertainty: 2, Slowest delay in propagation: 1, Propagation smoothness: 1, Z score threshold: 2. Only processes with visible connection to the cell body were included in the analysis. Ca2+ events from PDGFRα+ perivascular fibroblasts were easily distinguishable and excluded from OPC Ca2+ events as the events from the former presented as either a round shape (cross section) or a tube-like structure, both without branching and propagation. Blinding of live imaging data collection and quantification was not possible as the experiment procedures performed is labor-intensive. However, we expect that using unbiased computer algorithms can avoid human biases during analysis.
Visual stimulation
A LED emitting blue light was used as a light source at a distance of 7 cm from the animal’s left eye. The light power entering the mouse left eye was ~20 nW/mm2. To eliminate optical cross talk between visual stimulation and 2P excitation, the objective was shielded from the light source with an opaque cylinder. The period and the interval of the visual stimulus was controlled by a pulse generator Master-8 (MicroProbes for Life Science).
Pharmacology
For in vivo i.p. injection, chlorprothixene hydrochloride (Sigma-Aldrich, #C1671), prazosin hydrochloride (Tocris, #0623) and dexmedetomidine hydrochloride (Tocris, 2749) were dissolved in DMSO (Sigma-Aldrich, #D2650) at 5 mg/mL, 3 mg/mL and 0.1 mg/mL, respectively. First, 5 minutes of baseline activity was measured using 2P microscopy and then the animals were i.p. injected with equal amounts of DMSO per body weight (1 μL per 1 μg b.w.). Animals were returned to their home cage after injection and then re-mounted under the 2P microscope 20 min after injection for 5 minutes of imaging. For in vitro cortical slice imaging, phenylephrine hydrochloride (Tocris, #2838), tetrodotoxin citrate (Alomone labs #T-550), NBQX disodium (Tocris, #1044), (RS)-CPP (Tocris, #0173) and SR 95531 hydrobromide (Tocris, 1262) were dissolved in ACSF and applied through the superfusing solution.
Acute cortical slice preparation and in vitro 2P calcium imaging
Adult mice (8–12 weeks old) were deeply anesthetized with isoflurane and decapitated using a guillotine. Brains were quickly dissected out and mounted in a pre-chilled chamber on a vibratome within 5 minutes after decapitation. Cortical slices (250 μm in thickness) were sliced in ice-cold N-methyl-D-glucamine (NMDG)-based cutting solution (135 mM NMDG, 1 mM KCl, 1.2 mM KH2PO4, 1.5 mM MgCl2, 0.5 mM CaCl2, 10 mM Dextrose, and 20 mM Choline Bicarbonate, pH 7.4), and then transferred to artificial cerebral spinal fluid (ACSF) (119 mM NaCl, 2.5 mM KCl, 2.5 mM CaCl2, 1.3 mM MgCl2, 1 mM NaH2PO4, 26.2 mM NaHCO3, 11 mM dextrose (292–298 mOsm/L)). Somatosensory to visual cortices were collected and maintained at 37°C for 40 min, and then at RT thereafter for imaging. Both the NMDG and ACSF solution were saturated with carbogen (95% O2 and 5% CO2) before use and were constantly carbogenated during the experiment. Ca2+ imaging was performed across all cortical layers using Zeiss LSM 710 microscope with a Zeiss 20x/1.0 W Plan-Apochromat objective. Fluorescence images were collected at least 50 μm below the slice surface using 2P excitation at 920 nm at a frequency of 2 Hz. Registration was carried out using moco and background noise was reduced using the Kalman filter, as described above. The ΔF/F values from individual OPC were obtained by first thresholding the maximally projected movie in ImageJ, using the wand (tracing) tools to select individual OPC as a region-of-interest (ROI), and then measuring the fluorescence changes in the individual OPC/ROI.
Immunohistochemistry (IHC)
Adult mice (8–12 weeks old) were deeply anesthetized with an i.p. injection of pentobarbital (100 mg/kg b.w.) and perfused transcardially with 20 mL of RT 0.1 M phosphate buffered saline (1x PBS) first, and then with 20 mL of freshly prepared, ice-cold 4% paraformaldehyde (PFA, Electron Microscopy Sciences, #19210) in 1x PBS (pH7.4). After carefully removed from the skull, brains were post-fixed in 4% PFA/PBS at 4°C in the dark for 4 hrs, and then cryoprotected in 30% sucrose/0.1 % sodium azide in 1x PBS at 4°C in the dark for at least 48 hrs. Brains were then embedded in Tissue-Tek O.C.T Compound (Sakura Finetek, #4583) and cyrosectioned at −20°C using a Thermo Scientific Microm HM 550 at the thickness of 35 μm. Free-floating coronal brain sections were collected and rinsed briefly in PBS. For anti-CC1 (APC) staining, brain sections first underwent antigen retrieval by incubated with L.A.B. solution (Polysciences, #24310) at RT for 10 min. For NG2, PDGFRα, MBP, and GFP staining, antigen retrieval is not necessary. Brain sections then were permeabilized with 0.5% Triton X-100 in 1x PBS for 10 min at RT. To prevent non-specific binding of antibodies, brain sections were incubated in blocking buffer (10% normal donkey serum, Jackson ImmunoResearch, #017-000-121, and 0.3% Triton X-100 in 1x PBS) for 1 hr at RT, followed by primary antibody incubation at RT overnight. After washing in 1x PBS 3 times (10 min each), brain sections were incubated with secondary antibodies for 2 hrs at RT before another wash in 1x PBS as described above. Both primary and secondary antibodies were diluted in the blocking buffer. Sections were then mounted on slides with Aqua-Poly/Mount (Polysciences, #18606). Images were acquired using a Zeiss LSM 800 confocal microscope with Zeiss 10x/0.45 Plan-Apochromat and Zeiss 20x/0.8 Plan-Apochromat objectives using Zen 2.3 Blue (Zeiss LLC) and analyzed using ImageJ (National Institute of Health). The experimenter was blinded during quantification for the fate-mapping experiment (see Fig. 8). Primary antibodies used: Guinea pig anti-NG2 (Bergles lab, 1: 5000)64, chicken anti-GFP (Aves, #GFP-1020, 1:4000), rabbit anti-PDGFRα (D1E1E) (Cell Signaling, #3174, 1:500), anti-MBP (Aves, #MBP, 1:500) and mouse anti-CC-1 (APC) (Calbiochem, #OP80, 1:100). Secondary antibodies were purchased from Jackson ImmunoResearch (all at 1:1000): Cy3 donkey anti-guinea pig IgG (#706-165-148), Alexa Fluor 488 donkey anti-chicken IgG (#703-546-155), Alexa Fluor 594 donkey anti-rabbit IgG (#711-585-152), Alexa Fluor 594 donkey anti-mouse IgG (#711-585-150), and Alexa Fluor 647 donkey anti-rabbit IgG (711-605-152).
Cell proliferation assay using EdU (2’-deoxy-5-ethynyluridine)
EdU (200 μg/ml, Biosynth, #NE08701) was prepared in drinking water containing 1% of sucrose (Sigma-Aldrich, #S7903) every two days during the labeling period. On the last day of labeling, animals were anesthetized for IHC as described above. After the secondary antibody incubation, brain sections were washed in 1x PBS and then EdU was made fluorescent by following the instructions of Click-iT™ EdU Cell Proliferation Kit for Imaging (Invitrogen, C10340). Images were acquired using a Zeiss LSM 800 confocal microscope with Zeiss 10x/0.45 Plan-Apochromat objective as described above. Images were analyzed blindly using ImageJ as described above.
Single molecule fluorescence in situ hybridization
B6 wild-type adult (8 weeks old) mice were deeply anesthetized with an i.p. injection of pentobarbital (100 mg/kg b.w.) and perfused transcardially with 20 mL of RT 1x PBS. Brains were carefully removed and then fixed in freshly prepared, ice-cold 4% paraformaldehyde (PFA, Electron Microscopy Sciences, #19210)/ PBS (pH7.4) for 4 hrs, followed by cryoprotection in the dark in 30% sucrose/0.1 % sodium azide/PBS at 4°C for at least 48 hrs. The tissue was then embedded in Tissue-Tek O.C.T Compound (Sakura Finetek, #4583) and sectioned at −22°C as described above. Sixteen-μm coronal brain sections were collected on Fisherbrand™ Superfrost™ Plus Microscope slides (Fisher Scientific, #12-550-15). Brain sections were further dried on the slide for 3 hrs at RT and −20°C overnight. To perform in situ hybridization, brain sections were first washed in 1x PBS for 5 min and then post-fixed on slides in 4% fresh PFA for 30 min. Slides were then briefly washed in RT distilled water (dH2O), RT 1x PBS, and then boiled in RNAscope® Target Retrieval reagent (ACDBio, #322000) at 99°C for 15 min. After a brief wash in dH2O, slides were incubated with freshly prepared 0.3% hydrogen peroxide for 10 min at RT, briefly washed with dH2O, and then incubated in 100% alcohol for 3 min. After drying at RT, brain sections were treated with RNAscope® Protease III at 40°C for 30 min, then washed with dH2O. Probes recognizing Adra1a mRNA (ACDBio, #408611, C1) and Pdgfra mRNA (ACDBio, #480661, C2) were diluted according to the manufacturer’s instructions and added to brain sections for 2 hrs at 40°C. Slides were then washed in 1x RNAscope® Wash Buffer (ACDBio, #310091) for 2 × 2 min. The signal of the hybridized RNA probes was amplified with RNAscope® FL v2 (ACDBio, #323110) Amp 1 for 30 min at 40°C, Amp 2 for 30 min at 40°C, and Amp 3 for 15 min at 40°C, with 2x wash in 1x Wash buffer for 2 min between each amplification step. Fluorescence signals for each color channel were then developed by first incubating slides in RNAscope® Multiplex FL v2 HRP-C1/C2 for 15 min at 40°C, then Opal Fluorophore Reagent 520/570 (Akoya Biosciences, #OP-001001/001003) mixed with 1x TSA™ (Tyramine Signal Amplification technology, Perkin Elmer) for 30 min at 40°C, and finally in RNAscope® Multiplex FL v2 HRP blocker (ACDBio, #323107) for 15 min 40°C. There was 2x wash in 1x Wash buffer for 2 min between each detection step. After detection steps were finished for all channels, cell nuclei were stained by DAPI for 1 min at RT and tissues were mounted in Aqua-Poly/Mount (Polysciences, #18606). Images were acquired using Zeiss LSM 880 confocal microscope with a Zeiss 20x/0.8 Plan-Apochromat objective using Zen 2.3 Black (Zeiss LLC) and later analyzed using ImageJ.
OPC primary cell culture and live cell imaging
Cell culture plates were pre-coated with 20 µg/mL of poly-D-lysine (Sigma-Aldrich, #P6407) in borate buffer (0.15 M boric acid) at least 3 hours at 37°C before seeding. P4–7 CD-1 pups (equal numbers of males and females, Charles River) were decapitated after the head was briefly sterilized with 70% ethanol. Cortices were then dissected out under a microscope in 1x Hanks’ Balanced Salt Solution (HBSS), without calcium, magnesium, or phenol red (Gibco, #14170112) within 20 minutes. Cells were then dissociated using Neuro Tissue Dissociation Kit (P) (Miltenyi Biotec, #130-092-628) and OPCs were isolated using anti-O4 microbeads (Miltenyi Biotec, #130-094-543) according to manufacturer’s instructions. OPCs were cultured in DMEM:F12 (Gibco, #11330032) containing 1x NeuroCult™ SM1 Neuronal Supplement (Stemcell Technologies, #5711), 1x N2 Supplement-B (Stemcell Technologies, #7156), 50 U/mL of Penicillin-Streptomycin (Gibco, #151401), 5 µg/mL of N-Acetyl-L-cysteine (Sigma-Aldrich, #A8199), 5 µM of forskolin (Calbiochem, #344270), 10 ng/mL of recombinant human CNTF (PeproTech, #450–13), 20 ng/mL of recombinant human PDGF-AA (PeproTech, #100–13), and 1 ng/mL of recombinant human NT-3 (PeproTech, #450–03) with PDGF-AA and NT-3 replenished every two days. OPCs were maintained at 37°C with 5% CO2 at least one day before experimentation. For bulk RNA sequencing experiments, 6 × 10⁴ OPCs were seeded in each well of a 24-well plate two days before being treated with and without 20 µM PE. For live cell imaging, 104 cells were seeded onto a pre-coated, 1-cm diameter round coverslip two days before being treated with and without 20 µM PE. A 10x objective was used to acquire phase contrast images from each coverslip using Incucyte S3 2022A (Sartorius, Goettingen, Germany). Time-lapse images were first registered using moco and cells were then tracked manually with MaMuT ImageJ plugin65.
RNA sequencing and differential expression analysis (DEA)
Approximately 2.4 × 10⁵ OPCs were harvested for each group and total RNA was extracted using RNeasy Plus Mini Kit (Qiagen, #74134) according to manufacturer’s instructions. An mRNA library was prepared using TruSeq Stranded mRNAseq library prep with unique dual indexes (Illumina, San Diego, CA). NextSeq 500 System Mid-Output (Illumina) was used to sequence the mRNA library at 1 × 75 bp for up to 130 M single reads. Short reads were aligned using STAR to the mouse genome (mm10). HTSeq software was used for quantifying the aligned reads. Multiple clustering methods were applied to examine the quality of replicates and read counts were normalized via the trimmed mean method. Lowly expressed genes were removed, and only genes with CPM (counts per million reads mapped) > 0.15 in at least 3 samples were selected for DEA. Data were adjusted with Remove Unwanted Variation (RUV) using residuals with number of co-variables 2 to correct for batch effects. Multiple DEA methods were applied, but the results generated using EdgeR was presented, as more Ca2+-related pathways were enriched (higher normalized enrichment scores) using this analysis.
Statistical analysis
No statistical methods were used to pre-determine sample sizes but our sample sizes are similar to those reported in previous publications30. Statistical analyses were performed using OriginPro 2021b (OriginLab Corp.). All datasets had to either pass the Shapiro-Wilk test for normality before being subjected to Student’s t-test and ANOVA, or undergo non-parametric tests to determine statistical significance. Equal variances were assumed but not tested. P values less than 0.05 were considered statistically significant unless otherwise noted. At the data analysis stage, we employed unbiased computer algorithms to avoid human biases. The level of significance is marked on the figures as follows: *: p < 0.05; **: p < 0.01; ***: p < 0.001; ****: p < 0.0001; n.s.: not significant.
Data Availability Statement
The gene expression dataset in Extended Data Figure 10c is deposited to Gene Expression Omnibus (GEO) with the accession #GSE226635 available to public immediately (https://www.ncbi.nlm.nih.gov/geo/query/acc.cgi?acc=GSE226635). Mouse genome assembly (GRCm38/mm10) used in this study is available via UCSC Genome Browser Gateway (https://genome.ucsc.edu/cgi-bin/hgGateway?db=mm10). All the images/videos generated during this study is available from the corresponding author by reasonable request.
Code Availability Statement
Code used for data acquisition and analysis in this study is available on GitHub (https://github.com/Bergles-lab/Lu-et-al-NN-2023).
Extended Data
Extended Data Figure 1. Expressing membrane-anchored GCaMP6s (mGCaMP6s) in OPCs using Rosa26-lsl-mGCaMP6s knockin transgenic mice.
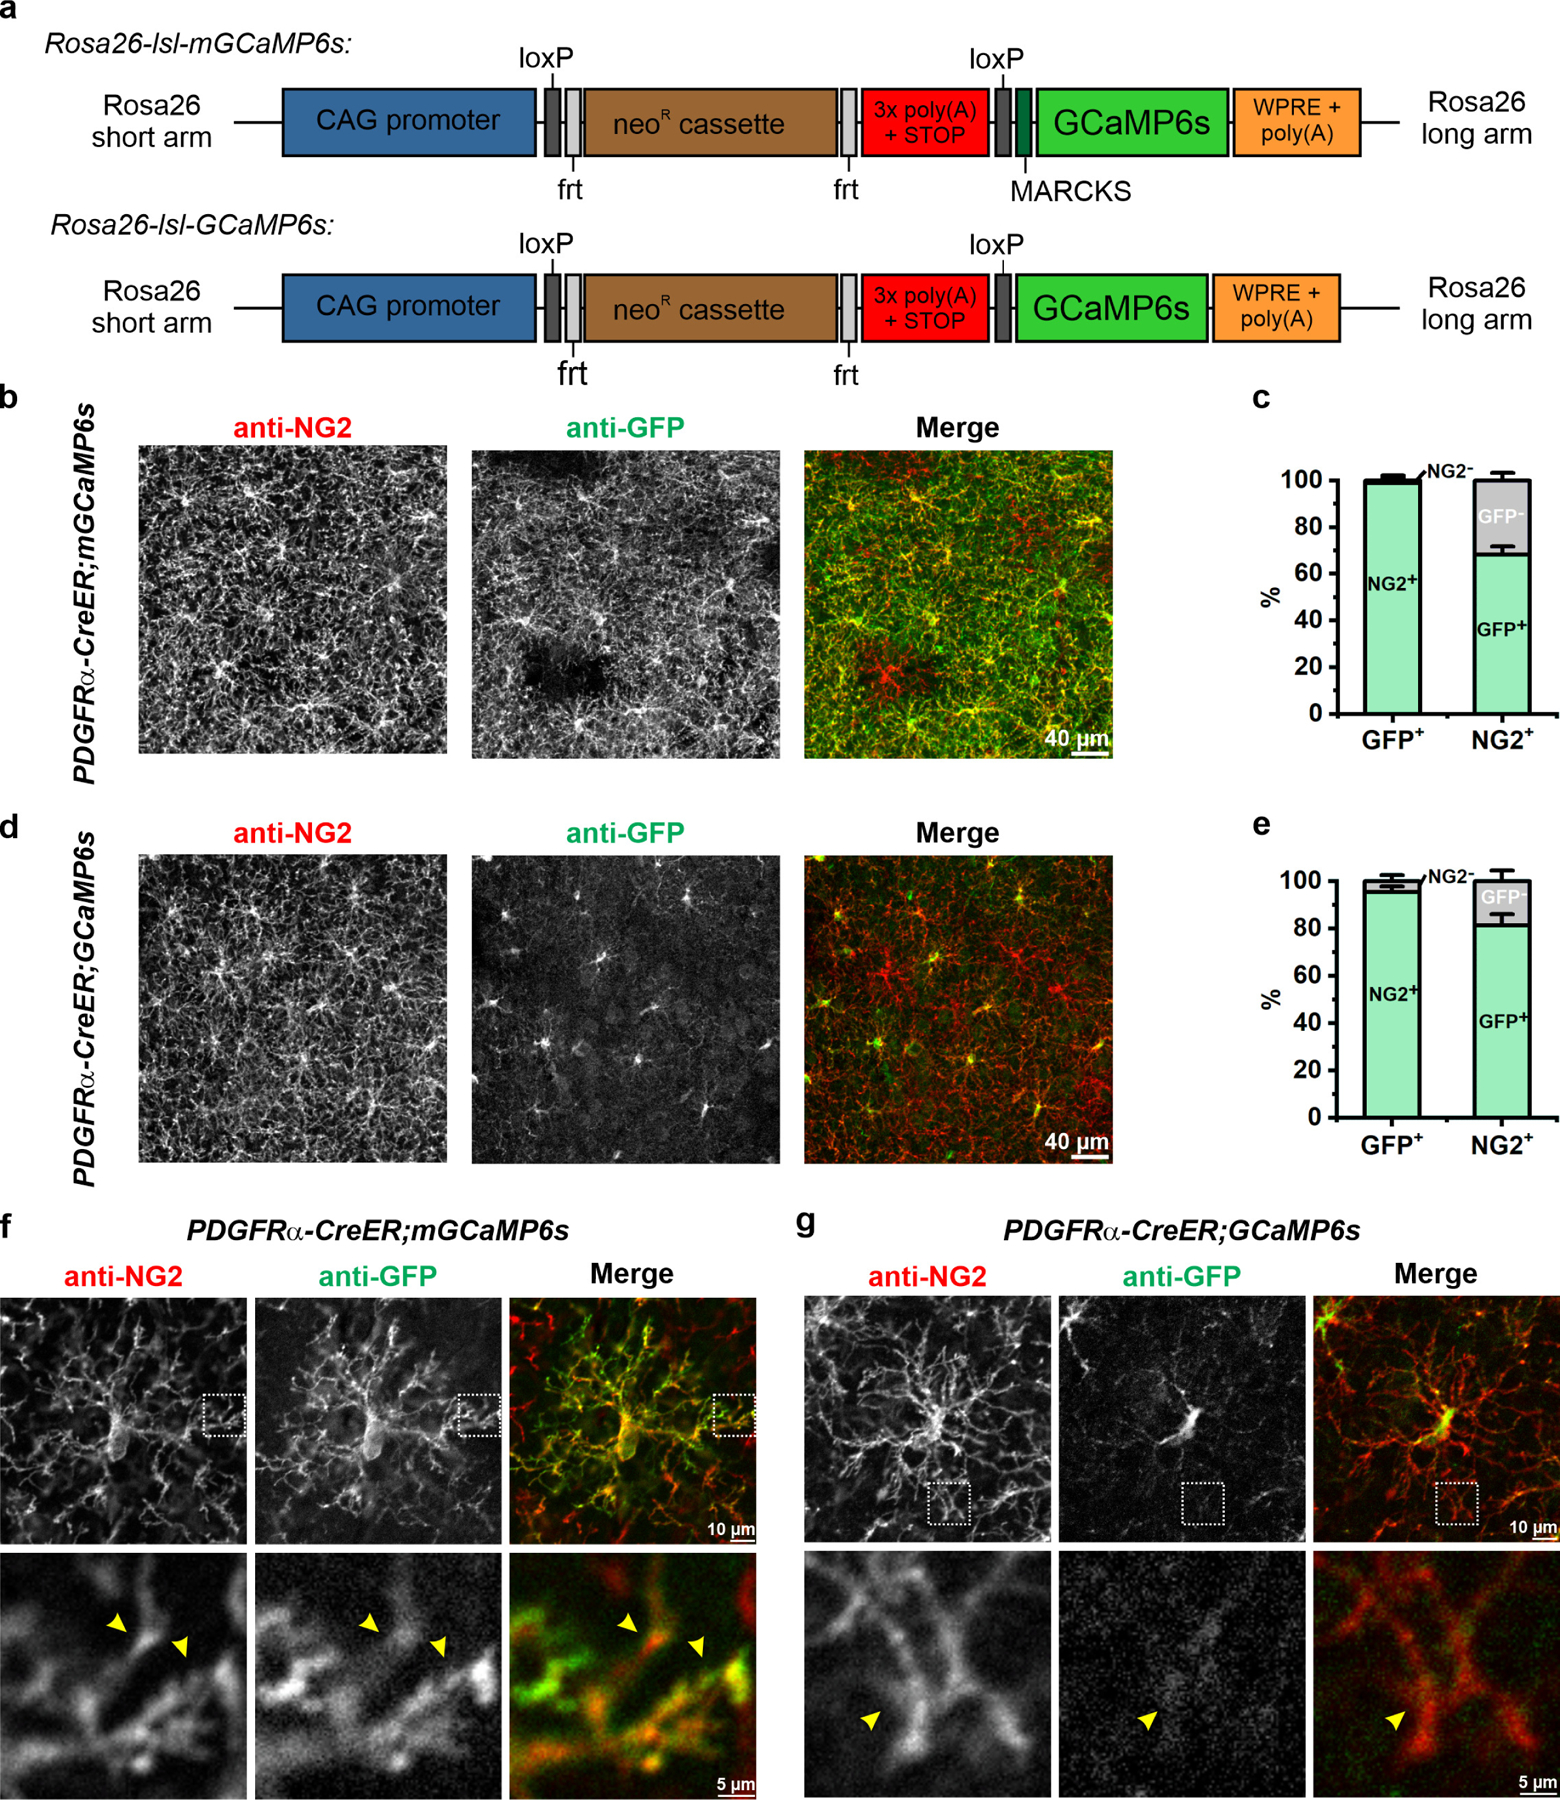
a, Design of Rosa26-lsl-mGCaMP6s and Rosa26-lsl-GCaMP6s knockin transgenic mice. MARCKS: N-terminal myristoylation sequence of myristoylated alanine-rich C-kinase substrate. b, Representative confocal images showing expression of mGCaMP6s (anti-GFP) in cortical OPCs (anti-NG2) 4 weeks after tamoxifen injection. c, Quantification of mGCaMP expression by OPCs (n = 3 mice). d, Representative images showing expression of cytosolic GCaMP6s in cortical OPCs 4 weeks after tamoxifen injection. e, Quantification of GCaMP6s expression by OPCs (n = 3 mice). f-g, Representative images of single mGCaMP6s- (f) and GCaMP6s-expressing (g) OPCs. Magnified views of their distal processes (yellow arrowheads) from regions highlighted by white squares shown below. Note limited cytosolic GCaMP6s expression in the processes.
Extended Data Figure 2. Features of OPC Ca2+ events detected by mGCaMP6s and GCaMP6s.
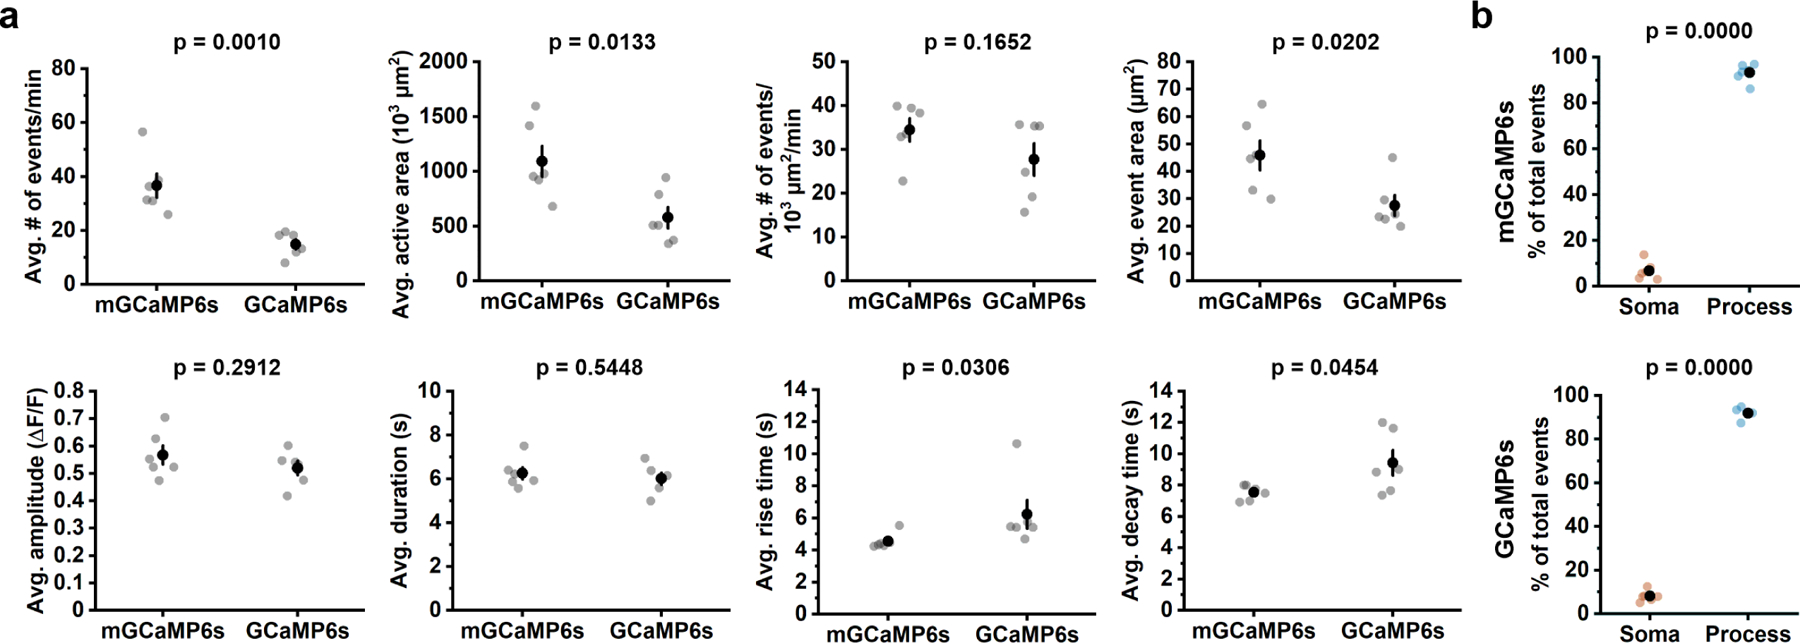
a, Dot plots comparing the average amplitude (avg.) event frequency (events/min), active area, frequency normalized to cell area, active area (amount of cell that exhibits Ca2+ changes), amplitude, duration (the time between 50% onset time point – 50% offset time point), rise time (onset duration from 10% to 90% of the peak amplitude) and decay time (offset duration from 90% to 10%) between mGCaMP6s- and GCaMp6s-expressing OPCs. Each data dot represents one OPC. n = 6 OPCs from 6 mice. Black filled circles and error bars represent mean ± SEM throughout. For data that passed the Shapiro-Wilk normality test at the 0.05 level, Student’s t-test was performed. For data that did not pass the Shapiro-Wilk normality test at the 0.05 level, including avg. event area and avg. rise time, Mann-Whitney test was performed.b, Quantification of event origins from mGCaMP6s- and GCaMP6s-expressing OPCs (n = 6 OPCs from 6 mice). Student’s t-test.
Extended Data Figure 3. Propagation of OPC Ca2+ transients is independent of site of event origin, event amplitude, and somatic Ca2+ activity.
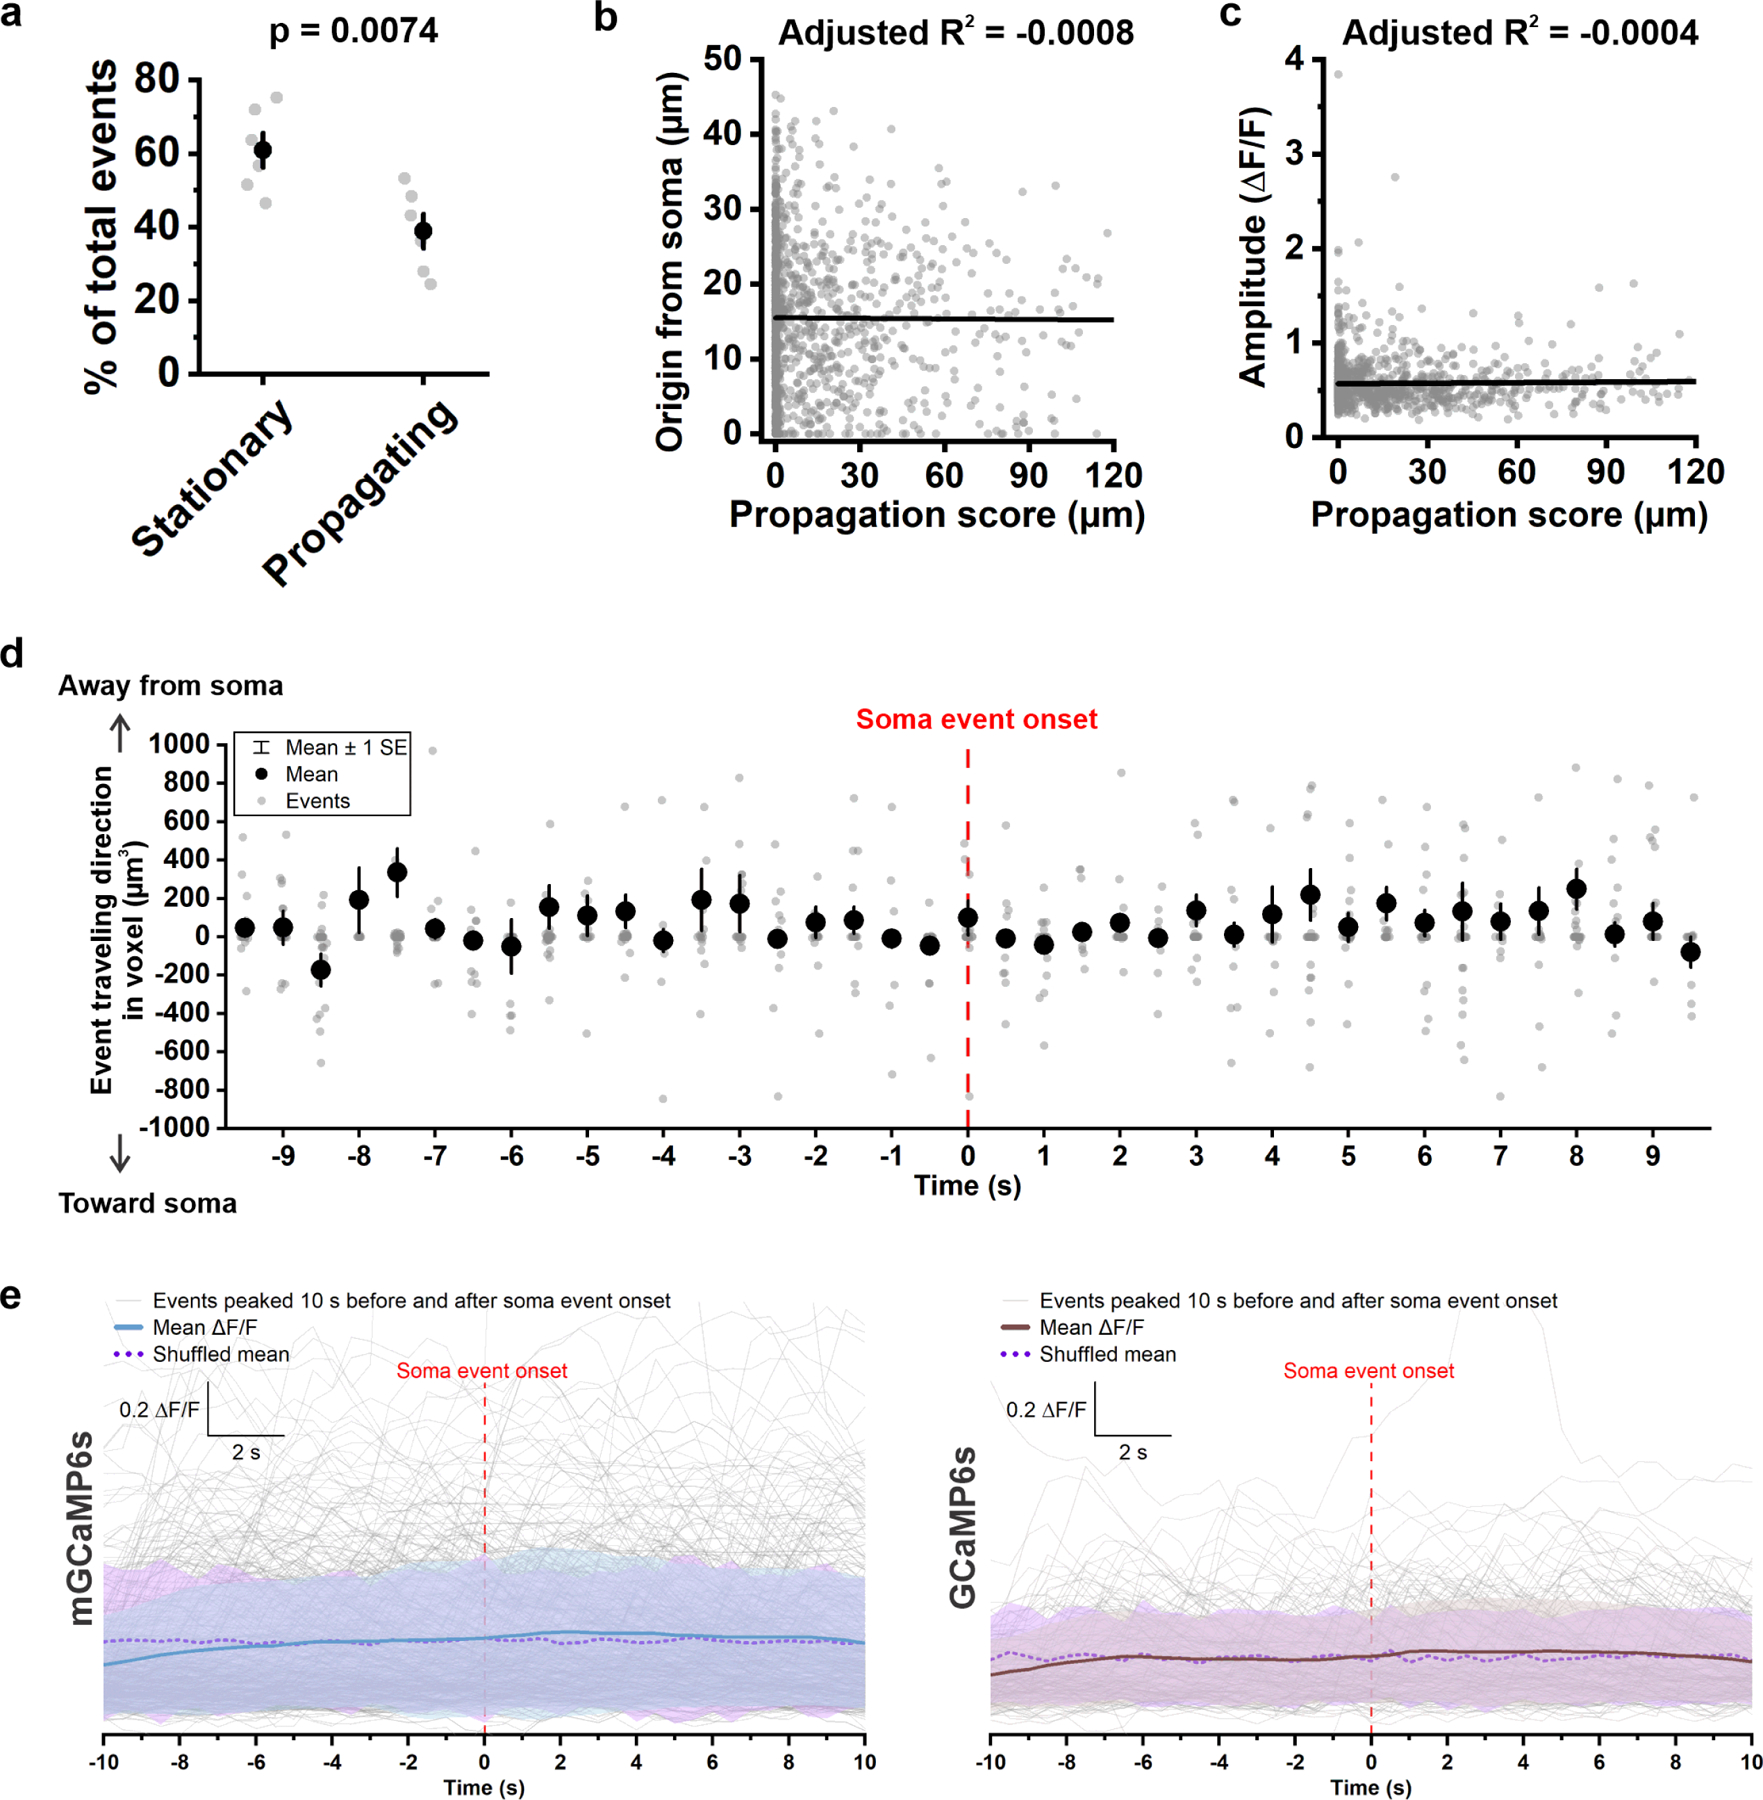
a, Average percentage of stationary (having an overall propagation score < 10 μm) and propagating (having an overall propagation score ≥ 10 μm) OPC Ca2+ events (n = 6 OPCs from 6 mice). Student’s t-test. b, Plot of the distance between event origin and soma (Origin from soma) versus overall propagation score. R: Pearson’s r. n = 1,100 propagating events from 6 mice. c, Plot of event amplitude against event overall propagation score. R: Pearson’s r. n = 1,100 propagating events from 6 mice. d, Directions of event propagation 10 s before and after the onset of a soma event. Event travelling direction was determined by total voxels that traveled away from soma minus total voxels that traveled toward soma. n = 911 propagating events from 6 mice. e, ΔF/F traces of Ca2+ events (thin gray lines) that peaked 10 s before and after soma event onset in mGCaMP6s-expressing and GCaMp6s-expressing OPCs, respectively. Mean ΔF/F (solid blue and brown lines) is the average ΔF/F of 165 events in mGCaMP6s-expressing mice (6 cells from 6 mice), and 509 events in GCaMP6s-expressing mice (6 cells from 6 mice). Shuffled mean (dotted purple lines) is the average value after shuffling ΔF/F values of each event. Shaded areas indicate standard deviation.
Extended Data Figure 4. Activation of visual cortex by visual stimulation with light does not alter OPC Ca2+ events in vivo.
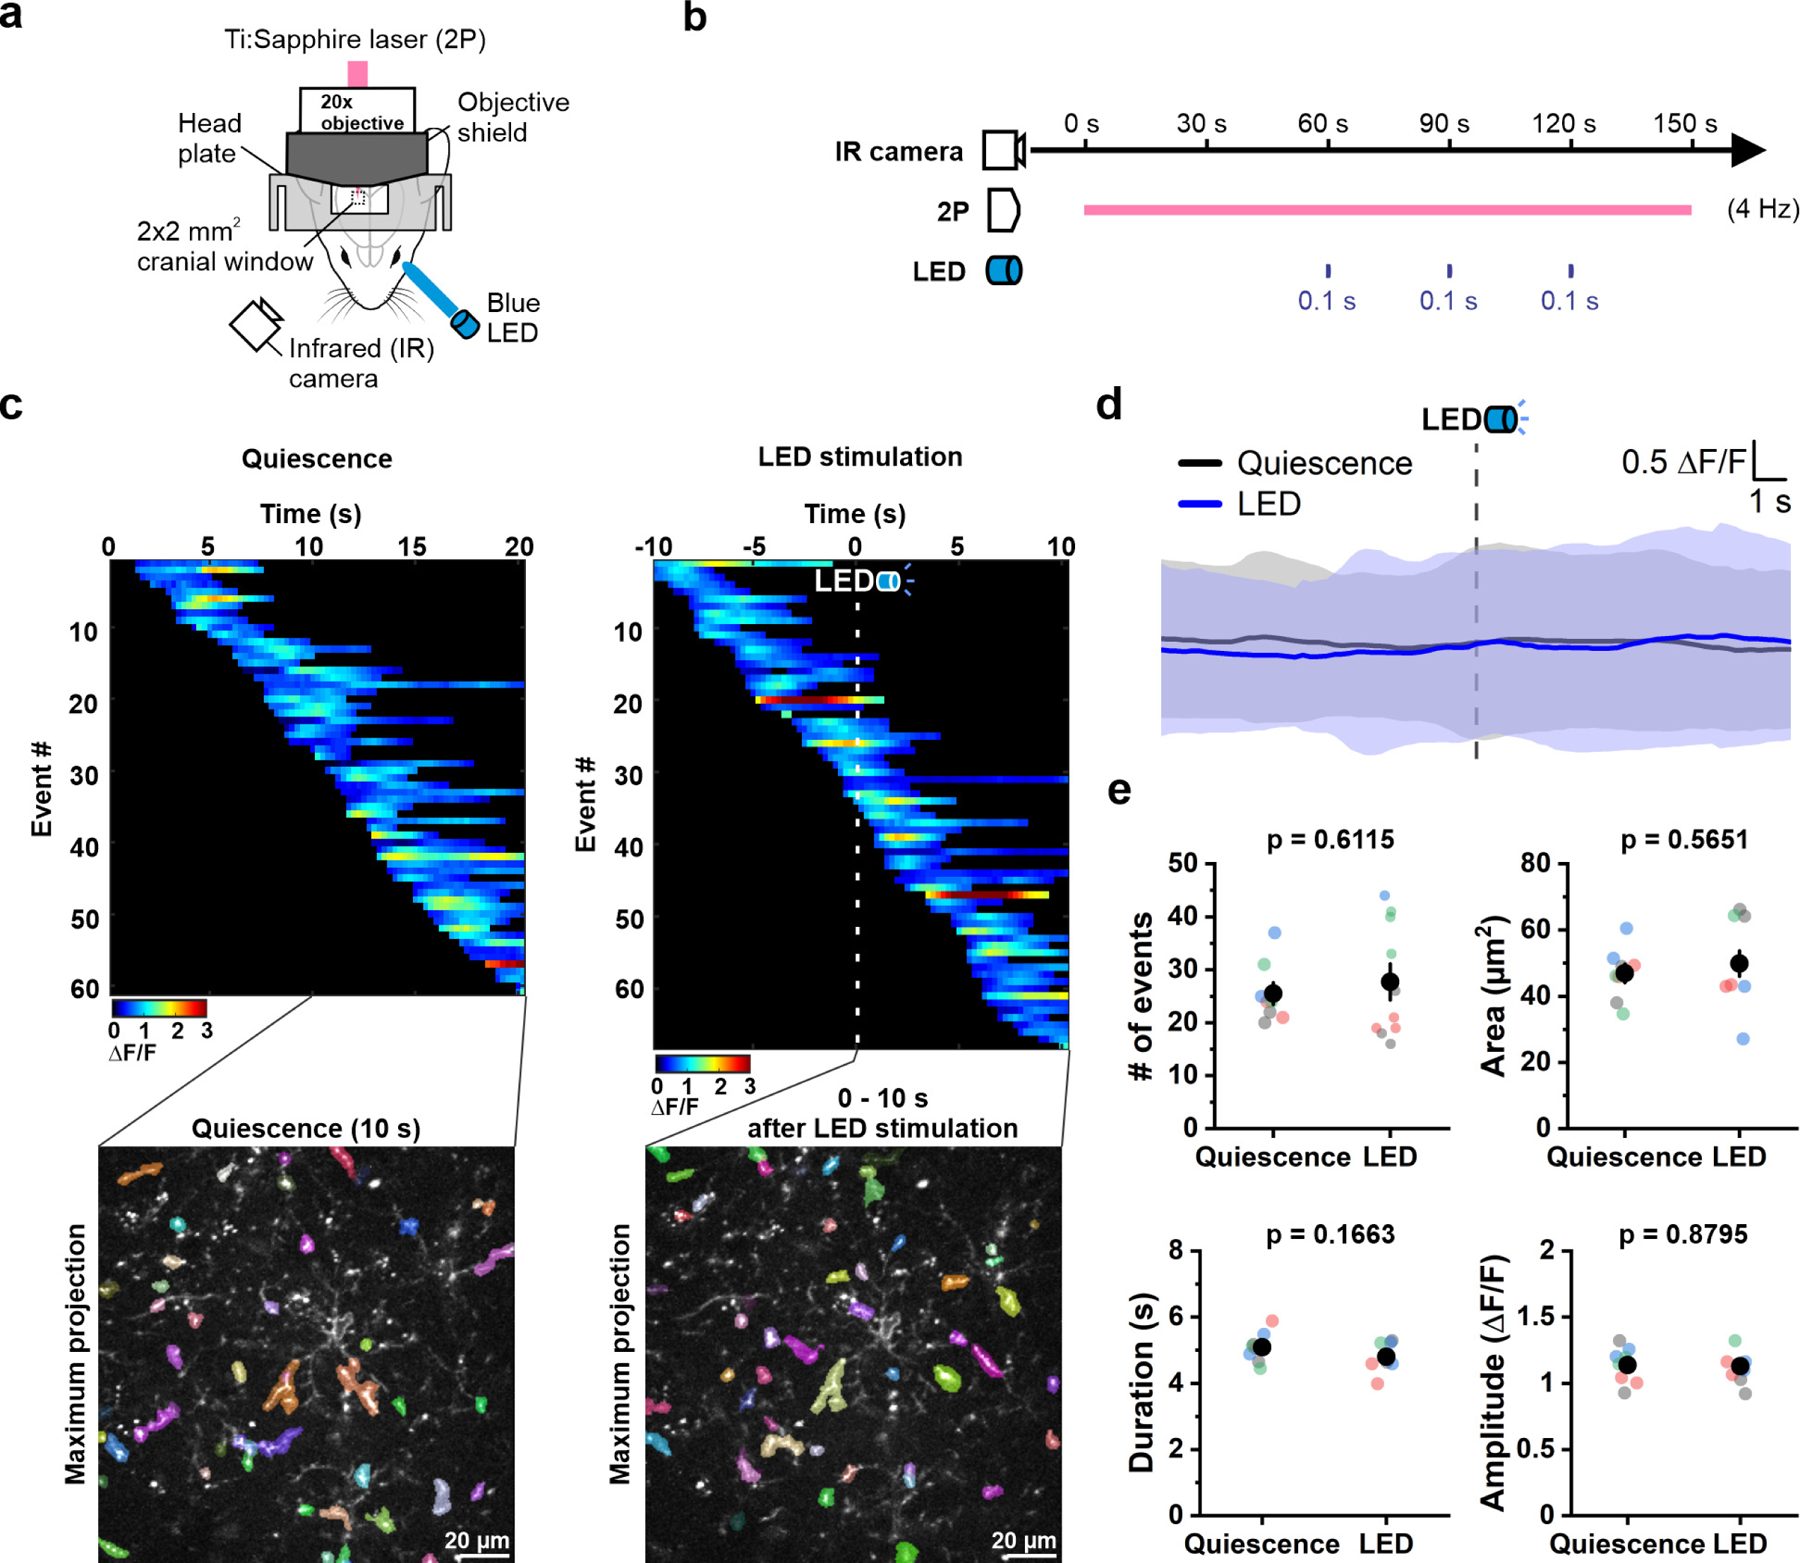
a, Schematic illustration of the experiment setup. A customized 3D-printed objective shield was used to prevent LED light from entering the objective. The bottom part of the objective shield is not depicted in the illustration to display the cranial window. See Methods for details. b, Schematic illustration of the experiment design. Baseline OPC Ca2+ activity was recorded for 60 seconds (s) followed by 3, 0.1 s LED stimulations at 30 s intervals. An infrared (IR) camera used to observe mouse behavior during image acquisition. c, Representative heatmaps showing the ΔF/F value and duration of OPC Ca2+ events sorted according to the time of event onset. OPC Ca2+ events that occurred during 10 s of quiescence or 10 s after LED stimulation were overlaid onto a single frame (Maximum projection), respectively. d, Averaging the OPC Ca2+ activity during 20 s of quiescence (gray) and around LED stimulation (blue) suggests that LED stimulation does not influence OPC Ca2+ activity in vivo. Shaded areas represent standard deviation. n = 4 mice. e, Quantification of OPC Ca2+ event frequency, area, duration and amplitude during 10 s of quiescence and 10 s post LED stimulation. n = 8 randomly-selected quiescent periods and 10 LED trials in 4 mice (color-coded).
Extended Data Figure 5. Exposure to carrier (DMSO) does not significantly alter OPC Ca2+ activity.

Quantification of OPC Ca2+ event frequency (# of events/min), area, duration and amplitude before (Baseline) and 20 minutes after DMSO injection (DMSO). n = 5 OPCs from 5 mice each. Paired sample Student’s t-test.
Extended Data Figure 6. α1A adrenergic receptors mRNA is enriched in cortical OPCs relative to pre-myelinating oligodendrocytes.
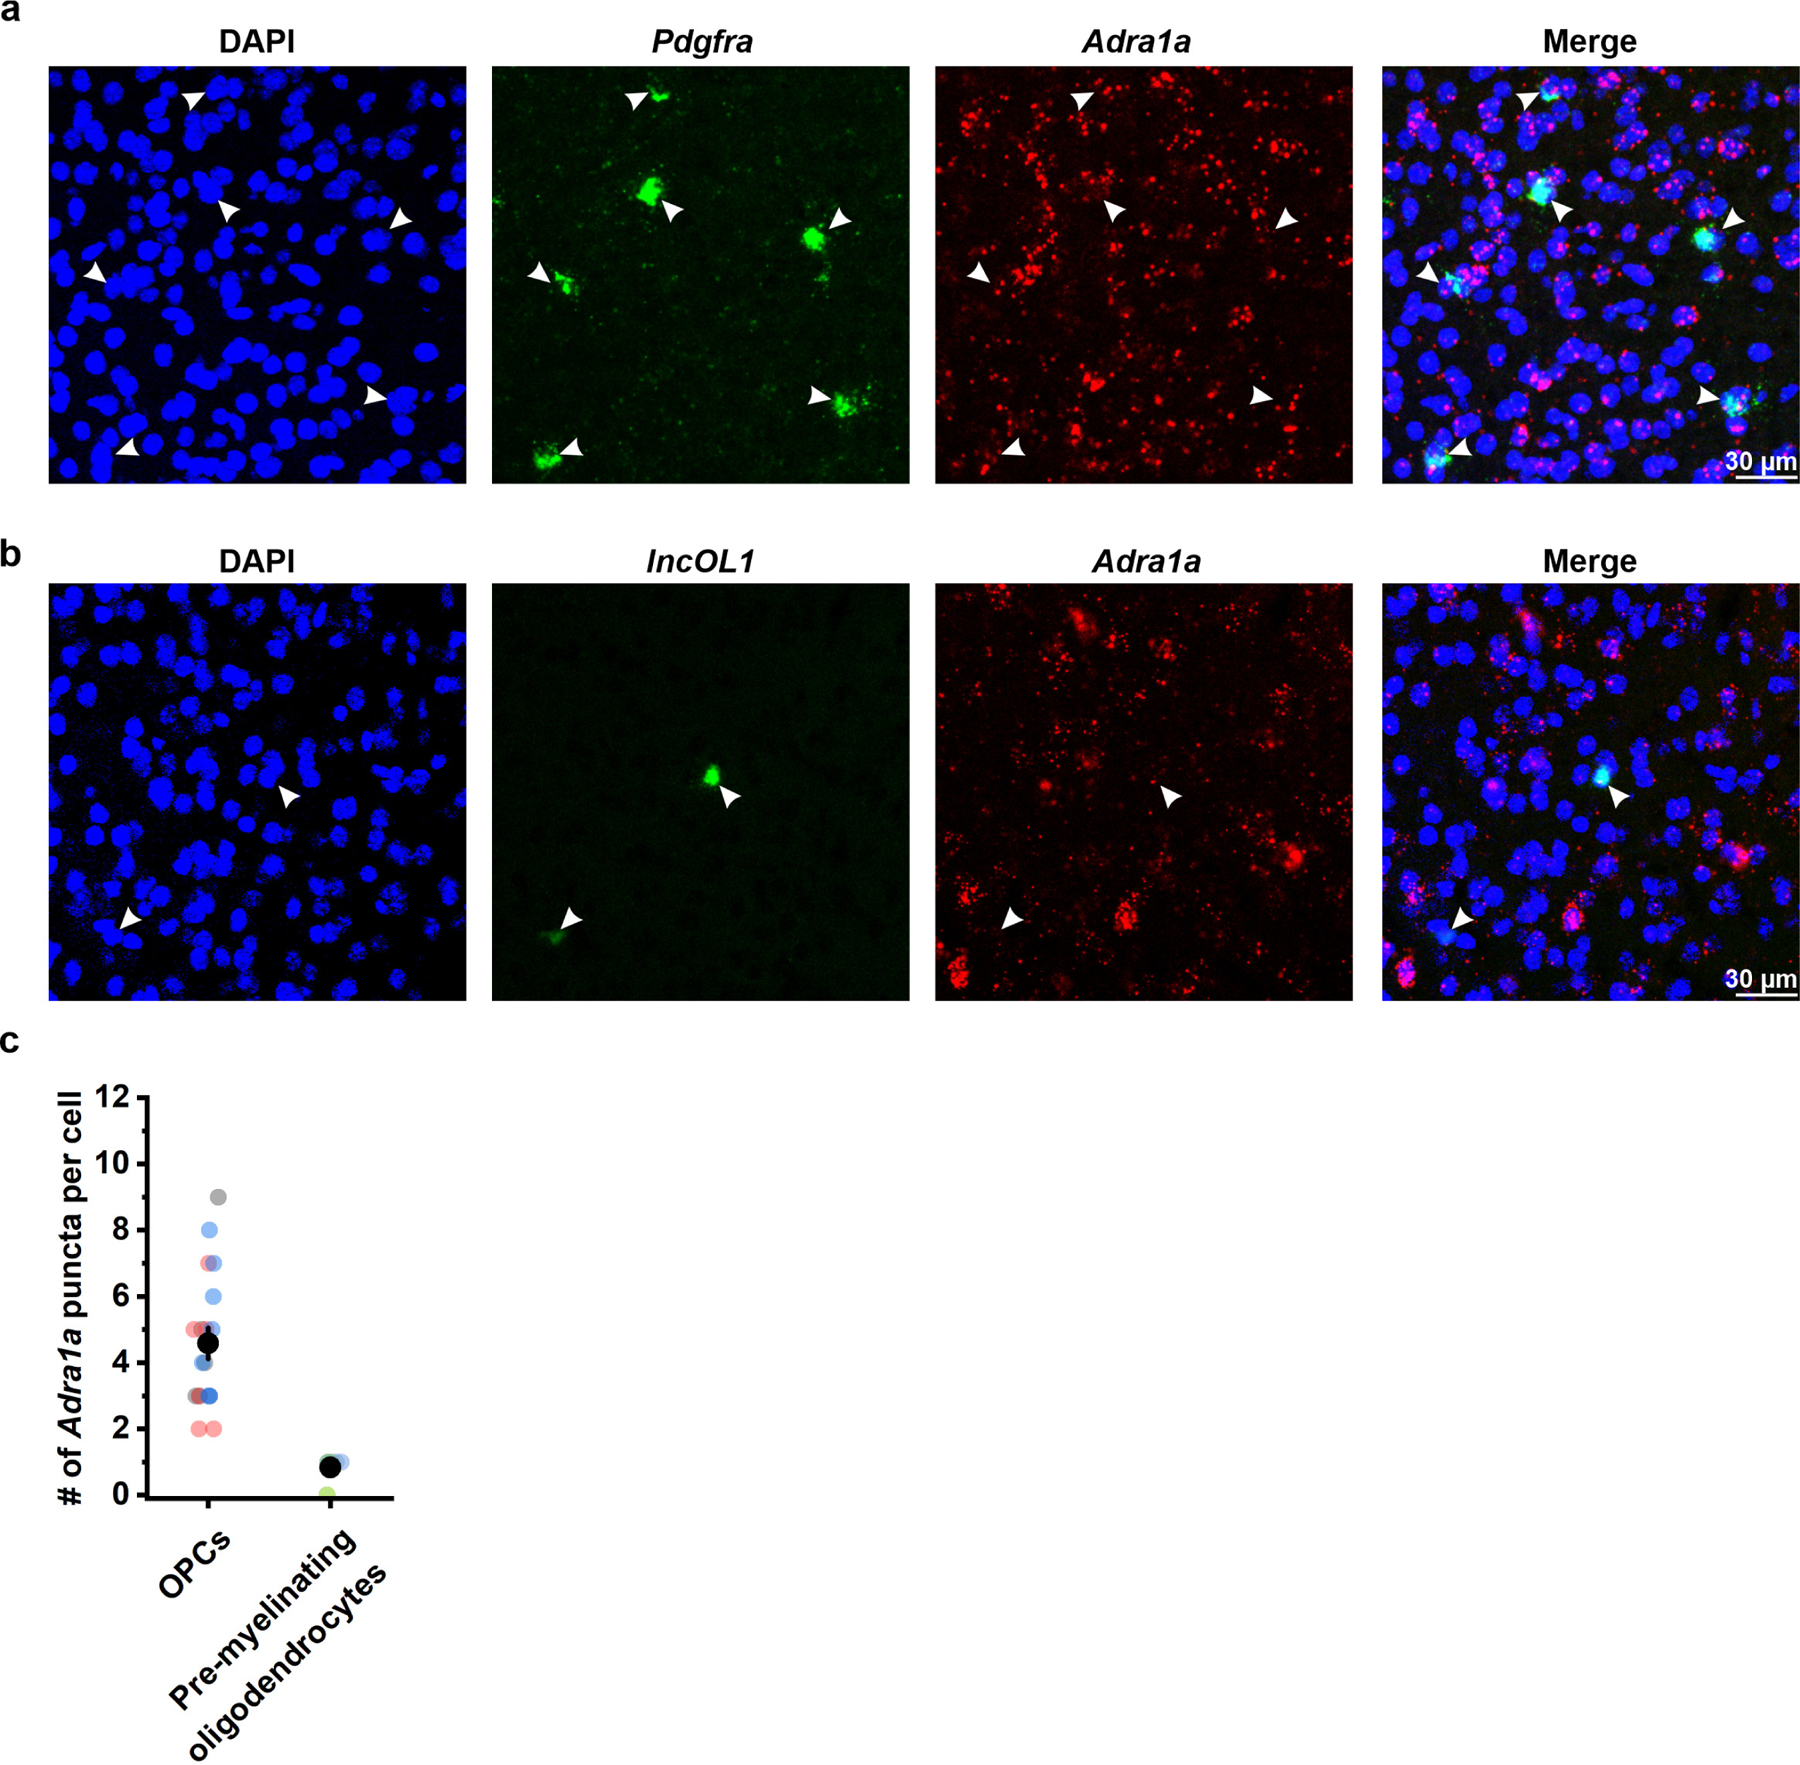
a, Representative images from a cortical brain slice of visual cortex from an adult mouse hybridized with probes recognizing Pdgfra (green) and Adra1a (red) mRNA. DAPI (blue) was used to identify cell nuclei. Adra1a mRNA is found around Pdgfra+ nuclei, suggesting that cortical OPCs express ADRA1A (n = 19 cells, 3 mice). b, Representative images from a cortical brain slice of visual cortex from an adult mouse hybridized with probes recognizing lncOL1 (green), and Adra1a (red) mRNA. DAPI was used to identify cell nuclei (n = 6 cells, 2 mice). c, Quantification of Adra1a mRNA puncta in OPCs and premyelinating oligodendrocytes.
Extended Data Figure 7. Illustration of an mGCaMP6s-expressing OPC undergoing cell death.
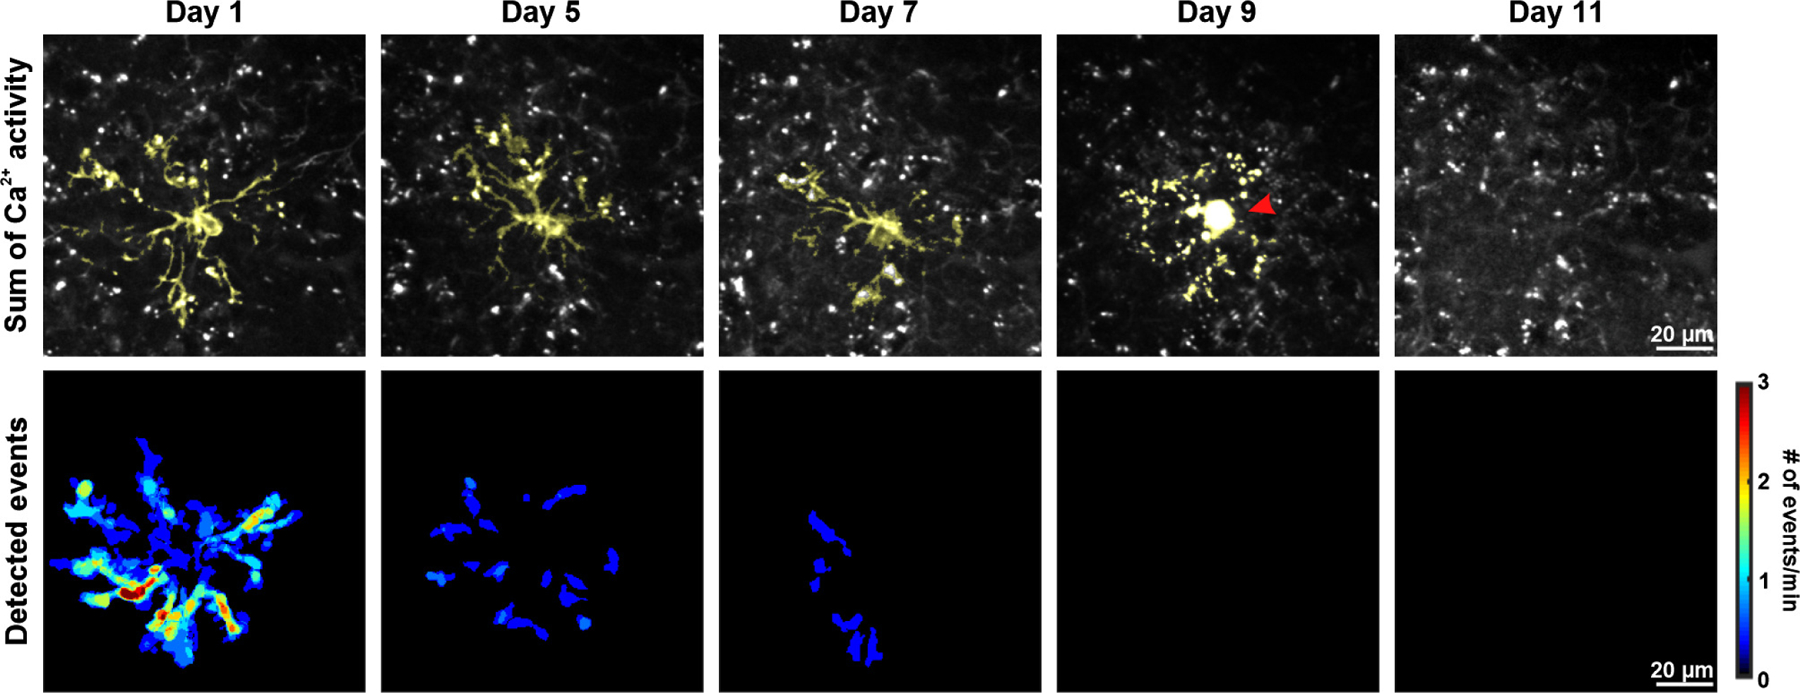
The mGCaMP6s-expressing OPC is highlighted in yellow. Note the round-shape and intensely fluorescent soma (red arrowhead), as well as fragmented processes on Day 9. Ca2+ events were not visible in fragmented processes.
Extended Data Figure 8. Illustration that local myelin profiles did not change around stable OPCs.
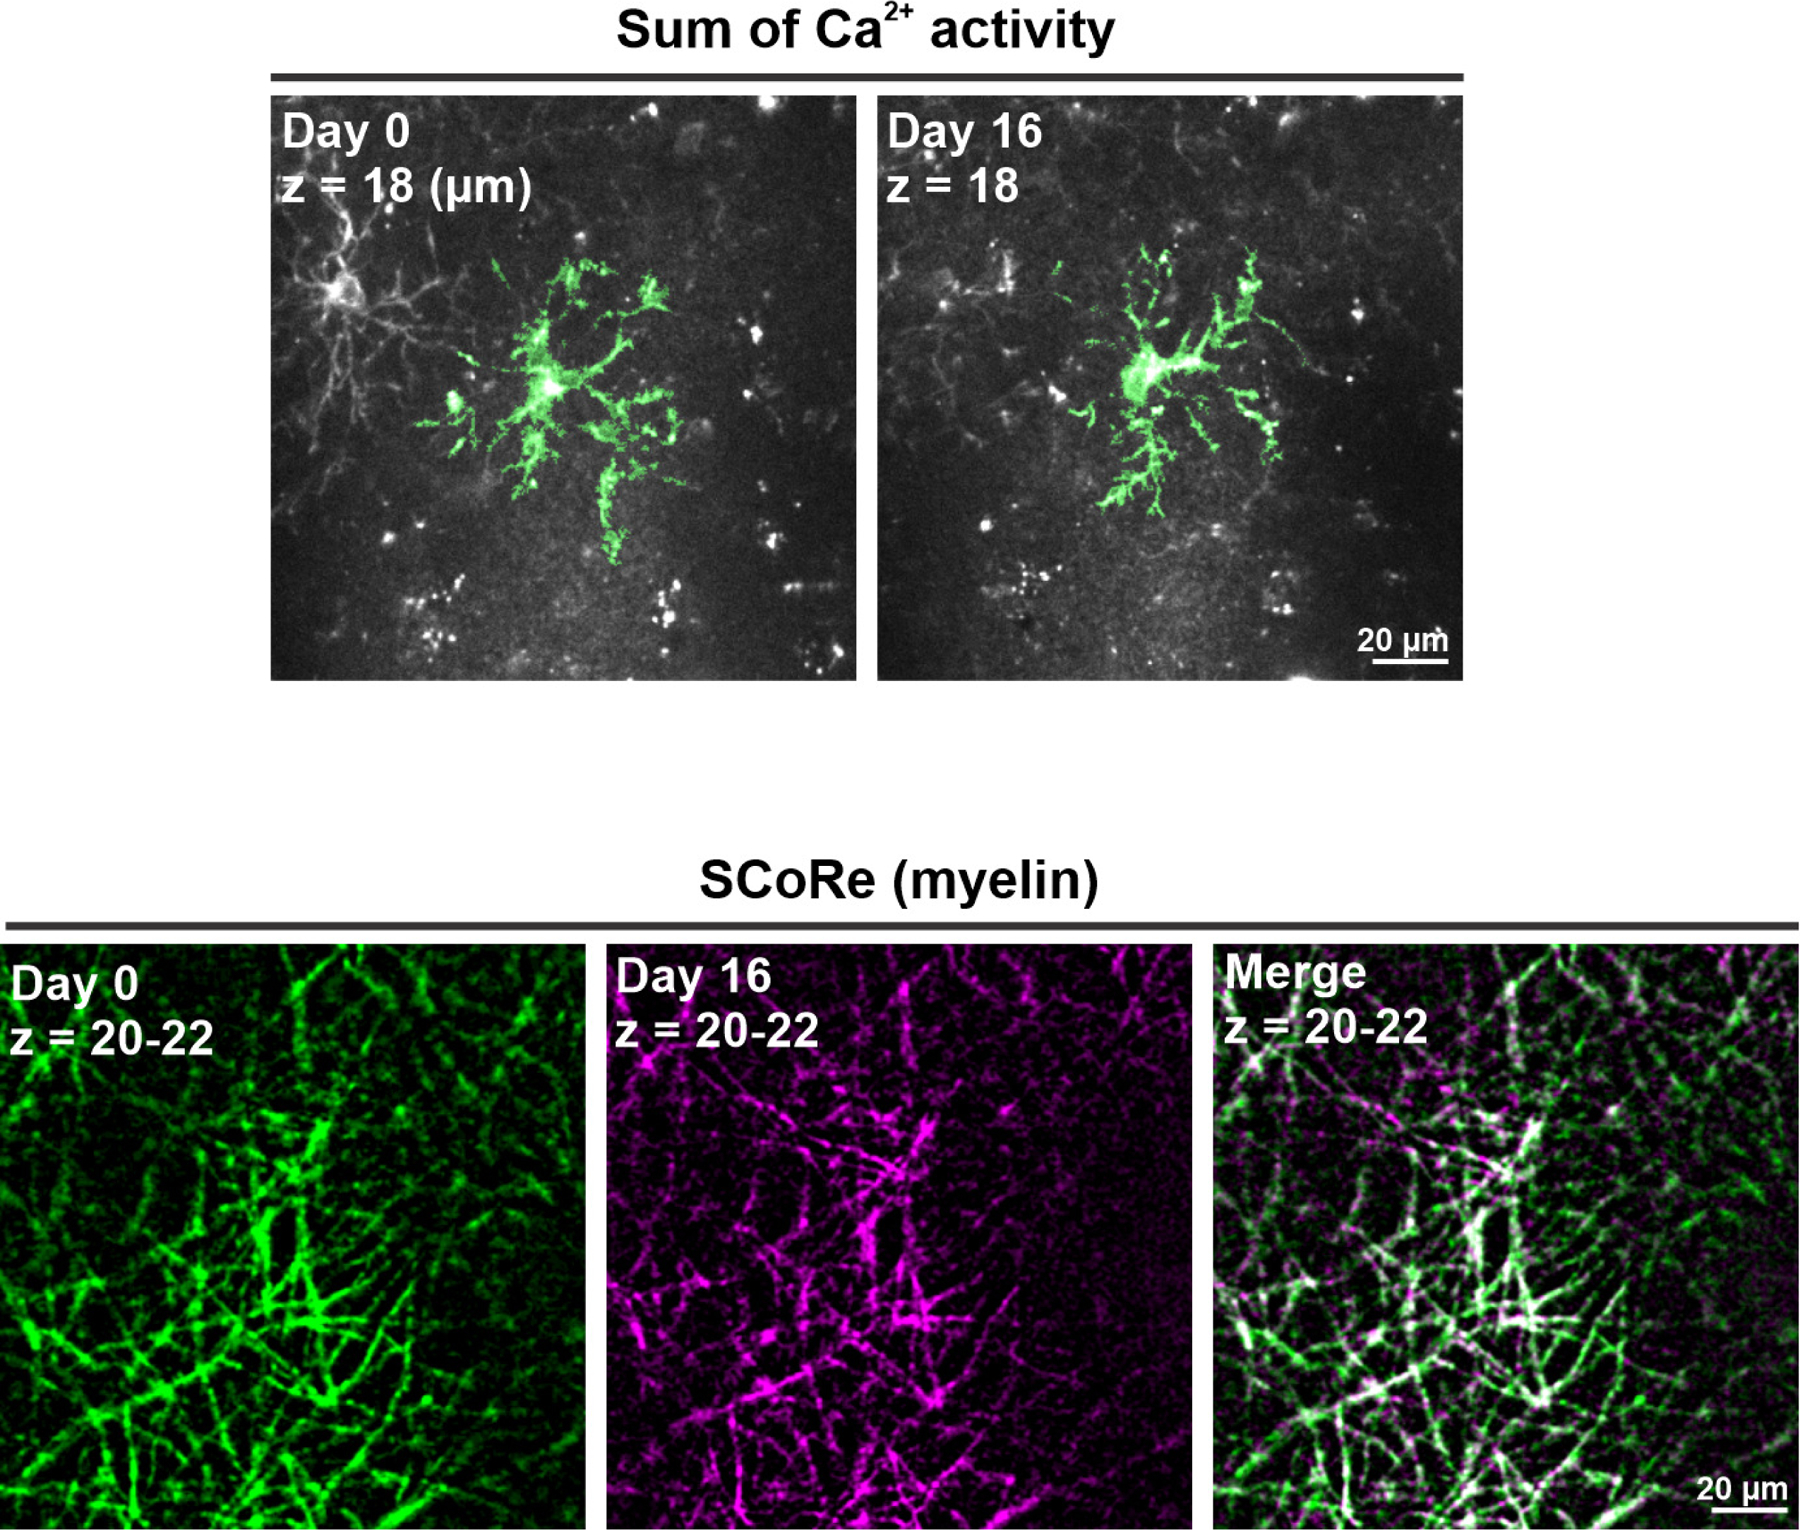
An mGCaMP6s-expressing OPC (highlighted in green) was followed for 16 days and the local myelin profile was recorded by SCoRE microscopy concurrently. The local myelin profile remained unchanged from Day 0 (green) to Day 16 (magenta).
Extended Data Figure 9. Myelinating oligodendrocytes exhibit infrequent Ca2+ events in only a select few myelin sheaths.
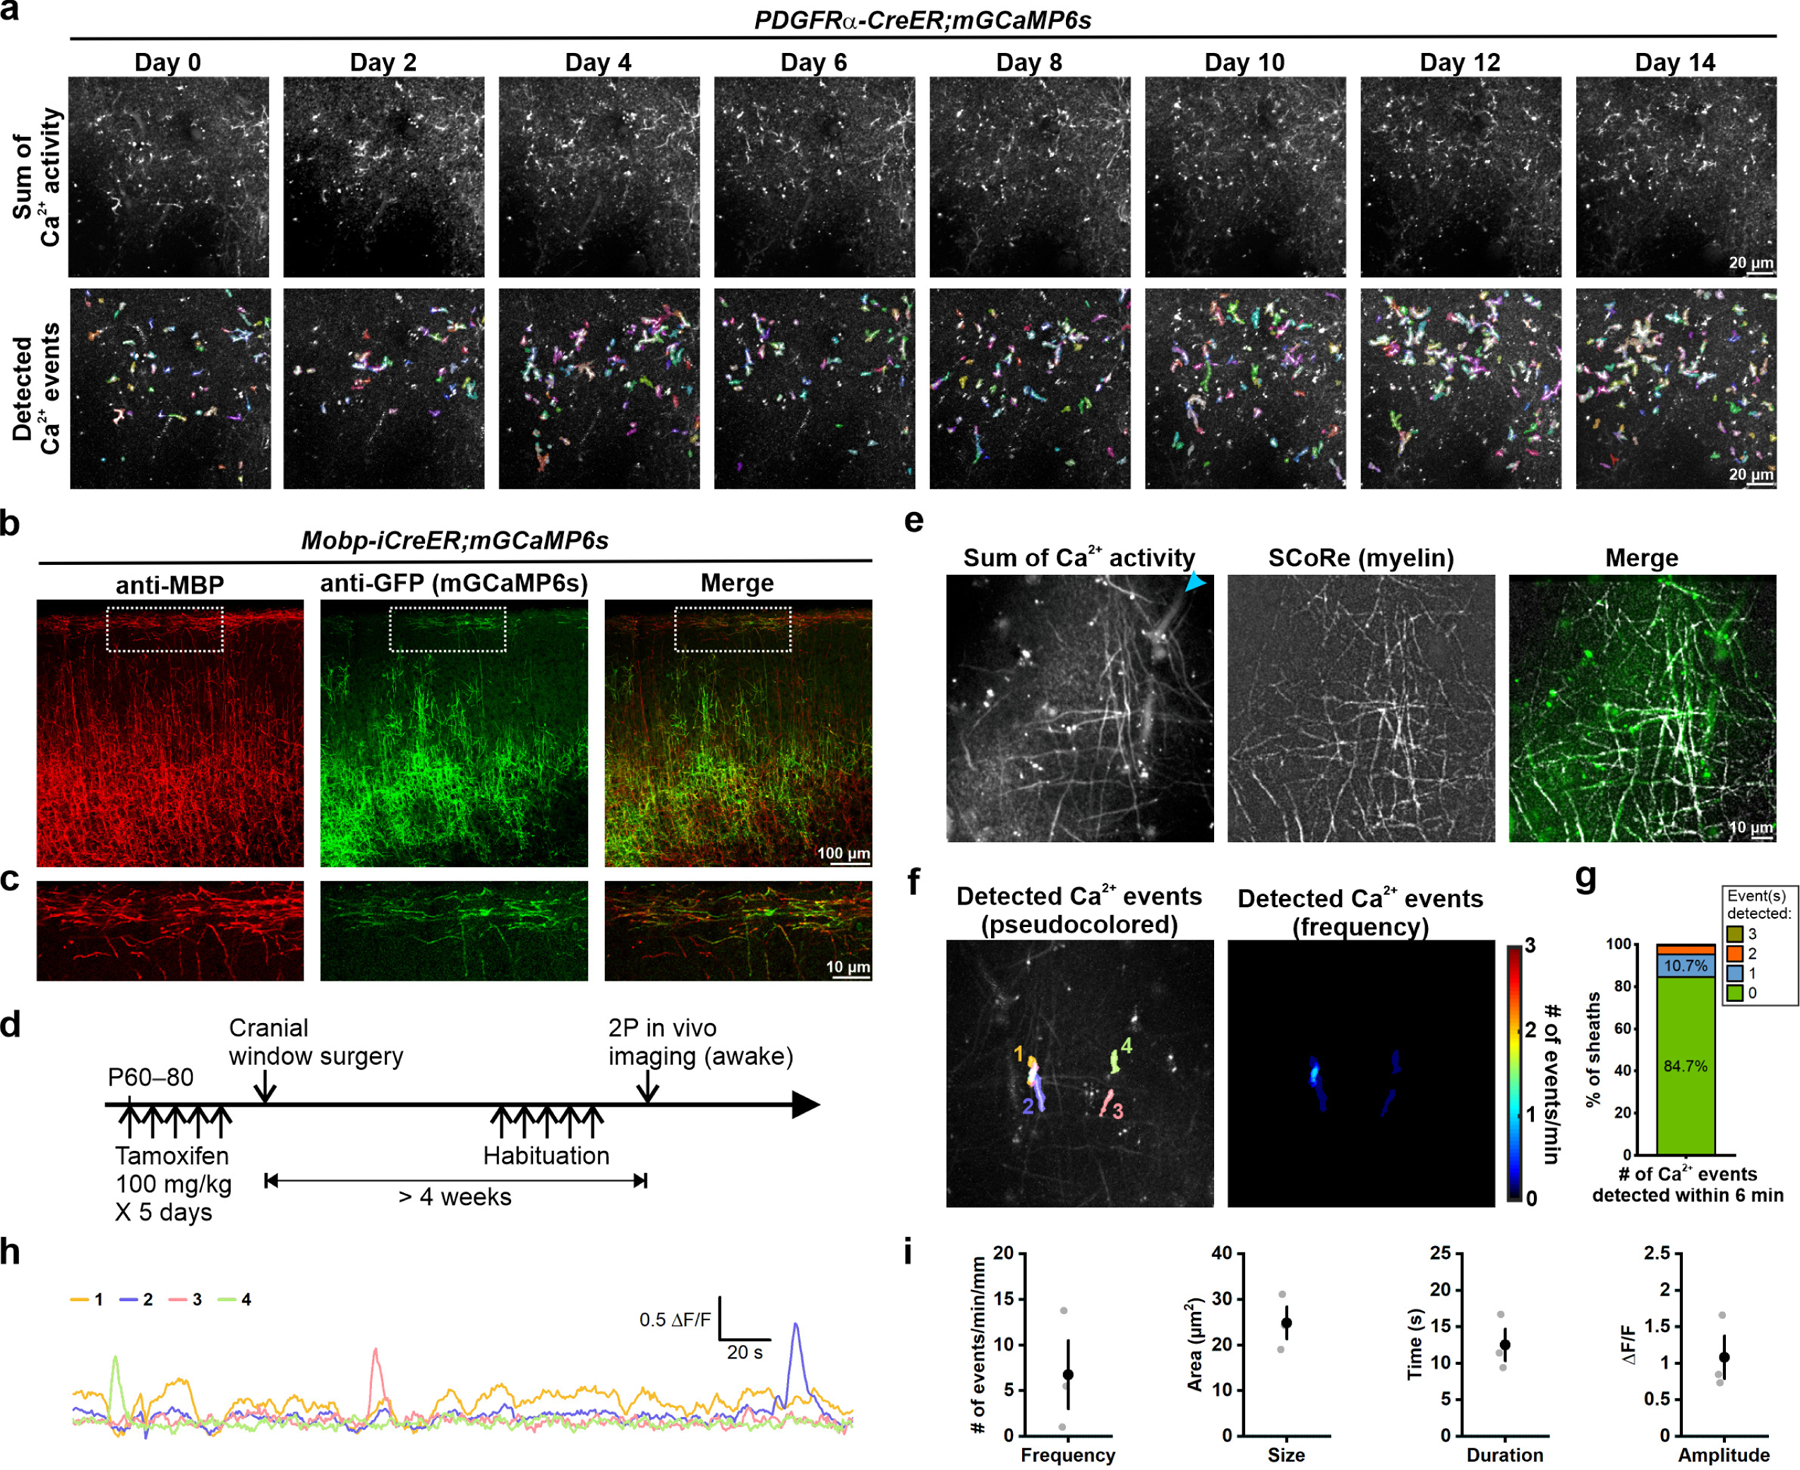
a, Local calcium events detected (randomly pseudocolored by AQuA) in the same imaging plane where the traced OPC (Figure 7f, highlighted in blue) became undetectable on Day 0. We did not observe persistent or enhanced Ca2+ events that can be attributed to the pre-myelinating OPC during this stage of maturation. b, Representative confocal images showing the expression of mGCaMP6s (anti-GFP) in the cortical myelinating oligodendrocytes (anti-MBP) using oligodendrocyte-specific and tamoxifen-inducible Cre transgenic line, Mobp-iCreER. c, The magnified views of the dotted squares in b. d, Schematic illustrations of the research design. The expression of mGCaMP6s in myelinating oligodendrocytes was induced between P60–80. Oligodendrocyte Ca2+ activity in the visual cortex of head-fixed, awake mice was observed and recorded using the same condition as the recording of OPC Ca2+ activity (see Fig. 1). e, Representative images showing the Ca2+ activity detected using 2P microscopy (Sum of Ca2+ activity from a 6-minute recording) corresponds to local myelin sheath detected using SCoRe. Blue arrowhead indicates auto-fluorescent vascular structures. f, Ca2+ events detected in e during a total 6-minute recording. g, Distribution of the number of Ca2+ events detected in myelin sheaths within 6 minutes (n = total 215 sheaths from 3 mice). Note that about 85% of the myelin sheath did not generate any Ca2+ event during the recording. h, Example ΔF/F traces of oligodendrocyte membrane Ca2+ events in f. i, Quantification of average Ca2+ event frequency, size, duration and amplitude (n = 3 mice).
Extended Data Figure 10. PE promotes OPC proliferation in vitro.
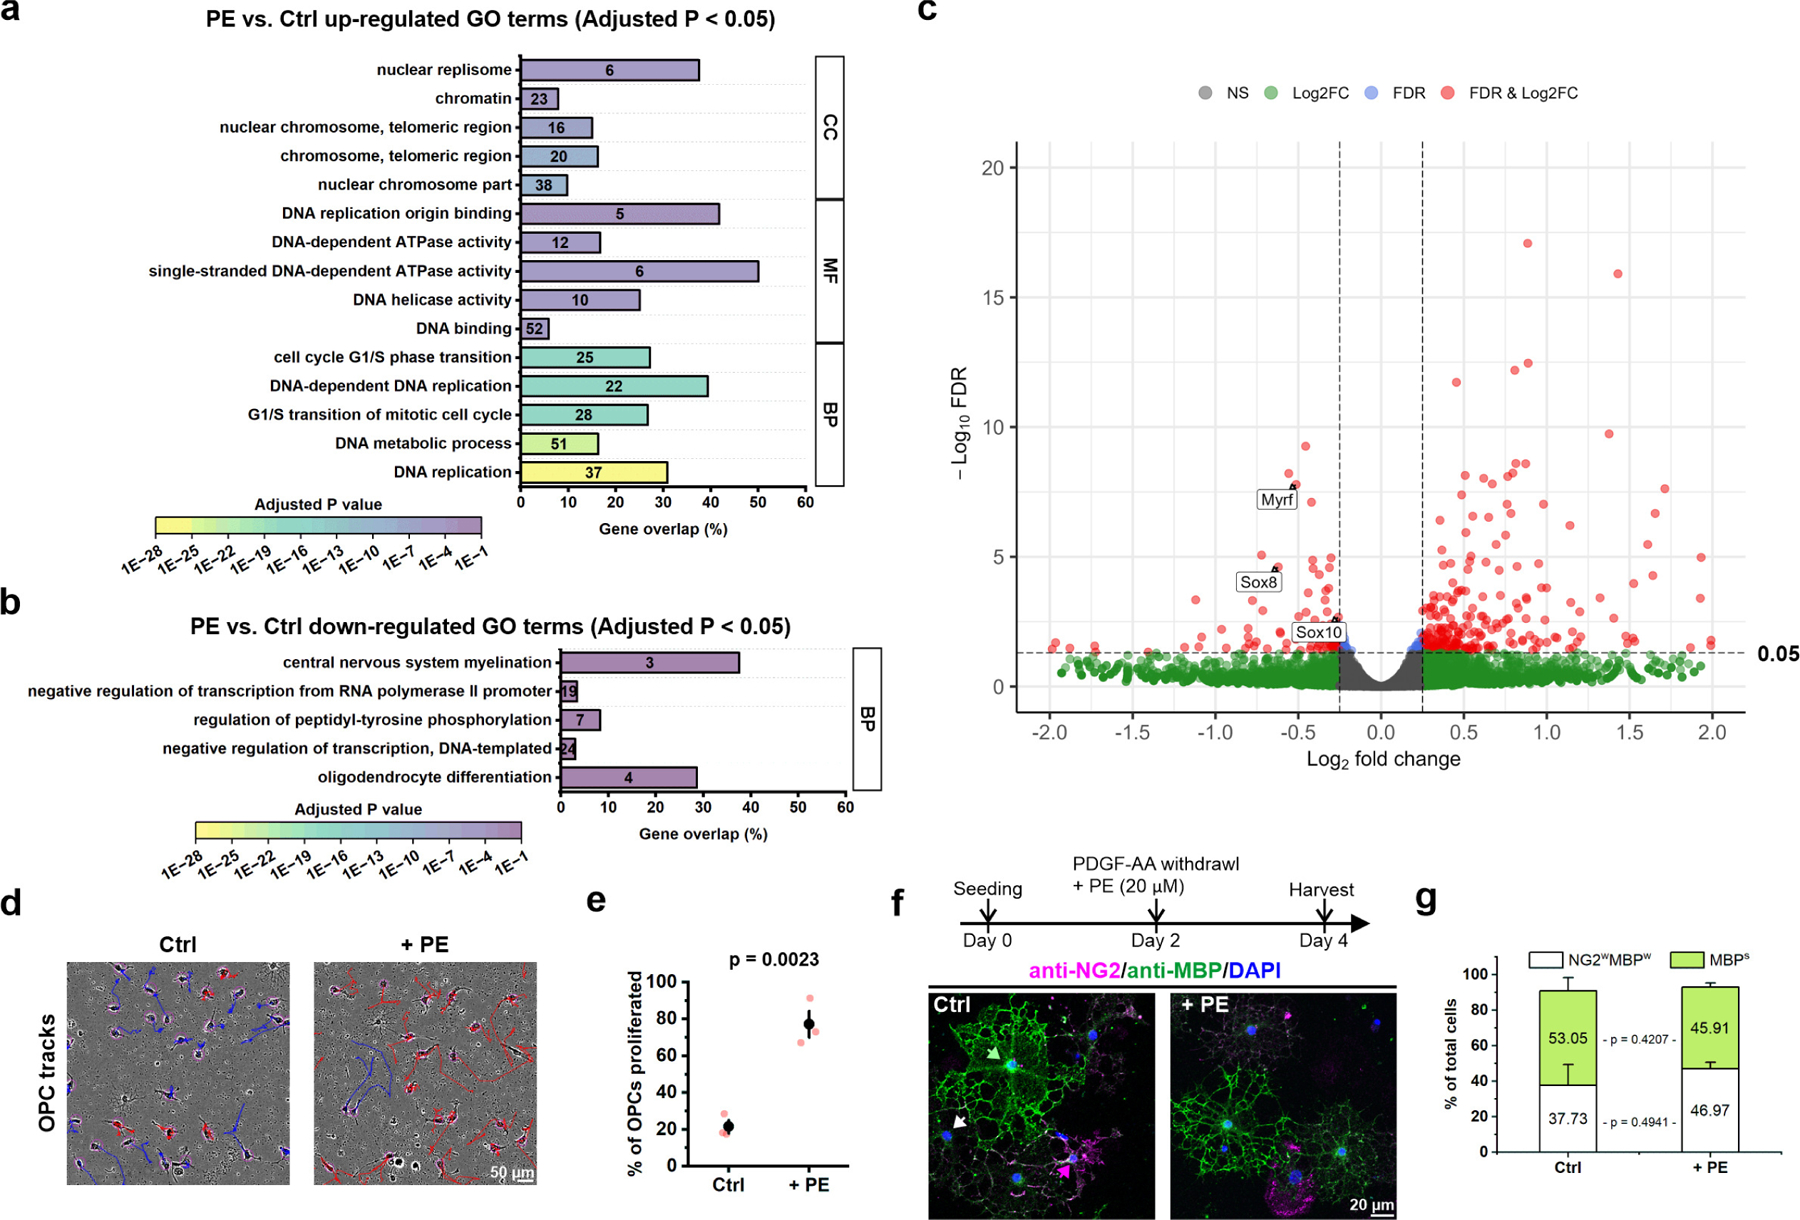
a, Gene ontology (GO) terms that were significantly up-regulated (the adjusted p value < 0.05) in primary OPCs after 1 hour of PE treatment (20 μM, n = 3 independent biological repeats). Numbers in the bars indicate the number of genes that were significantly up-regulated after PE treatment within each GO term. If more than 5 GO terms were significantly enriched within the subontology (BP: Biological process; MF: Molecular function. CC: Cellular component), only the top 5 GO terms were shown. b, GO terms that were significantly down-regulated (the adjusted p value < 0.05) in primary OPCs after 1 hour of PE treatment. c, Volcano plot showing differential gene expression in OPCs treated with PE for 1 hour compared to control (no treatment). FDR: false discovery rate. FC: fold change. Total variables: 19,820. d, Representative live cell tracking of primary cultured OPCs for 24 hours after PE treatment (+ PE) and without treatment (Ctrl). OPCs that did not proliferate within 24 hours were labeled in blue. OPCs that proliferated at least once within 24 hours were labeled in red. e, Quantification of OPC proliferation in control and +PE conditions. n = 3 independent biological repeats. Student’s t-test. f, The experimental design of OPC differentiation assay, and representative confocal images of the OPC/oligodendrocytes mixed cultures 2 days after PDGF-AA withdrawal (Day 4) in the absence (Ctrl) or with the presence of PE (+ PE). Green arrow indicates an example of fully differentiated oligodendrocytes with strong MBP expression (MBPs). White arrow indicates an example of differentiating OPCs that have weak expression of both NG2 and MBP (NG2wMBPw). Magenta arrow indicates an example of OPCs that remain undifferentiated with strong NG2 expression. g, Quantification of f. n = 3 independent biological repeats.
Supplementary Material
Supplementary Video 2. Membrane OPC Ca2+ activity in the visual cortex in vivo. Left: OPC Ca2+ activity detected by 2P microscopy; Right: Output video from AQuA with randomly-pseudocolored Ca2+ events (5x speed).
Supplementary Video 3. Enforced locomotion stimulates OPC Ca2+ activity in the mouse visual cortex. The red dot indicates when the platter began to rotate (movie played at 5x speed).
Supplementary Video 4. PE evokes Ca2+ influx in OPCs in acute cortical slices. PE was superfused ~3 min after the recording begins (movie shown at 50x speed).
Supplementary Video 5. Myelinating oligodendrocytes exhibit relatively infrequent Ca2+ activity in the visual cortex in vivo. Left: Oligodendrocyte near membrane Ca2+ activity detected by 2P microscopy; Right: Output video from AQuA with randomly-pseudocolored Ca2+ events (5x speed).
Supplementary Video 1. Cytosolic OPC Ca2+ activity in the visual cortex in vivo. Left: OPC Ca2+ activity detected by 2P microscopy; Right: Output video from AQuA with randomly-pseudocolored Ca2+ events (5x speed).
Supplementary Figure 1. OPC Ca2+ events last a minimum of 0.5 seconds. a, Images indicating summed fluorescence (left) and AQuA detected events (right) of Ca2+ events in OPC processes recorded at 10 Hz. b, Quantification of Ca2+ event duration, detected with 20 Hz imaging (animal #1) or 10 Hz imaging (animals #2 and #3). Note that every event detected is at least equal to or longer than 0.5 s.
Acknowledgements
We thank our colleagues for their support: T. Babola, Y. Wang, and G. Yu provided helpful suggestions for analyzing OPC Ca2+ activity. C. Call provided assistance in SCoRe microscopy. D.G. Caro, R. Catenacci, and M. Smith provided assistance in OPC live cell imaging. N. Ye and A.E. Bush helped with mouse husbandry. M. Pucak and A.E. Bush provided assistance with daily operation and maintenance of the microscopes essential to this study. We appreciate the generosity of the Scidraw community, especially Luigi Petrucco (doi.org/10.5281/zenodo.3925903, used in Fig. 1a), and Ethan Tyler Lex Kravitz (doi.org/10.5281/zenodo.3925975, used in Fig. 3a). This study was supported by grants from the Dr. Miriam and Sheldon G. Adelson Medical Research Foundation (AMRF), the National Institute of Neurological Disorders and Stroke (R01 NS041435), and the National Institute on Aging (R01 AG072305). E.T.H. is supported by National Science Foundation (2019278189).
Footnotes
Competing interests
The authors declare no competing interests
References
- 1.Xiao L et al. Rapid production of new oligodendrocytes is required in the earliest stages of motor-skill learning. Nat. Neurosci 19, 1210–1217 (2016). [DOI] [PMC free article] [PubMed] [Google Scholar]
- 2.Hughes EG, Orthmann-Murphy JL, Langseth AJ & Bergles DE Myelin remodeling through experience-dependent oligodendrogenesis in the adult somatosensory cortex. Nat. Neurosci 21, 696–706 (2018). [DOI] [PMC free article] [PubMed] [Google Scholar]
- 3.Chang A, Nishiyama A, Peterson J, Prineas J & Trapp BD NG2-Positive Oligodendrocyte Progenitor Cells in Adult Human Brain and Multiple Sclerosis Lesions. J. Neurosci 20, 6404–6412 (2000). [DOI] [PMC free article] [PubMed] [Google Scholar]
- 4.Orthmann-Murphy J et al. Remyelination alters the pattern of myelin in the cerebral cortex. eLife 9, e56621 (2020). [DOI] [PMC free article] [PubMed] [Google Scholar]
- 5.Buchanan J et al. Oligodendrocyte precursor cells ingest axons in the mouse neocortex. Proc. Natl. Acad. Sci 119, e2202580119 (2022). [DOI] [PMC free article] [PubMed] [Google Scholar]
- 6.Falcão AM et al. Disease-specific oligodendrocyte lineage cells arise in multiple sclerosis. Nat. Med 24, 1837–1844 (2018). [DOI] [PMC free article] [PubMed] [Google Scholar]
- 7.Kirby L et al. Oligodendrocyte precursor cells present antigen and are cytotoxic targets in inflammatory demyelination. Nat. Commun 10, 3887 (2019). [DOI] [PMC free article] [PubMed] [Google Scholar]
- 8.Auguste YSS et al. Oligodendrocyte precursor cells engulf synapses during circuit remodeling in mice. Nat. Neurosci 25, 1273–1278 (2022). [DOI] [PMC free article] [PubMed] [Google Scholar]
- 9.Larson VA, Zhang Y & Bergles DE Electrophysiological properties of NG2+ cells: Matching physiological studies with gene expression profiles. Brain Res 1638, 138–160 (2016). [DOI] [PMC free article] [PubMed] [Google Scholar]
- 10.Xiao Y, Petrucco L, Hoodless LJ, Portugues R & Czopka T Oligodendrocyte precursor cells sculpt the visual system by regulating axonal remodeling. Nat. Neurosci 25, 280–284 (2022). [DOI] [PMC free article] [PubMed] [Google Scholar]
- 11.Djogo T et al. Adult NG2-Glia Are Required for Median Eminence-Mediated Leptin Sensing and Body Weight Control. Cell Metab 23, 797–810 (2016). [DOI] [PubMed] [Google Scholar]
- 12.Zhang Y et al. An RNA-Sequencing Transcriptome and Splicing Database of Glia, Neurons, and Vascular Cells of the Cerebral Cortex. J. Neurosci 34, 11929–11947 (2014). [DOI] [PMC free article] [PubMed] [Google Scholar]
- 13.Marques S et al. Oligodendrocyte heterogeneity in the mouse juvenile and adult central nervous system. Science 352, 1326–1329 (2016). [DOI] [PMC free article] [PubMed] [Google Scholar]
- 14.Hrvatin S et al. Single-cell analysis of experience-dependent transcriptomic states in the mouse visual cortex. Nat. Neurosci 21, 120–129 (2018). [DOI] [PMC free article] [PubMed] [Google Scholar]
- 15.Bergles DE, Roberts JDB, Somogyi P & Jahr CE Glutamatergic synapses on oligodendrocyte precursor cells in the hippocampus. Nature 405, 187–191 (2000). [DOI] [PubMed] [Google Scholar]
- 16.Lin S & Bergles DE Synaptic signaling between GABAergic interneurons and oligodendrocyte precursor cells in the hippocampus. Nat. Neurosci 7, 24–32 (2004). [DOI] [PubMed] [Google Scholar]
- 17.Biase LMD, Nishiyama A & Bergles DE Excitability and Synaptic Communication within the Oligodendrocyte Lineage. J. Neurosci 30, 3600–3611 (2010). [DOI] [PMC free article] [PubMed] [Google Scholar]
- 18.Chen T-J et al. In Vivo Regulation of Oligodendrocyte Precursor Cell Proliferation and Differentiation by the AMPA-Receptor Subunit GluA2. Cell Rep 25, 852–861.e7 (2018). [DOI] [PubMed] [Google Scholar]
- 19.Káradóttir R, Cavelier P, Bergersen LH & Attwell D NMDA receptors are expressed in oligodendrocytes and activated in ischaemia. Nature 438, 1162–1166 (2005). [DOI] [PMC free article] [PubMed] [Google Scholar]
- 20.Khawaja RR et al. GluA2 overexpression in oligodendrocyte progenitors promotes postinjury oligodendrocyte regeneration. Cell Rep 35, (2021). [DOI] [PMC free article] [PubMed] [Google Scholar]
- 21.Kougioumtzidou E et al. Signalling through AMPA receptors on oligodendrocyte precursors promotes myelination by enhancing oligodendrocyte survival. eLife 6, e28080 (2017). [DOI] [PMC free article] [PubMed] [Google Scholar]
- 22.Mei F et al. Identification of the Kappa-Opioid Receptor as a Therapeutic Target for Oligodendrocyte Remyelination. J. Neurosci 36, 7925–7935 (2016). [DOI] [PMC free article] [PubMed] [Google Scholar]
- 23.Deshmukh VA et al. A regenerative approach to the treatment of multiple sclerosis. Nature 502, 327–332 (2013). [DOI] [PMC free article] [PubMed] [Google Scholar]
- 24.Hughes EG, Kang SH, Fukaya M & Bergles DE Oligodendrocyte progenitors balance growth with self-repulsion to achieve homeostasis in the adult brain. Nat. Neurosci 16, 668–676 (2013). [DOI] [PMC free article] [PubMed] [Google Scholar]
- 25.Marisca R et al. Functionally distinct subgroups of oligodendrocyte precursor cells integrate neural activity and execute myelin formation. Nat. Neurosci 23, 363–374 (2020). [DOI] [PMC free article] [PubMed] [Google Scholar]
- 26.Rungta RL, Chaigneau E, Osmanski B-F & Charpak S Vascular Compartmentalization of Functional Hyperemia from the Synapse to the Pia. Neuron 99, 362–375.e4 (2018). [DOI] [PMC free article] [PubMed] [Google Scholar]
- 27.Chen T-W et al. Ultrasensitive fluorescent proteins for imaging neuronal activity. Nature 499, 295–300 (2013). [DOI] [PMC free article] [PubMed] [Google Scholar]
- 28.Kang SH, Fukaya M, Yang JK, Rothstein JD & Bergles DE NG2+ CNS Glial Progenitors Remain Committed to the Oligodendrocyte Lineage in Postnatal Life and following Neurodegeneration. Neuron 68, 668–681 (2010). [DOI] [PMC free article] [PubMed] [Google Scholar]
- 29.Thrane AS et al. General anesthesia selectively disrupts astrocyte calcium signaling in the awake mouse cortex. Proc. Natl. Acad. Sci 109, 18974–18979 (2012). [DOI] [PMC free article] [PubMed] [Google Scholar]
- 30.Paukert M et al. Norepinephrine Controls Astroglial Responsiveness to Local Circuit Activity. Neuron 82, 1263–1270 (2014). [DOI] [PMC free article] [PubMed] [Google Scholar]
- 31.Silvestre JS & Prous J Research on adverse drug events. I. Muscarinic M3 receptor binding affinity could predict the risk of antipsychotics to induce type 2 diabetes. Methods Find. Exp. Clin. Pharmacol 27, 289 (2005). [DOI] [PubMed] [Google Scholar]
- 32.Cohen RI & Almazan G Norepinephrine-stimulated PI hydrolysis in oligodendrocytes is mediated by alpha 1A-adrenoceptors. Neuroreport 4, 1115–1118 (1993). [PubMed] [Google Scholar]
- 33.Papay R et al. Localization of the mouse α1A-adrenergic receptor (AR) in the brain: α1AAR is expressed in neurons, GABAergic interneurons, and NG2 oligodendrocyte progenitors. J. Comp. Neurol 497, 209–222 (2006). [DOI] [PubMed] [Google Scholar]
- 34.Ye L et al. Ethanol abolishes vigilance-dependent astroglia network activation in mice by inhibiting norepinephrine release. Nat. Commun 11, 6157 (2020). [DOI] [PMC free article] [PubMed] [Google Scholar]
- 35.He D et al. lncRNA Functional Networks in Oligodendrocytes Reveal Stage-Specific Myelination Control by an lncOL1/Suz12 Complex in the CNS. Neuron 93, 362–378 (2017). [DOI] [PMC free article] [PubMed] [Google Scholar]
- 36.Schain AJ, Hill RA & Grutzendler J Label-free in vivo imaging of myelinated axons in health and disease with spectral confocal reflectance microscopy. Nat. Med 20, 443–449 (2014). [DOI] [PMC free article] [PubMed] [Google Scholar]
- 37.Hill RA, Li AM & Grutzendler J Lifelong cortical myelin plasticity and age-related degeneration in the live mammalian brain. Nat. Neurosci 21, 683–695 (2018). [DOI] [PMC free article] [PubMed] [Google Scholar]
- 38.Barres A, Lazar MA & Raff MC A novel role for thyroid hormone, glucocorticoids and retinoic acid in timing oligodendrocyte development. Development 120, 1097–1108 (1994). [DOI] [PubMed] [Google Scholar]
- 39.Luttrell LM, Daaka Y & Lefkowitz RJ Regulation of tyrosine kinase cascades by G-protein-coupled receptors. Curr. Opin. Cell Biol 11, 177–183 (1999). [DOI] [PubMed] [Google Scholar]
- 40.Hamilton N, Vayro S, Wigley R & Butt AM Axons and astrocytes release ATP and glutamate to evoke calcium signals in NG2-glia. Glia 58, 66–79 (2010). [DOI] [PubMed] [Google Scholar]
- 41.Ge W-P et al. Long-Term Potentiation of Neuron-Glia Synapses Mediated by Ca2+-Permeable AMPA Receptors. Science 312, 1533–1537 (2006). [DOI] [PubMed] [Google Scholar]
- 42.Paez PM, Fulton DJ, Spreur V, Handley V & Campagnoni AT Multiple kinase pathways regulate voltage-dependent Ca2+ influx and migration in oligodendrocyte precursor cells. J. Neurosci. Off. J. Soc. Neurosci 30, 6422–6433 (2010). [DOI] [PMC free article] [PubMed] [Google Scholar]
- 43.Harlow DE, Saul KE, Komuro H & Macklin WB Myelin Proteolipid Protein Complexes with αv Integrin and AMPA Receptors In Vivo and Regulates AMPA-Dependent Oligodendrocyte Progenitor Cell Migration through the Modulation of Cell-Surface GluR2 Expression. J. Neurosci 35, 12018–12032 (2015). [DOI] [PMC free article] [PubMed] [Google Scholar]
- 44.Maldonado PP, Vélez-Fort M, Levavasseur F & Angulo MC Oligodendrocyte Precursor Cells Are Accurate Sensors of Local K+ in Mature Gray Matter. J. Neurosci 33, 2432–2442 (2013). [DOI] [PMC free article] [PubMed] [Google Scholar]
- 45.Spitzer SO et al. Oligodendrocyte Progenitor Cells Become Regionally Diverse and Heterogeneous with Age. Neuron 101, 459–471.e5 (2019). [DOI] [PMC free article] [PubMed] [Google Scholar]
- 46.Schwarz LA & Luo L Organization of the Locus Coeruleus-Norepinephrine System. Curr. Biol 25, R1051–R1056 (2015). [DOI] [PubMed] [Google Scholar]
- 47.Qian L et al. β2 adrenergic receptor activation induces microglial NADPH oxidase activation and dopaminergic neurotoxicity through an ERK-dependent/Protein Kinase A-independent pathway. Glia 57, 1600–1609 (2009). [DOI] [PMC free article] [PubMed] [Google Scholar]
- 48.Jhaveri DJ et al. Norepinephrine Directly Activates Adult Hippocampal Precursors via β3-Adrenergic Receptors. J. Neurosci 30, 2795–2806 (2010). [DOI] [PMC free article] [PubMed] [Google Scholar]
- 49.Bojarskaite L et al. Astrocytic Ca2+ signaling is reduced during sleep and is involved in the regulation of slow wave sleep. Nat. Commun 11, 3240 (2020). [DOI] [PMC free article] [PubMed] [Google Scholar]
- 50.Srinivasan R et al. Ca2+ signaling in astrocytes from Ip3r2−/− mice in brain slices and during startle responses in vivo. Nat. Neurosci 18, 708–717 (2015). [DOI] [PMC free article] [PubMed] [Google Scholar]
- 51.Papay R et al. Mouse α1B-adrenergic receptor is expressed in neurons and NG2 oligodendrocytes. J. Comp. Neurol 478, 1–10 (2004). [DOI] [PubMed] [Google Scholar]
- 52.Agarwal A et al. Transient Opening of the Mitochondrial Permeability Transition Pore Induces Microdomain Calcium Transients in Astrocyte Processes. Neuron 93, 587–605.e7 (2017). [DOI] [PMC free article] [PubMed] [Google Scholar]
- 53.Aston-Jones G & Bloom FE Activity of norepinephrine-containing locus coeruleus neurons in behaving rats anticipates fluctuations in the sleep-waking cycle. J. Neurosci 1, 876–886 (1981). [DOI] [PMC free article] [PubMed] [Google Scholar]
- 54.Matsumoto Y et al. Differential proliferation rhythm of neural progenitor and oligodendrocyte precursor cells in the young adult hippocampus. PloS One 6, e27628 (2011). [DOI] [PMC free article] [PubMed] [Google Scholar]
- 55.Bellesi M et al. Effects of Sleep and Wake on Oligodendrocytes and Their Precursors. J. Neurosci 33, 14288–14300 (2013). [DOI] [PMC free article] [PubMed] [Google Scholar]
- 56.Noble M, Murray K, Stroobant P, Waterfield MD & Riddle P Platelet-derived growth factor promotes division and motility and inhibits premature differentiation of the oligodendrocyte/type-2 astrocyte progenitor ceil. Nature 333, 560–562 (1988). [DOI] [PubMed] [Google Scholar]
- 57.Cooper GM The Eukaryotic Cell Cycle. in The Cell: A Molecular Approach 2nd edition (Sinauer Associates, 2000). [Google Scholar]
- 58.Bellesi M et al. Myelin modifications after chronic sleep loss in adolescent mice. Sleep 41, zsy034 (2018). [DOI] [PMC free article] [PubMed] [Google Scholar]
- 59.McKenzie IA et al. Motor skill learning requires active central myelination. Science 346, 318–322 (2014). [DOI] [PMC free article] [PubMed] [Google Scholar]
- 60.Grant SJ, Aston-Jones G & Redmond DE Responses of primate locus coeruleus neurons to simple and complex sensory stimuli. Brain Res. Bull 21, 401–410 (1988). [DOI] [PubMed] [Google Scholar]
Methods-only references
- 61.Wang Y et al. Accurate quantification of astrocyte and neurotransmitter fluorescence dynamics for single-cell and population-level physiology. Nat. Neurosci 22, 1936–1944 (2019). [DOI] [PMC free article] [PubMed] [Google Scholar]
- 62.Dubbs A, Guevara J & Yuste R moco: Fast Motion Correction for Calcium Imaging. Front. Neuroinformatics 10, (2016). [DOI] [PMC free article] [PubMed] [Google Scholar]
- 63.Kalman RE A New Approach to Linear Filtering and Prediction Problems. J. Basic Eng 82, 35–45 (1960). [Google Scholar]
- 64.Kang SH et al. Degeneration and impaired regeneration of gray matter oligodendrocytes in amyotrophic lateral sclerosis. Nat. Neurosci 16, 571–579 (2013). [DOI] [PMC free article] [PubMed] [Google Scholar]
- 65.Wolff C et al. Multi-view light-sheet imaging and tracking with the MaMuT software reveals the cell lineage of a direct developing arthropod limb. eLife 7, e34410 (2018). [DOI] [PMC free article] [PubMed] [Google Scholar]
Associated Data
This section collects any data citations, data availability statements, or supplementary materials included in this article.
Supplementary Materials
Supplementary Video 2. Membrane OPC Ca2+ activity in the visual cortex in vivo. Left: OPC Ca2+ activity detected by 2P microscopy; Right: Output video from AQuA with randomly-pseudocolored Ca2+ events (5x speed).
Supplementary Video 3. Enforced locomotion stimulates OPC Ca2+ activity in the mouse visual cortex. The red dot indicates when the platter began to rotate (movie played at 5x speed).
Supplementary Video 4. PE evokes Ca2+ influx in OPCs in acute cortical slices. PE was superfused ~3 min after the recording begins (movie shown at 50x speed).
Supplementary Video 5. Myelinating oligodendrocytes exhibit relatively infrequent Ca2+ activity in the visual cortex in vivo. Left: Oligodendrocyte near membrane Ca2+ activity detected by 2P microscopy; Right: Output video from AQuA with randomly-pseudocolored Ca2+ events (5x speed).
Supplementary Video 1. Cytosolic OPC Ca2+ activity in the visual cortex in vivo. Left: OPC Ca2+ activity detected by 2P microscopy; Right: Output video from AQuA with randomly-pseudocolored Ca2+ events (5x speed).
Supplementary Figure 1. OPC Ca2+ events last a minimum of 0.5 seconds. a, Images indicating summed fluorescence (left) and AQuA detected events (right) of Ca2+ events in OPC processes recorded at 10 Hz. b, Quantification of Ca2+ event duration, detected with 20 Hz imaging (animal #1) or 10 Hz imaging (animals #2 and #3). Note that every event detected is at least equal to or longer than 0.5 s.
Data Availability Statement
The gene expression dataset in Extended Data Figure 10c is deposited to Gene Expression Omnibus (GEO) with the accession #GSE226635 available to public immediately (https://www.ncbi.nlm.nih.gov/geo/query/acc.cgi?acc=GSE226635). Mouse genome assembly (GRCm38/mm10) used in this study is available via UCSC Genome Browser Gateway (https://genome.ucsc.edu/cgi-bin/hgGateway?db=mm10). All the images/videos generated during this study is available from the corresponding author by reasonable request.


