Author Correction: Genome Biol 24, 187 (2023)
https://doi.org/10.1186/s13059-023-03023-7
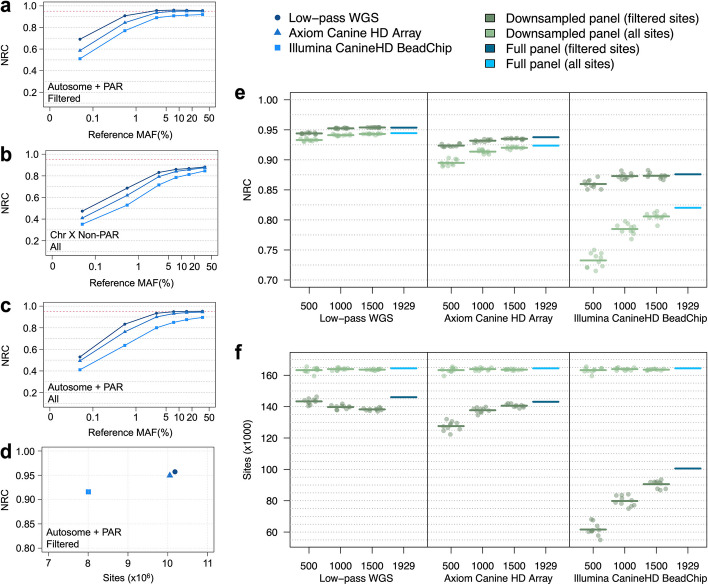
Following publication of the original article [1], the authors reported errors in Fig. 5 and Figure S1. The blue geometric symbols for Illumina Canine HD BeadChip and Axiom Canine HD Array were swapped in the figure keys. The colors of the lines and symbols in the plots are correct. The corrected Fig. 5 is given below. The updated additional file 2 is published in this correction article.
Fig. 5.
Genotype imputation accuracy of the Dog10K reference panel. a NRC rates of imputed genotypes across autosomes and the PAR segment of chromosome X. Variant sites are filtered according to GLIMPSE and IMPUTE5 imputation quality scores (INFO > 0.9). b NRC rates of imputed genotypes across the non-PAR segment of chromosome X. Variants are not filtered by imputation quality score, as imputation software does not provide scores for haploid genotypes. c NRC rates of imputed genotypes across autosomes and the PAR segment of chromosome X prior to filtering on imputation quality. d NRC rates and total number of imputed sites for each platform. Sites were filtered according to imputation quality score > 0.9 and reference MAF > 1%. e NRC rates for downsampled and full chromosome 38 reference panels for sites with reference MAF > 1%. Results show both quality and non-quality filtered sites. Data points show NRC rates for a single downsampled reference panel. Horizontal bars indicate mean NRC rates for each reference panel population size. f Number of imputed variants for downsampled and full chromosome 38 reference panels for sites with reference MAF > 1%. Results show both quality and non-quality filtered sites. Data points show the number of imputed variants for a single downsampled reference panel. Horizontal bars indicate the mean number of variants for each reference panel population size
These errors do not affect the main results and conclusions of the paper. The original article [1] has been updated.
Supplementary Information
Additional file 2: Supplementary Methods [165-182]. Fig. S1. Imputation accuracy of individual samples for sites with MAF > 1%. Fig. S2. Median copy-number across the genome for wolves. Fig. S3. Repeatmasker classification of SINE variation. Fig. S4. Distribution of variation across the genome for breed and other dogs (n=1,591). Fig. S5. Nucleotide diversity along chr26. Fig. S6. Signature of a retrogene detected at the TEX2 locus.
Footnotes
Jennifer R. S. Meadows and Jefrey M. Kidd contributed equally to this work.
Ya-Ping Zhang and Elaine A. Ostrander co-senior authors.
Contributor Information
Jennifer R. S. Meadows, Email: jennifer.meadows@imbim.uu.se
Jefrey M. Kidd, Email: jmkidd@umich.edu
Elaine A. Ostrander, Email: eostrand@mail.nih.gov
Reference
- 1.Meadows JRS, Kidd JM, Wang GD, et al. Genome sequencing of 2000 canids by the Dog10K consortium advances the understanding of demography, genome function and architecture. Genome Biol. 2023;24:187. doi: 10.1186/s13059-023-03023-7. [DOI] [PMC free article] [PubMed] [Google Scholar]
Associated Data
This section collects any data citations, data availability statements, or supplementary materials included in this article.
Supplementary Materials
Additional file 2: Supplementary Methods [165-182]. Fig. S1. Imputation accuracy of individual samples for sites with MAF > 1%. Fig. S2. Median copy-number across the genome for wolves. Fig. S3. Repeatmasker classification of SINE variation. Fig. S4. Distribution of variation across the genome for breed and other dogs (n=1,591). Fig. S5. Nucleotide diversity along chr26. Fig. S6. Signature of a retrogene detected at the TEX2 locus.


