

Abstract
ARL15, a small GTPase protein, was linked to metabolic traits in association studies. We aimed to test the Arl15 gene as a functional candidate for metabolic traits in the mouse. CRISPR/Cas9 germline knockout (KO) of Arl15 showed that homozygotes were postnatal lethal and exhibited a complete cleft palate (CP). Also, decreased cell migration was observed from Arl15 KO mouse embryonic fibroblasts (MEFs). Metabolic phenotyping of heterozygotes showed that females had reduced fat mass on a chow diet from 14 weeks of age. Mild body composition phenotypes were also observed in heterozygous mice on a high fat diet (HFD)/low fat diet (LFD). Females on a HFD showed reduced body weight, gonadal fat depot weight and brown adipose tissue (BAT) weight. In contrast, in the LFD group, females showed increased bone mineral density (BMD) while males showed a trend towards reduced BMD. Clinical biochemistry analysis of plasma on HFD showed transient lower adiponectin at 20 weeks of age in females. Urinary and plasma Mg2+ concentrations were not significantly different. Our phenotyping data showed that Arl15 is essential for craniofacial development. Adult metabolic phenotyping revealed potential roles in brown adipose tissue and bone development.
Keywords: Small GTPases, Cleft Palate, Cell Migration, Adiposity, Bone Mineral Density, Epithelium to Mesenchymal Transition (EMT), Intermediate Filament
Graphical Abstract
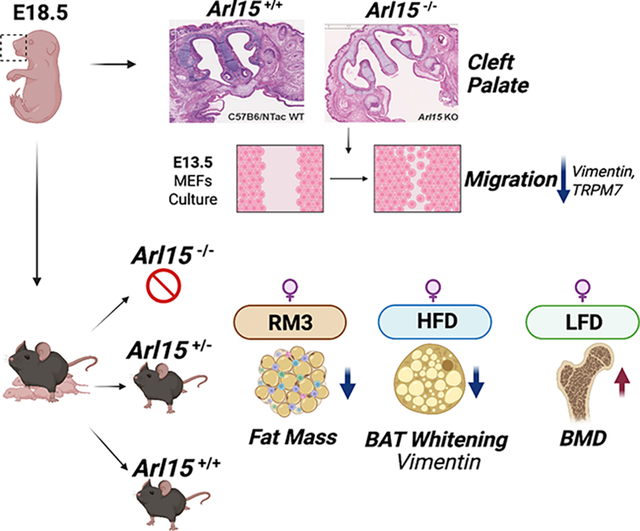
The ADP-ribosylation factor like 15 (Arl15) gene was knocked out by using CRISPR-Cas9 that targeted exon 2 globally. Homozygous mutant embryos exhibited a cleft palate and died postnatally. KO MEFs collected at E13.5 showed reduced cell migration in vitro. Heterozygotes were viable and exhibited minor metabolic phenotypes such as reduced fat mass on normal chow. HFD induced whitening of brown adipose tissue, however, heterozygous female mice showed less whitening compared to wildtype. LFD resulted in female heterozygous having an increased BMD.
Introduction
ADP-ribosylation factor-like 15 (ARL15) protein belongs to the ADP-ribosylation factor family (ARF). ARF together with four other families: Rab, Ran, Ras and Rho, form the Ras superfamily. The ARL15 protein has a functional domain highly homologous to ARF/SAR subfamily proteins. The ARF subfamily plays a significant role in vesicle trafficking by modulating vesicle budding and uncoating within the Golgi apparatus through cycles of GTP/GDP-binding (1). Indeed, ARL15 is predominantly expressed in the Golgi apparatus and has been demonstrated to regulate glycosylation of membrane proteins (2–4). However, a GTPase function has never been confirmed to date.
Genome wide association studies (GWAS) linked ARL15 locus to type 2 diabetes, coronary heart disease and adiponectin level (5), HDL-C, triglyceride level, insulin resistance dependent on peripheral fat storage (6), kidney function (7) and Mg2+ homeostasis (8), although these studies do not show functional causality for the ARL15 gene. Rocha et al. later demonstrated Arl15’s role in adipogenesis as well as adiponectin secretion in 3T3-L1 mouse preadipocytes and discovered two human lipodystrophy patients carrying heterozygous mutations in the ARL15 gene (2). In addition, ARL15 function has also been linked to insulin secretion in a human pancreatic β cell line (9, 10), insulin signalling (11), tumour suppression in the mouse (12), upregulation of adiponectin in synovial tissue (13), Mg2+ uptake in kidney cell lines (4) and upregulation of TGFβ signalling (14). A recent study revealed its molecular function in cargo transport, adhesion and cell motility which is ARF1 dependent (15). However, its functional role in a mammalian in vivo system remains unknown. Here we generated on a C57BL/6NTac background, a global knockout (KO) of the Arl15 gene in mice using CRISPR/Cas9. By extensive metabolic phenotyping, we aimed to determine the role of ARL15 in development and metabolism.
Materials and Methods
Designing and breeding for CRISPR/Cas9 induced knockout mice
The Molecular and Cellular Biology team at the MRC Harwell Institute used CRISPR/Cas9 to introduce indels in exon 2 of the Arl15 gene. The detailed methods have been previously published (16). Exon2 is shared by all the transcripts of the Arl15 gene and indels in exon2 generated frameshifts in all the transcripts. A sgRNA containing 23 bp 5’ AAGTCATATTCAGGGCGCGCAGG 3’, predicted to have the least off-target effect from Wellcome Sanger Institute Genome Editing (WGE) website, was used. Genotyping of the mutant mice was done with the forward primer 5’ GATGTGCAGTAGTGGGATGCT 3’ and the reverse primer 5’ GGAGACAAGGAGGACACAA 3’. Five out of 15 founders were found to be mutated and three founder animals were mated to assess the germ-line transmission of the mutated alleles. An indel containing 2-nucleotide mutations was successfully germline transmitted which resulted in a frameshift and the appearance of a premature stop codon therefore creating a null allele of Arl15. Briefly, the F1 ARL15-INDEL-CAS-LINE2-B6N/1.1f founder male that carried the indel mutation in exon 2 of Arl15 was backcrossed to C57BL/6NTac females to produce heterozygous F2 animals that had the stock code: Arl15-Del2-EM1-B6N. These mice have now been given the designation C57BL/6NTac-Arl15em1(IMPC)H/H and can be obtained from the MRC Harwell Institute which distributes these mice on behalf of the European Mouse Mutant Archive (www.infrafrontier.eu; Repository number EM:10785).
Arl15 lacZ reporter mice generation
We utilized the “knockout first” allele targeted construct from the European Conditional Mouse Mutagenesis Program (EUCOMM) to generate lacZ reporter mice for the Arl15 gene. Briefly, the mouse Arl15tm1a(EUCOMM)WtsiArl15 allele was crossed to a global Cre expressing mouse which leads to deletion of the neomycin cassette and exon 2 of Arl15 upon recombination between the loxP sites. The resulting allele Arl15tm1b(EUCOMM)Wtsi, lacZ reporter mice expresses the β-galactosidase gene in tissues where Arl15 would be expressed. Embryos carrying tm1b lacZ allele were collected at E12.5 for x-gal staining to investigate where Arl15 gene is expressed in mouse embryo tissues.
Animal Husbandry
Mice were kept and studied in accordance with UK Home Office legislation and local ethical guidelines issued by the Medical Research Council (Responsibility in the Use of Animals for Medical Research, July 1993; home office licence 30/3146). Procedures were approved by the MRC Harwell Animal Welfare and Ethical Review Board (AWERB). Mice were kept under controlled light (light 7am–7pm, dark 7pm–7am), temperature (21±2°C) and humidity (55±10%) conditions. They had free access to water (9–13 ppm chlorine) and were fed ad libitum on a commercial diet (SDS Rat and Mouse No. 3 Breeding diet, RM3, France).
Protein sequence and transcript bioinformatics search
Arl15 transcript information was obtained from the Ensemble browser (https://www.ensembl.org). A list of ARL15 family members was generated using Panther (http://www.pantherdb.org/) and they were then mapped using JalView 2.9.0b2 (17) to show the conserved motifs at the residue level.
Phenotyping pipeline
Firstly, a small cohort of heterozygous mice (n=6–10) were generated and fed with the RM3 diet to assess their body mass and body composition. Then a pilot cohort of homozygous, heterozygous and wildtype mice were generated by intercrossing (IC) heterozygous F2 mice to assess homozygous viability and evaluate any underlying welfare issues. Finally, a cohort of wildtype and heterozygous BC mice were generated for large scale of metabolic phenotyping on high fat diet (HFD) (60% fat, D12492, Research Diets, USA) and matched low fat diet (LFD) (10% fat) low sucrose (7%) control diet (D12450J, Research Diets, USA). To achieve this, heterozygous male Arl15-Del2-EM1-B6N mice aged between 6–8 weeks were backcrossed to C57BL/6NTac females to produce heterozygotes. Therefore, new cohorts of BC mice with n=20–25 (80% power at p=0.01) per genotype per sex were generated and weaned onto HFD or matched LFD for metabolic phenotyping. Mice in the BC phenotype study were randomised to diet groups and the phenotype data collection was blinded to genotype. To do this, progenies were biopsied at 2 weeks of age and weaned at 3 weeks of age into cages with the high fat (60%) and matched low fat (10%) low sucrose (7%) control diet. All the procedures were carried out following the standard protocols according to EMPReSS (European Phenotyping Resource for Standardised Screens from EUMORPHIA). A tailored metabolic phenotyping pipeline was created to cover body composition, glucose homeostasis, and insulin sensitivity, bone density, circulating hormones, lipids, and electrolytes (Supplementary Fig. 7).
Body Composition
Body mass was measured every two weeks from weaning using scales calibrated to 0.01 g. Body composition was measured using an Echo-MRI (EMR-136-M, Echo-MRI, Texas, USA) to determine whole body fat, lean, free water, and total water mass.
Dual Energy X-ray Absorptiometry (DEXA)
Terminally anaesthetised mice were assessed using a Lunar Piximus II (GE Medical Systems, USA) to measure bone density and soft tissue values.
Fasted blood plasma analysis
Mice were fasted overnight, weighed and blood collected from the tail vein into Lithium-heparin microvette tubes (CB300, Sarstedt, Numbrecht, Germany) under local anaesthetic (EMLA cream, Eutectic Mixture of Local Anaesthetics, Lidocaine/Prilocaine, AstraZeneca, U.K.). Alternatively, blood was collected from the retro-orbital sinus under a terminal anaesthetic. Blood samples were centrifuged at 800 × g for 10 minutes at room temperature. The supernatant (plasma) was transferred into a 1.5 mL Eppendorf tube and stored at −20°C before testing. Insulin plasma concentrations were measured using a Mercodia Insulin ELISA kit (Mercodia, Sweden). Adiponectin levels were measured using a Mouse Adiponectin ELISA kit (EZMADP-60K, Merck, Germany). The plasma concentrations of glucose, ions (including Na+, K+, Cl−, Ca2+), creatinine, total cholesterol, HDL-C, LDL-C, triglyceride, free fatty acids, glycerol, ALP, ALT, and urine creatinine measured on an AU400 (Olympus, U.K.). Serum and urinary total Mg2+ concentrations were measured by a colorimetric xylidyl-II blue assay kit (Roche Diagnostics, Woerden, The Netherlands), according to the protocol provided by the manufacturer. Urine volume was measured in order to calculate 24-hour Mg2+ excretion. Haemolysis was recorded from plasma samples with AU400 Olympus and analysis of potassium, glucose, triglycerides, and total cholesterol levels were carried out by using non-haemolyzed samples. Plasma samples with haemolysis score given by two plus (++) flag were excluded.
Urine collection
Urine was collected over 24 hours and their weight measured. Urine creatinine was measured on an AU400 Olympus chemistry analyser (Olympus and Beckman Coulter, USA), as described (18).
Adult Tissue Collection for RNA, DNA and Protein Extraction
Tissue was collected from adult mice; liver, kidneys, inguinal white adipose tissue, gonadal WAT, brown adipose tissue and pancreas were snap frozen in liquid nitrogen using 2 mL cryotubes (Nunc, Thermo Fisher Scientific, USA) and stored below −70 °C.
Haematoxylin and Eosin Staining of Tissues
Epi-gonadal WAT, inguinal WAT and BAT were dissected and fixed in 10% neutral buffered formaldehyde (Surgipath Europe Ltd, U.K.). Sagittal sections were prepared at a thickness of 8 μm across the whole tissue with 50 μm between levels. H&E staining was carried out and slides scanned using ZEISS Axioscan 7 (ZEISS, Germany) at magnification of 20x.
Statistical Analysis
Results are expressed as mean ± standard error of the mean (S.E.M.). Statistical analysis was carried out using GraphPad Prism Software (GraphPad, USA), version 9.0. Area under curve (AUC) analysis was performed using GraphPad Prism and compared using unpaired t-tests as described in the figure legends. The significance levels between genotype groups are indicated by asterisks in each figure above the bars: *P<0.05; **P<0.01; ***P<0.001.
Bioinformatic interactome analysis of the CP
Genes associated with craniofacial, cardiovascular, and adipose phenotypes from the Mammalian Genome Informatics (MGI) database and Arl15 were organized into a protein-protein interaction network using String (19). Genes that are first and second interaction partners of Arl15 were placed in cluster 1 and the other genes in cluster 2. Both clusters were assessed for their overrepresenting KEGG pathways and biological pathways using g:Profiler (20).
Micro-CT sample preparation and imaging
Embryos at either 14.5 dpc or 18.5 dpc, were collected, processed and imaged using microCT by the CRISPR team at Harwell to generate embryos’ phenotype. Mice were mated and detection of a vaginal plug the following morning was considered 0.5 dpc. Collected embryos were placed in individual wells of a 6-well plate and fixed in 10 mL of 4% paraformaldehyde (PFA) (158127, Sigma-Aldrich, Germany) pH 8.0. E14.5 embryos were fixed overnight on a rocker at 4°C and E18.5 embryos were fixed for 7 days on a rocker at 4°C. Once fixation was confirmed embryos were stored in 1% PFA, pH 8.0 until ready for potassium triiodide (Lugol) staining (32922, Sigma-Aldrich, Germany). Embryos were placed in individual glass bijou bottles with 15 mL of contrast agent, 50% Lugol solution made up in distilled water (dH2O). These were wrapped in foil to protect from light and placed on a rocker at room temperature. E14.5 embryos were contrasted for two days without changing the Lugol solution. E18.5 embryos were contrasted for 14 days changing the Lugols solution every other day. Following contrast samples were rinsed and then washed with dH2O for at least one hour to remove any excess contrast solution. Samples were then embedded in 1% Iberose – High specification agarose (AGR-500, Web Scientific, UK). 4.5mL CryoTube vials were used to embed up to 4 × E14.5 embryos and a supplied sample tube was used to embed up to 2 × E18.5 embryos. Samples were left to set in the agarose for a minimum of two hours at room temperature prior to scan initiation.
For imaging each embryo, 3D datasets were acquired using a Skyscan 1172 high resolution Micro-CT scanner (Bruker, USA). Scans were carried out with the X-ray source at 80 kVp and 124 μA and using an aluminium filter. Using the NRecon software supplied with the Micro-CT scanner, slices were reconstructed into digital cross sections by a Feld Kamp algorithm for cone beam CT. The resulting 3D dataset is 4000 × 4000 × 2000 voxels of 3 μm for E14.5 and 5 μm for E18.5. Following reconstruction, 3D datasets underwent further processing through an in-house made program, HARP (21), which automatically crops tightly around the sample to remove empty data. Once post-processed, datasets were viewed in 3D Slicer (http://slicer.org/) or FUJI. To assess the embryo’s phenotype in more detail a LAMA pipeline was used, the methods of which can be found in previous published paper (22).
Mouse Embryonic Fibroblast (MEFs) Culture
Timed matings were set up and females were plug checked. Embryos that at 13.5 days post coitum (dpc) were collected and cultured. The individual embryo was firstly placed into ice old DPBS no calcium, no magnesium (14190144, Gibco, ThermoFisher Scientific, USA) in a well of a 6-well plate. The head, liver, heart and four limbs were removed in PBS and the body was transferred into 3 mL of 0.25% trypsin (EDTA) (ThermoFisher Scientific, USA) and minced using surgical scissors and a scalpel. Tissue was then pipetted up and down 10 times in a P1000 pipette tip to ensure good dissociation before transfer into a 15 mL Falcon tube. The tube was then incubated in 37°C water bath for 10 minutes before 7 mL of fresh MEF media (DMEM, 10% FBS) (DMEM 31966021, FBS 10082147, ThermoFisher Scientific, USA) was added to deactivate trypsin. The 10 mL cell suspension was then plated onto a 10 cm2 tissue culture dish and placed into an incubator. MEFs were passaged 1 in 3 at 80% confluence.
Wound Healing Assay
The wound healing assay was carried out in the ibidi Culture-Insert 2 Well 24 well plate (80242, ibidi®, Germany). Before cells were plated, each insert of the 2 well was coated with 60 μg/mL of bovine collagen I (Cultrex®, R&D Systems, USA). Then P3 mouse embryonic fibroblasts (MEFs) of Arl15 wildtype (Arl15+/+) (N=3) and homozygous KO (Arl15−/−) (N=3) were counted from Countess® Automated Cell Counter (ThermoFisher Scientific, USA). 350k cells in 70 μL complete media (5×10⁵ /mL) were plated into each insert. The next day, each well was treated with 1 mL of either complete culture media or complete media supplemented with 20 ng/mL recombinant human PDGF-BB (PHG0044, Gibco, USA), 5 ng/mL mouse recombinant TGF-β1 (7666-MB, R&D® System, USA) or 10 μM cytochalasin D (C2618, Merck, Germany). Wound healing was imaged every hour over 19 hours using BioTek Cytation1 cell imaging machine (Agilent, USA). Images were analyzed using Agilent BioTek Gen5™ software. A plug function was used to assign a fix area for analysis which was set at 1000 μm (Width) × 500 μm (Length). The percent confluency within the wound area was calculated by following the formula below:
is the average wound width (μm) at the first time point, is the image plug width (μm), is the image plug length (μm), and the is the calculated metric from Gen5 (μm2).
EdU Click-it proliferation assay
MEFs from passage number 1 were thawed and maintained in 10% FBS in high glucose DMEM media (31966021, ThermoFisher Scientific, USA) in 10cm2 cell culture dishes. Cells were split 1 in 3 when reaching 80–90% confluency. To capture cell proliferation, EdU was pulse labelled 24 hours before serum starvation (T-24) in complete culture medium with 10% FBS, 24 hours post serum starvation (T0) in 0.01% FBS in DMEM medium and 24 hours post recovering in complete culture medium (T24). Each labelling was carried out by adding EdU to culture medium at each time point at a final concentration of 20 μM and cells incubated for 30 minutes (37°C, 5% CO2). Cells were then spun down at 400 × g for 3 minutes and washed with DPBS at room temperature. Finally, cells were fixed with 4% paraformaldehyde and stored at 4°C before proceeding to EdU staining. EdU Click-iT™ EdU Alexa Fluor™ 647 Flow Cytometry Assay Kit (C10419, ThermoFisher Scientific, USA) was used following the manufacturer’s instructions. FxCycle™ Violet Ready Flow™ Reagent (R37166, ThermoFisher Scientific) was used for DNA content staining.
Flow cytometry
CytoflexS (Beckman Coulter, USA) was used for EdU and DNA content fluorescent counting. 12×75 mm tube containing 200–500 μl of 1×10⁷ cells were loaded and 10,000–30,000 events were recorded with a flow rate set as slow. FSC data was analysed by FlowJo (BD, USA). SSC-A vs FSC-A was firstly used for gating cells and Width-FSC vs FSC-A used for gating singlets and live singlets were gated based on DNA signal vs FSC-A. Then EdU fluorescence was plotted against DNA content. S phase was manually selected based on positive EdU signals present in cells that had both 2N and 4N DNA content.
Immunoblotting
Mouse soft tissues such as brain, liver, pancreas, kidney, spleen and testis were homogenized using CK14 precellys and hard tissues such as skeletal muscle, heart, gWAT, iWAT, BAT and lung were homogenized using CK28 precellys on a Precellys 24 Homogeniser (Precellys, Bertin Technologies, France). Tissues were lysed in the T-PER™ lysis buffer (78510, ThermoFisher Scientific, USA) with 1 X cOmplete protease inhibitor cocktail (EDTA free, 1 μl / 100 μl lysis buffer, Sigma-Aldrich, Germany) and 1 X PhosStop phosphatase inhibitor cocktail (1 μl / 100 μl lysis buffer, Sigma-Aldrich, Germany). Lysates were placed on ice for 30 minutes and cellular debris removed by centrifugation for 15 min at 13,000 rpm (865 ×g, Beckman-Coulter Allegra 25R, TA-15 rotor, USA) at 4 °C. The supernatant was removed to a pre-chilled 1.5 mL tube and stored at −80 °C. The protein concentrations of the supernatant were determined using the DC Protein Assay Reagent (BioRad,USA). Protein lysates were read against a known bovine serum albumin (BSA) standard curve. 20 μg of protein lysates were separated using a 4–12% gradient Bis-Tris ready mini polyacrylamide gel (Invitrogen, USA) or alternatively 4 μg of protein lysates were separated using Simple Western Wes capillary system (Bio-Techne, USA). Protein run on precast gel was then electro-transferred using iblot (Invitrogen, USA) onto a PVDF membrane for 7 minutes. Rabbit anti ARL15 (Ab178425, Abcam, UK), rabbit anti Vimentin (Cell Signalling #5741, CST, USA), rabbit anti β-catenin (Cell Signalling #8480, CST, USA), rabbit anti TRPM7 (Ab245408, Abcam, UK) were diluted 1:1000 in 5% milk in TBST and were added to membranes and incubated at 4°C overnight. HRP-conjugated secondary antibody at 1:2000 was used, and binding of primary antibody was then detected by enhanced chemiluminescence (ECL) (Pierce™ ECL Plus, ThermoFisher Scientific, USA). Visualization of protein on CL-XPosure™ (ThermoFisher Scientific, USA) autoradiography film was developed using the Compact X4 imaging system (Xograph, USA). Membranes were then re-blocked for 1 hour at room temperature before a loading control antibody Actin (MAB1501R, Merck, Germany) or Gapdh (Ab9485, Abcam, UK) or Vinculin (V9264, Sigma-Aldrich, Germany) was probed overnight at 4 °C. Simple Western data was analysed by Compass for Simple Western software.
Quantitative PCR
RNA was extracted from iWAT, gWAT, kidney and 3T3-L1 cells (ATCC, CL-173, USA) using the Direct-zol RNA Kit (Zymo Research,USA) and the concentration was determined using Nanodrop. Superscript III reverse transcriptase (18080093, ThermoFisher Scientific, USA) was used to synthesise cDNA and a TaqMan system (Applied Biosystems™ 7500 Fast Dx Real-Time PCR Instrument) (ThermoFisher Scientific, USA) was used to perform qPCR. Customized Arl15 FAM labelled TaqMan Probes (Arl15-201: Forward Primer: AGCCCGGAGAACGTTGTG, Reverse Primer: TCTGGAATGGCACTGCCTTT, Probe: CGACCACAGGTTTT; Arl15-202: Forward Primer: GCCCGGAGAACGTTGTGT, Reverse Primer: CGGCTCCAGTATTTCCGGATA, Probe: ACCACAGGAGCTGAC; Arl15-203: Forward Primer: TTCTGTACATGGATTATCTGGTCACTT, Reverse Primer: CCACCAAAATGGAAAAAAAAGAAAC, Probe: TAAATTGGTGTGACAATAGA) were used to analyse samples in triplicate. Gene expression was normalised in relation to the expression of house-keeping genes Canx (Mm00500330_m1) and Rpl13a (Mm01612986_gH). qPCR primer sequences for Mg2+ transport is listed below: Trpm6 Fwd: CTTCACAATGAAAACCTGCCC, Rev: AAAGCCATGCGAGTTATCAGC; Trpm7 Fwd: AGGATGTCAGATTTGTCAGCAAC, Rev: CCTGGTTAAAGTGTTCACCCAA; Gapdh Fwd: TAACATCAAATGGGGTGAGG, Rev: GGTTCACACCCATCACAAAC; Cnnm2 Fwd: GTCTCGCACCTTTGTTGTCA, Rev: GTCGCTCCGACTGAGAGAAT; Cldn16 Fwd: GTTGCAGGGACCACATTAC, Rev: GAGGAGCGTTCGACGTAAAC; Slc41a1 Fwd: CATCCCACACGCCTTCCTGC, CATCCCACACGCCTTCCTGC; Slc41a3 Fwd: CTTCGGCCACTGGCATTCTG, Rev: GATGGCAAGGTAGGAGATGG.
Immunoprecipitation and GTPases Glow Assay
HEK293T (ATCC, CRL-3216, USA) cells (2.5–3 million) were plated on 10 cm2 tissue culture plates (Nunc, USA) the day before transfection. Next day, 10 μg of DNA encoding ARL15 A86A, A86L and A86Q and empty vector were transfected with jetPEI® (Poly plus, France) according to manufacturer’s instruction. For each transfection, 6 plates were used. Thirty-six hours after transfection, plates were washed 3 times with ice cold PBS and cells were collected in 0.5 mL ice cold lysis buffer (50 mM HEPES pH8.0, 150 mM NaCl, 1 mM EDTA, 0.2 mM DTT, 1% Triton-X100 (93443, Sigma-Aldrich, Germany) and EDTA free protease and phosphatase inhibitors) and left on ice to lyse for 15 minutes. Lysed cells were centrifuged at 4°C for 15 minutes and the supernatant was collected, and protein concentrations measured by a BCA protein assay (Pierce, ThermoFisher Scientific, USA). ARL15 protein expression was verified by western blotting using rabbit ARL15 antibody (Ab178425, Abcam, UK) and mouse Flag antibody (F1804, Sigma-Aldrich, Germany). Then each 0.5 mL protein extract was mixed with 20 μL of M2 flag resin (F2426, Sigma-Aldrich, Germany) that was washed and equilibrated in lysis buffer and incubated overnight at 4°C. After overnight incubation, flag resin with bound protein was collected by centrifugation at 1500 × g for 30–60 seconds and the supernatants were discarded. Resin from multiple transfections were pooled and washed with 900 μL of lysis buffer for 3 times with 30 minutes each. Finally, bound protein was eluted with 50 μL of lysis buffer containing 300 ng/μL flag peptide (F3290, Sigma-Aldrich, Germany) overnight. Resin bound protein slurry was used for GTPase-Glo™ Assay (Promega, USA). For GTPase-Glo Assay, we first titrated the amount of small G proteins to validate the performance of the kit. 2500 ng of each recombinant human KRAS (ab268714, Abcam, UK) and recombinant human ARL15 (ab113118, Abcam, UK) protein was serially diluted and tested for their intrinsic GTP hydrolysis activities according to the manufacturer’s instructions. After confirming the kit’s performance, 40 μL of slurry from each condition was used in the assay.
BAT image analysis
A subset of the data was used for manual annotation to train a random forest pixel classifier in ilastik. 1.4.0. which was then used to generate segmented images of the whole dataset. The segmented images were then analysed by a customized ImageJ (23) Macro script that is available on request. Particles Plugin data were normalized to the total area that the whitened adipocytes were originally derived from.
Results
Arl15/ARL15 exons, transcripts, and predicted proteins
We initially evaluated the gene structure, transcripts and proteins encoded by the Arl15/ARL15 locus in mouse and human. There are three annotated Ensemble transcripts in the mouse, Arl15-201 (ENSMUST00000091201.6), Arl15-202 (ENSMUST00000224068.1) and Arl15-203 (ENSMUST00000224858.1) with the latter likely subject to nonsense mediated decay (Supplementary Fig. 1A and Supplementary Fig. 2A). The Arl15-202 transcript skips exon 3 of the Arl15-201 transcript.
To find out which transcripts are expressed in adipose tissue we extracted mRNA from 3T3-L1 cells, inguinal and gonadal mouse adipose tissue and carried out quantitative PCR (Supplementary Fig. 1B). The Arl15-202 transcript is present at approximately 35% of the level of Arl15–201 and the Arl15-203 transcript is near the limits of detection. To assess protein expression, we used Western Blotting on mouse tissues, including brain samples from our homozygous knockout mouse (see below) as a specificity control, and found that ARL15 was widely expressed and was detectable in adipose tissue (Supplementary Fig. 1C). Next, we compared human and mouse sequences and gene structure. Although more transcripts are annotated for the human genome in Ensemble, there is a transcript in each with 5 exons annotated in both mouse and human transcripts that encode a highly conserved (see below) 204 amino acid protein (Arl15-201 (mouse) and ARL15–202 (human), Supplementary Fig. 1D and 2B).
To understand the function of the ARL15 protein at the amino acid level, we mapped the conserved domains of ARL15 along with its 35 family members obtained from the Panther website. As shown in Supplementary Fig. 3A, by setting the conservation score to 50, ClustalO aligned 36 sequences according to homology and the conserved residues are highlighted in purple. Similar to other small GTPase proteins, full length ARL15 has five G boxes (highlighted in the orange rectangles) which facilitate guanine nucleotide binding and Mg2+ coordination. The shorter length ARL15 translated from isoform Arl15-202 (missing exon 3 of the Arl15-201 transcript) doesn’t have a Switch II domain therefore might result in a protein that has a diverged function. Also, the Gln (Q) of DxxGQ motif which normally carries intrinsic GTP hydrolysis activity is not conserved in ARL15 (Glut(Q) to Ala (A)), thus ARL15 may not have any intrinsic GTP hydrolysis activity (14, 15). Comparing human ARL15 and KRAS proteins, the latter has a conserved Q residue and shows weak intrinsic GTP hydrolysis activity (Supplementary Fig. 3B). In order to evaluate ARL15 activity further, we then carried out a GTPases assay comparing the mouse wildtype A86A with A86Q and a mutant A86L that locks ARL15 in a GTP bound active (GTP non-hydrolysable) form. We did not observe any significant intrinsic GTP hydrolysis activity for any of the constructs A86A, A86L or A86Q (Supplementary Fig. 3B−D). These data are consistent with the work of Shi et al. who showed that wildtype ARL15 has very low intrinsic GTPase activity which is substantially increased on interaction with Smad4 and Smad2 GAPs (14). As expected, the A86L mutation abolished all activity. We also observed in G4 box of ARL15 that Lysine (K) is not conserved in NKQD motif but instead is a His (H). Given lysine and histidine are both positively charged amino acids with similar biochemical properties, G4 box function probably is still conserved and is important for guanine nucleotide binding (24).
Validating the CRISPR/Cas9 induced Knockout of gene Arl15
In order to evaluate the function of the Arl15 gene in vivo we made a knockout mutation in the mouse using CRISPR/Cas9 to introduce an indel in exon 2 of the Arl15 gene (ENSMUSE00000568635). A sgRNA designed for the highest specificity against Arl15 in the mouse was recognized by Cas9 thus creating a double strand break in the genome. Non-homologous end joining (NHEJ) repair resulted in random insertions or deletions (Figure 1A) in the desired genomic region. We recovered an indel mutation that led to a frameshift of the open reading frame (ORF) and the creation of a premature stop codon (Figure 1B), and thus was predicted to be degraded by nonsense mediated decay resulting in a null knockout (KO) allele of ARL15. Knockout of ARL15 protein was then confirmed by Western Blotting using brain protein lysates from P1 male pups, probed with a commercial ARL15 antibody. We observed a reduction of ARL15 protein in the heterozygous mice and no protein expression in the homozygous mice (Figure 1C), confirming the successful generation of a KO allele.
Figure 1. Design and validation of Arl15 knockout by CRISPR/Cas9.
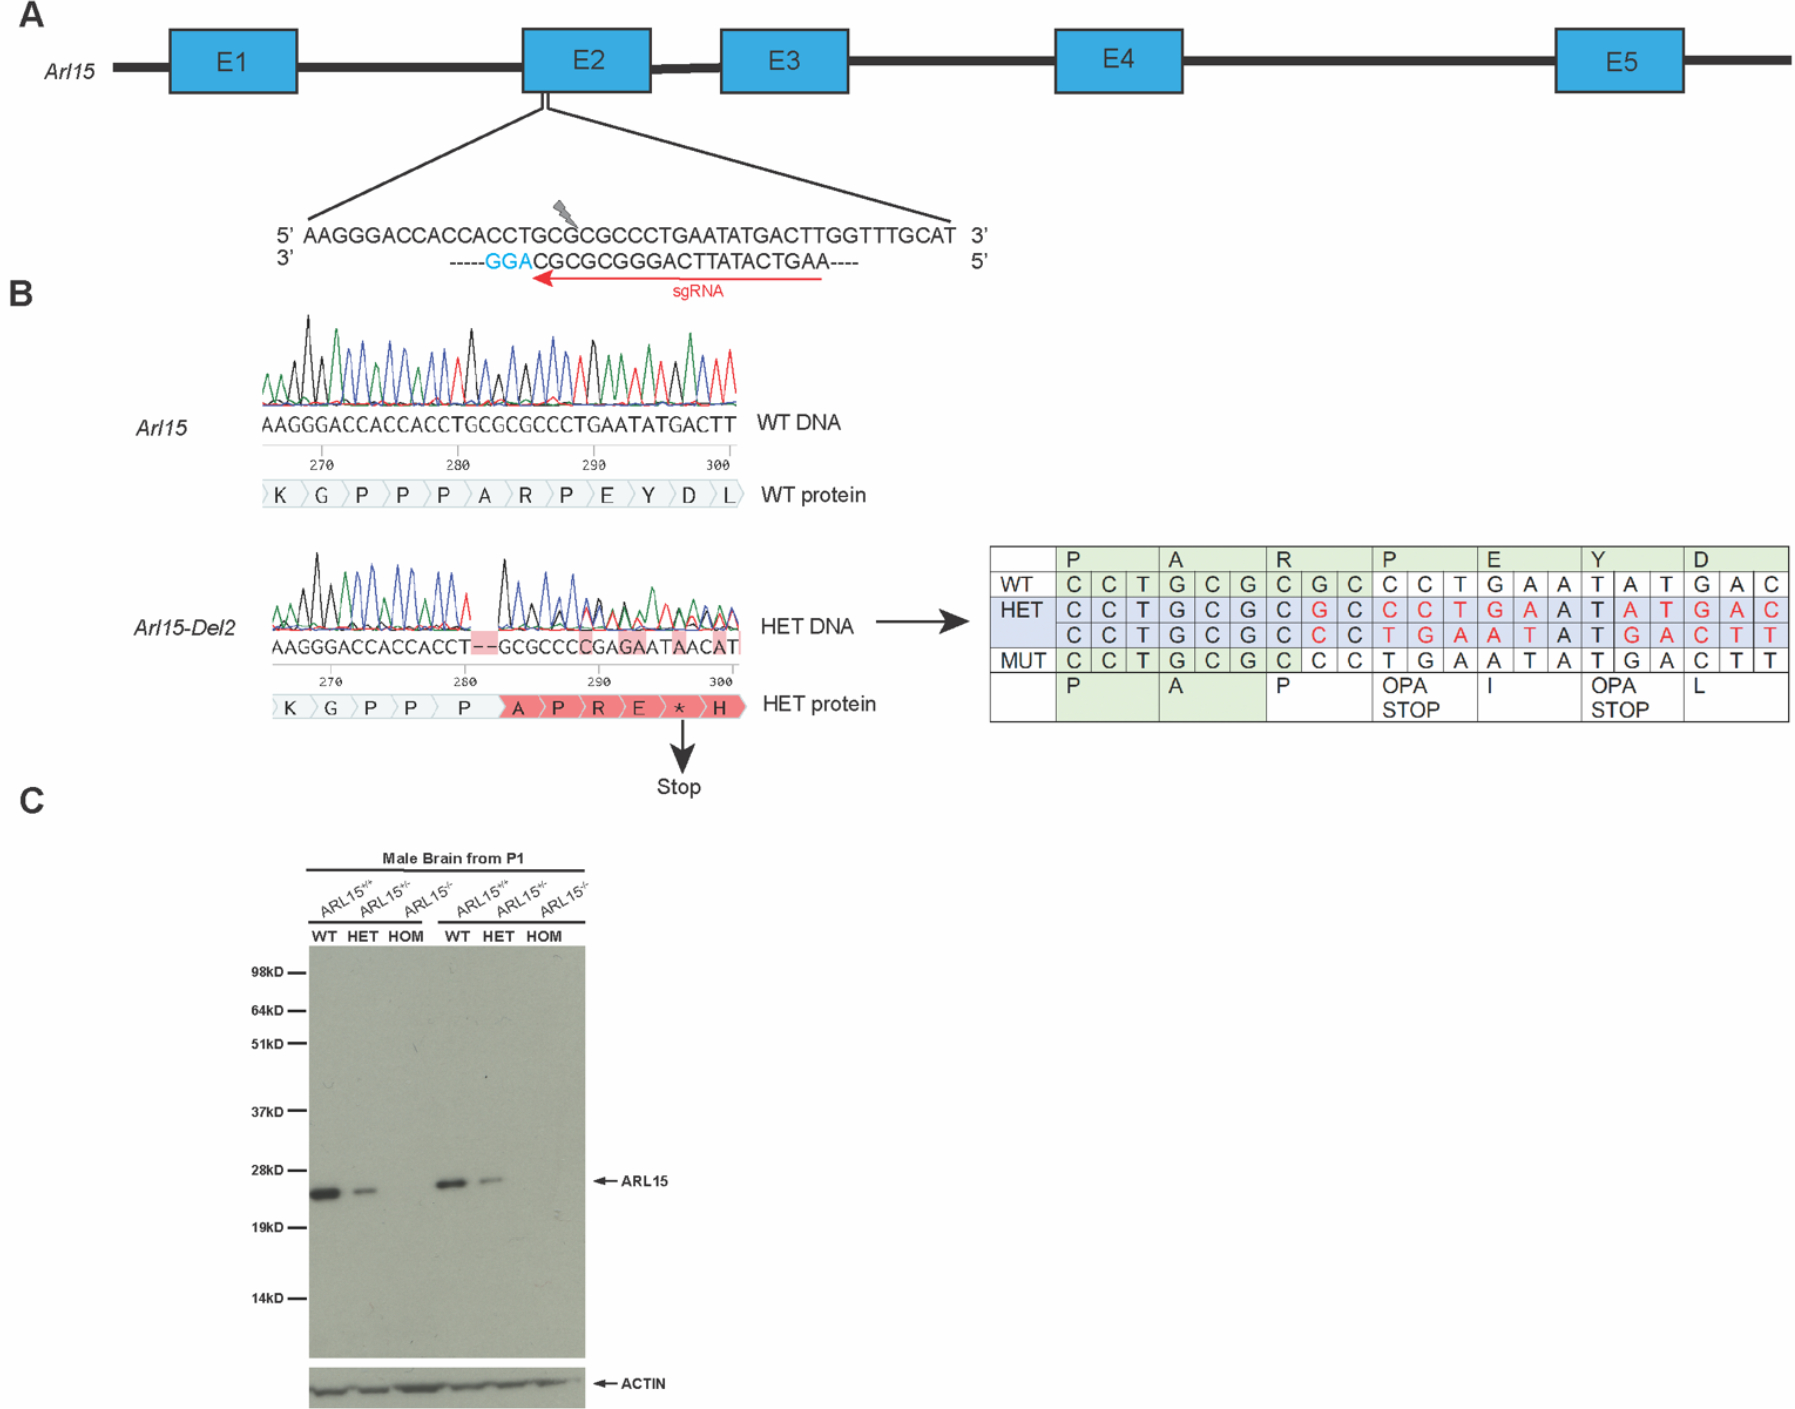
A: Design of sgRNA (5’AAGTCATATTCAGGGCGCGCAGG3’) targeting exon2 of gene Arl15. B: Consequences of the two-nucleotide deletion induced by CRISPR/Cas9 through non-homologous end joining (NHEJ). The indel mutation led to a frameshift of the ORF and creation of the premature stop codon, resulting in the mutant transcript to undergo nonsense mediated decay. C: Western Blotting with protein lysates from brain tissue of wildtype, heterozygous and homozygous Arl15 KO mice at age of P0 after birth (N=2/genotype). Commercial ARL15 antibody (Abcam178425) was used at 1:1000 and a rabbit HRP conjugated secondary antibody was used at 1:3000. ACTIN antibody was used as a loading control.
Homozygous Knockout mice die postnatally
To evaluate the welfare and viability of homozygous knockout mice, pilot intercross matings were generated and offspring were collected and genotyped at embryonic stage E14.5, E18.5 and postnatally before and after weaning. Homozygous and heterozygous embryos at both embryonic timepoints were present at a Mendelian ratio of 1:2 indicating viability until birth (Table 1, Figure 2, 2B). However, out of 78 pups present before weaning we found significantly fewer homozygotes than predicted (observed=6; expected=20, p=0.0002) and none of these were present after weaning (observed=0, expected=20, p<0.0001) (Figure 2C). These results showed that the Arl15 homozygous KO was postnatally lethal.
Table 1.
Number of offspring observed from intercross matings
| Number of offspring | Arl15 +/+ | Arl15 +/− | Arl15 −/− | Hom:Het Ratio | |
|---|---|---|---|---|---|
| E14.5 | 42 | 3 | 26 | 13 | 1:2.00 |
| E18.5 | 38 | 12 | 17 | 9 | 1:1.88 |
| Pre-weaning | 78 | 32 | 40 | 6 | 1:6.66 |
| Post-weaning | 71 | 32 | 39 | 0 | Hom not found |
Figure 2. Number of embryos or pups observed at E14.5, E18.5 and pre/post weaning.
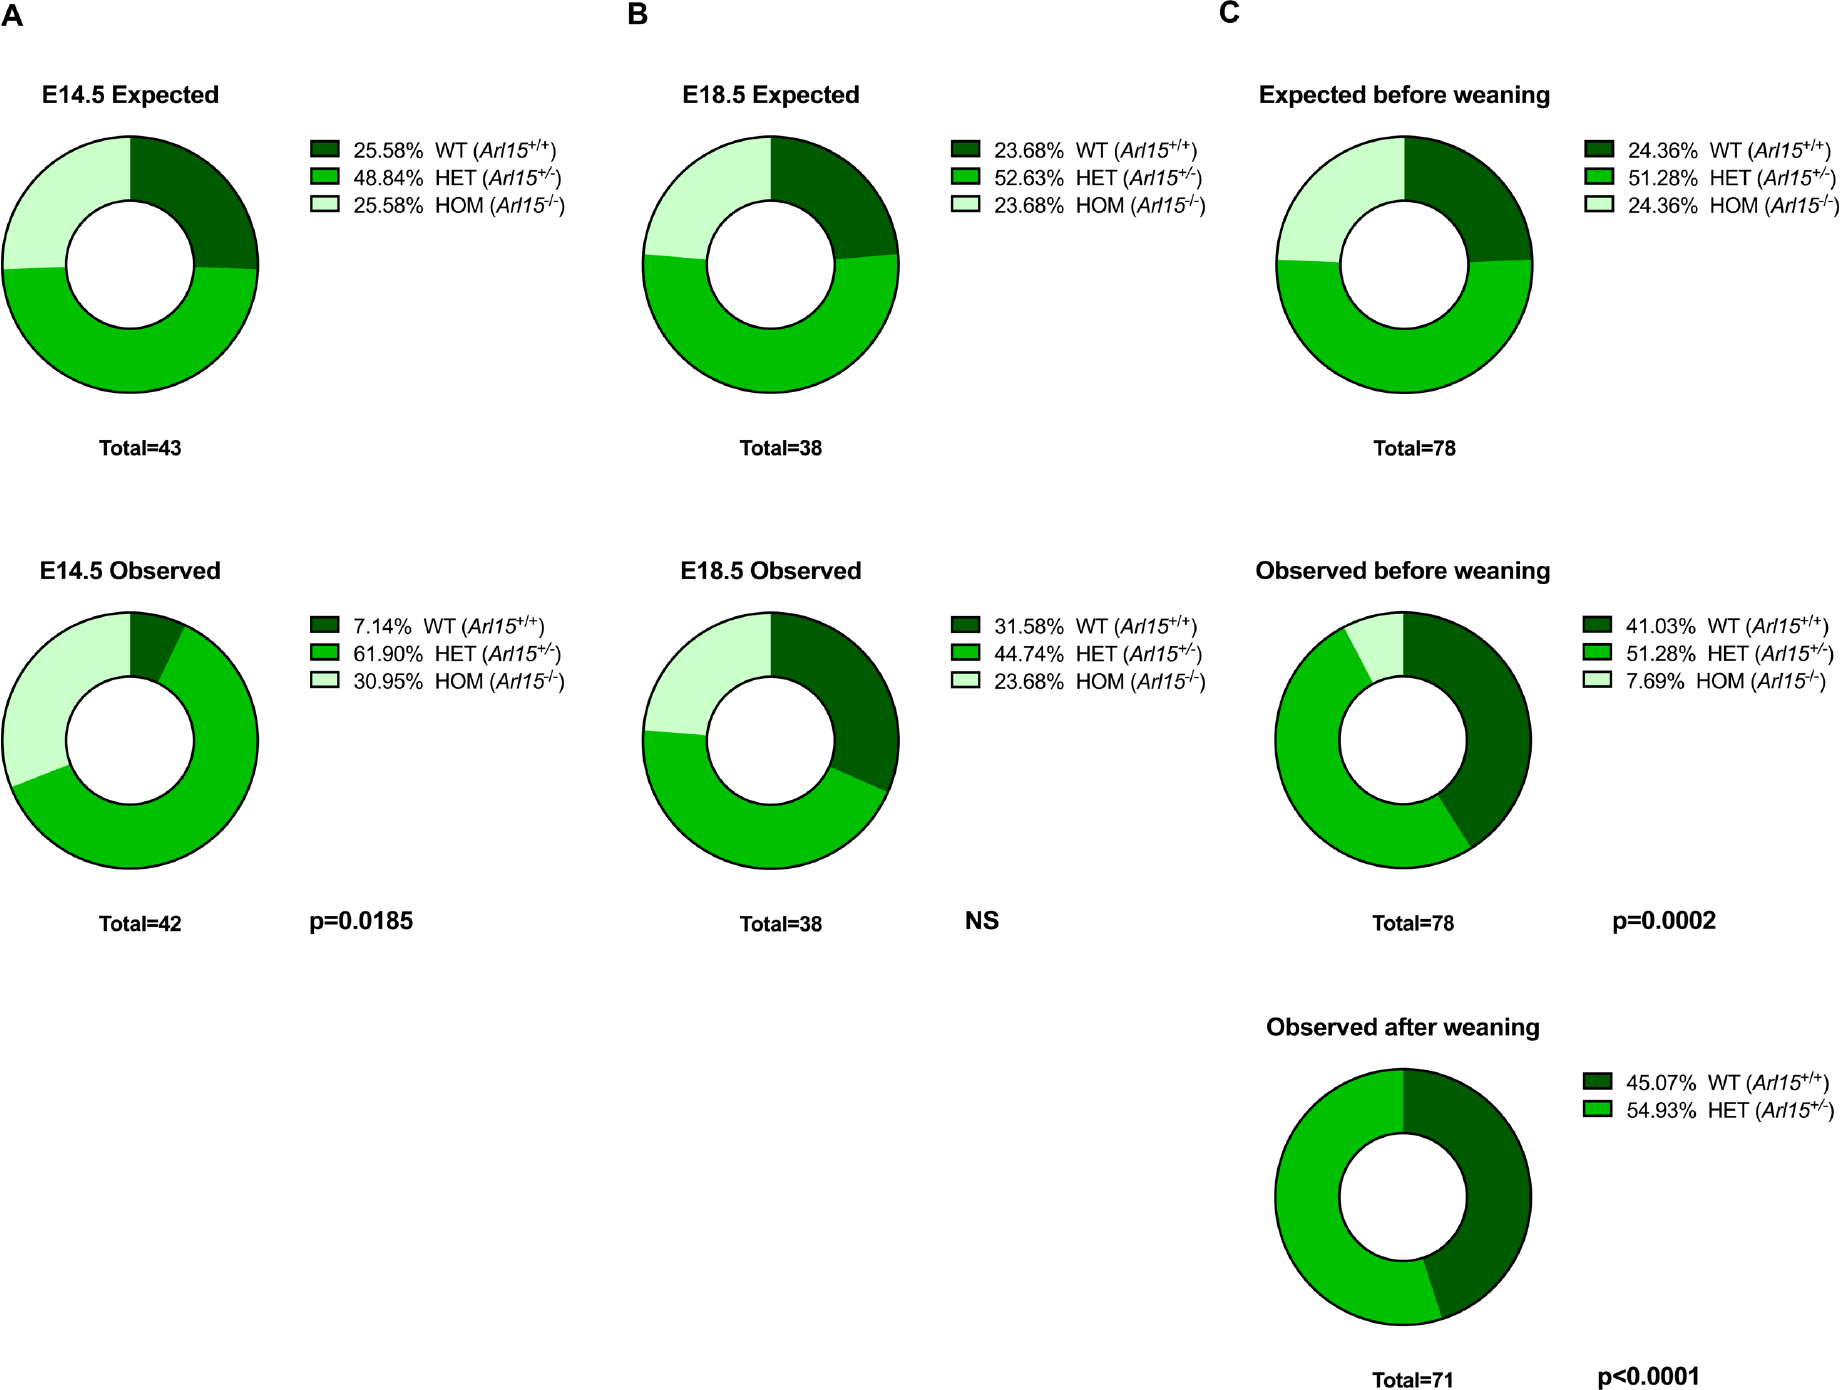
A: E14.5 stage B: E18.5 stage C: P0 (Before weaning) and after weaning. Statistical analysis of observed versus expected by Mendelian inheritance was carried out using a Chi-square test in Prism.
Homozygous Knockout mice exhibit a complete cleft palate
In order to investigate the observed postnatal lethality and to evaluate any other defects arising during development we carried out a histology and pathology analysis using the Harwell International Mouse Phenotyping Consortium pipeline (IMPC). The homozygous KO mice were born vital but began to die within several days after birth. Examination of homozygous Arl15 KO pups at one day old (P1) showed a swollen abdomen without a milk spot and a complete cleft palate (CP) (Figure 3A−B). A P1 homozygote with CP was fixed and embedded in paraffin for sectioning and H&E staining. The staining of sections with H&E showed a clear gap in the palate as indicated by the red arrow (Figure 3C). In order to investigate the closure of palate shelf in detail, six Arl15 KO embryos at E14.5 and four Arl15 KO embryos at E18.5 were examined by Micro-CT. A delayed elevation of the palate shelf was observed in all KO embryos at E14.5 (Figure 3D, one representative animal shown, Supplementary Fig. 4A, all KO embryos at E18.5) and then fusion of the palate shelf stopped, leaving a gap in the Arl15 KO as shown in Figure 3E at E18.5. The initiation of primary palate development in mouse starts from day E11.5 and ends at day E17 with complete fusion of the palatal shelf (25). The whole process is composed of three major stages: 1) vertical growth of the shelves away from the maxilla along the side of the tongue, 2) elevation of palatal shelves to acquire a horizontal position above the tongue, 3) formation of the midline epithelial seam (MES) by fusion of the medial edge epithelia (MEE) of the two opposing palatal shelves at the midline of nasal oral cavity (26–29). In order to investigate where Arl15 gene is expressed during palatogenesis, we used a tm1b lacZ Arl15 reporter mouse line, collected embryos at E12.5 and stained with x-gal, and found positive staining in primordium primary palate, cartilage primordium of nasal septum and the tongue as indicated by arrows (Figure 4). In addition, we also observed a sexual dimorphism in palatal shelf elevation as female palate shelf showed a delayed elevation in comparison to male palatal shelf at E14.5 in the wildtype C57B/6N mice (Supplementary Fig. 4B).
Figure 3. Cleft palate from homozygous Arl15 KO (Arl15−/−) compared to C57B6/NTac wildtype mice.
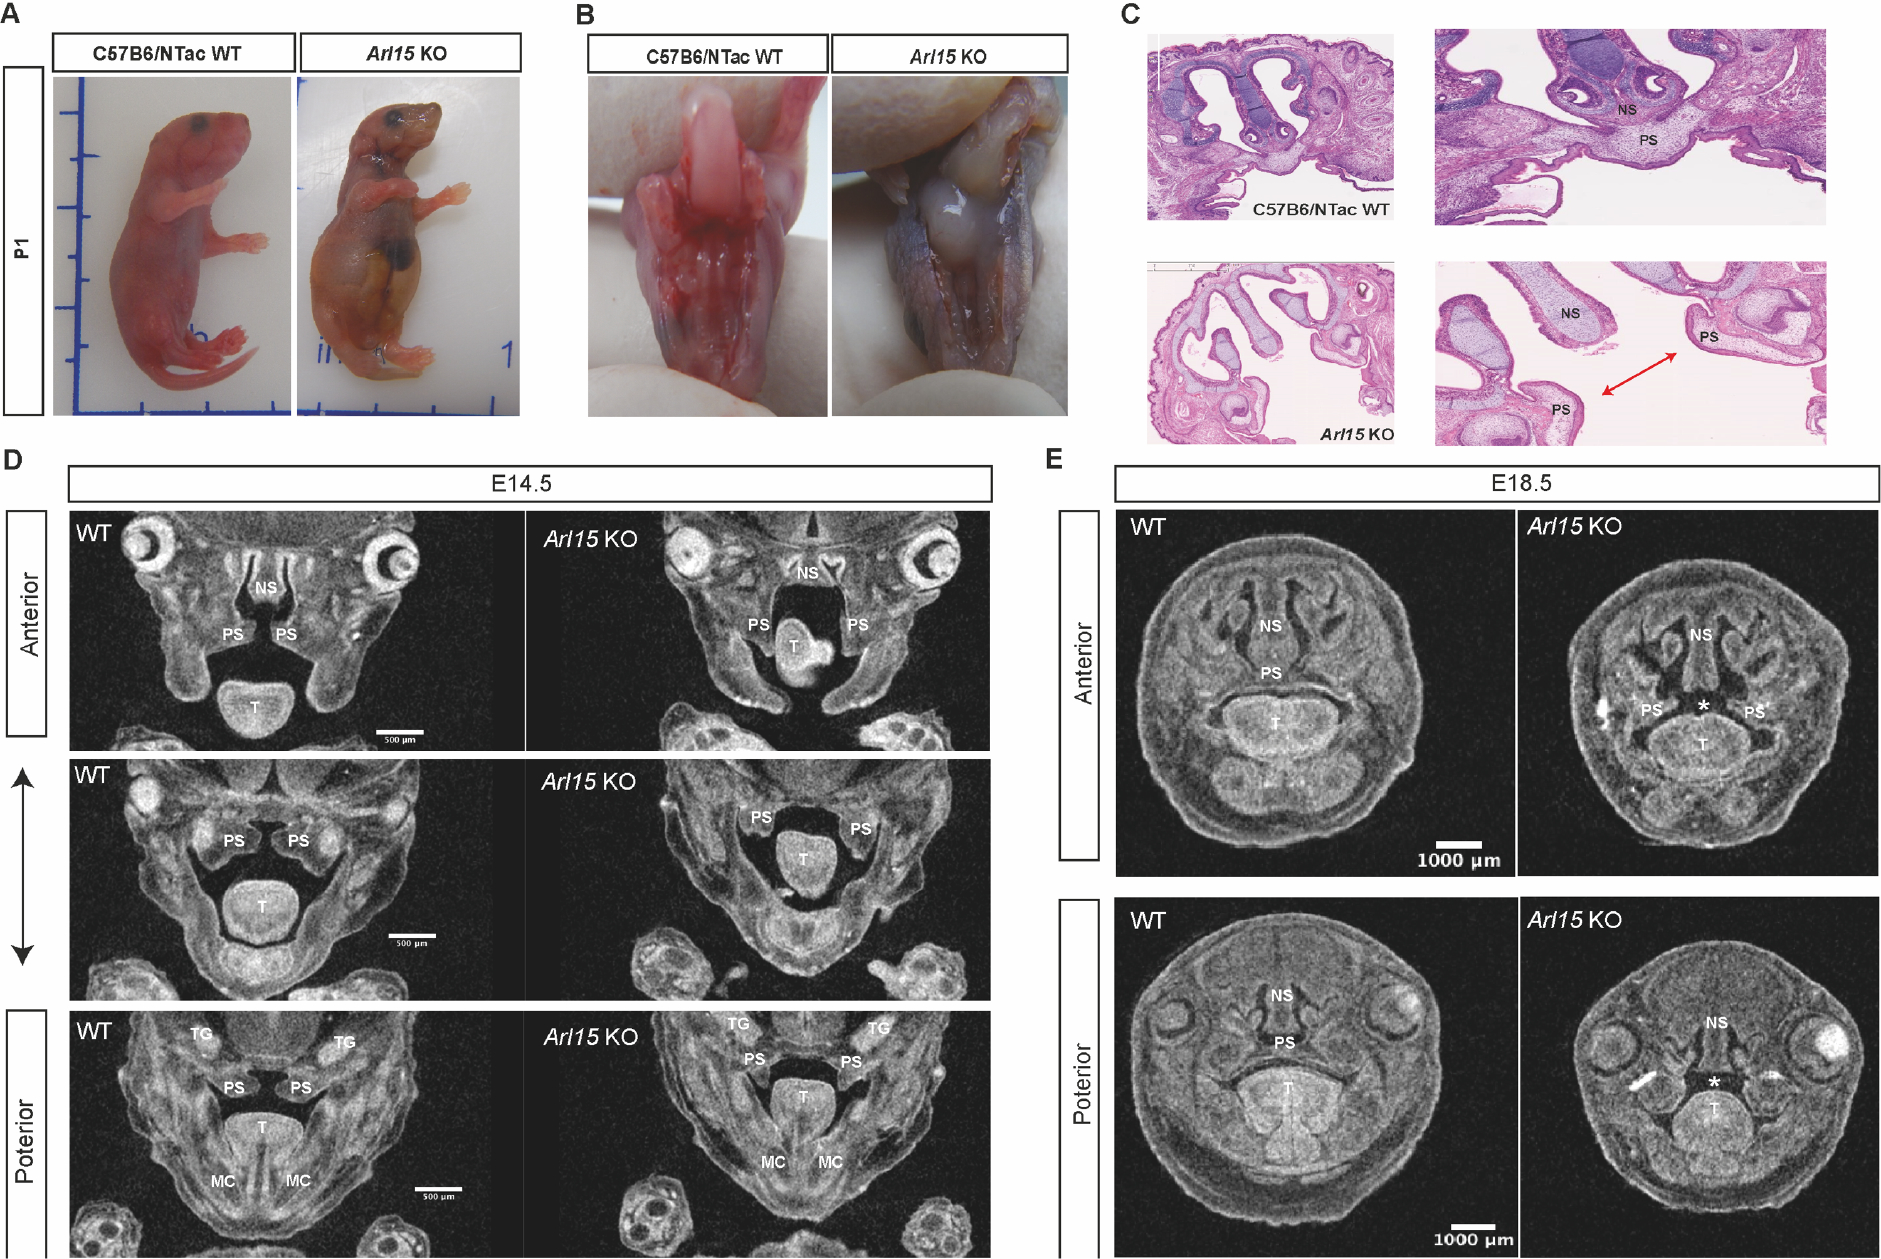
A: Homozygous mouse with a swollen abdomen at postnatal day 1 (P1). B: Homozygous mouse with a cleft palate. C: H&E staining from P1 pups. Arrow showing the gap in the palate caused by the failure in palate shelf fusion. D: Micro-CT of male embryos’ palate from coronal view at E14.5 presented from anterior to posterior direction. E: Micro-CT of male embryos’ palate from coronal view at E18.5 presented from anterior to posterior direction. NS: Nasal septum, PS: Palatal shelf, T: Tongue, MS: Meckel’s cartilage, TG: Trigeminal ganglion.
Figure 4. Arl15 Tm1b reporter mice with LacZ expression in embryos at E12.5.
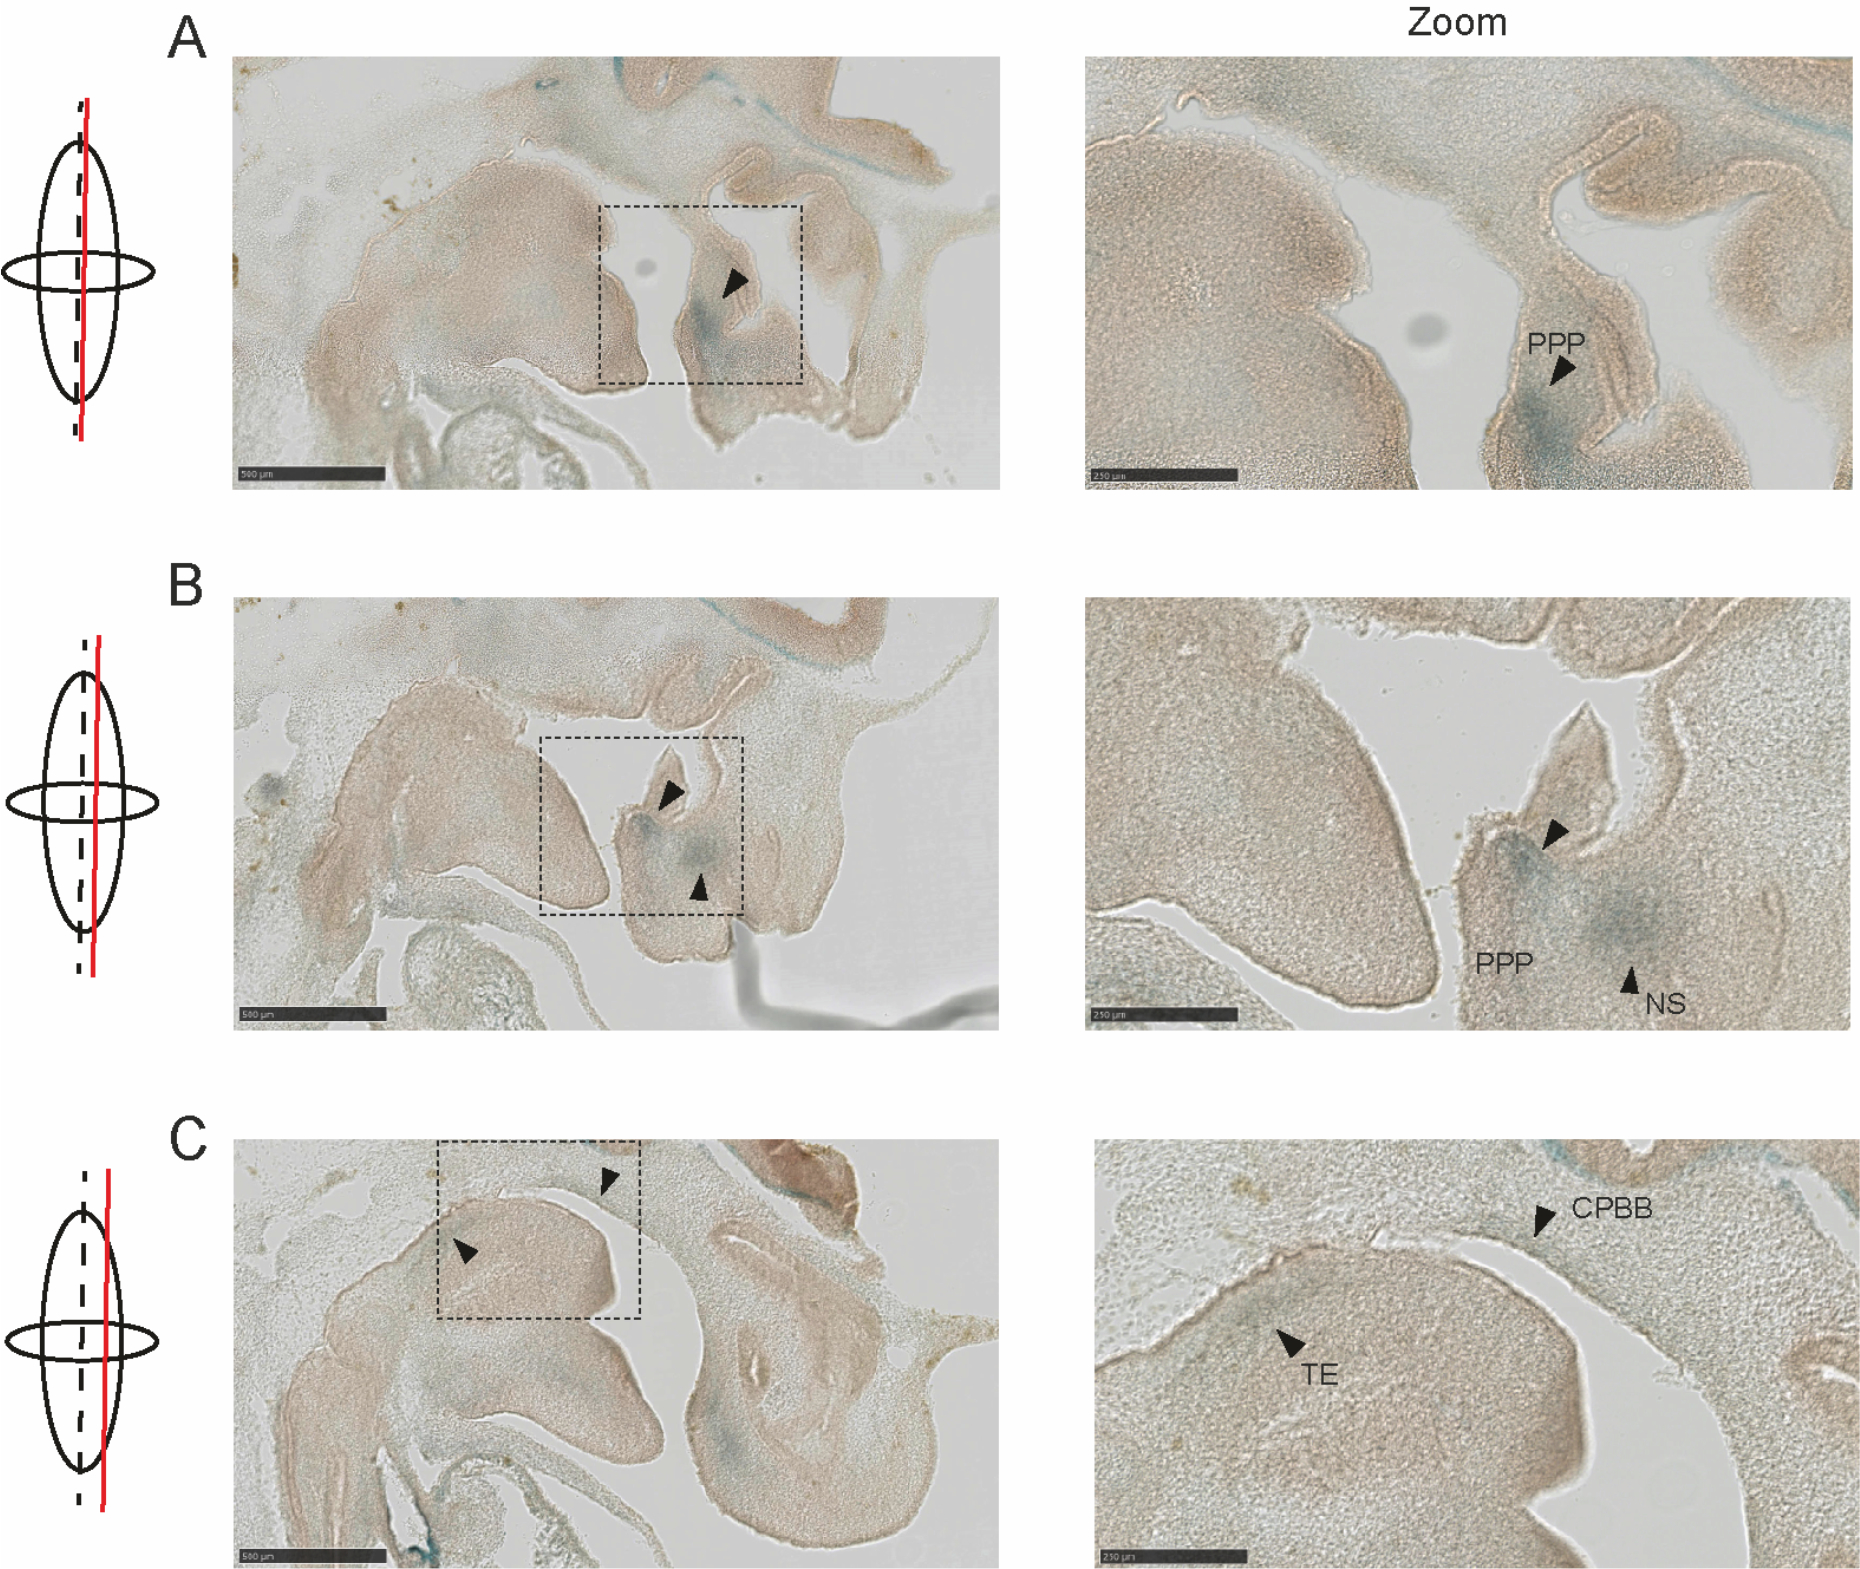
Embryos were cut sagittal and stained with X-gal. Images from medial (A) to lateral (C) were shown. Scale bar: 500 μm or 250 μm (zoom in). PPP: Primordium Primary Palate; NS: Cartilage primordium of nasal septum; TE: Togue; CPBB: Cartilage primordium of basisphenoid bone.
Annotations were made according to https://www.emouseatlas.org/eAtlasViewer_ema/application/ema/kaufman/plate_29a.php?image=a)
In order to screen for other developmental phenotypes, Micro-CT data was manually analysed using 3D Slicer software followed by a high throughput computational pipeline called LAMA (22). Two wildtype embryos were used in the primary screen to identify phenotypes that are highly penetrant. From manual interrogation, the tongue of homozygous KO animals was hunched because the development of the mandible was delayed (Supplementary Fig. 4C). The upper incisors did not contrast as well in all 6 KO embryos at E14.5, compared to the wildtypes, indicating a delay in maturation of the upper incisors (Supplementary Fig. 4D). However, no difference was found when examined at E18.5 (Supplementary Fig. 4C−4D). When subsequently a larger number of wildtype mice were used in the LAMA platform, to increase the confidence in identifying novel phenotypes, bigger eyes from both E14.5 (Cohens_D=1.439511; p=4.28E-04) and E18.5 (Cohens_D=0.859047; p=4.44E-05) (Supplementary Fig. 5) were observed.
Interactome analysis of Arl15 and genes that are associated with craniofacial and adipose phenotypes
To assist in understanding the role of ARL15 in CP and the biological pathways ARL15 might be involved in, we carried out an interactome analysis. The KEGG pathways from Cluster1 were all pertaining to different cancers where the top over-represented term was ‘Pathways in Cancer’ (q = 8.66 ×10⁻³³). Cluster 2 representing genes in the phenotypic network but further away from Arl15 were over-represented in 3 signalling pathways including TGFβ signalling (q= 1.77 × 10⁻⁵), hedgehog signalling (q= 5.31 × 10 −12) and pluripotent stem cell signalling (q=1.64 × 10⁻¹⁸) (Figure 5). Nevertheless, most genes in cluster 2 were not part of any enriched/over-represented pathway in the network. Among the top 200 biological pathways that were shared between them, regardless of heart, muscle, and embryo development, it was notable that morphogenesis of an epithelium, cell population proliferation, regulation of locomotion and cell differentiation and mesenchyme development were overrepresented and potentially consistent with CP abnormalities (Supplementary Data Table T2).
Figure 5. Protein-protein interaction map of cardio, craniofacial and adipose phenotype contributing genes including Arl15.
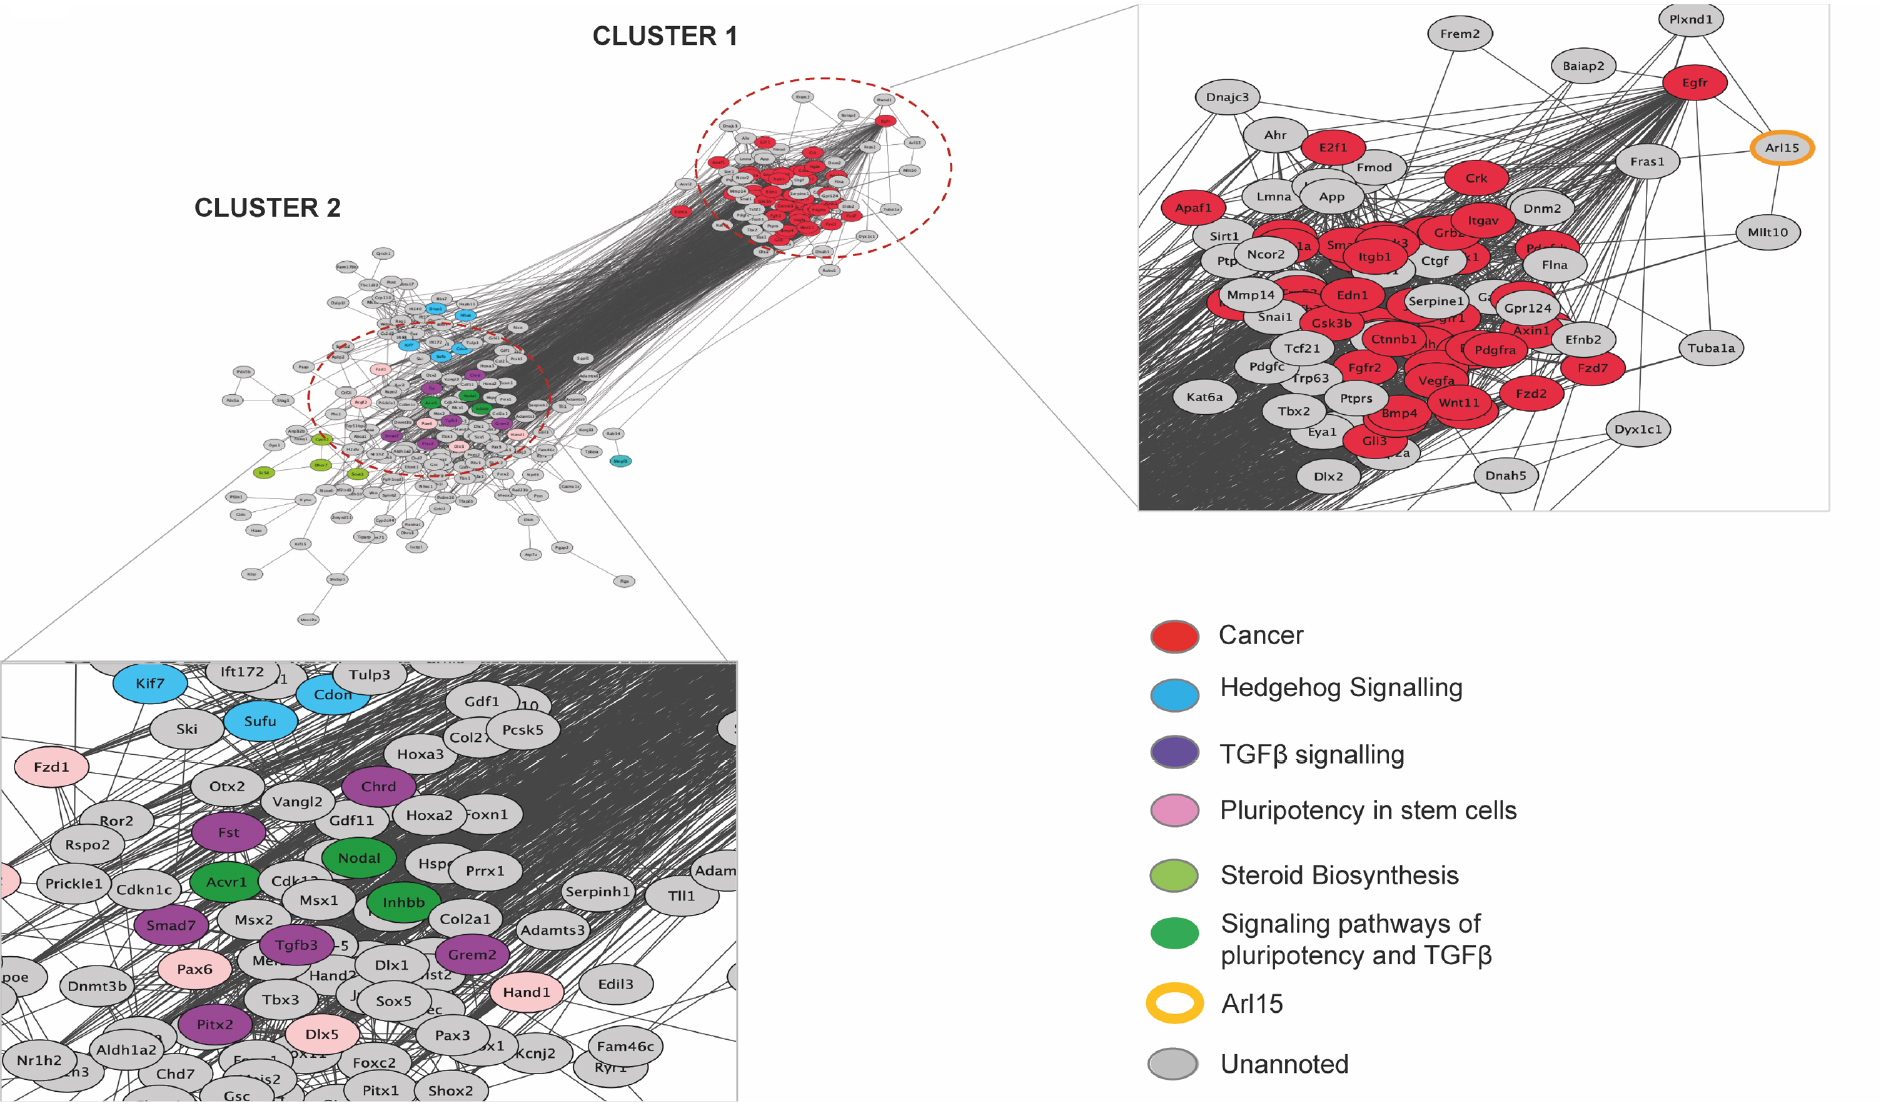
Two clusters were plotted and KEGG pathways that were top or overrepresented by genes from each cluster were highlighted in colours. Unannotated genes are in grey because they are not in top terms or not over-represented.
Homozygous Knockout embryonic fibroblasts have impaired migration
The formation of bone and cartilage structures in the head and face occurs during embryonic development and is regulated by a coordinated network of transcription factors and signalling molecules that regulate cell proliferation, migration, cellular polarity and cell-cell interactions as the palate forms and fuses (30). To investigate whether cell proliferation and migration were affected by knocking out of the Arl15 gene, we carried out a wound healing assay using mouse embryonic fibroblasts (MEFs) isolated at E13.5. During a 19-hour wound healing process, homozygous KO MEFs showed a significant (individual student t-test) reduced migration compared to wildtype MEFs between 9h (p=0.0425) and 14h (p=0.006). When we adjusted the p values for multiple comparisons using the Holm-Sidak’s method, a significant reduction in migration was observed at 12h (p=0.0376; Figure 6A−B). TGFβ signalling is one of the major pathways that are involved in the process of palatogenesis (31, 32). We therefore added recombinant TGFβ1 into the complete culture media to attempt to rescue the impaired migration. However, there was reduced migration in both wildtype and homozygous KO MEFs and no difference was observed between the genotypes (Supplementary Fig. 6). Because the closure of the wound is due to the combination of cell proliferation and migration, it is not clear whether cell proliferation was responsible for the closure of the gap. Therefore, we carried out cell proliferation assays using EdU labelling of MEFs in S-phase. We synchronized MEFs by serum starvation before they were recovered with complete medium supplemented with 10% FBS. Both wildtype and homozygous Arl15 KO restarted proliferation but no difference in cell proliferation was observed between genotypes (Figure 6C). We then decided to investigate epithelial mesenchymal transition (EMT) because epithelial cells located near the dorsal midline of the neural tube undergo primary EMT to form migratory neural crest cells along the AP axis before differentiating into derivatives including craniofacial bone and cartilage and glia cell, pigment cells, glia cells of the peripheral nervous system (33). To investigate if EMT is perturbed in homozygous Arl15 KO MEFs, Western Blotting was carried out. After normalizing to loading control β-actin, Vimentin showed significant reduction while β-Catenin was not affected in the homozygous Arl15 KO MEFs (Figure 6D, 6H). Given ARL15 was shown to interact with CNNM1–4 and TRPM7 (34) while TRPM7 is also involved in regulating migration in breast cancer cells (35), we examined the TRPM7’s protein level in homozygous Arl15 KO MEFs and observed a significant reduction in TRPM7 in the homozygous KO MEFs (Figure 6E, 6F, 6G, 6H).
Figure 6. Wound healing assay with Arl15 KO and C57BL/6N control MEFs.
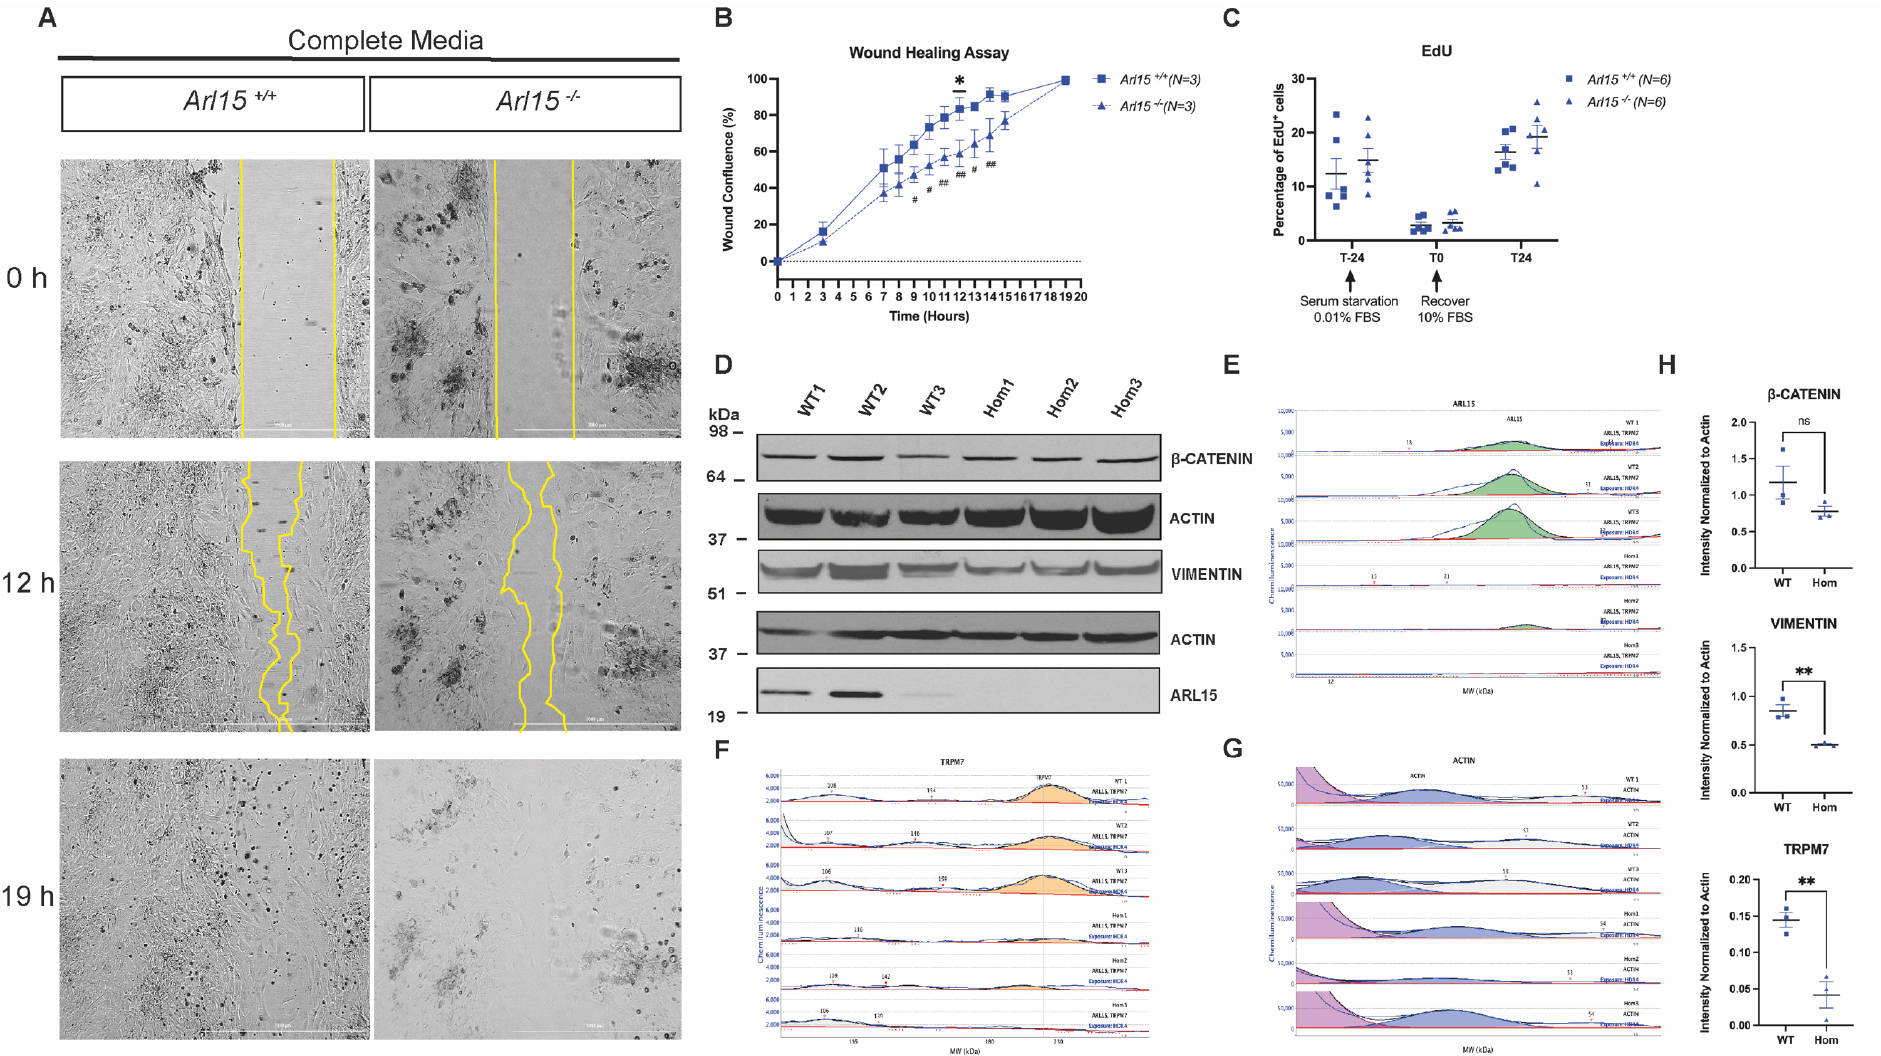
A: The wound created by ibidi 2-well insert in MEFs were allowed to grow in complete media containing 10% FBS for 19 hours. Representative images from T0, T12 and T19 were shown with the gap edges highlighted in yellow line. B: The wound confluence calculated from Arl15 KO and wildtype MEFs over 19-hour incubation. Data was presented as mean± S.E.M. from N=3 per genotype. #: data was analysed by two tailed unpaired t-test; *: data was analysed by multiple t-test corrected for multiple comparison with Holm-Šídák method. C: EdU flow analysis showing percentage of cells in S phase from Arl15 KO and wildtype MEFs culture pre- and post-serum starvation. Data was presented as mean± S.E.M and analysed by multiple t-test D: Western Blotting of EMT markers using total protein lysates isolated from wildtype and homozygous Arl15 KO MEFs. E: Simple Western Wes data analysed by Compass for Simple Western software. Total protein lysates from 3 wildtype and 3 homozygous Arl15 KO MEFs were loaded onto the capillary system. Peaks were called at the molecular weight of each antibody and highlighted in colours. Green: ARL15 at 23 kD (observed 25–27 kD); F: Yellow: TRPM7 at 213 kD (observed 204–225 kD); G: Blue: ACTIN at 42 kD (observed 45–49kD). H: Relative intensity of VIMENTIN, β-CATENIN and TRPM7 after normalizing to ACTIN Data was presented as mean± S.E.M and analysed by multiple t-test * P<0.05, **<0.01.
Heterozygous female knockout mice showed reduced fat mass and in both sexes a dimorphic difference in bone mineral density
Two female patients with lipodystrophy were reported to have mutations in one allele of the Arl15 gene leading to loss of function and haploinsufficiency of the gene, warranting further investigation of this gene as a candidate for metabolic diseases (2). To evaluate the effect of haploinsufficiency of Arl15 on lipodystrophic traits in the mouse, we measured body composition using EchoMRI in the pilot cohort of mice on a RM3 diet. Female heterozygous Arl15 KO mice showed no differences in body weight or lean mass but did exhibit reduced fat mass as measured by Area Under Curve (AUC, p=0.0410) and significant differences at individual timepoints between 14 and 18 weeks of age (uncorrected p=0.0219, 0.0149 and 0.0016 respectively, and at 18 weeks after Holm-Sidak correction for multiple comparison (corrected p=0.010) (Figure 7). In contrast, male heterozygous KO mice on RM3 diet did not show a difference in body composition compared to wildtype colony mates (Figure 7).
Figure 7. Body composition of heterozygous Arl15 KO mice fed with RM3 diet.

Data analysed using unpaired multiple t-test without correction for multiple testing. Fat mass data was Y=Log(Y) transformed before analysis to normalise data distribution.
Having observed reduced fat mass in female heterozygous KO mice on RM3 diet, we then bred a larger better powered cohort of mice to fully investigate the phenotype over 32-weeks (Supplementary Figure 7). Further, we challenged these mice with HFD (60% fat) to exacerbate traits and compared them to mice fed with a matched low fat (10% fat) diet (LFD). Lipodystrophy patients have impaired subcutaneous fat storage thus excess fat is stored centrally, and this leads to lipid toxicity in internal organs such as liver and muscle. By challenging with a HFD, we aimed to study adipose tissue expandability in a depot specific fashion. To evaluate any gross growth defects, we also measured body length of the heterozygous KO and wildtype colony mates on the two diets and found no genotype differences (Supplementary Fig. 8). No differences between AUCs for body weight, fat and lean mass over time were observed in both male and female heterozygous Arl15 KO mice compared to wildtype colony mates on either diet aged up to 22 weeks of age (Figure 8A and B). However, 10 weeks later at 32 weeks, female heterozygous Arl15 KO mice on HFD showed decreased (Δ= −5.326 ± 2.288 (difference between the means ± SEM), P=0.0318) body weight (Figure 8C and D). To investigate whether Arl15 had a role in bone development, given that bone and adipose arise from the same cell lineages, we used DEXA to measure bone mineral density (BMD) (Figure 8C and D). Heterozygous Arl15 KO female mice on LFD showed a significant increase in BMD (Δ= 0.004 ± 0.001, P=0.0063) but no difference on an HFD. In comparison, heterozygous Arl15 KO male mice on HFD showed a trend for decreased BMD (Δ=−0.004 ± 0.001, P=0.0612) but no difference on LFD (Figure 8C).
Figure 8. Body composition and bone mineral density measured from heterozygous Arl15 KO and wildtype littermates fed with HFD and LFD.
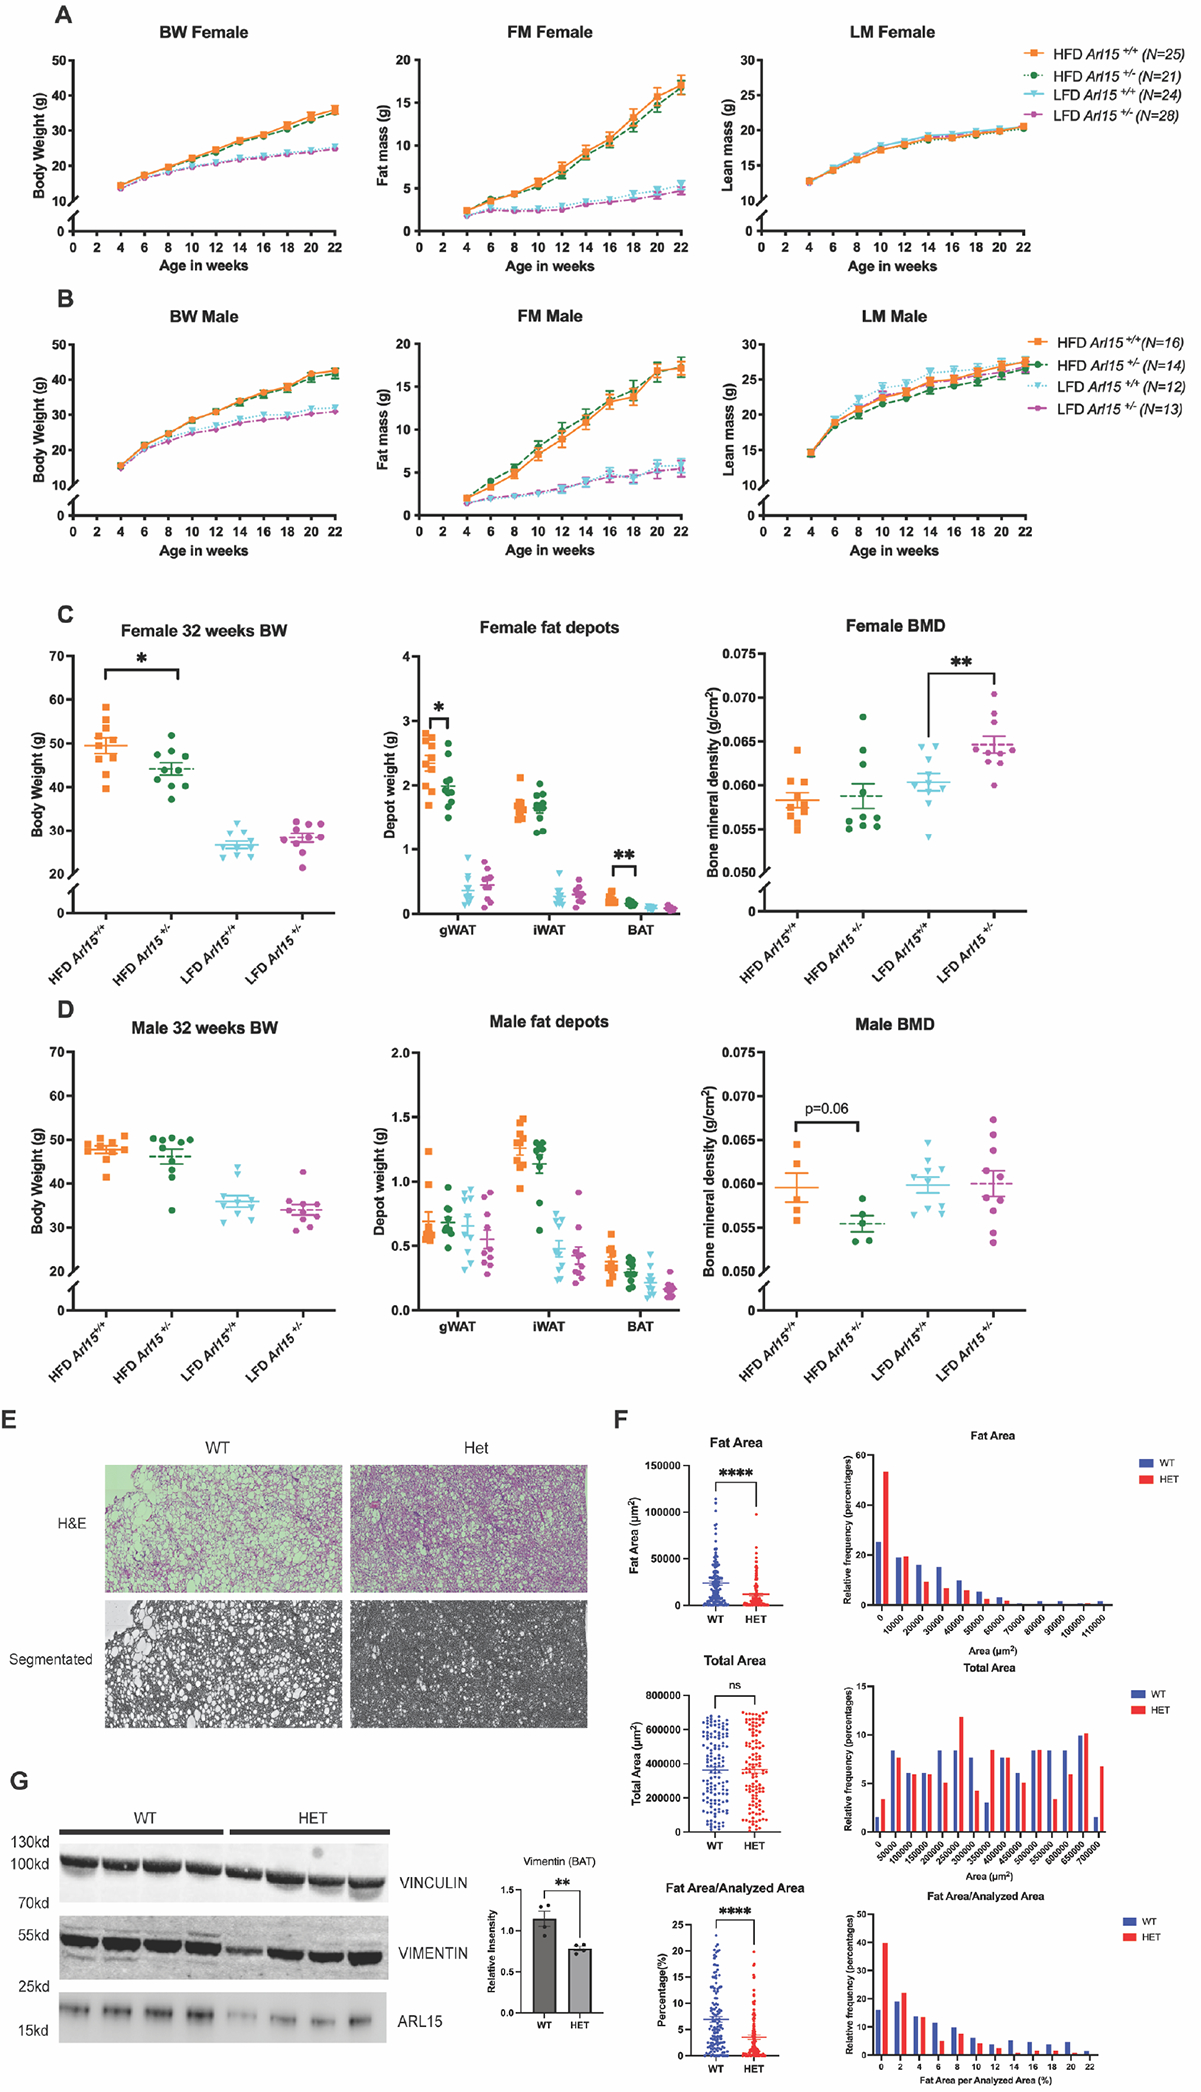
A and B: Body composition of female and male heterozygous Arl15 KO mice fed with HFD and LFD. Fat and lean mass were measured by EchoMRI. AUCs were calculated and analysed within diets by an unpaired t-test or Mann-Whitney test. C and D: Body weight, depot weights from gonadal (gWAT), inguinal white adipose tissue (iWAT) and brown adipose tissue (BAT) and BMD in female and male mice fed with HFD and LFD at 32 weeks of age. Female data was Y=log(Y) transformed to normalise distributions and analysed within diets using an unpaired t-test. Male gWAT HFD and iWAT HFD data was analysed by an unpaired Mann-Whitney test. Male gWAT LFD and BAT LFD was Y=log(Y) transformed and analysed by an unpaired t-test. Male iWAT LFD, BAT HFD and all BMD data were analysed by an unpaired t-test. All data presented as mean± S.E.M. * P<0.05 and ** P<0.01. E: Representative image of wildtype and heterozygous mouse brown adipose tissue that is H&E stained and ilastik 1.4.0 segmented displayed. F: Fat area representing whitening of BAT was measured and counted. Total area including fat area, muscle tissue, vascular structure as well as gaps and unknown structures were measured. Fat area per total area was used to prove the difference in whitening of brown adipose tissue between wildtype and heterozygous mice. Histogram was generated to visualize the distribution of the data either that’s fat area or the percentage of the fat per analysed area. G: Immunoblotting of vimentin in brown adipose tissue lysates from Arl15 wildtype and heterozygous mice on HFD. Brightness was adjusted for Vimentin in order to show all isoforms. N=5, two tailed student t-test was used for statistical analysis. * P<0.05, ** P<0.01
In order to investigate Arl15’s role in adipose tissue further, we dissected the gWAT, BAT and iWAT and weighed them. No changes were observed in dissected subcutaneous fat depot weights (inguinal white adipose tissue, iWAT). However, for visceral gonadal white adipose tissue (gWAT), and interscapular brown adipose tissue (BAT), there was a significant decrease in both gWAT (Δ=−0.07154 ± 0.03350, P=0.0467) and BAT (Δ= −0.1409 ± 0.04694, p=0.0077) weight in female heterozygous Arl15 KO on HFD. Given the observed bodyweight difference in females on a HFD at 32 weeks, we normalised gWAT and BAT to body weight which resulted in gWAT losing significance (p=0.9118 unpaired Mann Whitney test) whilst the BAT significance was reduced (p=0.0162, data Y=log(Y) transformed to normalise distribution and analysed with an unpaired t-test). In comparison, male mice on HFD at 32 weeks of age showed a trend for decreased BAT weight (Δ= −0.08400 ± 0.04522, p=0.0796). When we evaluated female mice on a HFD by H&E BAT histology, we observed qualitatively less large white lipid droplets in heterozygous female KO mice (Supplementary Fig. 9). We then carried out high-throughput image analysis of the dissected BAT embedded and stained with H&E in order to quantify the amount of lipid droplet area between wildtype and heterozygous mice (Figure 8E). A reduction of whitened adipocyte area in BAT was observed in female heterozygous mice compared to wildtype and the distribution of fat area per analysed area showed a shift towards smaller area in the heterozygous mice (Figure 8F). Finally, in order to investigate if Vimentin is involved in fat tissue function, we carried out western blotting using gWAT and BAT tissue lysates. A reduction of Vimentin protein was observed in heterozygous BAT tissue lysates (Figure 8G) while no changes were observed in the gWAT tissue lysates (Supplementary Fig. 10).
Heterozygous knockout mice showed minor disturbances in plasma adiponectin
Decreased adiponectin has been associated with genetic variants in the Arl15 gene locus in humans and a functional study in the mouse 3T3-L1 cell line showed a reduced adiponectin secretion when Arl15 was knocked down by shRNA (2). We therefore measured plasma adiponectin at 20 and 32 weeks of age. There was a significant decrease in heterozygous female (Δ= −3.42 ± 1.585, P=0.0407) plasma adiponectin levels, however, this disappeared at the terminal time point, 3 months later at 32 weeks of age (Figure 9A).
Figure 9. Clinical biochemistry of blood adiponectin, insulin, and glucose levels.
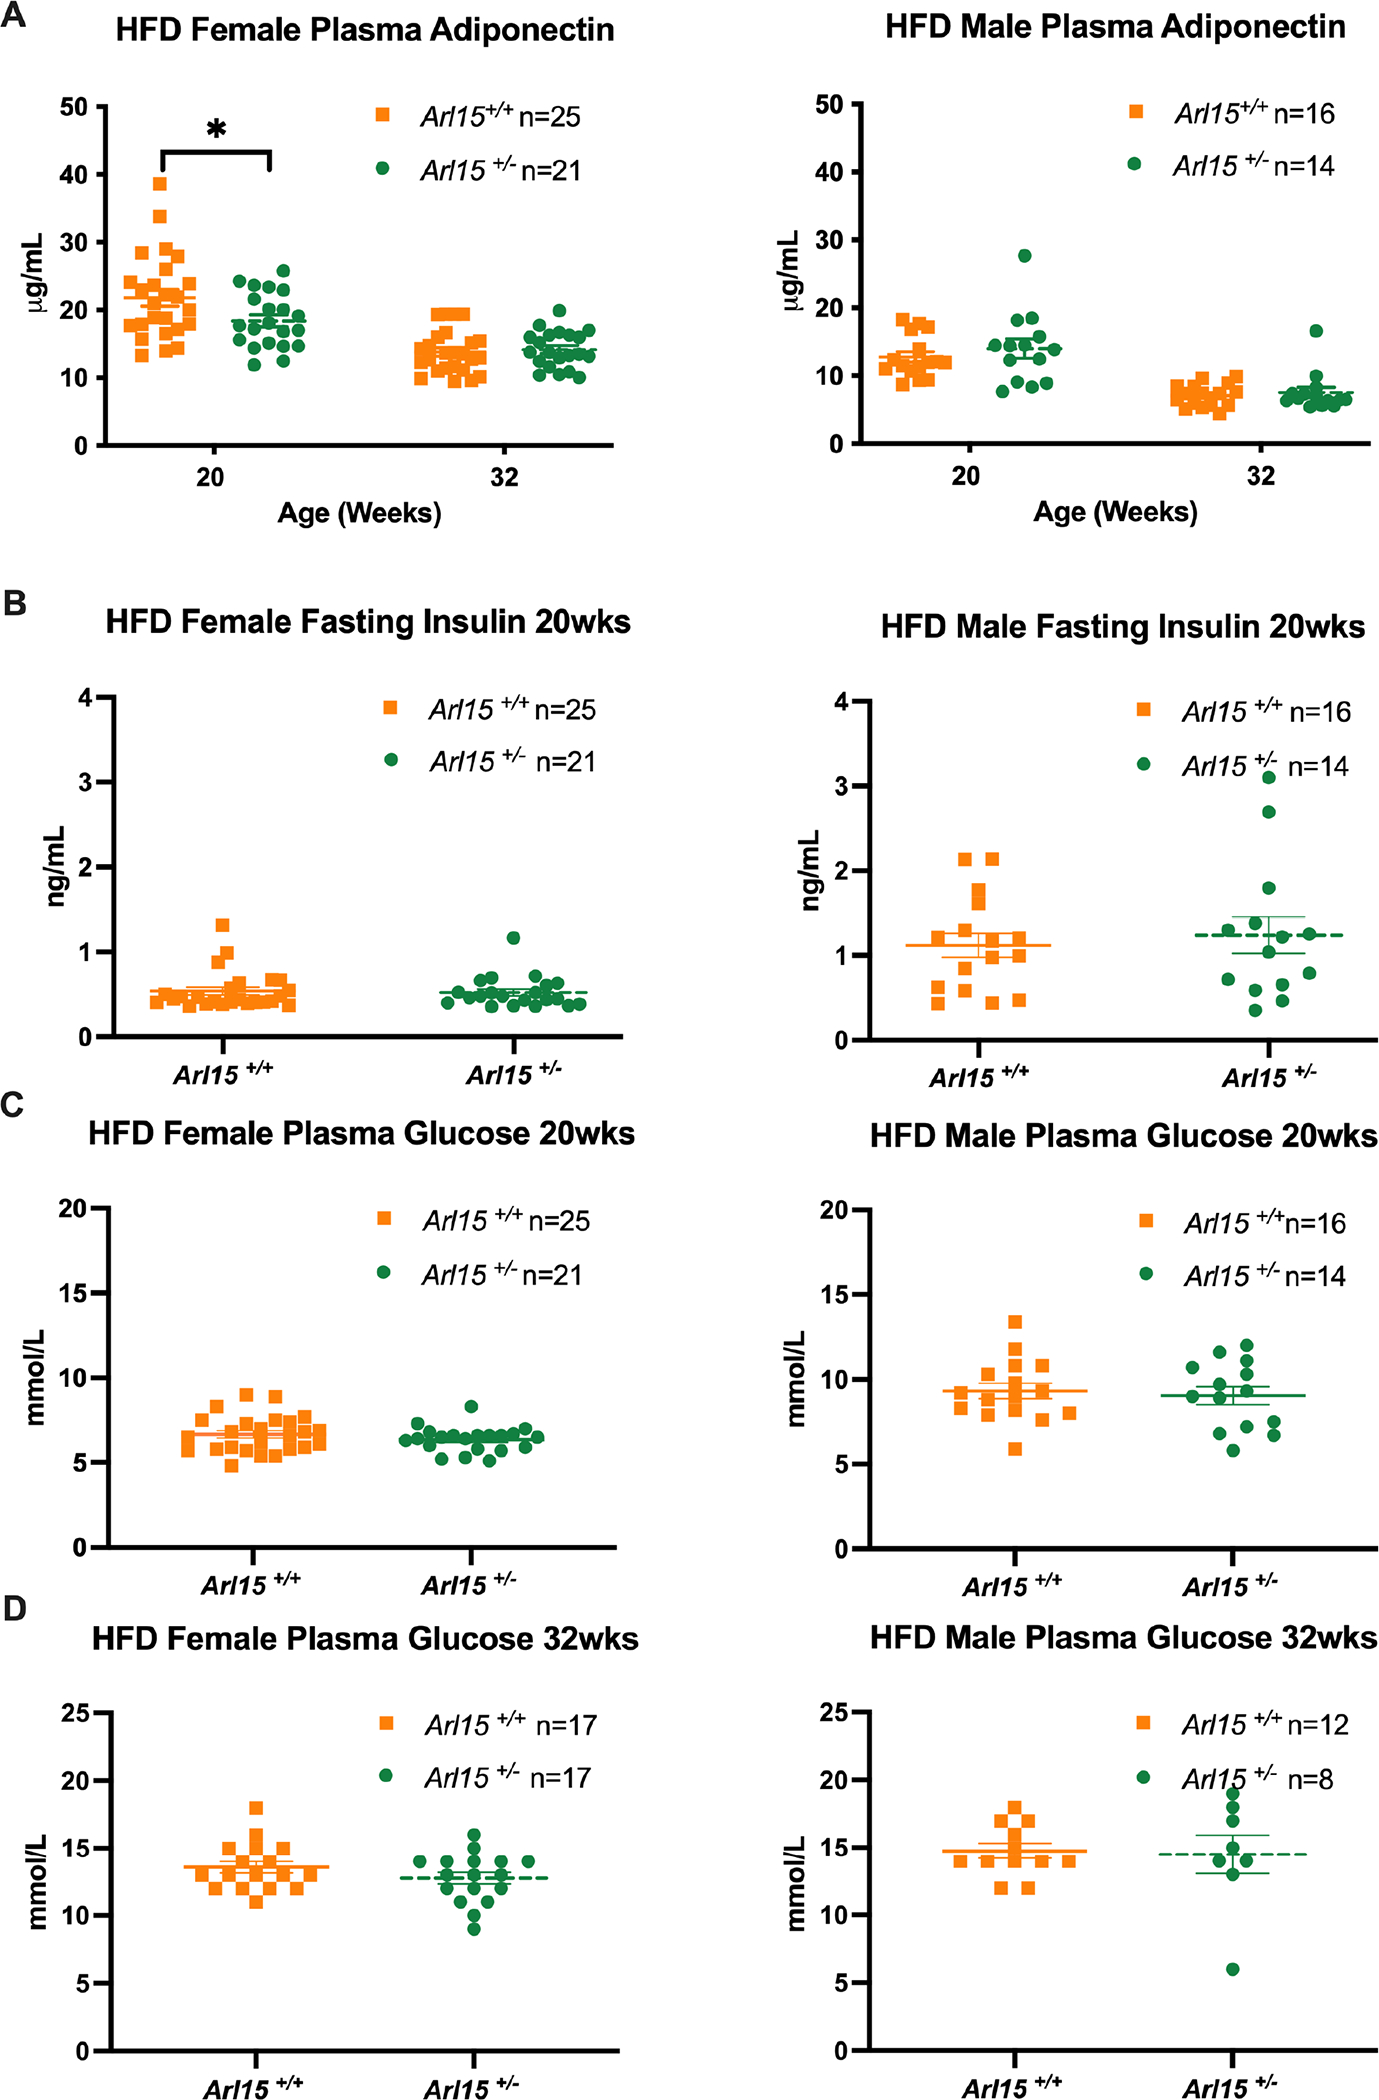
A: Fasting plasma adiponectin concentrations in HFD fed female and male mice, measured at 20 and 32 weeks of age. Female and male data at 20 weeks was Y=log(Y) transformed and analysed using an unpaired t-test. Female and male data at 32 weeks was analysed by an unpaired t-test and unpaired Mann-Whitney test respectively. B: Fasting plasma insulin in HFD fed female and male mice at 20 weeks of age. Female data was analysed by an unpaired Mann-Whitney test and male data was Y=log(Y) transformed and analysed by and unpaired t-test. C: Fasting plasma glucose in HFD fed female and male mice at 20 weeks of age. Female data was analysed by an unpaired t-test and male data was analysed by an unpaired Mann-Whitney test. All data presented as mean± S.E.M. D: Fasting plasma glucose in HFD fed female and male mice at 32 weeks of age. Female data was analysed by an unpaired t-test and male data was analysed by an unpaired Mann-Whitney test. All data presented as mean± S.E.M.
As an indication of glucose homeostasis, we measured plasma insulin and glucose concentrations. No differences were observed by genotype arguing against any significant hyperinsulinemia or hyperglycaemia in heterozygotes, as would likely be observed in lipodystrophy (Figure 9B, C and D).
Given GWAS showed that ARL15 locus was associated with kidney function and magnesium homeostasis (8), we analysed serum and urinary Mg2+ concentrations in male and female Arl15+/+ and Arl15+/− mice. Serum and urinary Mg2+ concentrations did not alter significantly between wildtypes and heterozygotes (Figure 10A−D). However, Mg2+ excretion was nearly 3 fold lower in female mice on a high fat diet, independent of their genotype (Figure 10D). The expression of genes involved in renal Mg2+ transport was evaluated by RT-qPCR. The expression of Trpm6, Trpm7, Slc41a1, Slc41a3, Cnnm2 and Cldn16 did not change between genotypes (Supplementary Fig. 11). Also, western blotting showed no change of TRPM7 protein level in kidney tissues from Arl15 heterozygous mice (Supplementary Fig. 11B).
Figure 10. Arl15+/− mice exhibit normal serum and urinary Mg2+ concentrations.
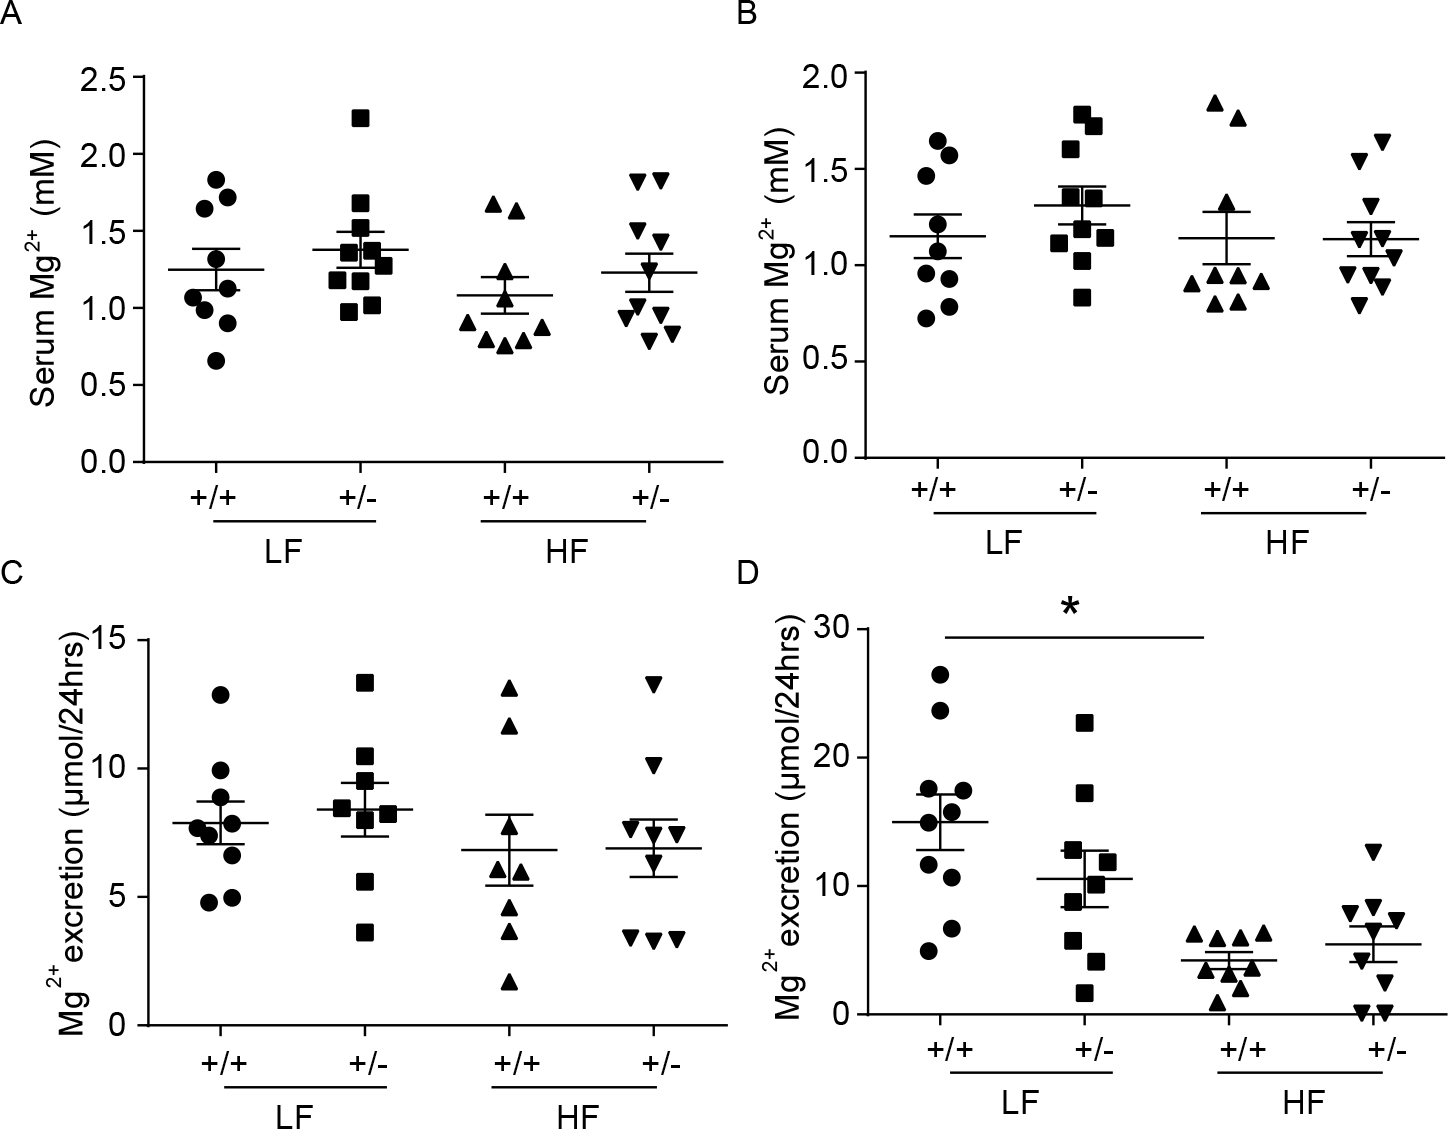
A-B: Serum Mg2+ concentrations of male (A) and female (B) Arl15+/+ and Arl15+/− mice fed with either low fat diet or high fat diet respectively. C-D: 24 hours urinary Mg2+ excretion of male (C) and female (D) Arl15+/+ and Arl15+/− mice treated with either low fat diet or high fat diet respectively. Values are presented as single data points with means ± SEM (n = 10) and data were analysed using unpaired t-tests. +/+, Arl15 wild type mice, +/−, Arl15 heterozygote mice, LF, low fat diet, HF, high fat diet.
Finally, we analysed lipid and cholesterol plasma concentration in heterozygous Arl15 KO mice and showed unaltered blood lipid level in both sexes on both diets (Supplementary Fig.12).
Discussion
In this study, we report a CRISPR/Cas9 induced frameshift mutation knockout mouse model of the Arl15 gene. Homozygous KO mice die postnatally and exhibit cleft palate (CP) while heterozygous female mice showed a mild reduced adiposity phenotype. We also showed that the CP phenotype is likely due to impaired cell migration, rather than a proliferation defect, concomitant with repressed Vimentin and TRPM7 in Arl15 homozygous KO. Heterozygous KO are viable and exhibit few metabolic disturbances.
The homozygous KO embryos developed a craniofacial defect as manifested by complete CP at full penetrance and delayed maturation in upper incisors, deformed tongue, and bigger eyes. Our homozygous Arl15 KO embryos had a delayed elevation of palatal shelf as manifested by failure in acquiring the horizontal orientation and lack of fusion activity from the opposing shelves. Interestingly, we also observed a sexual dimorphism in palatal shelf elevation as female wildtype mice showed delayed elevation of palatal shelf compared to male wildtype mice which is consistent with observation in human (36) and mouse (37). In normal craniofacial development, flattening of the tongue reduces the dorsal arch of the tongue thus creating more space above it for palatal shelf elevation, causing the tip of the tongue to protrude out of the oral cavity (38). Due to delayed mandible development, tongue flattening was obstructed. It would be useful to include screening of the gene ARL15 for variants in human patients that have syndromic CP in the future.
We excluded the possibility that the delayed migration was due to proliferation even though our bioinformatic analysis pointed to cancer pathways associated with the craniofacial and metabolic phenotypes in Arl15 and previous evidence pointing ARL15 being a tumour suppressor gene in the mouse (12). Craniofacial structure originates from the neural crest cell lineage, a group of multipotent stem cells that can differentiate into cranial, cardiac, vagal and trunk derivatives as they migrate along the anterior and posterior axis of the embryo via epithelial to mesenchymal transition (39–42). When we investigated the EMT process with Arl15 KO MEFs cells, Vimentin was reduced significantly. Vimentin belongs to the intermediate filament (IF) which along with actin filament and the microtubule filament form the cytoskeleton in a eukaryotic cell. Type III IF is involved in cell migration, wound healing, and tissue regeneration (43). It is expressed in mesenchymal cells such as fibroblasts, smooth skeletal muscle cells and white blood cells (44). Therefore, we suggest as a focus for future studies, that Arl15 may have a role, either directly or indirectly, in maintaining the mesenchymal status of cells via Vimentin which, when repressed, contributes to delayed migration.
We also demonstrated that TRPM7’s expression was low in homozygous Arl15 KO MEFs. TRPM7 has a variety of physiological roles including regulating Ca2+/Mg2+ homeostasis, the kinase domain enables its role in phosphorylating target proteins that are involved in embryogenesis (45), cell migration (46), cell viability (47) and cell proliferation (48). Two independent studies recently demonstrated that ARL15 inhibits TRPM7 activity (34, 49). Reduced TRPM7 expression may, therefore, be a compensatory response to prevent an overload of Ca2+/Mg2+ influx in ARL15 KO MEFs. Because TRPM7 was previously reported to regulate Vimentin’s expression via affecting Ca2+ influx by EGF signalling (50), and EGFR was predicted by our bioinformatic analysis to be interacting with Arl15, we postulate that ARL15 might regulate Vimentin’s expression via regulating TRPM7’s activity during early embryogenesis. Indeed, ARL15 can regulate the channel activity of TRPM6, which is the closest homologue of TRPM7 (8). TGFβ1 failed to rescue the migration defect possibly due to cells becoming growth arrested by TGFβ1 during the wound healing assay (51). Whether Arl15 is participating in TGFβ signalling during the palatal shelf elevation and fusion requires further study. Nevertheless, the migration study was limited by our use of MEFs because they can’t fully represent the cellular function of neural crest cells as located at anterior or posterior region of the palatal shelf, it would be interesting to carry out further experiments using embryonic palatal mesenchyme cell cultures in future studies. However, reduced Vimentin and TRPM7 observed in homozygous Arl15 KO form a good foundation for future mechanistic study of palatogenesis.
Two female patients with a severe insulin resistance phenotype, one with femoral gluteal lipodystrophy and one with partial lipodystrophy, have been found to have heterozygous loss of function ARL15 variants, a nonsense mutation, and a splice site mutation, respectively (2). However, in the study reported here, mice heterozygous for the Arl15 KO did not develop overt lipodystrophy. Female mice showed evidence of mildly reduced fat mass, dependent on diet, but did not exhibit signs of severe insulin resistance such as hyperinsulinemia and hyperglycaemia. Although gWAT and BAT depot weights were both reduced, only BAT mass reduction persisted after normalising to body weight, suggesting that gram white adipose differences reflect overall body composition changes. The decreased BAT mass in Arl15 heterozygous KO on HFD analysed by histology indicates a role Arl15 plays in reducing fat accumulation in BAT on an HFD. However, whether this is due to less differentiation of brown adipose precursor cells or increased lipolysis of the adipocytes requires additional investigation. Further, a reduction of Vimentin was observed in brown adipose tissue lysates in the female heterozygous mice on HFD. This suggests a role for ARL15 in the regulation of Vimentin and brown adipose tissue whitening. Interestingly, Vimentin has previously been shown to be involved in binding to β3AR in adipocytes from a proteomic study (52) and is also involved in lipolysis via direct binding to perilipin protein at the lipid droplet surfaces (53). Therefore, investigating the role of ARL15 in regulating brown adipose tissue mass and function is a promising future avenue for research.
The disturbances in metabolic traits observed in Arl15 KO mice contrasts with patients that have heterozygous mutations of this gene and developed lipodystrophy accompanied by insulin resistance (2). This discrepancy could be explained by species differences or potentially by the involvement of other genes in these patients. However, the phenotypes Arl15 KO mice developed are similar to patients with a dominant Vimentin variant mutation. Human genetic variants in Vimentin, depending on the domain affected, causes cataract, premature aging with progeroid syndromes, and abnormalities in adipose and ectodermal tissues (54, 55). A phospho-deficient Vimentin knock-in in mice revealed its role in fat accumulation, skin aging and neuronal differentiation (56–58).
Our mice showed a decrease in circulating adiponectin in heterozygous female mice on HFD at 20 weeks of age although surprisingly this phenotype was not observed at 32 weeks of age. This discrepancy may indicate an impact of ageing on adiponectin level. Human studies have provided some evidence of the effect of ageing on adiponectin levels (59, 60). Adiponectin levels are reported to be increased with age in males possibly due to a decrease in adiponectin clearance in the kidneys of older people (60). Therefore, a combination of examination of adiponectin secretion in adipose tissue with kidney clearance of adiponectin should be considered to determine final plasma adiponectin level.
Osteoclast mediated bone resorption and osteoblast mediated bone formation needs to be well balanced to maintain bone volume (61). Arl15 heterozygous KO female mice showed an increased BMD on LFD while Arl15 heterozygous KO male showed a decreased BMD on HFD. This demonstrates an opposite effect of Arl15 mutation on BMD in different sexes revealing a sex × diet × genotype interaction. Given bone and fat share the same lineage by differentiating from the mesenchymal stem cells, Arl15’s role in cell fate determination in early mesenchymal stem cells as affected by different diets could be studied further.
ARL15 has been demonstrated as a regulator of several Mg2+ channels and transporters, including TRPM6, TRPM7 and CNNM3 (4, 8, 34, 49). Moreover, a GWAS associated ARL15 with urinary Mg2+ levels and knockdown of arl15b expression in zebrafish larvae decreased their Mg2+ content (51). However, in our study urine and plasma Mg2+ levels were normal in heterozygous KO on both HFD and LFD. Although Trpm6 and Cnnm2 expression was not altered, compensatory mechanisms may prevent Mg2+ loss e.g., increased Mg2+ transport in the proximal tubule or thick ascending limb (TAL). Kidney-specific ARL15 mice may be required to observe a kidney phenotype.
In summary, we identified Arl15 as a new mouse CP gene and created a novel mouse model for the study of craniofacial development. We also identified preliminary molecular mechanisms that disturbed mesenchymal origin. Finally, this gene, which appears to have sexual dimorphic effects on metabolic traits and haploinsufficiency does not cause lipodystrophy in the mouse.
Supplementary Material
Acknowledgments
We thank Dr Minghui Yin for assisting with the wound healing assay. Funding was received from the Medical Research Council (MC_U142661184). Jeroen de Baaij was supported by the Dutch Diabetes Research Foundation (2017.81.014) and the Netherlands Organization for Scientific Research (Vidi 09150172110040). The C57BL/6NTac-Arl15em1(IMPC)H/H mice were generated at the MRC Harwell Institute which distributes these mice on behalf of the European Mouse Mutant Archive (www.infrafrontier.eu; Repository number EM:10785). MRC Harwell is also a member of the International Mouse Phenotyping Consortium (IMPC) and has received funding from the MRC (A410) and the National Institutes for Health for generating and/or phenotyping [5UM1HG006348–08] the C57BL/6NTac-Arl15em1(IMPC)H/H mice. The research reported in this publication is solely the responsibility of the authors and does not necessarily represent the official views of the National Institutes of Health. Funding and associated primary phenotypic information may be found at www.mousephenotype.org.
Footnotes
Additional information: No competing interests.
Data availability:
Included in article.
Reference
- 1.Gillingham AK, and Munro S (2007) The small G proteins of the Arf family and their regulators. Annu Rev Cell Dev Biol 23, 579–611 [DOI] [PubMed] [Google Scholar]
- 2.Rocha N, Payne F, Huang-Doran I, Sleigh A, Fawcett K, Adams C, Stears A, Saudek V, O’Rahilly S, Barroso I, and Semple RK (2017) The metabolic syndrome- associated small G protein ARL15 plays a role in adipocyte differentiation and adiponectin secretion. Sci Rep 7, 17593. [DOI] [PMC free article] [PubMed] [Google Scholar]
- 3.Wu Y, Bai Y, McEwan DG, Bentley L, Aravani D, and Cox RD (2021) Palmitoylated small GTPase ARL15 is translocated within Golgi network during adipogenesis. Biol Open 10 [DOI] [PMC free article] [PubMed] [Google Scholar]
- 4.Zolotarov Y, Ma C, González-Recio I, Hardy S, Franken GA, Uetani N, Latta F, Kostantin E, Boulais J, and Thibault M-P (2021) ARL15 modulates magnesium homeostasis through N-glycosylation of CNNMs. Cellular and Molecular Life Sciences 78, 5427–5445 [DOI] [PMC free article] [PubMed] [Google Scholar]
- 5.Richards JB, Waterworth D, O’Rahilly S, Hivert MF, Loos RJ, Perry JR, Tanaka T, Timpson NJ, Semple RK, Soranzo N, Song K, Rocha N, Grundberg E, Dupuis J, Florez JC, Langenberg C, Prokopenko I, Saxena R, Sladek R, Aulchenko Y, Evans D, Waeber G, Erdmann J, Burnett MS, Sattar N, Devaney J, Willenborg C, Hingorani A, Witteman JC, Vollenweider P, Glaser B, Hengstenberg C, Ferrucci L, Melzer D, Stark K, Deanfield J, Winogradow J, Grassl M, Hall AS, Egan JM, Thompson JR, Ricketts SL, König IR, Reinhard W, Grundy S, Wichmann HE, Barter P, Mahley R, Kesaniemi YA, Rader DJ, Reilly MP, Epstein SE, Stewart AF, Van Duijn CM, Schunkert H, Burling K, Deloukas P, Pastinen T, Samani NJ, McPherson R, Davey Smith G, Frayling TM, Wareham NJ, Meigs JB, Mooser V, Spector TD, and Consortium G (2009) A genome-wide association study reveals variants in ARL15 that influence adiponectin levels. PLoS Genet 5, e1000768. [DOI] [PMC free article] [PubMed] [Google Scholar]
- 6.Lotta LA, Gulati P, Day FR, Payne F, Ongen H, van de Bunt M, Gaulton KJ, Eicher JD, Sharp SJ, Luan J, De Lucia Rolfe E, Stewart ID, Wheeler E, Willems SM, Adams C, Yaghootkar H, Forouhi NG, Khaw KT, Johnson AD, Semple RK, Frayling T, Perry JR, Dermitzakis E, McCarthy MI, Barroso I, Wareham NJ, Savage DB, Langenberg C, O’Rahilly S, Scott RA, Consortium E-I, and Consortium CF (2017) Integrative genomic analysis implicates limited peripheral adipose storage capacity in the pathogenesis of human insulin resistance. Nat Genet 49, 17–26 [DOI] [PMC free article] [PubMed] [Google Scholar]
- 7.Gorski M, van der Most PJ, Teumer A, Chu AY, Li M, Mijatovic V, Nolte IM, Cocca M, Taliun D, Gomez F, Li Y, Tayo B, Tin A, Feitosa MF, Aspelund T, Attia J, Biffar R, Bochud M, Boerwinkle E, Borecki I, Bottinger EP, Chen MH, Chouraki V, Ciullo M, Coresh J, Cornelis MC, Curhan GC, d’Adamo AP, Dehghan A, Dengler L, Ding J, Eiriksdottir G, Endlich K, Enroth S, Esko T, Franco OH, Gasparini P, Gieger C, Girotto G, Gottesman O, Gudnason V, Gyllensten U, Hancock SJ, Harris TB, Helmer C, Höllerer S, Hofer E, Hofman A, Holliday EG, Homuth G, Hu FB, Huth C, Hutri-Kähönen N, Hwang SJ, Imboden M, Johansson Å, Kähönen M, König W, Kramer H, Krämer BK, Kumar A, Kutalik Z, Lambert JC, Launer LJ, Lehtimäki T, de Borst M, Navis G, Swertz M, Liu Y, Lohman K, Loos RJF, Lu Y, Lyytikäinen LP, McEvoy MA, Meisinger C, Meitinger T, Metspalu A, Metzger M, Mihailov E, Mitchell P, Nauck M, Oldehinkel AJ, Olden M, Wjh Penninx B, Pistis G, Pramstaller PP, Probst-Hensch N, Raitakari OT, Rettig R, Ridker PM, Rivadeneira F, Robino A, Rosas SE, Ruderfer D, Ruggiero D, Saba Y, Sala C, Schmidt H, Schmidt R, Scott RJ, Sedaghat S, Smith AV, Sorice R, Stengel B, Stracke S, Strauch K, Toniolo D, Uitterlinden AG, Ulivi S, Viikari JS, Völker U, Vollenweider P, Völzke H, Vuckovic D, Waldenberger M, Jin Wang J, Yang Q, Chasman DI, Tromp G, Snieder H, Heid IM, Fox CS, Köttgen A, Pattaro C, Böger CA, and Fuchsberger C (2017) 1000 Genomes-based meta-analysis identifies 10 novel loci for kidney function. Sci Rep 7, 45040. [DOI] [PMC free article] [PubMed] [Google Scholar]
- 8.Corre T, Arjona FJ, Hayward C, Youhanna S, De Baaij JH, Belge H, Nägele N, Debaix H, Blanchard MG, and Traglia M (2018) Genome-wide meta-analysis unravels interactions between magnesium homeostasis and metabolic phenotypes. Vol. 29 pp. 335–348, Am Soc Nephrol [DOI] [PMC free article] [PubMed] [Google Scholar]
- 9.Taneera J, Prasad RB, Dhaiban S, Mohammed AK, Haataja L, Arvan P, Hamad M, Groop L, and Wollheim CB (2018) Silencing of the FTO gene inhibits insulin secretion: An in vitro study using GRINCH cells. Mol Cell Endocrinol 472, 10–17 [DOI] [PMC free article] [PubMed] [Google Scholar]
- 10.Thomsen SK, Ceroni A, van de Bunt M, Burrows C, Barrett A, Scharfmann R, Ebner D, McCarthy MI, and Gloyn AL (2016) Systematic Functional Characterization of Candidate Causal Genes for Type 2 Diabetes Risk Variants. Diabetes 65, 3805–3811 [DOI] [PMC free article] [PubMed] [Google Scholar]
- 11.Zhao J, Wang M, Deng W, Zhong D, Jiang Y, Liao Y, Chen B, and Zhang X (2017) ADP-ribosylation factor-like GTPase 15 enhances insulin-induced AKT phosphorylation in the IR/IRS1/AKT pathway by interacting with ASAP2 and regulating PDPK1 activity. Biochem Biophys Res Commun 486, 865–871 [DOI] [PubMed] [Google Scholar]
- 12.Uren AG, Kool J, Matentzoglu K, de Ridder J, Mattison J, van Uitert M, Lagcher W, Sie D, Tanger E, Cox T, Reinders M, Hubbard TJ, Rogers J, Jonkers J, Wessels L, Adams DJ, van Lohuizen M, and Berns A (2008) Large-scale mutagenesis in p19(ARF)- and p53-deficient mice identifies cancer genes and their collaborative networks. Cell 133, 727–741 [DOI] [PMC free article] [PubMed] [Google Scholar]
- 13.Kashyap S, Kumar U, Pandey AK, Kanjilal M, Chattopadhyay P, Yadav C, and Thelma B (2018) Functional characterisation of ADP ribosylation factor-like protein 15 in rheumatoid arthritis synovial fibroblasts. Clinical and Experimental Rheumatology 36, 581–588 [PubMed] [Google Scholar]
- 14.Shi M, Tie HC, Divyanshu M, Sun X, Zhou Y, Boh BK, Vardy LA, and Lu L (2022) Arl15 upregulates the TGFβ family signaling by promoting the assembly of the Smad-complex. eLife 11, e76146. [DOI] [PMC free article] [PubMed] [Google Scholar]
- 15.Sharma P, Venkatesh PH, Paddillaya N, Shah N, Rajeshwari B, Dakua A, Penmatsa A, Balasubramanian N, Gundiah N, and Setty SRG (2022) Golgi localized Arl15 regulates cargo transport, cell adhesion and motility. bioRxiv, 2022.2008.2018.504432 [Google Scholar]
- 16.Mianné J, Codner GF, Caulder A, Fell R, Hutchison M, King R, Stewart ME, Wells S, and Teboul L (2017) Analysing the outcome of CRISPR-aided genome editing in embryos: Screening, genotyping and quality control. Methods 121, 68–76 [DOI] [PubMed] [Google Scholar]
- 17.Waterhouse AM, Procter JB, Martin DM, Clamp M, and Barton GJ (2009) Jalview Version 2--a multiple sequence alignment editor and analysis workbench. Bioinformatics 25, 1189–1191 [DOI] [PMC free article] [PubMed] [Google Scholar]
- 18.Hough TA, Nolan PM, Tsipouri V, Toye AA, Gray IC, Goldsworthy M, Moir L, Cox RD, Clements S, Glenister PH, Wood J, Selley RL, Strivens MA, Vizor L, McCormack SL, Peters J, Fisher EM, Spurr N, Rastan S, Martin JE, Brown SD, and Hunter AJ (2002) Novel phenotypes identified by plasma biochemical screening in the mouse. Mamm Genome 13, 595–602 [DOI] [PubMed] [Google Scholar]
- 19.Szklarczyk D, Gable AL, Nastou KC, Lyon D, Kirsch R, Pyysalo S, Doncheva NT, Legeay M, Fang T, Bork P, Jensen LJ, and von Mering C (2021) The STRING database in 2021: customizable protein-protein networks, and functional characterization of user-uploaded gene/measurement sets. Nucleic Acids Res 49, D605–D612 [DOI] [PMC free article] [PubMed] [Google Scholar]
- 20.Raudvere U, Kolberg L, Kuzmin I, Arak T, Adler P, Peterson H, and Vilo J (2019) g:Profiler: a web server for functional enrichment analysis and conversions of gene lists (2019 update). Nucleic Acids Res 47, W191–W198 [DOI] [PMC free article] [PubMed] [Google Scholar]
- 21.Brown JM, Horner NR, Lawson TN, Fiegel T, Greenaway S, Morgan H, Ring N, Santos L, Sneddon D, Teboul L, Vibert J, Yaikhom G, Westerberg H, and Mallon AM (2018) A bioimage informatics platform for high-throughput embryo phenotyping. Brief Bioinform 19, 41–51 [DOI] [PMC free article] [PubMed] [Google Scholar]
- 22.Horner NR, Venkataraman S, Armit C, Casero R, Brown JM, Wong MD, van Eede MC, Henkelman RM, Johnson S, Teboul L, Wells S, Brown SD, Westerberg H, and Mallon AM (2021) LAMA: automated image analysis for the developmental phenotyping of mouse embryos. Development 148 [DOI] [PMC free article] [PubMed] [Google Scholar]
- 23.Schneider CA, Rasband WS, and Eliceiri KW (2012) NIH Image to ImageJ: 25 years of image analysis. Nat Methods 9, 671–675 [DOI] [PMC free article] [PubMed] [Google Scholar]
- 24.Osaka N, Hirota Y, Ito D, Ikeda Y, Kamata R, Fujii Y, Chirasani VR, Campbell SL, Takeuchi K, Senda T, and Sasaki AT (2021) Divergent Mechanisms Activating RAS and Small GTPases Through Post-translational Modification. Front Mol Biosci 8, 707439. [DOI] [PMC free article] [PubMed] [Google Scholar]
- 25.Bush JO, and Jiang R (2012) Palatogenesis: morphogenetic and molecular mechanisms of secondary palate development. Development 139, 231–243 [DOI] [PMC free article] [PubMed] [Google Scholar]
- 26.Yu K, and Ornitz DM (2011) Histomorphological study of palatal shelf elevation during murine secondary palate formation. Dev Dyn 240, 1737–1744 [DOI] [PMC free article] [PubMed] [Google Scholar]
- 27.Kaufman MH (1992) Atlas of mouse development, Academic press [Google Scholar]
- 28.Mossey PA, Little J, Munger RG, Dixon MJ, and Shaw WC (2009) Cleft lip and palate. Lancet 374, 1773–1785 [DOI] [PubMed] [Google Scholar]
- 29.Sasaki Y, Taya Y, Saito K, Fujita K, Aoba T, and Fujiwara T (2014) Molecular contribution to cleft palate production in cleft lip mice. Congenit Anom (Kyoto) 54, 94–99 [DOI] [PMC free article] [PubMed] [Google Scholar]
- 30.Stanier P, and Moore GE (2004) Genetics of cleft lip and palate: syndromic genes contribute to the incidence of non-syndromic clefts. Hum Mol Genet 13 Spec No 1, R73–81 [DOI] [PubMed] [Google Scholar]
- 31.Fitzpatrick DR, Denhez F, Kondaiah P, and Akhurst RJ (1990) Differential expression of TGF beta isoforms in murine palatogenesis. Development 109, 585–595 [DOI] [PubMed] [Google Scholar]
- 32.Kaartinen V, Voncken JW, Shuler C, Warburton D, Bu D, Heisterkamp N, and Groffen J (1995) Abnormal lung development and cleft palate in mice lacking TGF-beta 3 indicates defects of epithelial-mesenchymal interaction. Nat Genet 11, 415–421 [DOI] [PubMed] [Google Scholar]
- 33.Acloque H, Adams MS, Fishwick K, Bronner-Fraser M, and Nieto MA (2009) Epithelial-mesenchymal transitions: the importance of changing cell state in development and disease. J Clin Invest 119, 1438–1449 [DOI] [PMC free article] [PubMed] [Google Scholar]
- 34.Kollewe A, Chubanov V, Tseung FT, Correia L, Schmidt E, Rössig A, Zierler S, Haupt A, Müller CS, and Bildl W (2021) The molecular appearance of native TRPM7 channel complexes identified by high-resolution proteomics. Elife 10 [DOI] [PMC free article] [PubMed] [Google Scholar]
- 35.Middelbeek J, Kuipers AJ, Henneman L, Visser D, Eidhof I, van Horssen R, Wieringa B, Canisius SV, Zwart W, and Wessels LF (2012) TRPM7 is required for breast tumor cell metastasis. Cancer research 72, 4250–4261 [DOI] [PubMed] [Google Scholar]
- 36.Burdi AR, and Silvey RG (1969) Sexual differences in closure of the human palatal shelves. Cleft Palate J 6, 1–7 [PubMed] [Google Scholar]
- 37.Goering J, Moedritzer M, Stetsiv M, Isai D, Hufft-Martinez B, Umar Z, Rickabaugh M, Keselman P, Chauhan M, and Brooks W (2022) Novel insights into the fundamentals of palatal shelf elevation dynamics in normal mouse embryos.
- 38.Ferguson MW (1978) Palatal shelf elevation in the Wistar rat fetus. J Anat 125, 555–577 [PMC free article] [PubMed] [Google Scholar]
- 39.Milet C, and Monsoro-Burq AH (2012) Neural crest induction at the neural plate border in vertebrates. Dev Biol 366, 22–33 [DOI] [PubMed] [Google Scholar]
- 40.Gandhi S, and Bronner ME (2018) Insights into neural crest development from studies of avian embryos. Int J Dev Biol 62, 183–194 [DOI] [PubMed] [Google Scholar]
- 41.Simões-Costa M, and Bronner ME (2015) Establishing neural crest identity: a gene regulatory recipe. Development 142, 242–257 [DOI] [PMC free article] [PubMed] [Google Scholar]
- 42.Soldatov R, Kaucka M, Kastriti ME, Petersen J, Chontorotzea T, Englmaier L, Akkuratova N, Yang Y, Häring M, Dyachuk V, Bock C, Farlik M, Piacentino ML, Boismoreau F, Hilscher MM, Yokota C, Qian X, Nilsson M, Bronner ME, Croci L, Hsiao WY, Guertin DA, Brunet JF, Consalez GG, Ernfors P, Fried K, Kharchenko PV, and Adameyko I (2019) Spatiotemporal structure of cell fate decisions in murine neural crest. Science 364 [DOI] [PubMed] [Google Scholar]
- 43.Cheng F, and Eriksson JE (2017) Intermediate Filaments and the Regulation of Cell Motility during Regeneration and Wound Healing. Cold Spring Harb Perspect Biol 9 [DOI] [PMC free article] [PubMed] [Google Scholar]
- 44.Cooper GM, Hausman RE, and Hausman RE (2007) The cell: a molecular approach Vol. 4, ASM press; Washington, DC [Google Scholar]
- 45.Jin J, Desai BN, Navarro B, Donovan A, Andrews NC, and Clapham DE (2008) Deletion of Trpm7 disrupts embryonic development and thymopoiesis without altering Mg2+ homeostasis. Science 322, 756–760 [DOI] [PMC free article] [PubMed] [Google Scholar]
- 46.Clark K, Langeslag M, van Leeuwen B, Ran L, Ryazanov AG, Figdor CG, Moolenaar WH, Jalink K, and van Leeuwen FN (2006) TRPM7, a novel regulator of actomyosin contractility and cell adhesion. EMBO J 25, 290–301 [DOI] [PMC free article] [PubMed] [Google Scholar]
- 47.Nadler MJ, Hermosura MC, Inabe K, Perraud AL, Zhu Q, Stokes AJ, Kurosaki T, Kinet JP, Penner R, Scharenberg AM, and Fleig A (2001) LTRPC7 is a Mg.ATP-regulated divalent cation channel required for cell viability. Nature 411, 590–595 [DOI] [PubMed] [Google Scholar]
- 48.Hanano T, Hara Y, Shi J, Morita H, Umebayashi C, Mori E, Sumimoto H, Ito Y, Mori Y, and Inoue R (2004) Involvement of TRPM7 in cell growth as a spontaneously activated Ca2+ entry pathway in human retinoblastoma cells. J Pharmacol Sci 95, 403–419 [DOI] [PubMed] [Google Scholar]
- 49.Bai Z, Feng J, Franken GAC, Al’Saadi N, Cai N, Yu AS, Lou L, Komiya Y, Hoenderop JGJ, de Baaij JHF, Yue L, and Runnels LW (2021) CNNM proteins selectively bind to the TRPM7 channel to stimulate divalent cation entry into cells. PLoS Biol 19, e3001496. [DOI] [PMC free article] [PubMed] [Google Scholar]
- 50.Davis FM, Azimi I, Faville RA, Peters AA, Jalink K, Putney JW, Goodhill GJ, Thompson EW, Roberts-Thomson SJ, and Monteith GR (2014) Induction of epithelial-mesenchymal transition (EMT) in breast cancer cells is calcium signal dependent. Oncogene 33, 2307–2316 [DOI] [PMC free article] [PubMed] [Google Scholar]
- 51.Iavarone A, and Massagué J (1997) Repression of the CDK activator Cdc25A and cell-cycle arrest by cytokine TGF-beta in cells lacking the CDK inhibitor p15. Nature 387, 417–422 [DOI] [PubMed] [Google Scholar]
- 52.Kumar N, Robidoux J, Daniel KW, Guzman G, Floering LM, and Collins S (2007) Requirement of vimentin filament assembly for beta3-adrenergic receptor activation of ERK MAP kinase and lipolysis. The Journal of biological chemistry 282, 9244–9250 [DOI] [PubMed] [Google Scholar]
- 53.Shen WJ, Patel S, Eriksson JE, and Kraemer FB (2010) Vimentin is a functional partner of hormone sensitive lipase and facilitates lipolysis. J Proteome Res 9, 1786–1794 [DOI] [PMC free article] [PubMed] [Google Scholar]
- 54.Cogné B, Bouameur JE, Hayot G, Latypova X, Pattabiraman S, Caillaud A, Si-Tayeb K, Besnard T, Küry S, Chariau C, Gaignerie A, David L, Bordure P, Kaganovich D, Bézieau S, Golzio C, Magin TM, and Isidor B (2020) A dominant vimentin variant causes a rare syndrome with premature aging. Eur J Hum Genet 28, 1218–1230 [DOI] [PMC free article] [PubMed] [Google Scholar]
- 55.Müller M, Bhattacharya SS, Moore T, Prescott Q, Wedig T, Herrmann H, and Magin TM (2009) Dominant cataract formation in association with a vimentin assembly disrupting mutation. Hum Mol Genet 18, 1052–1057 [DOI] [PubMed] [Google Scholar]
- 56.Chen M, Puschmann TB, Marasek P, Inagaki M, Pekna M, Wilhelmsson U, and Pekny M (2018) Increased Neuronal Differentiation of Neural Progenitor Cells Derived from Phosphovimentin-Deficient Mice. Mol Neurobiol 55, 5478–5489 [DOI] [PMC free article] [PubMed] [Google Scholar]
- 57.Tanaka H, Goto H, Inoko A, Makihara H, Enomoto A, Horimoto K, Matsuyama M, Kurita K, Izawa I, and Inagaki M (2015) Cytokinetic Failure-induced Tetraploidy Develops into Aneuploidy, Triggering Skin Aging in Phosphovimentin-deficient Mice. The Journal of biological chemistry 290, 12984–12998 [DOI] [PMC free article] [PubMed] [Google Scholar]
- 58.Wilhelmsson U, Stillemark-Billton P, Borén J, and Pekny M (2019) Vimentin is required for normal accumulation of body fat. Biol Chem 400, 1157–1162 [DOI] [PubMed] [Google Scholar]
- 59.Adamczak M, Rzepka E, Chudek J, and Wiecek A (2005) Ageing and plasma adiponectin concentration in apparently healthy males and females. Clin Endocrinol (Oxf) 62, 114–118 [DOI] [PubMed] [Google Scholar]
- 60.Isobe T, Saitoh S, Takagi S, Takeuchi H, Chiba Y, Katoh N, and Shimamoto K (2005) Influence of gender, age and renal function on plasma adiponectin level: the Tanno and Sobetsu study. Eur J Endocrinol 153, 91–98 [DOI] [PubMed] [Google Scholar]
- 61.Sims NA, and Martin TJ (2014) Coupling the activities of bone formation and resorption: a multitude of signals within the basic multicellular unit. Bonekey Rep 3, 481. [DOI] [PMC free article] [PubMed] [Google Scholar]
Associated Data
This section collects any data citations, data availability statements, or supplementary materials included in this article.
Supplementary Materials
Data Availability Statement
Included in article.