

Abstract
Fe K-edge X-ray absorption spectroscopy (XAS) has long been used for the study of high-valent iron intermediates in biological and artificial catalysts. 4p-mixing into the 3d orbitals complicates the pre-edge analysis but when correctly understood via 1s2p resonant inelastic X-ray scattering (RIXS) and Fe L-edge XAS, enables deeper insight into geometric structure and correlates with the electronic structure and reactivity. This study shows that in addition to the 4p-mixing into 3d(z2) orbital due to the short iron-oxo bond, the loss of inversion in the equatorial plane leads to 4p mixing into the 3d(x2-y2,xy), providing structural insight and allowing the distinction of 6- vs. 5-coordinate active sites as shown through application to the Fe(IV)=O intermediate of taurine dioxygenase. Combined with O K-edge XAS, this study gives an unprecedented experimental insight into the electronic structure of Fe(IV)=O active sites and their selectivity for reactivity enabled by the π-pathway involving the 3d(xz/yz) orbitals. Finally, the large effect of spin polarization is experimentally assigned in the pre-edge (i.e. the α/β splitting) and found to be better modeled by multiplet simulations rather than by commonly used time-dependent density functional theory.
Graphical Abstract

1. Introduction
Mononuclear non-heme iron enzymes activate O2 to catalyze a wide range of chemical reactions in nature, ranging from natural product biosynthesis to bioremediation and DNA repair.1–4 A subgroup of enzymes use α-ketoglutarate (αKG) or pterin as a cofactor to provide two electrons for the activation of O2. They employ a two-histidine/one-carboxylate facial triad binding a high spin Fe(II) to activate O2 in the presence of both bound cofactor and substrate to form high spin S=2 Fe(IV)=O intermediates.5 In the αKG-dependent enzymes, these perform H atom abstraction on their substrate for hydroxylation, halogenation, desaturation, epimerization, ring closure and ring rearrangements.6
Taurine dioxygenase (TauD), which was the first αKG-dependent enzyme whose O2−intermediate was generated,7 and the syringomycin halogenase SyrB2,8 which has a chloride or bromide in place of the carboxylate residue, have been studied over the last two decades to investigate the geometric and electronic structure and reactivity of these Fe(IV)=O intermediates through kinetics, Mössbauer spectroscopy, X-ray absorption spectroscopy (XAS), resonance Raman, magnetic circular dichroism (MCD), nuclear resonance vibrational spectroscopy (NRVS) and calculations.9–17 In particular, NRVS was used to determine for SyrB214 and TauD15 that the Fe(IV)=O intermediate had a five-coordinate distorted trigonal bipyramidal geometries (Figure 1A). These intermediates inspired the synthesis of model complexes.18 While most attempts to synthesize Fe(IV)=O molecules yielded six-coordinate S=1 model complexes,19,20 the introduction of bulky tripod ligands enforcing a five-coordinate geometry allowed the synthesis of S=2 Fe(IV)=O centers,21,22 in particular for this study [Fe(IV)O(H3buea)]− ([H3buea]3− = tris[N’-tert-butylureaylato-N-ethylene]aminato) (Figure 1B), due to the trigonal ligand field splitting of the 3d orbitals (Figure 1C).
Figure 1:

A) NRVS-determined trigonal bipyramid structure14,15 of the Fe(IV)=O intermediate of TauD (X=Asp) / SyrB2 (X=Cl or Br). B) Structure of the five-coordinate [Fe(IV)O(H3buea)]− complex.22 C) Schematic molecular orbital diagram of a trigonal high spin Fe(IV)=O complex.
In the past literature, Fe K-edge XAS has contributed to the study of Fe(IV)=O intermediates23–27 as these have characteristically intense pre-edges that arise from the loss of inversion in the axial direction, leading to a strong mixing of the Fe 4pz orbital into the 3d(z2), resulting in intense electric dipole-allowed character in the 1s → 3d(z2) transition.28 However, additional information can be extracted from the Fe K-pre-edge by measuring 1s2p resonant inelastic X-ray scattering (1s2p RIXS) in combination with Fe L-edge XAS.29–31 Diagonal cuts through the RIXS plane at constant emission energy give Fe K-edge-like spectra with higher energy resolution than the standard K-edge XAS experiment due to the long-lived 2p core-hole final state, enabling the resolution of distinct spectral features. Vertical cuts at constant incident energy through these features of the K-pre-edge enable their correlation with the Fe L-edge XAS, allowing specific spectral assignments. In our previous study of ferric-oxo dimer species,32 this approach showed that while allowed by group theory in C4v symmetry, the Fe 4px,y orbitals do not mix significantly into the 3d(xz,yz) orbitals, in contrast to the intense 4pz mixing into the 3d(z2) orbital. In the present study, we use a parallel approach on the five-coordinate trigonal bipyramidal (C3v symmetry) S=2 Fe(IV)=O site in the model complex [Fe(IV)O(H3buea)]−22 (Figure 1B), calibrated by the two parent high spin ferric oxo and hydroxo complexes [Fe(III)O(H3buea)]2–33 and [Fe(III)(OH)(H3buea)]−34 to determine that the additional structure we observe in the K-pre-edge is due to the non-centrosymmetric equatorial trigonal ligand field that results in mixing of the 3d(xy,x2-y2) with the 4px,y orbitals and to the large exchange splitting of the α and β z2 transitions. Having gained this insight from the model complexes, the methodology is extended to the structural determination of the Fe(IV)=O intermediate of TauD from the Fe K-edge XAS spectrum.
In addition, we use O K-edge XAS to experimentally quantify the oxo character in the frontier molecular orbitals that are key to the electrophilic and H atom abstraction reactivity of S=2 Fe(IV)=O active sites. While Fe L-edge XAS involves Fe 2p → 3d transitions and probes the 3d character in the valence metal orbitals35–37 (i.e. the differential orbital covalency, DOC), O K-edge XAS involves transitions into the Fe 3d orbitals with O character and provides a direct probe of the covalencies of the Fe(IV)=O bonds as the intensity quantifies the oxo-character mixed into the different Fe 3d orbitals.38,39 A range of computational studies has considered the difference in σ vs. π-reactivity of Fe(IV)=O species with different substrates,13–15,17,40 where the σ-pathway enables an axial approach of the substrate along the Fe-O bond while the π-pathway enables an equatorial approach perpendicular to the Fe-O bond. Our O K-edge XAS data and analysis provides unprecedented confirmation of the importance of the π-pathway through its more covalent π-bond.
2. Results and analysis
2.1. Fe K-edge XAS, RIXS and CEE
2.1.1. Experimental spectra
The 2D RIXS planes of the [Fe(III)(OH)(H3buea)]−, [Fe(III)O(H3buea)]2− and [Fe(IV)O(H3buea)]− complexes are shown on Figure 2. The incident photon, energy plotted on the x-axis, excites an Fe 1s electron into unoccupied 3d valence orbitals and results in 2p → 1s electronic relaxation with emission of a fluorescence photon. The y-axis is plotted as the energy transfer, that is the energy difference between the incident photon and the emitted photon. Cuts through the RIXS plane at a constant emission energy (CEE, diagonal cuts of the RIXS plane shown as black lines in Figure 2) give Fe K-edge-like spectra with higher energy resolution than the standard K-edge XAS experiment, and cuts at constant incident energy (CIE, vertical cuts of the RIXS plane shown as an magenta line in Figure 2A) give Fe L-edge-like spectra with enhanced intensity for the transitions that are accessible from the intermediate K-pre-edge states reached at the incident energy. These are analyzed in section 2.2.
Figure 2:
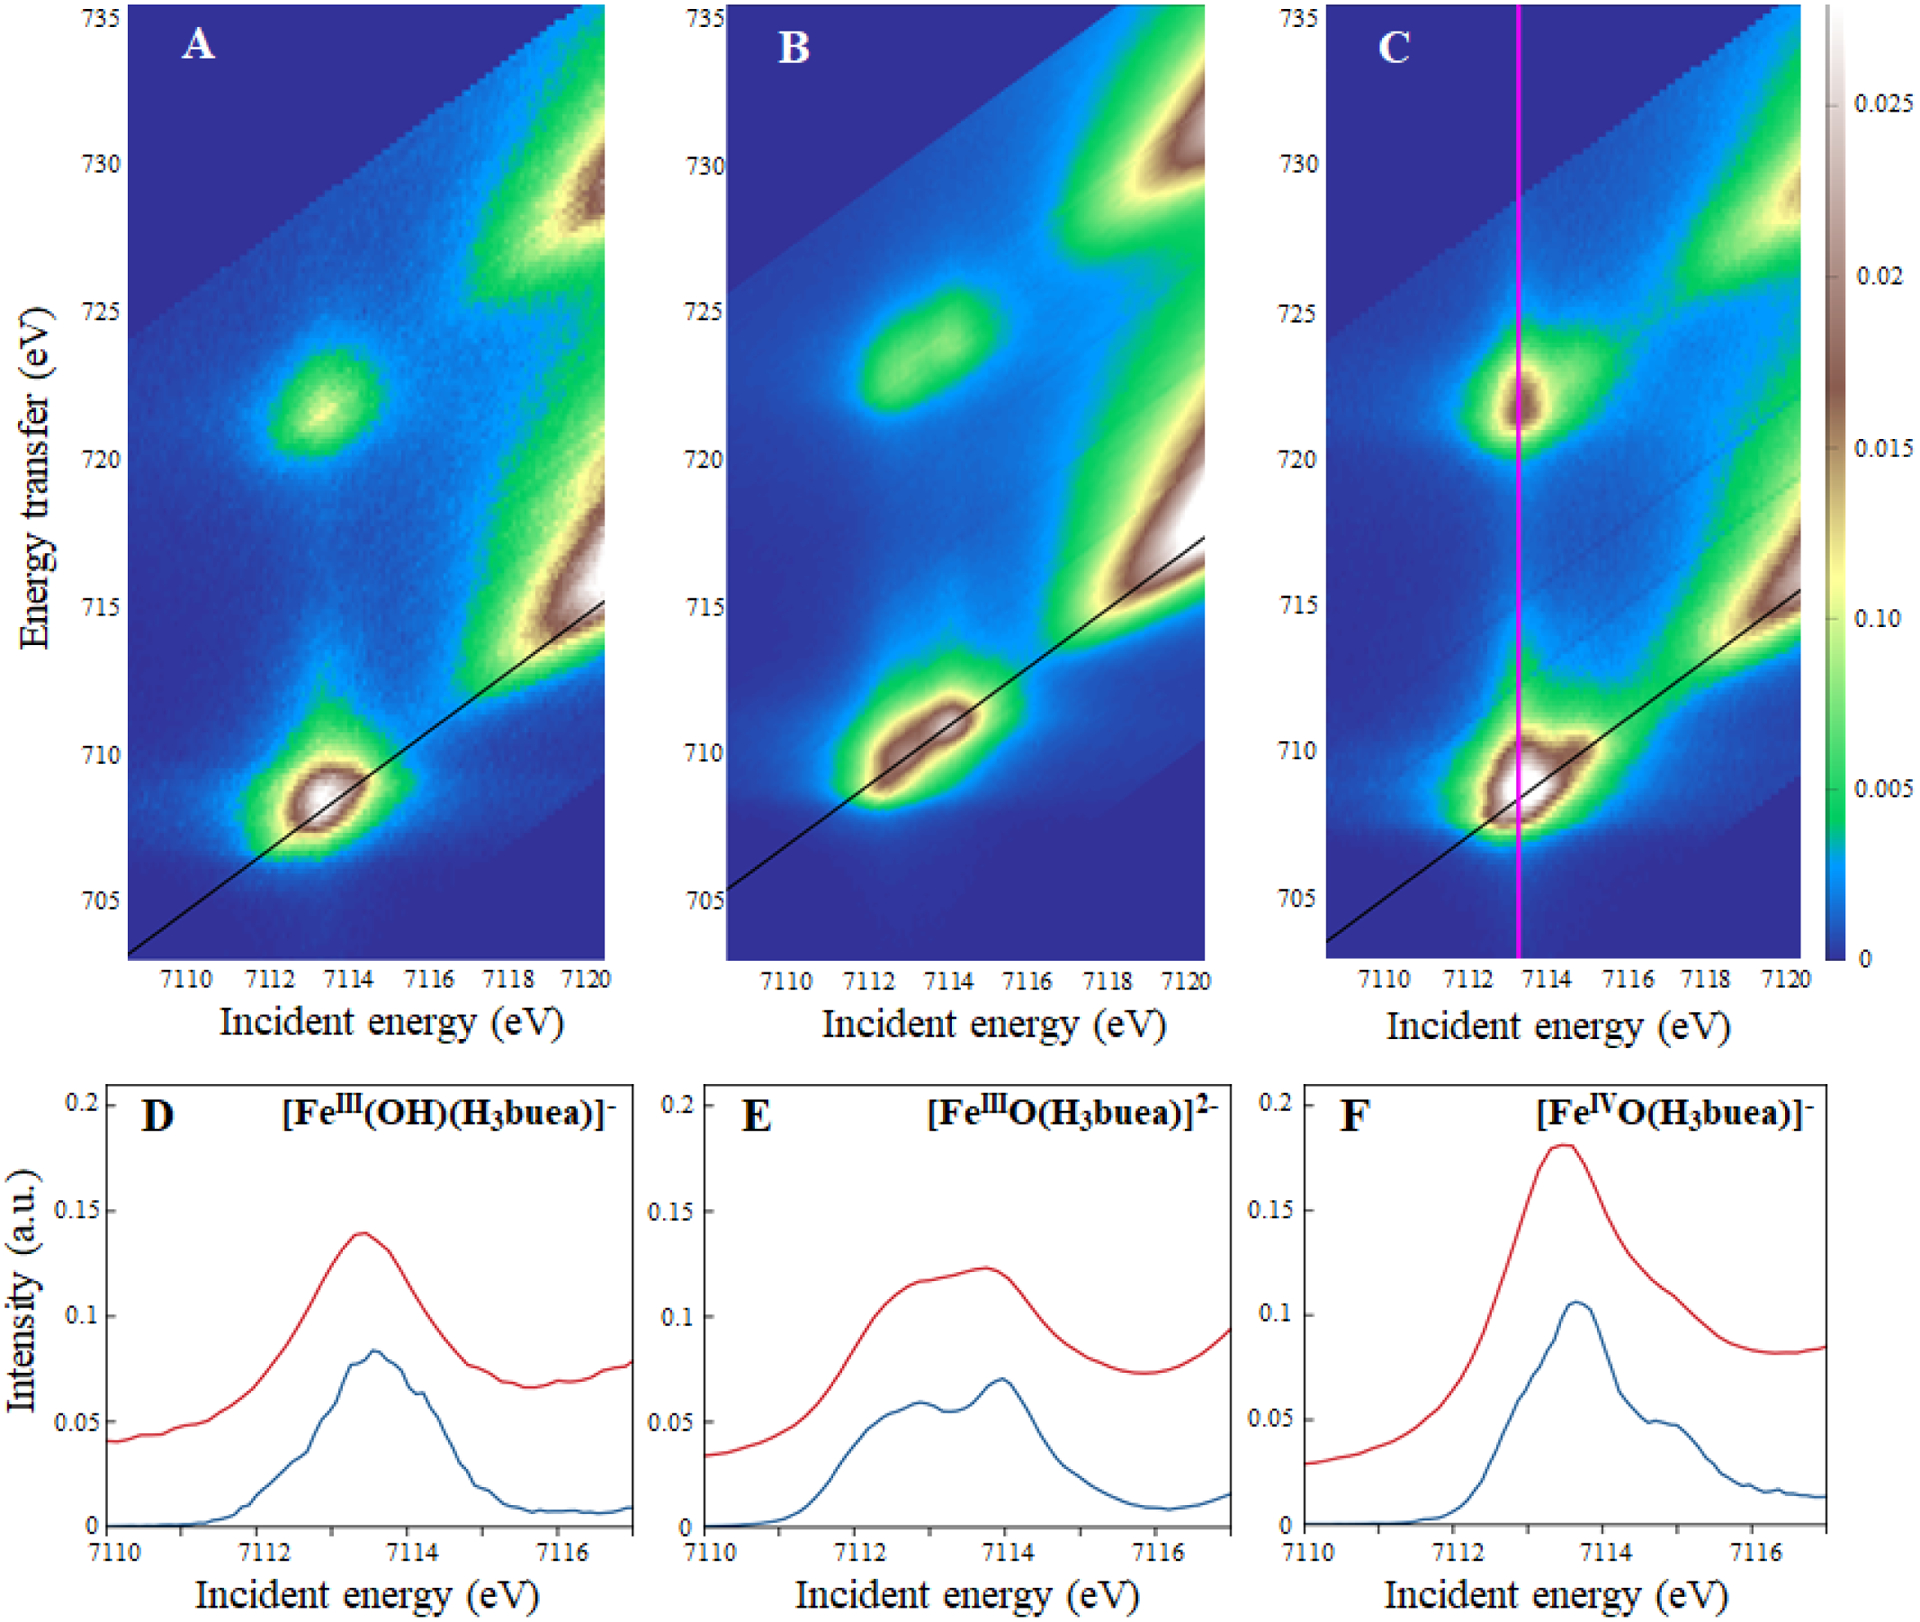
Experimental 1s2p RIXS planes of A) [Fe(III)(OH)(H3buea)]−, B) [Fe(III)O(H3buea)]2− and C) [Fe(IV)O(H3buea)]−. The planes are normalized to the edge jump and plotted such that the maximum of intensity is in the pre-edge region. Diagonal black lines show the CEE. A magenta vertical line shows a CIE. (D–F) Corresponding CEE cuts (blue) and Fe K-edge XAS spectra (red).
The Fe K-pre-edge XAS and CEE cuts (Figure 2D–F) give the electric quadrupole 1s → 3d transitions, but with a few percent Fe 4p character mixed into some of the 3d orbitals in these non-centrosymmetric complexes.28 This results in 1s → 4p electric dipole contributions to the pre-edge intensity, that is about a hundred times stronger than a pure quadrupole-allowed 1s → 3d transition.41 As a consequence, even a limited amount of 4p mixing can dominate the spectral shape of the Fe K-pre-edge.
The pre-edge of [Fe(III)(OH)(H3buea)]− (Figure 2D) has a single intense feature at 7113.5 eV that dominates the spectrum, with a total pre-edge intensity of 16.8 units. The pre-edge of [Fe(III)O(H3buea)]2− (Figure 2E) has a spectral shape with two intense features at 7112.9 and 7113.9 eV, with a tail to lower energy. It has a pre-edge intensity of 23.5 units. The pre-edge of [Fe(IV)O(H3buea)]− (Figure 2F) is dominated by an intense peak at 7113.6 eV with a low-energy shoulder at 7112.9 eV and a more pronounced high-energy shoulder at 7114.7 eV. These are better resolved in the CEE cuts of the RIXS planes (blue spectra in Figure 2D–F) than in the standard K-edge XAS spectra (red spectra). The pre-edge intensity for the Fe(IV)=O complex is significantly higher than for the ferric compounds with 38.2 units. Such high-intensity features in the pre-edges of all three compounds highlight the dominance of electric dipole intensity, even in the [Fe(III)(OH)(H3buea)]− compound that does not have a significant axial Fe-O distortion.
For an S = 5/2 high spin molecule in an Oh environment, 1s to 3d transitions result in 5T2g and 5Eg final states split in energy by 10 Dq28 (a d6 final state formalism is adopted here since the 1s core hole has a1g symmetry and interacts negligibly with the valence electrons, vide infra). Both final states have purely electric quadrupole character with a low total pre-edge intensity around 6 units.26,28 In the case of a trigonal bipyramidal high spin ferric D3h complex (Figure 1C), three final states can be reached: 5E’ (xy, x2-y2), 5E” (xz, yz) and 5A’1 (z2). However, in D3h symmetry, the local inversion symmetry is lost in the equatorial plane and the Fe 4px and 4py orbitals have E’ symmetry and are allowed to mix with the 3d(xy) and 3d(x2-y2) orbitals, denoted eσ. As shown previously,42 4p mixing into the 3d orbitals requires overlap of both of these metal 3d and 4p orbitals with the same ligand valence orbital. For D3h symmetry, this interaction is in the equatorial (x,y) plane as shown in Figure 3 (A and B) and can lead to significant 3d/4p mixing. Therefore, the transitions into the 3d(eσ) set can have significant electric dipole intensity. The 3d(xz) and 3d(yz) orbitals, denoted eπ, have e” symmetry in D3h geometry and the 3d(z2) orbital has a1 symmetry and thus do not mix with the Fe 4p orbitals that have e’ (px,y) and a”2 (pz) symmetry and the corresponding 1s → 3d transitions only have electric quadrupole intensity. Thus [Fe(III)(OH)(H3buea)]−, which has an effective D3h symmetry as the transaxial ligands have similarly weak bonding interactions with the iron center, exhibits a single intense feature in its pre-edge (the 1s to eσ transition) with an intensity of 16.8 units (Figure 2D), about 10 units higher than the total pre-edge intensity of centrosymmetric high spin ferric compounds.28 The peak at 7113.5 eV is thus assigned as the 1s → eσ transition with mostly dipole character (induced by the equatorial trigonal ligand field). Its high intensity precludes the observation of the quadrupole transitions into the 3d eπ and z2 orbitals.
Figure 3:
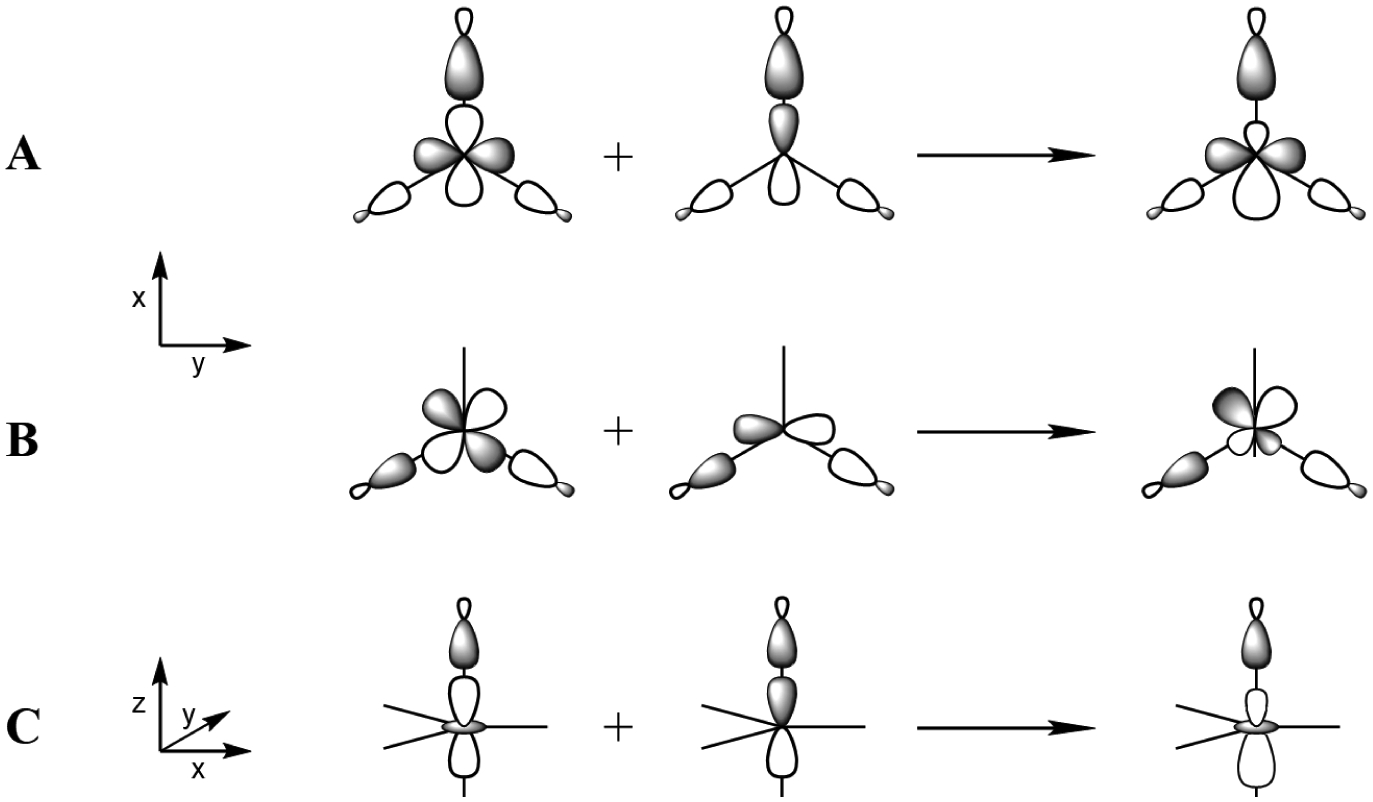
Schematics showing the 3d/4p mixing mechanism and the resultant metal-ligand 3d antibonding molecular orbital (on the right) for A) the metal 4px with the 3d(x2-y2), B) 4py with the 3d(xy) and C) 4pz with the 3d(z2) orbitals through the overlaps with the appropriate symmetry adapted linear combinations of ligand orbitals.
In going to [Fe(III)O(H3buea)]2−, the axial Fe-O bond is shorter than its transaxial counterpart (1.81 Å vs. 2.28 Å) and the molecule now has effective C3v symmetry. The inversion symmetry is now also lost in the axial direction and the 3d(z2) and 4pz orbitals now both have a1 symmetry. Since both orbitals have significant σ-overlap with the oxo ligand 2pz donor orbital (Figure 3C), they mix and the corresponding 1s → 3d(z2) transition gains electric dipole intensity. The eσ orbitals have e symmetry in C3v and still mix with the Fe 4px,y. However, the eπ orbitals now also have e symmetry and can also mix with the 4px,y orbitals. As previously investigated in the oxo-bridged tetragonal compounds Fe2-oxo-(HBpz3)2(μ-ac)2 and Fe2-oxo-hedta2,32 while allowed by group theory in C4v effective symmetry, the oxo-induced 4px,y mixing into the dπ-orbitals is small due to their poor π-overlap with the oxo 2px and 2py orbitals. This is also the case for [Fe(III)O(H3buea)]2−. For this complex, the pre-edge intensity now increases to 23.5 units with two main features contributing to the spectral shape (Figure 2E). These correspond to the two dipole-allowed 1s → 3d eσ and z2 transitions, with the 1s → 3d eπ transition remaining a weak, mostly quadrupole transition, contributing much less to the pre-edge.
Finally, in going to the S=2 [Fe(IV)O(H3buea)]− compound which also has C3v symmetry, the z2 α orbital is now also unoccupied. The 1s → z2 α transition occurs at a lower energy than the 1s → z2 β transition, because its exchange interaction with the four other α 3d electrons stabilize this excited state. The Fe-O bond is also shorter than in [Fe(III)O(H3buea)]2− (1.68 Å vs. 1.81 Å), therefore the amount of 4p character mixed into the z2 α and β orbitals and the total dipole intensity is higher. Thus, there are now formally two z2 α and β transitions split by the energy difference of their exchange interactions. The equatorial trigonal ligand field still leads to 4px,y mixing in the 3d(eσ) orbitals. The total pre-edge intensity increases to 38.2 and the pre-edge shape (Figure 2F) consists of three intense features at 7112.9, 7113.6 and 7114.7 eV, corresponding to the dipole-allowed transitions into the 3d eσ, z2 α and β orbitals. Specific assignments of the three peaks in (Figure 2F) are evaluated below.
2.1.2. DFT calculations
DFT calculations were performed to describe the ground state of the three model complexes. The results of the calculations are given in Figure 4 for [Fe(IV)O(H3buea)]− and Figure S2 of the Supporting Material for [Fe(III)O(H3buea)]2− and [Fe(III)(OH)(H3buea)]−. Note that the fully unoccupied β-manifold reasonably reflects the ligand field splitting of the Fe 3d orbitals without significant differences in spin polarization, while the partial occupation of the α-manifold results in its spin polarization.
Figure 4:

A) Energy diagram of the unoccupied valence orbitals of [Fe(IV)O(H3buea)]−. The energy axis is shifted to set the lowest eπ β orbital to zero. B) Isosurface plots of the five 3d orbitals in the β-manifold of [Fe(IV)O(H3buea)]−. C) Löwdin population analysis of the unoccupied 3d orbitals of [Fe(IV)O(H3buea)]−. The C3v averaged amount of Fe d-character is given for each orbital set.
From the energy diagram of the trigonal bipyramidal [Fe(IV)O(H3buea)]− complex in Figure 4A, there is a small energy gap of 0.68 eV between the eπ and eσ orbitals, and a larger gap of 1.11 eV between the eσ and the z2 in the β-manifold. Note that the two sets of e-orbitals mix and thus are tilted as described in more detail in Figure S3. We use here the eπ and eσ notation for the orbital set with the most eπ and eσ character, respectively. From the isosurface plots, the eπ orbitals (Figure 4B, bottom) are mostly localized on the iron and oxygen atoms and form the axial π-bond. The eσ orbitals (Figure 4B, middle) reflect the interactions of the iron atom with the equatorial ligands, but the angles between the nitrogen atoms being close to 120° limits the σ-overlap of the 3d(eσ) orbitals with all three atoms. The equatorial ligand field is therefore relatively weak resulting in the small energy gap between eπ and eσ levels, and thus the high spin S=2 ground state. The similar energies of the e sets is also reflected in their similar calculated covalencies (65% vs. 67% Fe 3d character, Figure 4C). Finally, the 3d(z2) β orbital (Figure 4B, top) is strongly σ-interacting mostly with the axial ligands, with 57% Fe 3d character (Figure 4C). For the Fe(IV)=O, the z2 α orbital is the LUMO because of the strong spin polarization (Figure 4A). It has increased covalent mixing with the ligands and thus less Fe 3d character (43%).
Correlating from [Fe(IV)O(H3buea)]− to [Fe(III)O(H3buea)]2− and [Fe(III)(OH)(H3buea)]−, the energies of the eσ and z2 orbitals decrease relative to the eπ and the d-character of each orbital set increases (Figure S2), consistent with the ferric compounds being less covalent, with the Fe-O π- and σ-bonds becoming significantly weaker. These changes reflect the bond length changes in their crystal structures, where the average equatorial bond lengths increase from 1.98 Å to 2.06 Å and 2.02 Å, and the axial Fe-O bond length from 1.68 Å to 1.81 Å and 1.93 Å across the series: Fe(IV)=O to Fe(III)-O to Fe(III)-OH.22,33,34
2.1.3. Time-Dependent Density Functional Theory (TDDFT)
The Fe K-pre-edge XAS for the three compounds were calculated using TDDFT26,43 and the simulated spectra are plotted in Figure 5, along with the corresponding experimental CEE spectra. The vertical stick heights in Figure 5 correspond to the intensities of the transitions (quadrupole plus dipole). The TDDFT-calculated total intensity (scaled to the experimental intensity) increases from 21.4 to 26.2 to 38.2 units through the series, consistent with the experimental trend (16.8 to 23.5 to 38.2). The spectral shapes are reasonably well reproduced and analyzed below, along with the assignments for the TDDFT-simulated spectra.
Figure 5:

TDDFT simulated spectra (in grey) of A) [Fe(III)(OH)(H3buea)]−, B) [Fe(III)O(H3buea)]2– and C) [Fe(IV)O(H3buea)]−, each plotted with the corresponding experimental CEE (in black). The transitions are indicated by colored vertical lines: eπ in red, eσ in green and z2 in blue. The intensity of the simulations was scaled to the experimental intensity and their energy was shifted. D) Comparison of the experimental and TDDFT simulated intensities of the model complexes. The intensity of [Fe(IV)O(H3buea)]− is used as a reference to scale the calculated intensities.
The TDDFT-simulated spectrum of [Fe(III)(OH)(H3buea)]− (Figure 5A) has an intense peak as also observed in the experimental pre-edge data in Figure 5A, corresponding to the 1s transitions into the 3d(eσ) orbitals, consistent with the non-centrosymmetric trigonal equatorial ligand field (Figure 3A and B). The transitions into the eπ and z2 orbitals have mostly quadrupole character and thus are weak and produce the low and high energy tails, respectively, of the pre-edge spectrum.
The simulated spectrum of [Fe(III)O(H3buea)]2− (Figure 5B) has two intense features similar to the experimental spectrum. The 1s → 3d(z2) transition is at high energy and has high dipole intensity (shown as blue sticks). Two strong dipole-allowed transitions into a first set of e orbitals are calculated at 1.9 eV lower energy at 7111.9 eV (in green) with the transitions into the second set of e-orbitals having low intensity at 0.8 eV higher energy at 7112.7 eV (in red). Correlating to the CEE, the high energy e transitions at 7112.9 eV experimentally have more dipole character. Thus the TDDFT calculation overestimates the electronic relaxation due to the core 1s hole. The effect of electronic relaxation on the e levels can be observed from the comparison of the ground state MOs with the Natural Transition Orbitals (NTOs44 which provide a chemically-intuitive picture of the orbitals involved in the transitions) (Figure S4). This electronic relaxation shifts the dipole character into the lowest energy e peak, while experimentally there is more intensity in the higher e energy peak in Figure 5B.
In the simulated spectrum of [Fe(IV)O(H3buea)]− (Figure 5C), significant dipole intensity is found for all transitions into the six unoccupied acceptor Fe 3d orbitals, one α and five β transitions (Figure 4A). The visualizations of the NTOs (plotted in Figure S5) show that the four first transitions are into the eπ and at 0.7 eV higher energy the eσ orbitals and have similar dipole intensity, and the two higher energy transitions are into the z2 α and β orbitals with the z2 α overlapping the eσ set. As mentioned earlier, in the ground state, the two e orbital sets are slightly tilted. In the NTOs (Figure S6) these are even more tilted, indicating further electronic relaxation in the final state. This mixing distributes the dipole character over both e sets. The transitions into the z2 α and β orbitals are calculated by TDDFT to be split by 0.97 eV, reflecting the magnitude of their exchange interactions with the unpaired electrons. This is also functional-dependent, with lower amounts of Hartree-Fock exchange resulting in larger energy splittings of the z2 α and β transitions (Table S3).
Thus the transitions corresponding to the 1s → eσ excitations have significant electric dipole character for all three complexes, which reflects the mixing of the 4px and 4py with the 3d(xy) and 3d(x2-y2) orbitals, due to the trigonal equatorial symmetry enforced by the tripodal ligand as described above (Figure 3A and B). In the case of [Fe(IV)O(H3buea)]−, this 4px,y dipole character is strongly mixed over the two e sets. Moreover, the 1s → z2 transitions of [Fe(III)O(H3buea)]2− and [Fe(IV)O(H3buea)]− gain electric dipole intensity in C3v, due to the shorter Fe-O axial bond lengths that mix Fe 4pz character into the 3d(z2) orbitals (Figure 3C). Thus, for [Fe(IV)O(H3buea)]−, the TDDFT simulation (Figure 5C) agrees reasonably well with the experimental spectral shape. It assigns the three features as transitions into the eπ at lowest energy, at higher energy a main peak consisting of transitions into the eσ and z2 α orbitals, and the transition into the z2 β at the highest energy. However, a multiplet analysis of this spectrum is presented below that gives a different assignment of the three peaks in the Fe K-pre-edge of the [Fe(IV)O(H3buea)]− complex.
2.1.4. Multiplet analysis of the Fe K-pre-edge of [Fe(IV)O(H3buea)]−
Multiplet calculations were performed for [Fe(IV)O(H3buea)]− in C3v symmetry using Quanty.45,46 Using the β-orbital energy splittings from the ground state DFT simulations presented above (Figure 4A), the energies of the 3d5 states for a trigonal complex, corresponding to the final states of the 1s → 3d transitions, were calculated with a systematic increase of the Slater integrals to allow for increasing electron-electron repulsion (Figure 6). The states reachable by a one-electron 1s → 3d transition from the eσ2eπ2 ground state for a trigonal S=2 Fe(IV)=O complex are highlighted in red for Eπ, green for Eσ and blue for A1 states. Additional excited configurations (eπ4eσ1, eπ1eσ4, eπ4a11, eπ3eσ1a11 and eπ1eσ3a11 in increasing energy order), shown in thiner grey lines, would be reached by two-electron excitations from the ground state and have negligible intensity in the Fe K-pre-edge. With no electron-electron repulsion (0% in Figure 6), the energy splittings between the three states in red, green and blue correspond to the β-orbital energy diagram in Figure 4A. When the electron-electron repulsion is included, the configurations increasingly split into many-electron final states. The increase in the Slater integrals corresponds to a decrease in the nephelauxetic reduction of electron repulsion (i.e. less covalency). Most notably, the eπ2eσ2a11 configuration splits into the 6A1 and 4A1 states. While the theoretical intensity ratio between the sextet and quartet states is 1.5 due to their difference in spin multiplicity, this ratio decreases with increasing multiplet interactions with other states. Multiplet interactions also further split the 4A1 state. The 4A1 are the highest energy states at all scaling values of the Slater integrals.
Figure 6:
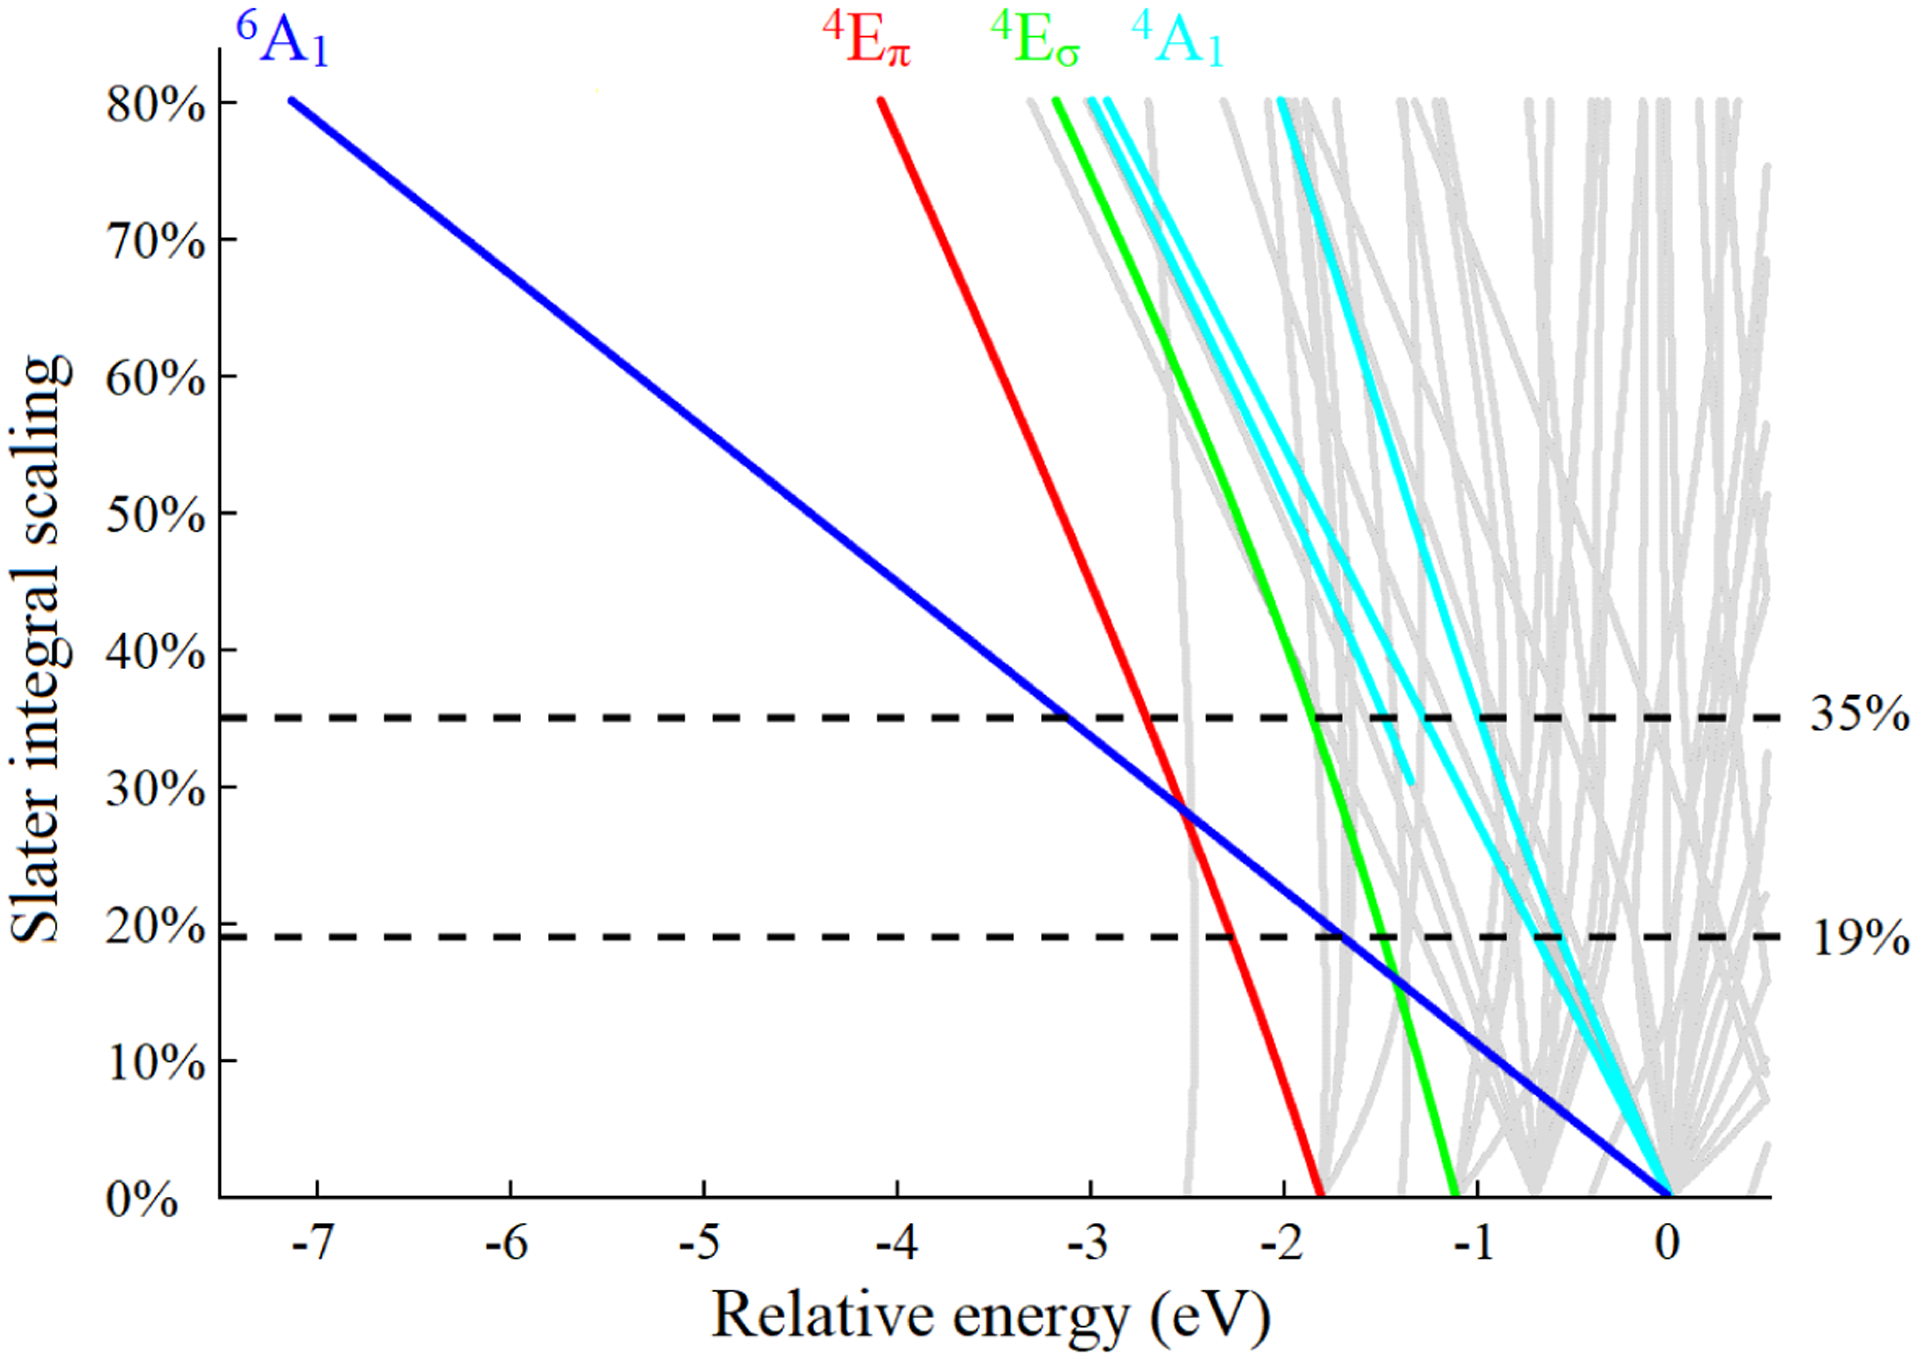
Energy diagram of the 3d5 final states of a trigonal S=2 Fe(IV)=O complex calculated as a function of the scaling of Hartree Fock Slater integrals from 0 (no electron repulsion) to 80%, using the DFT-calculated β-orbital energy splittings as input parameters. The Eπ states reachable by a 1s → 3d transition are highlighted in red, Eσ in green and A1 in blue. The grey lines are additional states that can only be reached by two-electron transitions from the ground state of the eπ2eσ2 configuration. The horizontal black lines indicate the scaling of the Slater integrals required to obtain a 1.8 and 1.1 eV splitting of the A1 states.
The experimental CEE for [Fe(IV)O(H3buea)]− (Figure 2F) shows three peaks at 7112.9, 7113.6 and 7114.7 eV. The highest energy peak corresponds to these 4A1 states (transition into the z2 β). The splitting of the sextet and quartet A1 states can therefore be either 1.1 or 1.8 eV depending on whether the 6A1 states correspond to the 7113.6 or 7112.9 eV feature in the experimental CEE spectrum in Figure 2F. From Figure 6, the first assignment corresponds to a Slater integral scaled down to approximately 19% of its free ion value, and gives a similar assignment to the TDDFT calculations. Alternatively the assignment of the 6A1 states as the lowest energy peak of the pre-edge corresponds to a Slater integral scaling of about 35%. In our previous study of the S=2 square pyramidal Fe(IV)=O α-O site in zeolites, we observed two intense peaks split by 1.6 eV,47 that we can now assign as the transitions into the z2 α and β orbitals of the tetragonal S=2 site. This splitting is close to the 1.8 eV splitting obtained for a 35% Slater integral scaling. The decrease in Slater integral scaling down to 35% is also consistent with the nephelauxetic decrease in electron-electron repulsion observed upon oxidation from Mn(II) to Mn(III) to Mn(IV). 19% is unreasonably low: multiplet simulations with such a low Slater integral scaling result in a low spin ground state (eπ4eσ0 configuration) instead of the high spin ground state observed experimentally (more detailed comments on the Slater integral scaling are presented in the Supporting Information). Thus we can assign the peak at 7112.9 eV as the transition into the z2 α orbital and the peak at 7114.7 eV as the transition into the z2 β orbital.
The low- and high-energy peaks, at 7112.9 and 7114.7 eV respectively, corresponding qualitatively mostly to the A1 states, were subtracted from the experimental CEE spectrum (Figure S7) to obtain an estimate of the remaining combined dipole contribution from the Eπ and Eσ states. This subtraction produces an intense symmetric feature at 7113.6 eV, indicating that either the two sets of E states are at approximately the same energy or that the dipole intensity of the lower energy Eπ states is negligibly low compared with the Eσ states. The multiplet simulations of the Fe L-edge XAS spectrum presented in section 2.2 below locks the energy position of the Eπ at 0.95 eV below the Eσ states. This requires that the intensity of the transitions into the eπ is not significant relative to the transitions into the eσ, z2 α and z2 β, consistent with a low dipole character arising from the negligible 4px,y mixing into the eπ orbitals.
Using the above constraints, a good fit of the experimental CEE was obtained from the multiplet simulation and is plotted in Figure 7. Both the electric quadrupole (very small) and dipole contributions to the intensity are included in this simulation and the total intensity is scaled to the experimental spectrum. The main feature in the middle of the pre-edge (shown in green) corresponds mostly to 4Eσ states. The low-energy shoulder has mostly 6A1 contribution (blue), with weak 4Eπ (red) and 4Eσ (green) contributions due to the mixing of those states. The high-energy feature has mostly 4A1 contribution.
Figure 7:
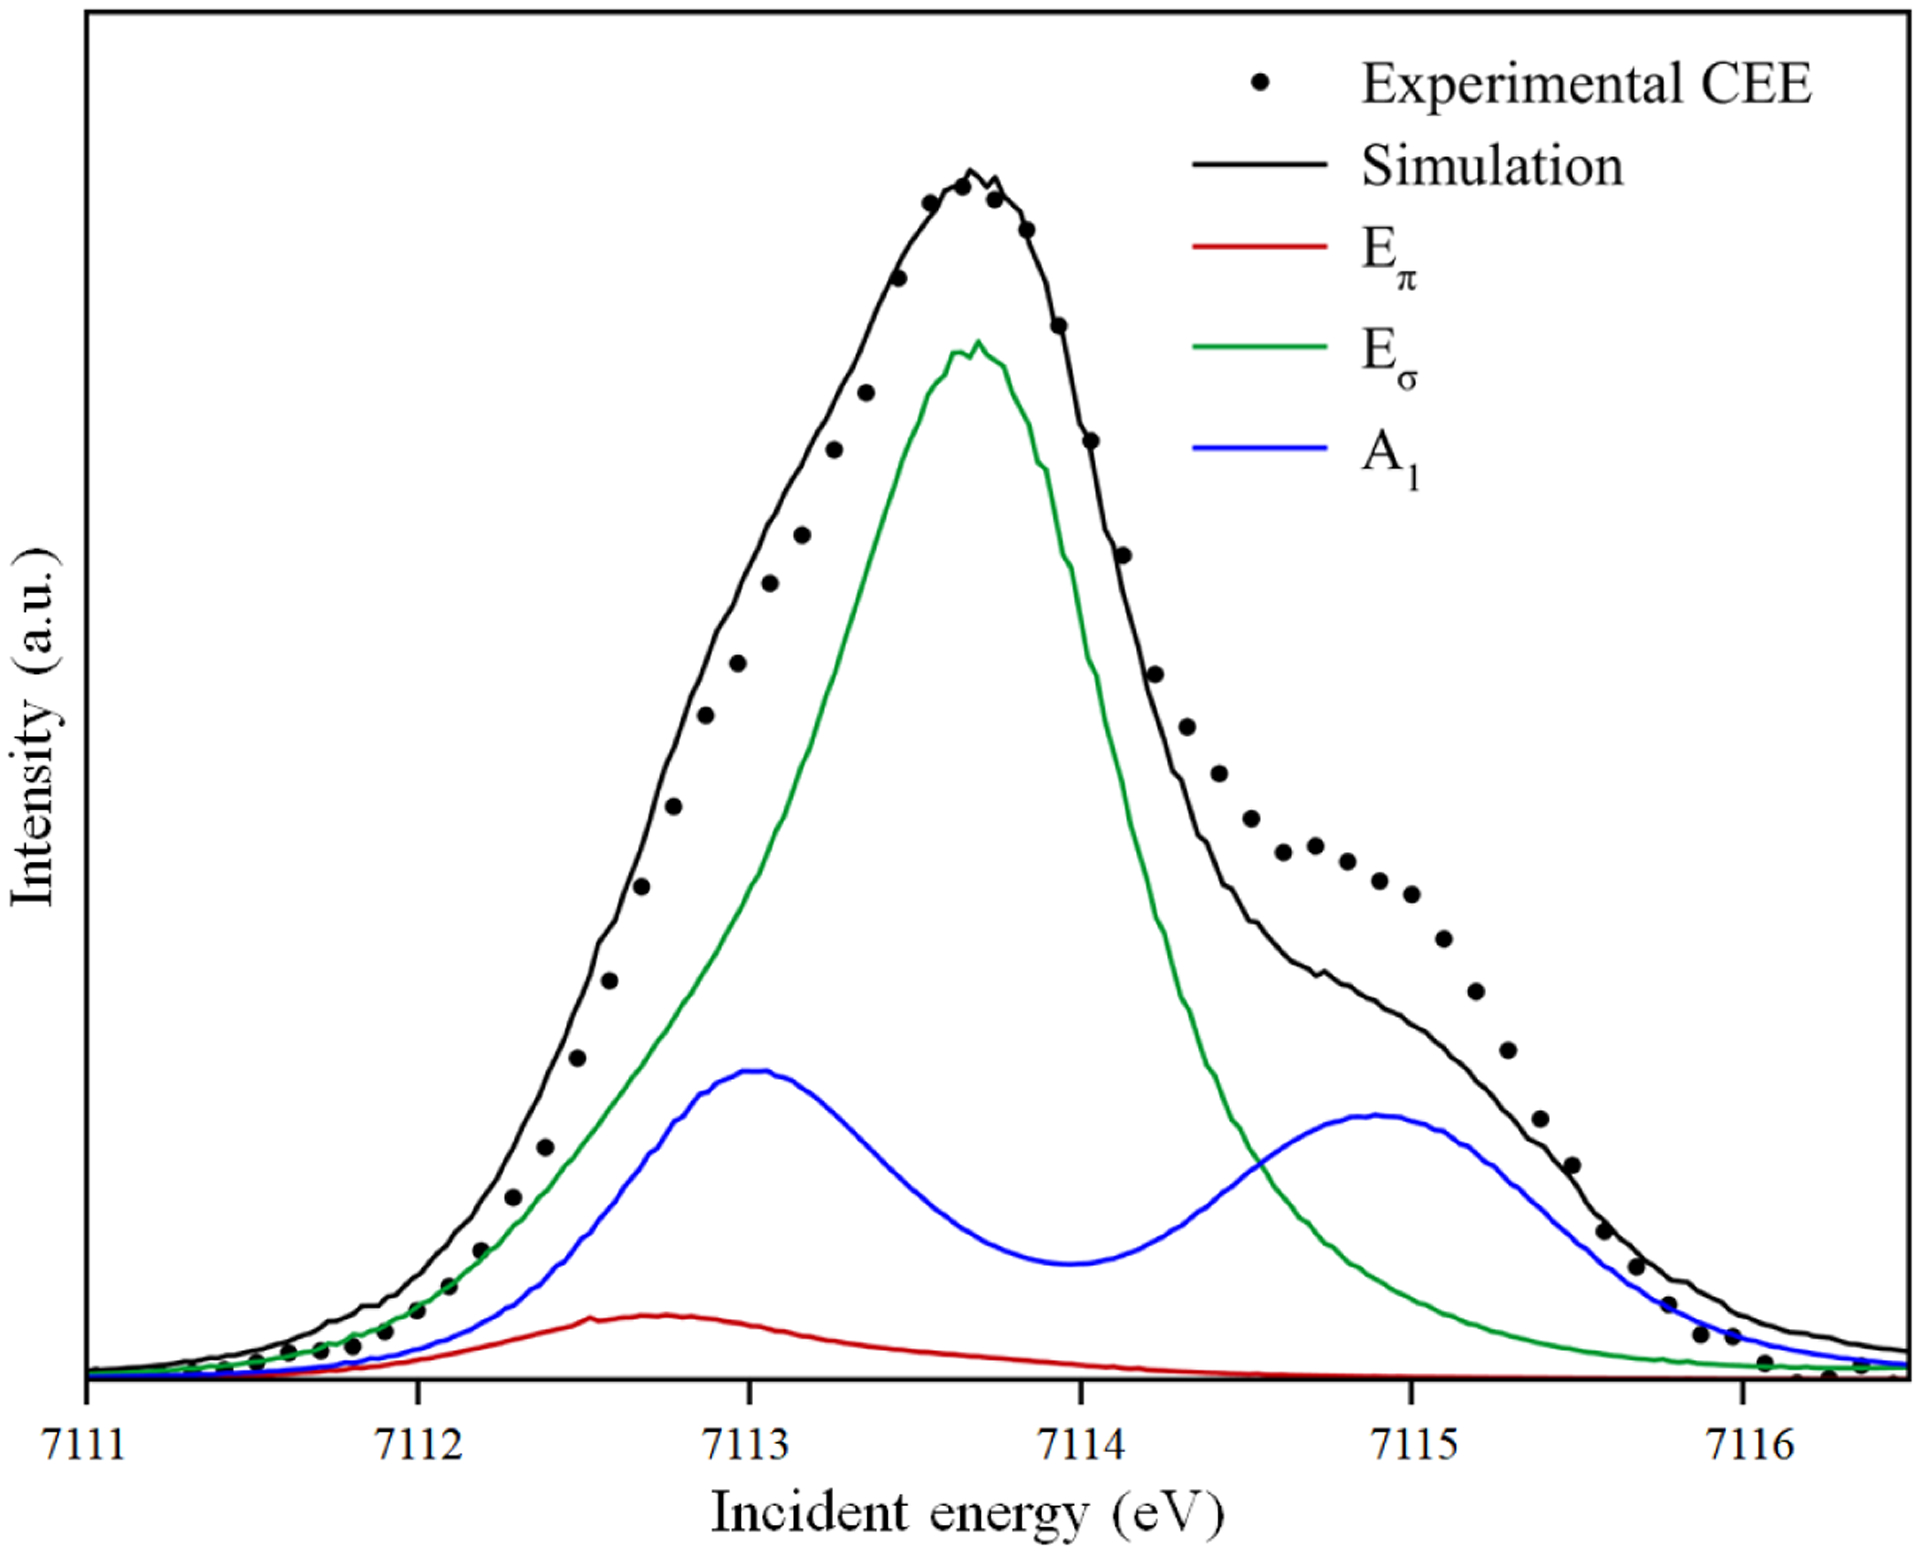
Multiplet-derived analysis of the CEE of [Fe(IV)O(H3buea)]− using the atomic multiplet parameters in Table S1. Contributions from Eπ states are in red, Eσ in green and A1 in blue. See Supporting Information for details.
2.1.5. TDDFT vs. multiplet assignment of the Fe K-pre-edge XAS of [Fe(IV)O(H3buea)]−
As developed in the two previous sections, the TDDFT calculations and the multiplet simulations of the Fe K-pre-edge of [Fe(IV)O(H3buea)]− lead to two different assignments of its three-peak CEE spectral shape in Figure 2F. The TDDFT simulation in Figure 5C indicates a 1.1 eV-splitting of the 4pz-mixed 1s → z2 α and β transitions, with one set of 4px,y-mixed 1s → e transitions on the lower energy side of the z2 α transition and the other set of 1s → e transitions overlapping the 1s → z2 α transition. Alternatively, the multiplet simulation gives a 1.8 eV-splitting of the transitions into the z2 α and β with the dipole-mixed 1s → eσ transitions in between and the 1s → eπ transition at lower energy with little intensity (Figure 7). We explained in the previous section that the latter case with a Slater integral scaling around 35% is reasonable for Fe(IV) while 19% is not. These results indicate that the TDDFT calculations of the 1s → 3d transitions significantly underestimate the z2 α/β exchange splitting.
The TDDFT simulation of the O K-edge XAS spectrum in section 2.3 below using the same B3LYP functional gives a splitting of the 1s(O) → z2 α and β transitions of 1.89 eV vs. 0.97 eV for the Fe K-edge. This difference reflects the different interaction of the valence electrons with the 1s(O) core hole in the final state instead of a 1s(Fe) core hole for the Fe K-edge XAS calculations. As for the O K-edge XAS the z2 α and β accepting orbitals are mostly localized on the Fe atom and the 1s(O) core hole is on the separate oxo atom, the exchange interactions of the valence electrons with the core are very small. Therefore, the smaller α/β splitting from the Fe K-edge XAS calculations indicates that the exchange interaction of the 1s(Fe) core hole with the valence 3d orbitals is overestimated by DFT, and this decreases the α/β splitting energy. For the Fe pre-edge (Figure 8A), the transition into the z2 α orbital is destabilized by the interaction of the valence α-electrons with the core 1s(Fe) β-electron, while the transition into the z2 β orbital is stabilized by interaction of the valence α-electrons with the core 1s(Fe) α-electron. This core/valence interaction opposes the valence/valence stabilization of the 3d(z2) α state by exchange interaction with the α 3d electrons compared with the 3d(z2) β state, and leads to the calculated decrease in the α/β splitting. For the O K-pre-edge (Figure 8B), the interaction of the valence electrons on the Fe atom with the 1s(O) core hole is negligible and the magnitude of the exchange splitting is not impacted.
Figure 8:

Schematics of the exchange interactions between electrons for 1s → 3d α and β transitions at the S=2 Fe(IV)=O center for A) Fe K-edge XAS and B) O K-edge XAS. The green arrows indicate stabilizing interactions while the red arrows indicate destabilizing interactions. The interactions with the 1s(O) core hole are negligibly small.
The core-valence exchange is governed by the Slater integral G2(1s,3d). To evaluate the effect of G2(1s,3d) on the splitting of the 1s → z2 α and β transitions, multiplet simulations on the S=2 Fe(IV) complex were performed with all parameters fixed to the atomic multiplet value in Table S1 but with G2(1s,3d) varied. As seen in Figure S8, a value around 1.0 eV for G2(1s,3d) would be required to decrease the splitting of the 6A1 and 4A1 states to 1.1 eV as observed in TDDFT, much higher than the Hartree-Fock calculated value of 0.073 eV. Hard X-ray photoemission spectroscopic (HAXPES) data on Fe 1s ionization on iron oxides have been reported and no exchange splitting of the main line or the satellite peaks was observed,48 indicating that the value of G2(1s,3d) cannot be as high as 1 eV.
2.2. Fe L-edge XAS and CIEs of [Fe(IV)O(H3buea)]−
In an Fe L-edge XAS experiment, the incident photon excites an Fe 2p electron into unoccupied Fe 3d valence orbitals via electric dipole-allowed 2p → 3d transitions. While the Fe K-edge XAS spectrum of [Fe(IV)O(H3buea)]− is dominated by the transitions into the 4p-mixed Fe 3d orbitals, Fe L-edge XAS is not sensitive to 4p mixing and thus directly probes the Fe 3d character of all valence final states. Specifically for the C3v-symmetric [Fe(IV)O(H3buea)]− compound of focus in this study, Fe L-edge XAS provides a direct probe of all 3d states, including those involving transitions into the eπ orbitals which have negligible intensity in the Fe K-edge XAS spectrum.
The background-subtracted Fe L-edge XAS spectrum of [Fe(IV)O(H3buea)]− is shown in Figure 9 and the Fe L-edge XAS spectra of [Fe(III)O(H3buea)]2− and [Fe(III)(OH)(H3buea)]− are shown in the Supporting information (Figure S9). The Fe L-edge XAS spectrum of the [Fe(IV)O(H3buea)]− complex shows several characteristic features. The main feature of the L3-edge at 708.5 eV has a flat top with a low-energy shoulder at 707 eV and a high-energy tail.
Figure 9:

Background-subtracted Fe L-edge XAS spectrum of [Fe(IV)O(H3buea)]− (blue) and multiplet simulation of the spectrum (red) using the atomic multiplet parameters in Table S1.
Multiplet calculations were performed to simulate the Fe L-edge XAS of [Fe(IV)O(H3buea)]−. Most of the atomic and ligand field parameters including the scaling of the Slater integrals and the energies of the Fe 3d z2 and eσ orbitals were constrained by the Fe K-edge XAS spectrum (as presented in section 2.1.4). Only the energy of the eπ orbitals (Figure S10) and the linewidth were adjusted to obtain a good fit to the Fe L-edge XAS (Figure 9). Importantly, the multiplet simulations of the Fe L-edge XAS spectrum locks in the 3d eπ orbital energy at 0.68 eV below the eσ orbital energy in order to reproduce the low-energy side of the L3-edge (Figure S10). This splitting is consistent with the DFT-calculated ground state energy diagram in Figure 4A and determined the energy positions of the 1s → eπ transitions that were used to assign the Fe K-edge XAS spectrum (Figure 7, red).
While the orbital contributions to the L-edge spectrum are distributed over a wide energy range due to 2p/3d spin-exchange, the components of the transition dipole operator matrix in the ligand field basis (Gij, i, j=eπ, eσ, z2) indicate the contribution of each orbital to the Fe L-edge XAS spectrum (Figure 10). The diagonal terms Gii indicate the dominant contributions while the off-diagonal terms Gij (i≠j) give the intensity redistribution due to the exchange. Consistent with Figure S10, the low-energy shoulder of the L3-edge has mostly Eπ-character governed by the Gππ component (purple vertical dashed lines in Figure 10). The Gσσ (light green vertical dashes) contributes at higher energy in the main peak and the Gz2z2 (dark red vertical dashes) is spread over the whole L3-edge, consistent with the large exchange splitting of the sextet and quartet states. A multiplet simulation and Gij decomposition of the Fe L-edge XAS spectrum including DOC35–37 is shown in Figure S11; no significant change is observed in comparison with the atomic multiplet simulation presented here.
Figure 10:

Correlation of the Gij components of the calculated transition dipole tensor with the experimental Fe L-edge XAS spectrum (top). The σ subscript indicates the eσ orbitals and the π subscript indicates the eπ orbitals. The vertical dashed lines indicate the maxima of the Gii (purple for Gππ, light green for Gσσ and dark red for Gz2z2.
This assignment of the Fe L-edge XAS spectrum enables further insight into the Fe K-edge XAS and 1s2p RIXS. CIE cuts of the RIXS plane are L-edge like spectra where the choice of the incident energy allows the enhancement of the corresponding L-edge final states, but while the Fe L-edge XAS spectrum reflects all the dipole-allowed 2p → 3d transitions, the CIEs are biased by the 4p-mixing into the 3d orbitals they probe. The CIE cuts in Figure 11C are at incident energies of 7112.5, 7113.5 and 7115.0 eV, corresponding mostly to the enhancement of 6A1 (and 4Eσ due to band overlap), 4Eσ and 4A1 final states, respectively, as determined in section 2.1.4. The 4Eπ states that make significant contributions to the Fe L-edge XAS spectrum (Gππ in Figure 10) are not probed by 1s2p RIXS since they have no significant 4p-mixing and therefore their contribution to the CIE cuts in Figure 11A and C is negligible. Indeed, none of the CIEs through the three intense features of the CEE at 7112.5, 7113.5 and 7115.0 eV show intensity in the low-energy shoulder at 706.8 eV where the 4Eπ states appear in the Fe L-edge XAS spectrum (Gππ in Figure 10). This couples the assignments of both the Fe K-edge and L-edge XAS spectra. A detailed description of the CIEs and their simulations is found in Figure S12.
Figure 11:

A) Experimental 1s2p RIXS plane of [Fe(IV)O(H3buea)]− with the CEE shown in the bottom. The three vertical lines indicate the position of the three CIE cuts at 7112.5 eV (blue), 7113.5 eV (red) and 7115.0 eV (yellow). B) Corresponding multiplet-simulated RIXS plane and CIEs. C) Overlap of the experimental Fe L-edge XAS spectrum (black) with the CIE cuts from Figure 11A. D) Corresponding multiplet-simulated Fe L-edge XAS spectrum and CIE cuts Figure 11B.
2.3. Oxygen K-edge XAS
While the Fe K-edge, L-edge XAS and 1s2p RIXS allow the quantification of the Fe 3d character in the valence orbitals, the reactivity of Fe(IV)=O sites is dictated by the oxo character in the dπ and dσ orbitals. In an O K-edge XAS experiment, the incident photon excites an O 1s electron into the unoccupied valence 3d orbitals. The 1s is localized on the oxygen atom and the 1s → 2p transition is electric dipole allowed, thus the transition intensity reflects the O 2p character in the 3d acceptor orbitals, i.e. their oxo covalencies. The [Fe(IV)O(H3buea)]−, [Fe(III)O(H3buea)]2− and [Fe(III)(OH)(H3buea)]− compounds have four O atoms (one is the axial oxo/hydroxide ligand and three are on the [H3buea]3− ligand as shown in Figure 1B). Thus the O K-edge XAS spectra have contributions from transitions involving the 1s orbitals of all four O atoms. The spectra of [Fe(IV)O(H3buea)]−, [Fe(III)O(H3buea)]2− and [Fe(III)(OH)(H3buea)]− are shown on Figure 12A.
Figure 12:

A) O K-edge XAS spectra of [Fe(IV)O(H3buea)]− (black), [Fe(III)O(H3buea)]2− (pink) and [Fe(III)(OH)(H3buea)]− (blue). The inset shows the background subtracted pre-edge of [Fe(IV)O(H3buea)]− (black) and its decomposition into the transitions into the eπ in red and into the z2 α and β in blue (assuming transitions into the z2 α and β have the same intensity). B) TDDFT simulated O K-edge XAS spectrum of [Fe(IV)O(H3buea)]−. The transitions indicated in grey involve ligand urea O atoms (used for energy calibration). The inset gives the comparison of the DFT-calculated O character of individual Fe 3d orbitals of [Fe(IV)O(H3buea)]− in the ground state with the experimental intensity corresponding to the two observed features, and their TDDFT-calculated intensities.
All three compounds have intense features at 532 eV with similar intensities. These features can be assigned as the transitions from the three ligand O 1s orbitals into the π*C=O of the urea moieties of [H3buea]3−. The intensity variation of these features in Figure 12A is mostly due to the perturbation of the C=O bond of the urea moieties upon changes in the H-bond between the N-H part of the urea groups and the axial O ligand: the significantly more basic ferric oxo compound has a stronger H-bond, which polarizes the urea, increasing the coefficient of the nitrogen atom and decreasing the oxygen character in the π*C=O relative to the two other compounds. At lower energies are the pre-edge transitions into the Fe 3d orbitals, originating from the axial oxo/hydroxo ligand O 1s orbital, since only this oxygen atom has orbital overlap and thus covalent mixing with the Fe 3d orbitals. After background subtraction of the contribution of the transitions into the π*C=O and higher energy transitions, the pre-edges of the three complexes are plotted in Figure S13. The pre-edges of the two ferric compounds start at approximatly the same energy, around 529.5 eV, with the pre-edge of [Fe(III)(OH)(H3buea)]− (blue) being less intense than that of [Fe(III)O(H3buea)]2− (pink). Importantly, the pre-edge of [Fe(IV)O(H3buea)]− (black, inset in Figure 12) has a very intense low-energy feature at 527.0 eV and a weak feature at 529.5 eV.
Among the Fe 3d orbitals of the high spin ferric [Fe(III)O(H3buea)]2− and [Fe(III)(OH)(H3buea)]compounds, the acceptor orbitals having O character from the axial ligand are the oxo 3d π-antibonding eπ orbitals and the oxo σ-antibonding 3d z2 orbital of the β-manifold (Figure S2A). The eσ orbitals only interact with the equatorial component of the [H3buea]3− ligand and therefore have negligible axial O character. The lowest energy feature in the spectra of [Fe(III)O(H3buea)]2− and [Fe(III)(OH)(H3buea)]− at 529.5 eV in Figure S2A then corresponds to transitions into their lowest energy 3d(eπ) orbitals. Based on Figure S2A, the transition into the z2 orbital for both complexes should occur at about 1 eV higher in energy, and thus overlap the intense features of the ligand-based 1s →π*C=O transitions at 532 eV.
Upon oxidation to the [Fe(IV)O(H3buea)]− complex, the z2 α orbital is now unoccupied and all β-transitions shift to lower energy as the effective nuclear charge Zeff on the Fe atom has increased. From previous Cl K-pre-edge XAS measurements of model complexes, this shift to lower energy with one-electron oxidation is expected to be around 2 eV.39 Thus, the O 1s transitions into the eπ β orbitals should contribute to the intense 527 eV feature in Figure 12A. From the MO energy diagram in Figure 4A, the energy gap between the eπ β and the z2 β orbitals is around 2 eV. This leads to the assignment of the 529.5 eV feature to the O 1s transition into the 3d z2 β orbital (Figure 12A). Due to the 2 eV-splitting of the z2 α and β transitions (see above), the O 1s transition into the z2 α orbital is expected to overlap the low-energy eπ feature at 527 eV. This assignment of the [Fe(IV)O(H3buea)]− O K-edge XAS spectrum is consistent with the Löwdin population analysis of the ground state DFT calculations (Figure 12B, inset). The total calculated O character is 74% in the 527 eV feature (sum of eπ β and z2 α O character) and 14% for the 529.5 eV feature (z2 β O character), reasonably consistent with the intensity ratio of the 527 to 529.5 eV experimental features (5.3 for DFT-calculated vs. 4.8 for the experimental ratio). The z2 α transition should have a similar covalency and thus intensity to that of the experimentally resolved z2 β transition at 529.5 eV. The fact that the 527 eV feature has more than four times the intensity of the 529.5 eV feature indicates that the eπ β transitions make a major contribution to the intense feature at 527 eV of the experimental pre-edge. Using the intensity of the 529.5 eV z2 β transition to estimate the z2 α contribution to the 527 eV feature gives the π (red) and σ (blue) contributions shown in the inset of Figure 12A. This provides experimental evidence that each of the unoccupied eπ orbitals have high O character, about twice that of the 3d(z2) orbitals, giving a direct probe into this key contribution to the reactivity of Fe(IV)=O compounds (see Discussion). This is consistent with a previous electron paramagnetic resonance study on 17O-labeled [Fe(IV)O(H3buea)]− determining a significant spin density of 0.56 in the O p-orbitals which reflects the O character in the occupied eπ orbitals.49 This enables the calibration of the intensity of the pre-edge in O K-edge XAS with 1.24% O character per unit of O K-pre-edge intensity.
The O K-pre-edge XAS spectrum of [Fe(IV)O(H3buea)]− was simulated with TDDFT calculations using the B3LYP functional as shown in Figure 12B. Two O 1s → 3d features are calculated at 527.8 and 530.1 eV, lower in energy than calculated for the strong feature corresponding to the ligand-based O 1s →π*C=O transitions at 532 eV (used as a reference energy for the TDDFT calculations). Consistent with the above experimental assignment, the intense lowest energy feature at 527.8 eV consists of the overlapping transitions into the eπ β and z2 α orbitals, while the high energy pre-edge feature at 530.1 eV corresponds to the transition into the z2 β orbital. The intensity ratio of the two simulated features is 4.0 while the experimental value is 4.8. While the splitting of the 1s → z2 α and β transitions was calculated to be 0.97 eV in the TDDFT-simulated Fe K-pre-edge, it is 1.88 eV in the TDDFT-simulated O K-pre-edge, much closer to the multiplet-calculated 1s-3d exchange splitting in section 2.1.4.
The O K-edge XAS, therefore, supports the Fe 1s → 3d K-pre-edge assignments based on the multiplet calculations, with the transitions into the eπ β and z2 α orbitals close in energy but with the eπ orbitals having twice the oxo character of the z2 orbitals, and with the z2 α/β splitting close to 2 eV. The latter reflects the fact that in ligand K-edge XAS the 1s core hole is localized on the oxo ligand and thus has negligible exchange coupling with the 3d valence electrons that are mostly localized on the Fe center.
3. Discussion
While the 1s → 3d transitions observed in metal K-edge XAS are quadrupole allowed and give rise to only weak pre-edge absorption spectral features, the loss of inversion symmetry allows the mixing of some Fe 4p character into the 3d orbitals, leading to intense pre-edge transitions with 1s → 4p dipole character.28 The distortion of an octahedron to an approximate C4v geometry upon shortening one axial ligand bond is important in (bio)inorganic chemistry and a detailed study of this case was recently published.32 This effective C4v distortion gives rise to selective 4pz-mixing into the 3d(z2) orbital leading to a strong 1s → 3d(z2)/4pz dipole-allowed transition. While the 4px,y-mixing into the 3d(xz,yz) orbitals is allowed by group theory, the magnitude of this mixing is negligible because of the limited π-overlap of the 4px,y orbitals with the axial oxo ligand π-orbitals that enables this 3d/4p mixing.
The present study shows that other non-centrosymmetric distortions can also allow and result in significant 4p-mixing, as is the case for the trigonal iron centers studied here. Compared with the 1s → 3d spectrum of an octahedral high spin ferric compound, the spectrum of the approximate D3h [Fe(III)(OH)(H3buea)]− that does not have a short axial Fe-O bond still gains significant intensity through 4px,y mixing into the 3d(xy,x2-y2) orbitals as both sets of orbitals have significant σ-overlap with the equatorial tripod ligand (Figure 3A and B). The C3v-symmetric [Fe(III)O(H3buea)]2− and [Fe(IV)O(H3buea)]− compounds thus have mixing of both the 4px,y with the 3d(xy,x2-y2) set and the 4pz with the 3d(z2) orbitals as the axial Fe(III)-O and Fe(IV)=O bonds are short and eliminate the inversion symmetry along the z-axis. As in the six-coordinate case, the 4px,y do not mix significantly with the 3d(xz,yz) orbitals as they have little π-overlap with the axial oxo ligand. Thus for both C3v complexes, the 3d(z2) and 3d(xy,x2-y2) have 4p-mixed character. However, the S=2 [Fe(IV)O(H3buea)]− complex spectrum shows three pre-edge transitions due to the additional presence of the 1.8 eV splitting of the z2 α and β orbitals that derives from their difference in exchange interactions with the 3d valence orbital electrons. The 1s transitions into the eσ set energetically located in between the α/β z2 transitions (Figure 7). This assignment is derived from multiplet simulations and highlights an issue with TDDFT calculations, commonly used for the analysis of Fe K-edge XAS pre-edges,26 to properly simulate the large exchange splitting of the z2 α and β transitions in a high spin S=2 Fe(IV) system. Multiplet simulations fit the spectral shapes of Fe K-edge and L-edge XAS and 1s2p RIXS, with parameters consistent with ground state DFT simulations of [Fe(IV)O(H3buea)]−, showing highly covalent σ and π Fe(IV)-oxo bonds.
O K-edge XAS provides complementary insight by specifically probing the O 2p character in the metal valence orbitals. In contrast to the Fe K-edge XAS spectrum where the negligible π-mixing of the O 2p with Fe 4p orbitals results in insignificant transition intensity of the eπ set, the O K-edge directly quantifies the large O 2p π-mixing in the 3d(xz,yz) orbitals. The assignment of the O K-edge XAS spectra in section 2.3 indicates that the 3d(xz,yz) orbitals have approximately twice the O 2pπ character relative to the 3d(z2) σ-orbital. The 3d(z2) and 3d(xz,yz) orbitals are the frontier molecular orbitals involved in the reactivity of Fe(IV)=O species that enable axial vs. equatorial attack, respectively, in H atom abstraction and electrophilic aromatic substitution reactions.14,17,40 In order to allow maximal overlap between the occupied substrate donor σC-H and the low-lying unoccupied Fe(IV)=O acceptor 3d orbitals, the electrophilicity of the Fe(IV)=O species is enhanced by a high orbital coefficient on the O atom, here either in the z2 for an approach along the Fe=O bond or in the eπ for an approach perpendicular to the Fe=O bond in the reaction. Figure 12A experimentally demonstrates that the eπ orbitals have significant O character (intense peak at 527 eV) consistent with DFT ground state calculations which allow for good overlap of the 3d(xz,yz) orbitals with the substrate σC-H orbital orientated perpendicular to the Fe-O bond (Figure 13). This is because the 3d(xz,yz) orbitals are strongly antibonding mostly with the O atom. Alternatively, the 3d(z2) orbital, while having more total covalency than the 3d(xz,yz) orbitals, i.e. less total 3d character (Figure 4), is σ-antibonding with the O atom, but also with the transaxial N atom and to a lesser extent with the equatorial ligand σ-donor orbitals (with the toroid of z2) of the [H3buea]3− tripod, hence a lower O character. A recent study15 showed computationally that on the SFe=5/2 potential energy surface, the σ-pathway using the 3d(z2) and the π-pathway, requiring excitation of an electron from the 3d(xz,yz) into the 3d(z2) orbital (green arrow in Figure 13), had similar reaction barriers despite the additional cost of the dπ to dσ electron promotion.15 A strongly polarized valence orbital, i.e. a highly covalent Fe-O π-bond, enables this reactivity. The O K-edge XAS data in Figure 12A and its analysis presented above provide the experimental evidence that S=2 Fe(IV)=O sites have large O character in their 3d(xz,yz) π-orbitals allowing the activation of the π-pathway perpendicular to the Fe-O axis, shown to be crucial for the selectivity of Fe(IV)=O intermediates in mononuclear non-heme iron enzymes.14,17,40
Figure 13:

Axial substrate approach (left, blue) through the α 3d(z2) unoccupied orbital compared with the equatorial approach (right, red) involving the excitation of an α 3d(xz,yz) electron to the 3d(z2) (green arrow). A higher π-orbital coefficient in the dπ frontier molecular orbitals enables better orbital overlap with the σC-H orbital of the substrate reacting perpendicular to the Fe=O bond. Adapted from reference 15. Copyright 2020 American Chemical Society.
While TDDFT calculations have the limitations discussed above for the assignment of the pre-edge of the [Fe(IV)O(H3buea)]− complex, these do reasonably simulate the significant dipole intensity in the e-orbitals. The knowledge gained in this study of [Fe(IV)O(H3buea)]− (including the z2 α/β splitting) can therefore be used in the context of adjusted TDDFT calculations to understand the pre-edges of enzyme and catalyst intermediates. Here, we analyze the previously reported Fe K-edge XAS spectrum of the S=2 Fe(IV)=O intermediate of TauD11 reproduced in Figure 14A, after background subtraction.
Figure 14:

A) Fit of the experimental pre-edge of the Fe(IV)=O intermediate of TauD after background subtraction. Adapted from reference 11. Copyright 2004 American Chemical Society. B) TDDFT-simulated E state contributions to the TDDFT calculations in Figure S14 of the twelve candidate structures for the Fe(IV)=O intermediate of TauD from reference 15 including six-coordinate (F1 to F5, 6-C, blue), five-coordinate square pyramidal (F6 to F9, 5-C SP, green) and five-coordinate trigonal bipyramidal structures (F10 to F12, 5-C TBP, red).
The spectral shape of the pre-edge of the TauD Fe(IV)=O intermediate (Figure 14A) is very similar to the pre-edge of [Fe(IV)O(H3buea)]− (Figure 2F), with two peaks at the energy extremes at 7112.4 and 7116.6 eV, and an intense feature in the middle at 7113.2 eV. The pre-edges of the twelve candidate structures built for the previous NRVS study of this intermediate15 were simulated with the same TDDFT approach as in section 2.1.2 (shown in Figure S14) and the contributions from the E states are shown in Figure 14B. The structures include six-coordinate (blue), five-coordinate square pyramidal with the oxo ligand in the equatorial plane (green) and trigonal bipyramidal (red) structures. The E transitions in the five-coordinate structures (green and red in Figure 14B) are almost twice as intense as the six-coordinate structures (in blue). While the six-coordinate structures have a small amount of 4px,y mixing into the non-z2 orbitals due to ligand distortions around the iron ion, the spectral shapes of six-coordinate Fe(IV)=O sites (Figure S14 F1 to F5) is dominated by the transitions into the z2 α and β orbitals. The experimental pre-edge of the Fe(IV)=O intermediate of TauD in Figure 14A with intense transitions into the eσ orbitals is only consistent with a five-coordinate structure for this intermediate, in agreement with the analysis from NRVS.15 It is however not possible to distinguish between trigonal bipyramidal or square pyramidal (with the oxo ligand in the equatorial plane) structures from Fe K-edge XAS as both cases result in significant and comparable dipole intensity in the transitions into the e-orbitals. Fe K-edge XAS can therefore distinguish between five-coordinate and six-coordinate Fe(IV)=O intermediates in enzymes and other catalytic systems. This insight into the Fe K-pre-edge was made possible by combining it with the 1s2p RIXS and L-edge XAS data and their analyses for a structurally-defined model complex. This XAS approach is a powerful characterization technique that complements NRVS and variable temperature MCD, each having specific advantages.
4. Conclusion
The combination of 1s2p RIXS, Fe L-edge XAS and O K-edge XAS with Fe K-edge XAS has been used to rigorously describe the electronic structure of five-coordinate S=2 Fe(IV)=O centers. The loss of inversion in the equatorial plane in the trigonal geometry (D3h and C3v symmetry) gives rise to 4px,y-mixing into the 3d(xy,x2-y2), adding to the 4pz mixing into the 3d(z2) intensity due to the short Fe=O bond. This structural sensitivity makes Fe K-edge XAS an effective method to probe the geometric structure of Fe(IV)=O sites in protein or catalyst intermediates, as demonstrated for the Fe(IV)=O intermediate of TauD where a 5-coordinate geometry obtained from a previous NRVS study15 is confirmed by Fe K-edge XAS. The combination of X-ray techniques provides new insight into the different frontier molecular orbitals responsible for electrophilic reactivity. In particular, the O K-edge XAS provides the experimental evidence for the high covalency of the Fe-O π-bond allowing for π-pathway reactivity, despite the axial σ-orbital being exchange-stabilized. The π-pathway enables the reactivity of Fe(IV)=O active sites perpendicular to the Fe=O bond that is important in selectivity.14,17,40 Over the course of this study, TDDFT calculations were found to have notable limitations over multiplet simulations of the Fe K-pre-edges when significant exchange interactions are present.
This methodology is now being applied in ongoing studies of S=1 Fe(IV)=O intermediates in non-heme and heme catalysts.
Supplementary Material
Acknowledgement
This work was supported by the National Institutes of Health (Grant R35GM145202-02 to E.I.S., R37GM050781 to A.S.B. and F32GM122194 to L.B.G.). M.L.B. acknowledges the support of the Human Frontier Science Program, the Royal Society of Chemistry (RM1802-4019) and computing resources provided by STFC Scientific Computing Department’s SCARF cluster. Use of the Stanford Synchrotron Radiation Lightsource (SSRL), SLAC National Accelerator Laboratory, is supported by the US Department of Energy (DOE), Office of Science, Office of Basic Energy Sciences under Contract DE-AC02-76SF00515. The SSRL Structural Molecular Biology Program is supported by the DOE Office of Biological and Environmental Research, and by the National Institutes of Health, National Institute of General Medical Sciences (Grant P30GM133894 to K.O.H and B.H). The contents of this publication are solely the responsibility of the authors and do not necessarily represent the official views of NIGMS or NIH. We acknowledge the European Synchrotron Radiation Facility for the provision of synchrotron radiation facilities under proposal number CH4587 and we would like to thank the staff at ID26 for their assistance during the beamtime. Some of the computing for this project was performed on the Sherlock cluster. We would like to thank Stanford University and the Stanford Research Computing Center for providing computational resources and support that contributed to these research results.
Footnotes
Supporting Information Available
Supporting Information. Experimental methods, DFT and multiplet simulation methods and parameters with calculated molecular orbitals and natural transition orbitals, comments on the Slater reduction scaling, additional Fe L-edge and O K-edge XAS data, parameter-dependence on the multiplet simulations of the Fe L-edge XAS, multiplet simulations of the transition dipole tensor components with DOC and state contribution to the CIE cuts of the 1s2p RIXS plane, TDDFT simulations of TauD candidate structures.
References
- (1).Vaillancourt FH; Yin J; Walsh CT SyrB2 in syringomycin E biosynthesis is a non-heme FeII α-ketoglutarate- and O2-dependent halogenase. Proceedings of the National Academy of Sciences 2005, 102, 10111–10116. [DOI] [PMC free article] [PubMed] [Google Scholar]
- (2).Baldwin JE; Abraham E The biosynthesis of penicillins and cephalosporins. Natural Product Reports 1988, 5, 129. [DOI] [PubMed] [Google Scholar]
- (3).Vaillancourt FH; Haro M-A; Drouin NM; Karim Z; Maaroufi H; Eltis LD Characterization of Extradiol Dioxygenases from a Polychlorinated Biphenyl-Degrading Strain That Possess Higher Specificities for Chlorinated Metabolites. Journal of Bacteriology 2003, 185, 1253–1260. [DOI] [PMC free article] [PubMed] [Google Scholar]
- (4).Mishina Y; He C Oxidative dealkylation DNA repair mediated by the mononuclear non-heme iron AlkB proteins. Journal of Inorganic Biochemistry 2006, 100, 670–678. [DOI] [PMC free article] [PubMed] [Google Scholar]
- (5).Solomon EI; DeWeese DE; Babicz JT Mechanisms of O2 Activation by Mononuclear Non-Heme Iron Enzymes. Biochemistry 2021, 60, 3497–3506. [DOI] [PMC free article] [PubMed] [Google Scholar]
- (6).Guo Y; Chang W-C; Li J; Davidson M Non-Heme Mono-Iron Enzymes: Co-Substrate-Dependent Dioxygen Activation, In Comprehensive Coordination Chemistry III; Constable EC, Parkin G, Que L Jr, Eds.; Elsevier: Oxford, 2021; pp 269–300. [Google Scholar]
- (7).Price JC; Barr EW; Tirupati B; , B.; Krebs C The First Direct Characterization of a High-Valent Iron Intermediate in the Reaction of an α-Ketoglutarate-Dependent Dioxygenase: A High-Spin Fe(IV) Complex in Taurine/α-Ketoglutarate Dioxygenase (TauD) from Escherichia coli. Biochemistry 2003, 42, 7497–7508. [DOI] [PubMed] [Google Scholar]
- (8).Fujimori DG; Barr EW; Matthews ML; Koch GM; Yonce JR; Walsh CT; Bollinger JM Jr.; Krebs C; Riggs-Gelasco PJ Spectroscopic Evidence for a High-Spin Br-Fe(IV)-Oxo Intermediate in the α-Ketoglutarate-Dependent Halogenase CytC3 from Streptomyces. Journal of the American Chemical Society 2007, 129, 13408–13409. [DOI] [PubMed] [Google Scholar]
- (9).Price JC; Barr EW; Hoffart LM; Krebs C; Bollinger JM Jr., Kinetic Dissection of the Catalytic Mechanism of Taurine:α-Ketoglutarate Dioxygenase (TauD) from Escherichia coli. Biochemistry 2005, 44, 8138–8147. [DOI] [PubMed] [Google Scholar]
- (10).Matthews ML; Neumann CS; Miles LA; Grove TL; Booker SJ; Krebs C; Walsh CT; Bollinger JM Jr., Substrate positioning controls the partition between halogenation and hydroxylation in the aliphatic halogenase, SyrB2. Proceedings of the National Academy of Sciences 2009, 106, 17723–17728. [DOI] [PMC free article] [PubMed] [Google Scholar]
- (11).Riggs-Gelasco PJ; Price JC; Guyer RB; Brehm JH; Barr EW; Bollinger JM Jr.; Krebs C EXAFS Spectroscopic Evidence for an Fe=O Unit in the Fe(IV) Intermediate Observed during Oxygen Activation by Taurine:α-Ketoglutarate Dioxygenase. Journal of the American Chemical Society 2004, 126, 8108–8109. [DOI] [PubMed] [Google Scholar]
- (12).Grzyska PK; Appelman EH; Hausinger RP; Proshlyakov DA Insight into the mechanism of an iron dioxygenase by resolution of steps following the FeIV=O species. Proceedings of the National Academy of Sciences 2010, 107, 3982–3987. [DOI] [PMC free article] [PubMed] [Google Scholar]
- (13).Srnec M; Wong SD; Matthews ML; Krebs C; Bollinger JM Jr.; Solomon EI Electronic Structure of the Ferryl Intermediate in the α-Ketoglutarate Dependent Non-Heme Iron Halogenase SyrB2: Contributions to H Atom Abstraction Reactivity. Journal of the American Chemical Society 2016, 138, 5110–5122. [DOI] [PMC free article] [PubMed] [Google Scholar]
- (14).Wong SD; Srnec M; Matthews ML; Liu LV; Kwak Y; Park K; III CBB; Alp EE; Zhao J; Yoda Y; Kitao S; Seto M; Krebs C; Bollinger JM Jr.; Solomon EI Elucidation of the Fe(IV)=O intermediate in the catalytic cycle of the halogenase SyrB2. Nature 2013, 499, 320–323. [DOI] [PMC free article] [PubMed] [Google Scholar]
- (15).Srnec M; Iyer SR; Dassama LMK; Park K; Wong SD; Sutherlin KD; Yoda Y; Kobayashi Y; Kurokuzu M; Saito M; Seto M; Krebs C; Bollinger JM Jr.; Solomon EI Nuclear Resonance Vibrational Spectroscopic Definition of the Facial Triad FeIV=O Intermediate in Taurine Dioxygenase: Evaluation of Structural Contributions to Hydrogen Atom Abstraction. Journal of the American Chemical Society 2020, 142, 18886–18896. [DOI] [PMC free article] [PubMed] [Google Scholar]
- (16).Sinnecker S; Svensen N; Barr EW; Ye S; Bollinger JM Jr.; Neese F; Krebs C Spectroscopic and Computational Evaluation of the Structure of the High-Spin Fe(IV)-Oxo Intermediates in Taurine: α-Ketoglutarate Dioxygenase from Escherichia coli and Its His99Ala Ligand Variant. Journal of the American Chemical Society 2007, 129, 6168–6179. [DOI] [PubMed] [Google Scholar]
- (17).Srnec M; Solomon EI Frontier Molecular Orbital Contributions to Chlorination versus Hydroxylation Selectivity in the Non-Heme Iron Halogenase SyrB2. Journal of the American Chemical Society 2017, 139, 2396–2407. [DOI] [PMC free article] [PubMed] [Google Scholar]
- (18).Puri M; Que L Jr., Toward the Synthesis of More Reactive S = 2 Non-Heme Oxoiron(IV) Complexes. Accounts of Chemical Research 2015, 48, 2443–2452. [DOI] [PMC free article] [PubMed] [Google Scholar]
- (19).Rohde J-U; In J-H; Lim MH; Brennessel WW; Bukowski MR; Stubna A; Münck E; Nam W; Que L Jr., Crystallographic and Spectroscopic Characterization of a Nonheme Fe(IV)=O Complex. Science 2003, 299, 1037–1039. [DOI] [PubMed] [Google Scholar]
- (20).Kaizer J; Klinker EJ; Oh NY; Rohde J-U; Song WJ; Stubna A; Kim J; Münck E; Nam W; Que L Jr., Nonheme FeIVO Complexes That Can Oxidize the C-H Bonds of Cyclohexane at Room Temperature. Journal of the American Chemical Society 2003, 126, 472–473. [DOI] [PubMed] [Google Scholar]
- (21).England J; Martinho M; Farquhar ER; Frisch JR; Bominaar EL; Münck E; Que L Jr., A Synthetic High-Spin Oxoiron(IV) Complex: Generation, Spectroscopic Characterization, and Reactivity. Angewandte Chemie International Edition 2009, 48, 3622–3626. [DOI] [PMC free article] [PubMed] [Google Scholar]
- (22).Lacy DC; Gupta R; Stone KL; Greaves J; Ziller JW; Hendrich MP; Borovik AS Formation, Structure, and EPR Detection of a High Spin FeIV—Oxo Species Derived from Either an FeIII—Oxo or FeIII—OH Complex. Journal of the American Chemical Society 2010, 132, 12188–12190. [DOI] [PMC free article] [PubMed] [Google Scholar]
- (23).Rohde J-U; Torelli S; Shan X; Lim MH; Klinker EJ; Kaizer J; Chen K; Nam W; Que L Jr., Structural Insights into Nonheme Alkylperoxoiron(III) and Oxoiron(IV) Intermediates by X-ray Absorption Spectroscopy. Journal of the American Chemical Society 2004, 126, 16750–16761. [DOI] [PubMed] [Google Scholar]
- (24).de Oliveira FT; Chanda A; Banerjee D; Shan X; Mondal S; Que L Jr.; Bominaar EL; Münck E; Collins TJ Chemical and Spectroscopic Evidence for an FeV-Oxo Complex. Science 2007, 315, 835–838. [DOI] [PubMed] [Google Scholar]
- (25).Jackson TA; Rohde J-U; Seo MS; Sastri CV; DeHont R; Stubna A; Ohta T; Kitagawa T; Münck E; Nam W; Que L Jr., Axial Ligand Effects on the Geometric and Electronic Structures of Nonheme Oxoiron(IV) Complexes. Journal of the American Chemical Society 2008, 130, 12394–12407. [DOI] [PMC free article] [PubMed] [Google Scholar]
- (26).Chandrasekaran P; Stieber SCE; Collins TJ; Que L Jr.; Neese F; DeBeer S Prediction of high-valent iron K-edge absorption spectra by time-dependent Density Functional Theory. Dalton Transactions 2011, 40, 11070. [DOI] [PMC free article] [PubMed] [Google Scholar]
- (27).Ehudin MA; Gee LB; Sabuncu S; Braun A; Moënne-Loccoz P; Hedman B; Hodgson KO; Solomon EI; Karlin KD Tuning the Geometric and Electronic Structure of Synthetic High-Valent Heme Iron(IV)-Oxo Models in the Presence of a Lewis Acid and Various Axial Ligands. Journal of the American Chemical Society 2019, 141, 5942–5960. [DOI] [PMC free article] [PubMed] [Google Scholar]
- (28).Westre TE; Kennepohl P; DeWitt JG; Hedman B; Hodgson KO; Solomon EI A Multiplet Analysis of Fe K-Edge 1s → 3d Pre-Edge Features of Iron Complexes. Journal of the American Chemical Society 1997, 119, 6297–6314. [Google Scholar]
- (29).Lundberg M; Kroll T; DeBeer S; Bergmann U; Wilson SA; Glatzel P; Nordlund D; Hedman B; Hodgson KO; Solomon EI Metal–Ligand Covalency of Iron Complexes from High-Resolution Resonant Inelastic X-ray Scattering. Journal of the American Chemical Society 2013, 135, 17121–17134. [DOI] [PMC free article] [PubMed] [Google Scholar]
- (30).Kroll T; Hadt RG; Wilson SA; Lundberg M; Yan JJ; Weng T-C; Sokaras D; Alonso-Mori R; Casa D; Upton MH; Hedman B; Hodgson KO; Solomon EI Resonant Inelastic X-ray Scattering on Ferrous and Ferric Bis-imidazole Porphyrin and Cytochrome c: Nature and Role of the Axial Methionine–Fe Bond. Journal of the American Chemical Society 2014, 136, 18087–18099. [DOI] [PMC free article] [PubMed] [Google Scholar]
- (31).Yan JJ; Kroll T; Baker ML; Wilson SA; Decréau R; Lundberg M; Sokaras D; Glatzel P; Hedman B; Hodgson KO; Solomon EI Resonant inelastic X-ray scattering determination of the electronic structure of oxyhemoglobin and its model complex. Proceedings of the National Academy of Sciences 2019, 116, 2854–2859. [DOI] [PMC free article] [PubMed] [Google Scholar]
- (32).Kroll T; Baker ML; Wilson SA; Lundberg M; Juhin A; Arrio M-A; Yan JJ; Gee LB; Braun A; Weng T-C; Sokaras D; Hedman B; Hodgson KO; Solomon EI Effect of 3d/4p Mixing on 1s2p Resonant Inelastic X-ray Scattering: Electronic Structure of Oxo-Bridged Iron Dimers. Journal of the American Chemical Society 2021, 143, 4569–4584. [DOI] [PMC free article] [PubMed] [Google Scholar]
- (33).MacBeth CE; Golombek AP; Young VG; Yang C; Kuczera K; Hendrich MP; Borovik AS O2 Activation by Nonheme Iron Complexes: A Monomeric Fe(III)-Oxo Complex Derived From O2. Science 2000, 289, 938–941. [DOI] [PubMed] [Google Scholar]
- (34).MacBeth CE; Gupta R; Mitchell-Koch KR; Young VG; Lushington GH; Thompson WH; Hendrich MP; Borovik AS Utilization of Hydrogen Bonds To Stabilize M-O(H) Units: Synthesis and Properties of Monomeric Iron and Manganese Complexes with Terminal Oxo and Hydroxo Ligands. Journal of the American Chemical Society 2004, 126, 2556–2567. [DOI] [PubMed] [Google Scholar]
- (35).Wasinger EC; de Groot FMF; Hedman B; Hodgson KO; Solomon EI L-edge X-ray Absorption Spectroscopy of Non-Heme Iron Sites: Experimental Determination of Differential Orbital Covalency. Journal of the American Chemical Society 2003, 125, 12894–12906. [DOI] [PubMed] [Google Scholar]
- (36).Hocking RK; Wasinger EC; de Groot FMF; Hodgson KO; Hedman B; Solomon EI Fe L-Edge XAS Studies of K4[Fe(CN)6] and K3[Fe(CN)6]: A Direct Probe of Back-Bonding. Journal of the American Chemical Society 2006, 128, 10442–10451. [DOI] [PubMed] [Google Scholar]
- (37).Hocking RK; Wasinger EC; Yan Y-L; deGroot FMF; Walker FA; Hodgson KO; Hedman B; Solomon EI Fe L-Edge X-ray Absorption Spectroscopy of Low-Spin Heme Relative to Non-heme Fe Complexes: Delocalization of Fe d-Electrons into the Porphyrin Ligand. Journal of the American Chemical Society 2007, 129, 113–125. [DOI] [PMC free article] [PubMed] [Google Scholar]
- (38).Frati F; Hunault MOJY; de Groot FMF Oxygen K-edge X-ray Absorption Spectra. Chemical Reviews 2020, 120, 4056–4110. [DOI] [PMC free article] [PubMed] [Google Scholar]
- (39).Shadle SE; Hedman B; Hodgson KO; Solomon EI Ligand K-edge x-ray absorption spectroscopic studies: metal-ligand covalency in a series of transition metal tetrachlorides. Journal of the American Chemical Society 1995, 117, 2259–2272. [Google Scholar]
- (40).Neidig ML; Decker A; Choroba OW; Huang F; Kavana M; Moran GR; Spencer JB; Solomon EI Spectroscopic and electronic structure studies of aromatic electrophilic attack and hydrogen-atom abstraction by non-heme iron enzymes. Proceedings of the National Academy of Sciences 2006, 103, 12966–12973. [DOI] [PMC free article] [PubMed] [Google Scholar]
- (41).Bair RA; Goddard WA Ab initio studies of the x-ray absorption edge in copper complexes. I. Atomic Cu2+ and Cu(II)Cl2. Physical Review B 1980, 22, 2767–2776. [Google Scholar]
- (42).George SD; Brant P; Solomon EI Metal and Ligand K-Edge XAS of Organotitanium Complexes: Metal 4p and 3d Contributions to Pre-edge Intensity and Their Contributions to Bonding. Journal of the American Chemical Society 2004, 127, 667–674. [DOI] [PubMed] [Google Scholar]
- (43).George SD; Petrenko T; Neese F Prediction of Iron K-Edge Absorption Spectra Using Time-Dependent Density Functional Theory. The Journal of Physical Chemistry A 2008, 112, 12936–12943. [DOI] [PubMed] [Google Scholar]
- (44).Martin RL Natural transition orbitals. The Journal of Chemical Physics 2003, 118, 4775–4777. [Google Scholar]
- (45).Haverkort MW Quanty for core level spectroscopy - excitons, resonances and band excitations in time and frequency domain. Journal of Physics: Conference Series 2016, 712, 012001. [Google Scholar]
- (46).Retegan M mretegan/crispy v0.7.3. 2019. 10.5281/zenodo.3258065. [DOI]
- (47).Snyder BER et al. Mechanism of selective benzene hydroxylation catalyzed by iron-containing zeolites. Proceedings of the National Academy of Sciences 2018, 115, 12124–12129. [DOI] [PMC free article] [PubMed] [Google Scholar]
- (48).Ghiasi M; Hariki A; Winder M; Kunšs J; Regoutz A; Lee T-L; Hu Y; Rueff J-P; de Groot FMF Charge-transfer effect in hard x-ray 1s and 2p photoemission spectra: LDA+DMFT and cluster-model analysis. Physical Review B 2019, 100, 075146. [Google Scholar]
- (49).Gupta R; Lacy DC; Bominaar EL; Borovik AS; Hendrich MP Electron Paramagnetic Resonance and Mössbauer Spectroscopy and Density Functional Theory Analysis of a High-Spin FeIV–Oxo Complex. Journal of the American Chemical Society 2012, 134, 9775–9784. [DOI] [PMC free article] [PubMed] [Google Scholar]
- (50).Tenderholt A; Hedman B; Hodgson KO PySpline: A Modern, Cross-Platform Program for the Processing of Raw Averaged XAS Edge and EXAFS Data. AIP Conference Proceedings 2007, 105–107. [Google Scholar]
- (51).Neese F The ORCA program system. WIREs Computational Molecular Science 2012, 2, 73–78. [Google Scholar]
- (52).Becke AD Density-functional thermochemistry. III. The role of exact exchange. The Journal of Chemical Physics 1993, 98, 5648–5652. [Google Scholar]
- (53).Stephens PJ; Devlin FJ; Chabalowski CF; Frisch MJ Ab Initio Calculation of Vibrational Absorption and Circular Dichroism Spectra Using Density Functional Force Fields. The Journal of Physical Chemistry 1994, 98, 11623–11627. [Google Scholar]
- (54).Becke AD Density-functional exchange-energy approximation with correct asymptotic behavior. Phys. Rev. A 1988, 38, 3098–3100. [DOI] [PubMed] [Google Scholar]
- (55).Weigend F; Ahlrichs R Balanced basis sets of split valence, triple zeta valence and quadruple zeta valence quality for H to Rn: Design and assessment of accuracy. Physical Chemistry Chemical Physics 2005, 7, 3297. [DOI] [PubMed] [Google Scholar]
- (56).Weigend F Accurate Coulomb-fitting basis sets for H to Rn. Physical Chemistry Chemical Physics 2006, 8, 1057. [DOI] [PubMed] [Google Scholar]
- (57).Neese F Prediction and interpretation of the 57Fe isomer shift in Mössbauer spectra by density functional theory. Inorganica Chimica Acta 2002, 337, 181–192. [Google Scholar]
- (58).Tenderholt AL QMForge: Tools for Converting the Output from QM Calculations into Something More Useful, Version 2.4, https://qmforge.net. 2015,
- (59).Rees JA; Martin-Diaconescu V; Kovacs JA; DeBeer S X-ray Absorption and Emission Study of Dioxygen Activation by a Small-Molecule Manganese Complex. Inorganic Chemistry 2015, 54, 6410–6422. [DOI] [PMC free article] [PubMed] [Google Scholar]
- (60).König E; Kremer S Ligand Field; Springer; US, 1977. [Google Scholar]
- (61).Cowan RD The Theory of Atomic Structure and Spectra; University of California Press: Berkeley, 1981. [Google Scholar]
- (62).Lever ABP Inorganic electronic spectroscopy; 1st edition; Elsevier Science Publishers B. V.: Amsterdam, 1968; pp 207–217. [Google Scholar]
- (63).Stout JW Absorptio Spectrum of Manganous Fluoride. The Journal of Chemical Physics 1959, 31, 709–719. [Google Scholar]
- (64).Dingle R The Polarized Single Crystal Spectrum of Ammonium Pentafluoromanganate (III). Inorganic Chemistry 1965, 4, 1287–1290. [Google Scholar]
- (65).Allen G; El-Sharkarwy G; Warren KD Reinvestigation of the electronic spectrum of potassium hexafluoromanganate(IV). Inorganic and Nuclear Chemistry Letters 1969, 5, 725–728. [Google Scholar]
- (66).Hocking RK; George SD; Raymond KN; Hodgson KO; Hedman B; Solomon EI Fe L-Edge X-ray Absorption Spectroscopy Determination of Differential Orbital Covalency of Siderophore Model Compounds: Electronic Structure Contributions to High Stability Constants. Journal of the American Chemical Society 2010, 132, 4006–4015. [DOI] [PMC free article] [PubMed] [Google Scholar]
Associated Data
This section collects any data citations, data availability statements, or supplementary materials included in this article.