

Abstract
BACKGROUND
Food deserts are low-income census tracts with poor access to supermarkets and are associated with worse outcomes in breast, colon, and a small number of esophageal cancer patients. This study investigated residency in food deserts on readmission rates in a multi-institutional cohort of esophageal cancer patients undergoing trimodality therapy.
METHODS
A retrospective review of patients who underwent trimodality therapy at 6 high-volume institutions from January 2015 to July 2019 was performed. Food desert status was defined by the United States Department of Agriculture by patient ZIP Code. The primary outcome was 30-day readmission after esophagectomy. Multilevel, multivariable logistic regression was used to model readmission on food desert status adjusted for diabetes, insurance type, length of stay, and any complication, treating the institution as a random factor.
RESULTS
Of the 453 records evaluated, 425 were included in the analysis. Seventy-three patients (17.4%) resided in a food desert. Univariate analysis demonstrated food desert patients had significantly increased 30-day readmission. No differences were seen in length of stay, complications, or 30-day mortality. In the adjusted logistic regression model, residing in a food desert remained a significant risk factor for readmission (odds ratio, 2.11; 95% CI, 1.07–4.15). There were no differences in 30-day, 90-day, or 1-year mortality based on food desert status, although readmission was associated with worse 90-day and 1-year mortality.
CONCLUSIONS
Food desert residence was associated with 30-day readmission after esophagectomy in patients undergoing trimodality treatment for esophageal cancer in this multi-institutional population. Identification of patients residing in a food desert may allow surgeons to focus preventative interventions during treatment and postoperatively to improve outcomes.
Approximately 20,000 cases of esophageal cancer are diagnosed each year in the United States.1 Trimodality therapy with neoadjuvant chemoradiotherapy, followed by esophagectomy, is the standard of care for patients with local and regional advanced disease.2 Unfortunately, esophagectomy continues to be associated with relatively high complication rates.3 In particular, readmissions after treatment are associated with increased costs, decreased patient quality of life, and reductions in long-term survival.4–6 Consequently, identification of potentially modifiable risk factors and interventions to optimize patients before initiation of treatment are critical.
Poor nutritional status, extremes of body mass index (BMI; ie, BMI <18.5 or ≥40 kg/m2), and sarcopenia have been identified as potentially modifiable risk factors in patients with gastrointestinal malignancies undergoing surgical treatment.7–10 In addition, worse treatment outcomes associated with nutrition have been linked to lower socioeconomic status.11–13 Moreover, a variety of preoperative nutritional support programs have demonstrated the ability to reduce treatment complications in esophageal cancer patients, indicating the importance of appropriate nutritional optimization and avoiding malnutrition in these patients.14 However, extensive nutritional assessments and sarcopenia measurements can require considerable testing, time, and resources.
Food deserts are an easily identifiable risk factor that incorporates nutritional, geographic, and socioeconomic factors and were recently associated with increased rates of readmission after trimodality therapy for esophageal cancer in a single-institution study.15 The United States Department of Agriculture (USDA) defines a food desert as “a low-income census tract where a significant number of people have low access to supermarkets or large grocery stores.”16 These areas are characterized by limited access to healthy foods, such as fruits and vegetables, with resultant poor eating habits and increased rates of diet-related diseases such as obesity, hypertension, and diabetes.17 The USDA Food Access Research Atlas is a publicly available and easily searchable tool by street address or ZIP Code to determine whether a patient resides in a food desert.18
Food deserts are also associated with worse health outcomes related to recurrent hospitalizations for heart failure, readmission after revascularization for chronic limb ischemia, and worse long-term survival in breast and colon cancer patients.19–21 Currently, the literature related to food deserts and cancer outcomes remains sparse. The current study assessed the impact of residing in a food desert on clinical outcomes in patients undergoing trimodality therapy for esophageal cancer in a geographically diverse, multi-institutional cohort.
PATIENTS AND METHODS
A retrospective cohort study of consecutive esophagectomy patients (any type) after neoadjuvant chemotherapy and radiotherapy using the ChemoRadiotherapy for Oesophageal Cancer Followed by Surgery Study (CROSS) protocol2 at 6 high-volume academic institutions was performed. Records were eligible for review if the esophagectomy occurred between January 1, 2015, and July 31, 2019. Patients were excluded if they did not receive trimodality therapy. This study was approved by Dartmouth-Hitchcock Medical Center Institutional Review Board and was granted a waiver of consent. Each site obtained separate Institutional Review Board approvals before sending data to the coordinating site.
DATA COLLECTION.
Each site collected demographic data, geographic location of the patient’s residence, travel distance to the treatment center, comorbidities, BMI, treatment characteristics, weight loss before and during treatment, disease stage, postoperative length of stay, readmissions, 30-day complications, and 90-day and 1-year deaths. The primary outcome measure was readmission (yes vs no), defined as readmission to any hospital ≤30 days after the index procedure. Postoperative complications were recorded through 30 days after the operation and graded I to V as classified by Clavien-Dindo.22 Complication data follow The Society of Thoracic Surgeons definitions.23
Travel distance from the patient’s residence to the treatment center was estimated by the most direct route on Google Maps. In an attempt to control for socioeconomic status, median household income for individuals (estimated by cross-referencing patient’s home ZIP Code with the United States Census Bureau Quick Facts24) and insurance status were included. Additionally, in an attempt to evaluate nutritional-related risk factors, the psoas muscle index to define sarcopenia, weight loss, and preresection need for a feeding tube were included.
The primary exposure was residing in a food desert, obtained from the USDA Food Access Research Atlas18 and cross-referenced with the patient’s home ZIP Code to determine food desert status (yes vs no). Covariates were selected among available data and based on their potential associations with residing in a food desert.
MEASUREMENT OF THE PSOAS MUSCLE INDEX.
The psoas muscle index was calculated by using psoas muscle measurements on a computed tomographic scan as previously described at the third lumbar vertebrae.15,25 Measurements were obtained on axial computed tomographic images in mm, and the cross-sectional area was estimated by multiplying the major axis diameter/2 by the minor axis diameter/2 by π and normalized by dividing by height in m2. Sarcopenia was defined using sex-specific cutoff points of <390 mm2/m2 for women and <550 mm2/m2 for men, as previously described.15,25
STATISTICAL ANALYSIS.
Statistical analysis was performed using Stata/SE 16.1 software (StataCorp LLC). Univariable analyses were conducted to compare demographic and clinical measures by food desert status and readmission status using the Student t test for continuous variables and the χ2 test and Fisher exact test for categorical variables, as appropriate. Multilevel logistic regression was used to model 30-day readmission (dependent variable) on food desert status (independent variable), adjusted for demographic and clinical measures statistically associated with readmission at the P <.10 level in univariable analyses (insurance type, diabetes, length of stay, and any complication) and a priori factors associated with socioeconomic status (travel distance and median household income). The model included a random effect at the site level to account for nesting of participants within sites. Patients who died in-hospital before discharge from the index operation were excluded from the readmission analysis. Statistical significance of main effects was set at P < .05 (2-sided). The study was powered at 80% to detect a minimal detectable difference of 18.5% in an outcome rate by food desert group status assuming an intraclass correlation of 0.
RESULTS
Of the 453 esophagectomy records sent to the coordinating site, 425 met inclusion criteria for the initial analysis. Patients were excluded if they were missing psoas muscle measurements (n = 19), readmission status (n = 6), or food desert status (n = 3) (Figure). Seventy-three (17.1%) patients resided in a food desert. There were no significant differences in sex, race, age, insurance status, driving distance, comorbidities, initial BMI, pretreatment weight loss, histology, clinical stage, pretreatment sarcopenia, preresection feeding tube placement, duration of neoadjuvant therapy, posttreatment sarcopenia, presurgery weight loss, or pathologic stage between those who lived in a food desert and those who did not (Table 1). Not surprisingly, patients living in a food desert were more likely to have lower median household income. Interestingly, there was a trend toward no residual disease and stage I disease on final pathology for patients residing in a food desert.
FIGURE.
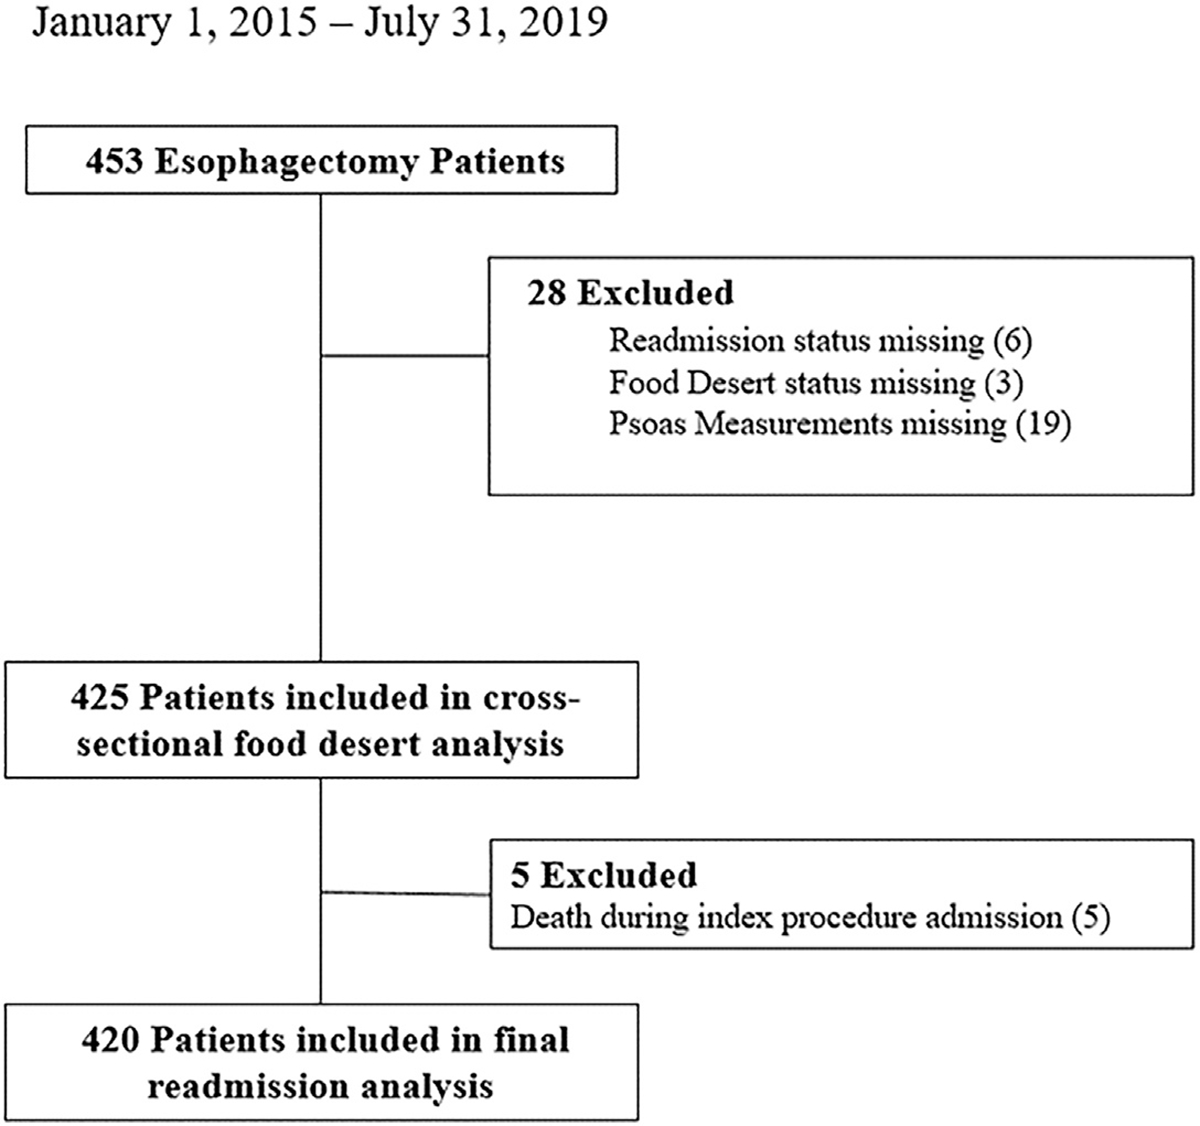
Diagram of patients included and excluded.
TABLE 1.
Demographics of Study Population Stratified by Food Desert Status
| Reside in a Food Desert | |||
|---|---|---|---|
| Variable | Yes (n = 73) | No (n = 352) | P Valuea |
|
| |||
| Male sex | 61 (83.6) | 283 (81.6) | .69 |
| Caucasian | 70 (95.9) | 340 (96.6) | .77 |
| Age, mean (SD), y | 63.4 (8.7) | 64.1 (10.2) | .56 |
| Insuranceb | .60 | ||
| Medicare, commercial, military | 66 (91.7) | 329 (94.5) | |
| Medicaid, none | 6 (8.3) | 23 (6.5) | |
| Median household income, mean (SD), $ | 51,473.7 (13,344.3) | 65,653.4 (24,118.9) | <.001 |
| Driving distance, mean (SD), km | 168.8 (137.2) | 153.7 (223.1) | .58 |
| Comorbidities | |||
| Chronic obstructive pulmonary disease | 7 (10.9) | 22 (7.3) | .33 |
| Hypertension | 41 (56.2) | 176 (50.0) | .34 |
| Coronary artery disease | 11 (15.1) | 52 (14.8) | .95 |
| Diabetes | 16 (22.2) | 80 (22.8) | .92 |
| Cerebrovascular | .90 | ||
| Stroke | 2 (2.7) | 8 (2.3) | |
| Transient ischemic attack | 1 (1.4) | 9 (2.6) | |
| Body mass index categoryc | .10 | ||
| <18.5 kg/m2 | 3 (4.2) | 3 (0.9) | |
| 18.5–35 kg/m2 | 60 (84.5) | 284 (84.5) | |
| ≥35 kg/m2 | 8 (11.3) | 49 (14.6) | |
| Pretreatment reported weight loss >10 pounds | 48 (65.8) | 228 (65.0) | .90 |
| Histology | .64 | ||
| Adenocarcinoma | 62 (86.1) | 315 (90.0) | |
| Squamous | 10 (13.9) | 33 (9.4) | |
| Pretreatment clinical stage | .94 | ||
| I | 0 | 3 (0.9) | |
| II | 13 (18.8) | 61 (17.3) | |
| III | 41 (59.4) | 197 (56.0) | |
| IV | 15 (21.7) | 68 (19.3) | |
| Missing | 4 (5.5) | 23 (6.5) | |
| Pretreatment sarcopeniad | 9 (12.3) | 41 (11.7) | .87 |
| Male | 4 | 29 | |
| Female | 5 | 12 | |
| Preresection feeding tube | 15 (20.5) | 75 (21.3) | .89 |
| Neoadjuvant therapy duration, mean (SD), d | 46.2 (23.5) | 48.4 (39.1) | .64 |
| Posttreatment sarcopeniad | 18 (24.7) | 73 (20.7) | .46 |
| Male | 12 | 55 | |
| Female | 6 | 18 | |
| Presurgery weight loss,e mean (SD), % | −6.4 (9.0) | −4.7 (8.3) | .16 |
| Pathologic stage | .06 | ||
| No residual | 15 (21.7) | 59 (17.9) | |
| I | 28 (40.6) | 86 (26.1) | |
| II | 10 (14.5) | 56 (17.0) | |
| III | 10 (14.5) | 103 (31.2) | |
| IV | 6 (8.7) | 26 (7.9) | |
| Missing | 4 (5.5) | 22 (6.3) | |
P value by χ2, Fisher exact test, and Student t test as appropriate
Missing data for 1 patient
Based on food desert (n = 71) and non-food desert (n = 336)
Based on psoas muscle index
Based on food desert (n = 61) and non-food desert (n = 304).
Data are presented as n (%) unless indicated as mean (SD). The bold P value is statistically significant (P < .05).
Postoperative outcomes stratified by food desert status are listed in Table 2. No differences were identified by food desert status for postoperative length of stay, any 30-day complication, or any 30-day grade III/IV complication. Patients living in a food desert had a trend toward a higher rate of respiratory failure and a significantly higher rate of readmission ≤30 days (24.7% vs 13.4%, P = .02). There were no 30-day deaths in the food desert group and 5 (1.4%) in-hospital deaths in the non-food desert group. Follow-up was available at 90 days for 65 food desert patients (89%) and 337 non-food desert patients (95.7%) and at 1 year for 60 food desert patients (82.2%) and 325 non-food desert patients (92.3%). Excluding the patients with missing data, no differences were observed in 90-day mortality (6.2% vs 3.6%, P = .33) or 1-year mortality (11.7% vs 16.9%, P = .31) between those who did and did not reside in a food desert.
TABLE 2.
Thirty-Day Postoperative Outcomes Stratified by Food Desert Status
| Reside in a Food Desert | |||
|---|---|---|---|
| Outcome | Yes (n = 73) | No (n = 352) | P Valuea |
|
| |||
| Length of stay, mean (SD), d | 11.3 (8.3) | 10.9 (8.0) | .70 |
| Any complication | 51 (69.9) | 214 (61.5) | .18 |
| Grade III/IV complication | 29 (39.7) | 114 (32.9) | .26 |
| Anastomotic leak | 12 (16.4) | 39 (11.1) | .20 |
| Delayed gastric emptying | 3 (4.1) | 15 (4.3) | >.99 |
| Pleural effusion | 5 (6.8) | 25 (7.1) | >.99 |
| Respiratory failure | 6 (8.2) | 12 (3.4) | .10 |
| Pneumothorax | 2 (2.7) | 7 (2.0) | .66 |
| 30-day readmission | 18 (24.7) | 47 (13.4) | .02 |
| 30-day deaths | 0 | 5 (1.4) | ... |
P value by χ2, Fisher exact test, and Student t test as appropriate.
Data are shown as n (%) unless indicated as mean (SD). The bold P value is statistically significant (P < .05).
To further investigate potential risk factors for readmission, we stratified the patients by readmission status, excluding in-hospital mortalities (n = 5). Sixty-five patients (15.5%) were readmitted within 30 days of discharge from their index procedure (Table 3). Demographic characteristics of patients who were and were not readmitted were similar in sex, race, age, median household income, driving distance, most comorbidities, BMI, pretreatment weight loss, histology, pretreatment clinical stage, pretreatment sarcopenia, preresection feeding tube placement, duration of neoadjuvant therapy, preresection weight loss percentage, and pathologic stage. Patients who were readmitted were more likely to reside in a food desert and have diabetes and were less likely to have posttreatment sarcopenia compared with those who were not readmitted. In addition, there was a trend toward increased use of Medicaid in readmitted patients, but this was not statistically significant.
TABLE 3.
Demographics of Study Population Stratified by Readmission Status
| Readmission Status | |||
|---|---|---|---|
| Variable | Yes (n = 65) | No (n = 355) | P Valuea |
|
| |||
| Male sex | 57 (87.7) | 287 (80.9) | .19 |
| Caucasian | 65 (100.0) | 340 (95.8) | ... |
| Age, mean (SD), y | 63.3 (12.6) | 64.0 (9.4) | .63 |
| Insuranceb | .06 | ||
| Medicare, commercial, military | 57 (87.7) | 333 (94.1) | |
| Medicaid, none | 8 (12.3) | 21 (5.9) | |
| Median household income, mean (SD), $ | 61,612.8 (27,035.4) | 63,562.1 (22,669.3) | .54 |
| Driving distance, mean (SD), km | 175.2 (339.2) | 153.0 (179.4) | .44 |
| Food desert status | 18 (27.7) | 55 (15.5) | .02 |
| Comorbidities | |||
| Chronic obstructive pulmonary disease | 5 (8.5) | 23 (7.6) | .79 |
| Hypertension | 32 (49.2) | 181 (51.0) | .80 |
| Coronary artery disease | 13 (20.0) | 49 (13.8) | .20 |
| Diabetes | 21 (32.8) | 74 (20.9) | .04 |
| Cerebrovascular | 1.00 | ||
| Stroke | 1 (1.5) | 9 (2.5) | |
| Transient ischemic attack | 1 (1.5) | 8 (2.3) | |
| Body mass index categoryc | .28 | ||
| <18.5 kg/m2 | 0 | 6 (1.8) | |
| 18.5–35 kg/m2 | 51 (81.0) | 290 (85.6) | |
| ≥35 kg/m2 | 12 (19.1) | 43 (12.7) | |
| Pretreatment weight loss >5 pounds | 38 (58.5) | 235 (66.4) | .22 |
| Histology | .13 | ||
| Adenocarcinoma | 58 (89.2) | 314 (89.2) | |
| Squamous | 6 (9.2) | 37 (10.5) | |
| Pretreatment stage | .73 | ||
| I | 1 (1.6) | 2 (0.6) | |
| II | 9 (14.8) | 64 (19.3) | |
| III | 37 (60.7) | 197 (59.3) | |
| IV | 14 (23.0) | 69 (20.8) | |
| Missing | 4 (6.1) | 23 (6.4) | |
| Pretreatment sarcopeniad | 5 (7.7) | 44 (12.4) | .24 |
| Male | 3 | 29 | |
| Female | 2 | 15 | |
| Preresection feeding tube | 11 (16.9) | 43 (12.1) | .29 |
| Neoadjuvant therapy duration, mean (SD), d | 52.8 (55.9) | 46.9 (32.3) | .24 |
| Posttreatment sarcopeniad | 8 (12.3) | 83 (23.4) | <.05 |
| Male | 6 | 61 | |
| Female | 2 | 22 | |
| Presurgery weight loss,e mean (SD), % | −5.8 (5.8) | −4.9 (8.8) | .48 |
| Pathologic stage | .75 | ||
| No residual | 14 (23.7) | 60 (17.9) | |
| I | 17 (28.8) | 94 (28.1) | |
| II | 8 (13.6) | 58 (17.3) | |
| III | 16 (27.1) | 96 (28.7) | |
| IV | 4 (6.8) | 27 (8.1) | |
| Missing | 6 (9.2) | 20 (5.6) | |
P value by χ2, Fisher exact test, and Student t test as appropriate
Missing data for 1 patient
Based on readmitted (n = 63) and not readmitted (n = 339)
Based on psoas muscle index
Based on readmitted (n = 58) and not readmitted (n = 302).
Data are shown as n (%) unless indicated as mean (SD). The bold P values are statistically significant (P < .05).
As detailed in Table 4, postoperative length of stay after esophagectomy was not significantly different based on readmission status, but those who were readmitted had a trend toward a slightly longer length of stay. Not surprisingly, rates of any complication and grade III/IV complications ≤30 days of their index procedure were higher in readmitted patients. Specifically, rates of anastomotic leak, delayed gastric emptying, and pleural effusion were significantly higher in patients who were readmitted.
TABLE 4.
Thirty-Day Postoperative Outcomes of Study Population Stratified by Readmission Status
| Readmission Status | |||
|---|---|---|---|
| Outcome | Yes (n = 65) | No (n = 355) | P Valuea |
|
| |||
| Length of stay, mean (SD), d | 12.5 (10.1) | 10.6 (7.5) | .08 |
| Any complication | 58 (89.2) | 202 (57.6) | <.001 |
| Grade III/IV complication | 48 (73.9) | 90 (25.7) | <.001 |
| Anastomotic leak | 21 (32.3) | 27 (7.6) | <.001 |
| Delayed gastric emptying | 7 (10.8) | 11 (3.1) | .005 |
| Pleural effusion | 14 (21.5) | 14 (3.9) | <.001 |
| Respiratory failure | 5 (7.7) | 11 (3.1) | .08 |
| Pneumothorax | 2 (3.1) | 7 (2.0) | .64 |
P value by χ2, Fisher exact test, and Student t test, as appropriate.
Data are shown as n (%) unless indicated as mean (SD). The bold P values are statistically significant (P < .05).
Unadjusted analysis for readmission demonstrated that those who resided in a food desert were twice as likely to be readmitted (odds ratio, 2.09; 95% CI, 1.13–3.86) compared with those who did not (Table 5). Residing in a food desert remained a significant risk factor for readmission in a multilevel model that adjusted for the presence of insurance type, diabetes, length of stay, driving distance to the institution, median household income, and any complication (odds ratio, 2.11; 95% CI, 1.07–4.15). This model yielded an area under the receiver operating characteristic curve of 0.73.
TABLE 5.
Risk Estimates for Readmission after Esophagectomy
| Variable | Unadjusted OR | 95% CI | Adjusteda OR | 95% CI |
|---|---|---|---|---|
|
| ||||
| Food desert status | 2.09 | 1.13–3.86 | 2.11 | 1.07–4.15 |
| Insurance category | 0.45 | 0.19–1.06 | 0.50 | 0.19–1.18 |
| 30-day complication | 6.11 | 2.71–13.77 | 6.61 | 2.85–17.33 |
| Length of stay | 1.02 | 1.00–1.05 | 1.00 | 0.97–1.03 |
| Diabetes | 1.85 | 1.03–3.30 | 1.88 | 1.03–3.52 |
| Driving distance | 1.00 | 1.00–1.00 | 1.00 | 1.00–1.00 |
| Median household income | 0.99 | 1.00–1.00 | 1.00 | 1.00–1.00 |
Adjusted for food desert status, presence of a 30-day complication, insurance category, length of stay, diabetes, driving distance to health care facility, and median household income.
OR, odds ratio.
Excluding patients with missing follow-up, both 90-day (9.2% vs 2.4%, P = .006) and 1-year (26.7% vs 13.6%, P = .01) mortality were higher in patients who were readmitted ≤30 days from esophagectomy compared with those who were not.
COMMENT
Our study further confirmed that residing in a food desert serves as an independent risk factor for readmission after esophagectomy for esophageal cancer patients undergoing trimodality treatment. These findings add to the emerging literature that food deserts negatively affect cancer treatment outcomes. In a geographically diverse, multi-institutional cohort of patients, residing in a food desert increased the risk of readmission without other obvious differences in baseline characteristics, with the exception of a lower median household income. This easily identifiable information may help clinicians determine which patients may benefit from intensive interventions, such as nutrition support and counseling, and closer postdischarge monitoring to direct resources to limit treatment-related adverse outcomes.
In this study, patients who lived in a food desert were significantly more likely to be readmitted after their esophagectomy despite no difference in the rates of any complication, grade III/IV complications, or postoperative length of stay. Similar to our initial single-institution study,15 these data further indicate that patients fare similarly when provided equal resources in the hospital but may be more likely to be readmitted upon discharge to a resource-limited environment. It is well known that health access disparities result in worse treatment and survival outcomes for multiple types of cancer.26–28
In this large, multi-institutional study our data provide further evidence that residing in a food desert is an easily identifiable indicator of sociogeographic disparity that negatively impacts trimodality treatment outcomes for esophageal cancer. While 90-day and 1-year mortality were not different when stratified by food desert status, both were significantly worse in patients who were readmitted ≤30 days of esophagectomy, which was associated with food desert residence.
Our findings are consistent with previously published reports identifying the negative impact of readmission after esophagectomy on risk of death.5,6 Although our data do not identify a statistically significant causal pathway, this study was not powered to investigate the impact of food deserts on the risk of death after esophagectomy, and a larger study to specifically evaluate this is needed.
Our findings further underscore the importance of nutrition in esophageal cancer treatments and indicate factors such as extremes of BMI and sarcopenia may not fully identify patients at increased risk for complications. Residing in a food desert is likely a surrogate marker for a combination of related issues of nutrition, access disparities, and socioeconomic status that does not require extensive dietary evaluation, additional laboratory testing, or nonclinical imaging measurements. Identification of high-risk patients is critical because malnourished cancer patients are known to experience more severe postoperative complications related to infections and wound healing, and malnutrition is a common reason for readmission after esophagectomy.6,29
Readmissions not only increase hospital costs and deaths after esophagectomy but also impact the quality of care delivered and patient-reported quality of life.4–6,30 As such, further research is needed to determine the best preventative measures for readmission in these patients. Nutritional interventions can improve postoperative outcomes for upper gastrointestinal cancers; however, the literature demonstrates inconsistent results.14,31 The European Society for Clinical Nutrition and Metabolism recommends a nutritional risk assessment and prehabilitation by way of nutrition and exercise for patients undergoing cancer operations with dietary counseling, fortified diets, oral nutritional supplements, and parenteral support when needed.32
Currently, making specific recommendations regarding interventions to prevent readmission in food desert patients is difficult, particularly as evidence related to this at-risk population and cancer is lacking. Empirically, it would seem that aggressive perioperative nutrition plans, frequent telehealth check-ins, and early in-person postoperative visits when issues are identified would reduce readmissions. The evaluation of specific interventions to prevent readmissions for patients who reside in food deserts will be an area of future research from our group.
The relatively large number of patients, the multi-institutional nature, and geographic diversity of this study are significant strengths and enhance the generalizability of our findings.
LIMITATIONS.
The study has several limitations. This is a retrospective review of patients deemed healthy enough to undergo esophageal resection, and most patients were male and Caucasian. Thus, the potential for selection bias and some limited generalizability exists.
Second, although we attempted to control for demographics, co-morbidities, travel distance, median household income, and insurance status, potential confounders that we were unable to address, such as patient education level, activity/exercise level, and detailed diet histories or dietary management plans, were not able to be assessed. However, results from this study will be used to inform a future prospective, multi-institutional study that will address many of these limitations and further examine the relationship between food deserts, additional socioeconomic disparities, patient racial/ethnic diversity, and treatment outcomes.
CONCLUSION.
Residing in a food desert is associated with increased readmission after esophagectomy for patients receiving trimodality therapy for esophageal cancer. Identifying patients who reside in a food desert may help surgeons and their multi-disciplinary teams focus pretreatment risk assessments and direct resources and interventions to improve the treatment and outcomes of these patients.
FUNDING SOURCES
This study received no direct funding. Joseph D. Phillips is supported by The Dartmouth-Hitchcock Cancer Research Fellows Program by the National Institutes of Health, National Cancer Institute Cancer Center Support Grant 5P30CA023108 and The Dartmouth Clinical and Translational Science Institute, under award number UL1TR001086 from the National Institutes of Health, National Center for Advancing Translational Sciences.
The authors wish to thank the Thoracic Surgery Outcomes Research Network (ThORN), Inc, for providing a forum to solicit institutional enrollment for this study.
Footnotes
DISCLOSURES
The authors have no conflicts of interest to disclose.
Presented at the Fifty-ninth Annual Meeting of The Society of Thoracic Surgeons, San Diego, CA, Jan 21–23, 2023.
REFERENCES
- 1.American Cancer Society. American Cancer Society—Cancer Facts & Statistics. Cancer Statistics Center. Esophagus. Published 2022. Accessed January 1, 2023. https://cancerstatisticscenter.cancer.org/#!/cancer-site/Esophagus [Google Scholar]
- 2.Eyck BM, van Lanschot JJB, Hulshof MCCM, et al. Ten-year outcome of neoadjuvant chemoradiotherapy plus surgery for esophageal cancer: the randomized controlled CROSS Trial. J Clin Oncol. 2021;39:1995–2004. [DOI] [PubMed] [Google Scholar]
- 3.van Kooten RT, Voeten DM, Steyerberg EW, et al. Patient-related prognostic factors for anastomotic leakage, major complications, and short-term mortality following esophagectomy for cancer: a systematic review and meta-analyses. Ann Surg Oncol. 2022;29:1358–1373. [DOI] [PMC free article] [PubMed] [Google Scholar]
- 4.Stitzenberg KB, Chang YK, Smith AB, Nielsen ME. Exploring the burden of inpatient readmissions after major cancer surgery. J Clin Oncol. 2015;33:455–464. [DOI] [PMC free article] [PubMed] [Google Scholar]
- 5.Fernandez FG, Khullar O, Force SD, et al. Hospital readmission is associated with poor survival after esophagectomy for esophageal cancer. Ann Thorac Surg. 2015;99:292–297. [DOI] [PMC free article] [PubMed] [Google Scholar]
- 6.Hu Y, McMurry TL, Stukenborg GJ, Kozower BD. Readmission predicts 90-day mortality after esophagectomy: analysis of Surveillance, Epidemiology, and End Results Registry linked to Medicare outcomes. J Thorac Cardiovasc Surg. 2015;150:1254–1260. [DOI] [PMC free article] [PubMed] [Google Scholar]
- 7.Paireder M, Asari R, Kristo I, et al. Impact of sarcopenia on outcome in patients with esophageal resection following neoadjuvant chemotherapy for esophageal cancer. Eur J Surg Oncol. 2017;43:478–484. [DOI] [PubMed] [Google Scholar]
- 8.Elliott JA, Doyle SL, Murphy CF, et al. Sarcopenia: prevalence, and impact on operative and oncologic outcomes in the multimodal management of locally advanced esophageal cancer. Ann Surg. 2017;266:822–830. [DOI] [PubMed] [Google Scholar]
- 9.Yoshida N, Baba Y, Shigaki H, et al. Preoperative nutritional assessment by Controlling Nutritional Status (CONUT) is useful to estimate postoperative morbidity after esophagectomy for esophageal cancer. World J Surg. 2016;40:1910–1917. [DOI] [PubMed] [Google Scholar]
- 10.Mitzman B, Schipper PH, Edwards MA, Kim S, Ferguson MK. Complications after esophagectomy are associated with extremes of body mass index. Ann Thorac Surg. 2018;106:973–980. [DOI] [PubMed] [Google Scholar]
- 11.Lis CG, Gupta D, Lammersfeld CA, Markman M, Vashi PG. Role of nutritional status in predicting quality of life outcomes in cancer—a systematic review of the epidemiological literature. Nutr J. 2012;11:27. [DOI] [PMC free article] [PubMed] [Google Scholar]
- 12.Camp NL. Food insecurity and food deserts. Nurse Pract. 2015;40:32–36. [DOI] [PubMed] [Google Scholar]
- 13.Wang N, Cao F, Liu F, et al. The effect of socioeconomic status on health-care delay and treatment of esophageal cancer. J Transl Med. 2015;13:241. [DOI] [PMC free article] [PubMed] [Google Scholar]
- 14.Huddy JR, Huddy FMS, Markar SR, Tucker O. Nutritional optimization during neoadjuvant therapy prior to surgical resection of esophageal cancer—a narrative review. Dis Esophagus. 2018;31:1–11. [DOI] [PubMed] [Google Scholar]
- 15.Fay KA, Maeder ME, Emond JA, et al. Residing in a food desert is associated with an increased risk of readmission following esophagectomy for cancer. J Thorac Dis. 2022;14:1854–1868. [DOI] [PMC free article] [PubMed] [Google Scholar]
- 16.Dutko P, Ver Ploeg M, Farrigan T. Characteristics and Influential Factors of Food Deserts. United States Department of Agriculture. Economic Research Report, Number 140 August 2012. Accessed January 1, 2023. https://www.ers.usda.gov/webdocs/publications/45014/30940_err140.pdf
- 17.Karpyn A, Manon M, Treuhaft S, Giang T, Harries C, McCoubrey K. Policy solutions to the “grocery gap.” Health Aff (Millwood). 2010;29:473–480. [DOI] [PubMed] [Google Scholar]
- 18.U.S. Department of Agriculture. Economic Research Service. Food Access Research Atlas. Accessed September 1, 2020. https://www.ers.usda.gov/data-products/food-access-research-atlas [Google Scholar]
- 19.Morris AA, McAllister P, Grant A, et al. Relation of living in a “food desert” to recurrent hospitalizations in patients with heart failure. Am J Cardiol. 2019;123:291–296. [DOI] [PMC free article] [PubMed] [Google Scholar]
- 20.Smith EJT, Ramirez JL, Wu B, et al. Living in a food desert is associated with 30-day readmission after revascularization for chronic limb-threatening ischemia. Ann Vasc Surg. 2021;70:36–42. [DOI] [PubMed] [Google Scholar]
- 21.Fong AJ, Lafaro K, Ituarte PHG, Fong Y. Association of living in urban food deserts with mortality from breast and colorectal cancer. Ann Surg Oncol. 2021;28:1311–1319. [DOI] [PMC free article] [PubMed] [Google Scholar]
- 22.Dindo D, Demartines N, Clavien PA. Classification of surgical complications: a new proposal with evaluation in a cohort of 6336 patients and results of a survey. Ann Surg. 2004;240:205–213. [DOI] [PMC free article] [PubMed] [Google Scholar]
- 23.The Society of Thoracic Surgeons. STS National Database. Accessed January 1, 2023. https://www.sts.org/registries/sts-national-database
- 24.United States Census Bureau. Quick Facts. Accessed January 1, 2023. https://www.census.gov/quickfacts/fact/table/US/PST045219
- 25.Ozawa Y, Nakano T, Taniyama Y, et al. Evaluation of the impact of psoas muscle index, a parameter of sarcopenia, in patients with esophageal squamous cell carcinoma receiving neoadjuvant therapy. Esophagus. 2019;16:345–351. [DOI] [PubMed] [Google Scholar]
- 26.Ambroggi M, Biasini C, Del Giovane C, Fornari F, Cavanna L. Distance as a barrier to cancer diagnosis and treatment: review of the literature. Oncologist. 2015;20:1378–1385. [DOI] [PMC free article] [PubMed] [Google Scholar]
- 27.Bradley CJ, Stevens JL, Enewold L, Warren JL. Stage and mortality of low-income patients with cancer: Evidence from SEER-Medicaid. Cancer. 2021;127:229–238. [DOI] [PubMed] [Google Scholar]
- 28.Bradley CJ, Given CW, Roberts C. Disparities in cancer diagnosis and survival. Cancer. 2001;91:178–188. [DOI] [PubMed] [Google Scholar]
- 29.Makiura D, Ono R, Inoue J, et al. Impact of sarcopenia on unplanned readmission and survival after esophagectomy in patients with esophageal cancer. Ann Surg Oncol. 2018;25:456–464. [DOI] [PubMed] [Google Scholar]
- 30.Rochefort MM, Tomlinson JS. Unexpected readmission after major cancer surgery: an evaluation of readmissions as a quality of care indicator. Surg Oncol Clin N Am. 2012;21:397–405. [DOI] [PubMed] [Google Scholar]
- 31.Reece L, Hogan S, Allman-Farinelli M, Carey S. Oral nutrition interventions in patients undergoing gastrointestinal surgery for cancer: a systematic literature review. Support Care Cancer. 2020;28:5673–5691. [DOI] [PubMed] [Google Scholar]
- 32.Lobo DN, Gianotti L, Adiamah A, et al. Perioperative nutrition: recommendations from the ESPEN expert group. Clin Nutr. 2020;39:3211–3227. [DOI] [PubMed] [Google Scholar]