

Abstract
Objective
Adopting a healthy lifestyle, including regular physical activity, is widely believed to decrease cancer risk. This study aimed to quantitatively establish the dose‐response relationships between total physical activity and the risk of breast, colon, lung, gastric, and liver cancers.
Methods
A systematic review and dose‐response analysis were conducted using PubMed and Embase from January 1, 1980 to March 20, 2023. Prospective cohort studies that examined the association between physical activity and the risks of any of the 5 outcomes were included. The search was confined to publications in the English language with a specific focus on human studies. Physical activity is standardized by using the data from US National Health and Nutrition Examination Surveys (NHANES) and the Global Burden of Disease 2019 database.
Results
A total of 98 studies, involving a combined population of 16,418,361 individuals, were included in the analysis. Among the included studies, 57 focused on breast cancer, 17 on lung cancer, 23 on colon cancer, 5 on gastric cancer, and 7 on liver cancer. Overall, elevated levels of physical activity exhibited an inverse correlation with the risk of cancer. The dose‐response curve for lung cancer exhibited a non‐linear pattern, with the greatest benefit risk reduction observed at 13,200 MET‐minutes/week of physical activity, resulting in a 14.7% reduction in risk (relative risk 0.853, uncertainty interval 0.798 to 0.912) compared to the inactive population. In contrast, the dose‐response curves for colon, gastric, breast, and liver cancers showed linear associations, indicating that heightened levels of total physical activity were consistently associated with reduced cancer risks. However, the increase in physical activity yielded a smaller risk reduction for colon and gastric cancers compared to breast and liver cancers. Compared to individuals with insufficient activity (total activity level < 600 MET‐minutes/week), individuals with high levels of activity (≥ 8,000 MET‐minutes/week) experienced a 10.3% (0.897, 0.860 to 0.934) risk reduction for breast cancer; 5.9% (0.941, 0.884 to 1.001) for lung cancer; 7.1% (0.929, 0.909 to 0.949) for colon cancer; 5.1% (0.949, 0.908 to 0.992) for gastric cancer; 17.1% (0.829, 0.760 to 0.903) for liver cancer.
Conclusions
This study demonstrated a significant inverse relationship between total physical activity and the risk of breast, gastric, liver, colon, and lung cancers.
Keywords: cancer risk, dose‐response analysis, Global Burden of Disease, physical activity
List of abbreviations
- WHO
World Health Organization
- MET
metabolic equivalent
- GBD
Global Burden of Disease
- PRISMA
Reporting Items for Systematic Reviews and Meta‐Analyses
- PROSPERO
international prospective register of systematic reviews
- MOOSE
Meta‐analysis of Observational Studies in Epidemiology
- RR
relative risk
- HR
hazard ratio
- OR
odds ratio
- CI
confidence interval
- SE
standard error
- BMI
body mass index
- NOS
Newcastle‐Ottawa Scale
- NHANES
National Health and Nutrition Examination Surveys
- GPAQ
Global Physical Activity Questionnaire
- IPAQ
International Physical Activity Questionnaire
- RCS
restricted cubic spline
1. BACKGROUND
Cancer is widely recognized as a major contributor to global morbidity and mortality [1]. However, adopting a healthy lifestyle has the potential to prevent a significant portion of cancer cases, and addressing modifiable risk factors presents a financially feasible approach to cancer control [2]. Despite the well‐documented protective effect of physical activity on various types of cancers, only a limited number of studies have systematically examined the dose‐response relationships between physical activity and cancer endpoints. Existing systematic reviews that investigated the dose‐response relationships between physical activity and specific cancers, such as breast cancer, gastric cancer, liver cancer, colon cancer, and lung cancer, mostly concentrated on a narrow range of activities, such as recreational physical activities [3, 4, 5]. However, relying solely on a single category of physical activity fails to provide a complete understanding as it represents only a small fraction of daily physical activity [6, 7]. It is worth noting that all forms of physical activities are beneficial to health and are recommended by the World Health Organization (WHO) [8]. By solely considering one aspect of physical activity, previous studies may have produced biased results and overlooked the potential insights from other domains. Therefore, it is critical to improve our knowledge regarding the association between physical activity and cancer risk, and to present a comprehensive perspective encompassing various cancer types and locations.
The precise quantification and examination of the dose‐response relationship between overall physical activity and its impact on health outcomes are crucial. However, the current absence of a standardized method to measure this relationship poses a challenge. There is significant diversity in how physical activity is qualitatively or quantitatively assessed and classified in individual studies. As a result, most meta‐analyses fail to thoroughly evaluate the dose‐response correlation between physical activity and various diseases. To address this pressing issue and gain comprehensive insights into the effects of different activity levels on disease outcomes, the standardization of physical activity assessment across studies is urgently needed.
Metabolic equivalent (MET) refers to the amount of oxygen consumption necessary for sustaining basal metabolic functions at rest [9]. The WHO recommends a minimum of 600 MET‐minutes/week of total activity across all domains to attain health benefits [9]. For instance, this could be achieved by engaging in 133 minutes/week of household work. Despite the established association between physical exercise and specific diseases, such as breast cancer, gastric cancer, liver cancer, colon cancer, and lung cancer, the extent to which the risk diminishes with increasing overall activity remains poorly understood [10, 11]. To date, no study has examined the specific quantitative relationship between the risks of these diseases and total physical activity using a dose‐response approach.
In this study, we conducted a dose‐response analysis to determine the relationship between total physical activity, standardized on a continuous scale (MET‐minutes/week), and the aforementioned 5 outcomes (breast cancer, gastric cancer, liver cancer, colon cancer, and lung cancer) within the context of the Global Burden of Disease (GBD) 2019.
2. MATERIALS AND METHODS
2.1. Literature search
This systematic analysis was conducted in accordance with the Preferred Reporting Items for Systematic Reviews and Meta‐Analyses (PRISMA) [12] and Meta‐analysis of Observational Studies in Epidemiology (MOOSE) guidelines [13]. The protocol (Supplementary Materials) outlined the methods employed in this study. We conducted a comprehensive search of PubMed (https://pubmed.ncbi.nlm.nih.gov/) and Embase databases (https://www.embase.com/) from January 1, 1980 to March 20, 2023, aiming to identify studies that investigated the association between physical activity and the risks of any of the 5 outcomes (breast cancer, colon cancer, lung cancer, gastric cancer, and liver cancer). Our search was limited to English‐language publications and studies conducted on human subjects. Details of the search strategies were summarized in Supplementary Materials.
2.2. Study selection
To identify eligible studies for further dose‐response analysis, the following inclusion criteria were applied based on the evaluation of titles and abstracts: (1) the exposure variable must pertain to the level of physical activity, encompassing either total activity or domain‐specific activity that allows conversion to total activity; (2) the outcome indicator must focus on the incidence of at least one of the 5 selected diseases; (3) the study design must be a prospective cohort study; (4) the risk estimates (relative risk [RR], hazard ratio [HR], or odds ratio [OR]) with corresponding 95% confidence intervals (CI) or standard errors (SE) should be provided, or the necessary information should be available to calculate them. Prospective cohort studies were specifically included to minimize common biases, such as recall and selection biases commonly observed in case‐control studies. For studies that qualitatively categorize physical activity levels (e.g., low, moderate, and high) without specifying MET values, the reported number of individuals or person‐years within each activity category must also be provided.
2.3. Data extraction
Three authors (Xiayao Diao, Yutong Ling, and Yi Zeng) extracted data independently using a standardized data extraction form. Differences were adjudicated by a fourth investigator until a consensus was reached on each item. The following variables were extracted from each study included in the analysis: authors, publication year, country of study, follow‐up time, gender, baseline age, types of physical activity (leisure‐time/recreation, household, occupational, and/or transportation‐related activities), method used to measure physical activity, duration, frequency, and/or intensity of physical activity, quantification of physical activity (e.g., minutes/week, MET‐hours/week), sample size, response rate, number of cases and individuals in each category, risk estimates with corresponding 95% CI, and confounding factors adjusted in multivariable analysis.
The studies on breast cancer included only the female population. In cases where multiple RRs were presented, we extracted the RRs derived from the multivariate model that offered the most comprehensive adjustment for confounding variables. Among studies reporting identical data and study duration, we prioritized inclusion of the study that provided more detailed information on physical activity levels and demonstrated better control for confounding variables. Key confounding factors commonly considered in these studies encompassed age, body mass index (BMI), smoking history, family history of relevant outcomes, estrogen and progesterone exposure (for breast cancer), and lifestyle factors.
2.4. Assessment of quality of included studies
Two researchers evaluated the methodological quality of the included studies using the Newcastle‐Ottawa Scale (NOS) [14]. The assessment covered several key areas: (1) representativeness of the cohort; (2) determining whether the unexposed group was drawn from the same population as the exposed group; (3) ascertainment of exposure; (4) establishing whether the outcome of interest was absent at the beginning of the study; (5) comparability of the exposed and unexposed group (i.e., adjustment for potential confounding variables); (6) ascertainment of the outcome; (7) evaluating whether the length of the follow‐up period was sufficiently long (≥ 5 years) for the occurrence of the outcome; and (8) assessing the completeness of the follow‐up (loss to follow up < 20%). For most items, a maximum score of 1 could be given, while comparability allowed for a maximum score of 2. The score range was 0 to 9, with a score of ≥ 6 indicating high quality for a particular study.
2.5. Preparation of data for dose‐response analysis
In order to ensure consistency across studies encompassing various categories of physical activities, we need to standardize the measurement of domain‐specific physical activity. We used total MET‐minutes/week as the metric for assessing domain‐specific physical activity. Domain‐specific physical activity refers to the activities performed in different domains of an individual's life, such as recreational, household, transportation‐related, and occupational activities. To clarify, the term MET stands for Metabolic Equivalent of Task, which signifies the ratio of the working metabolic rate to the resting metabolic rate. Specifically, one MET is defined as the quantity of oxygen consumed while an individual is in a state of quiet sitting, amounting to about 3.5 mL of oxygen per kilogram (O2/kg) of body weight/min [15].
In light of the fact that the majority of cohort studies are conducted in developed countries, we employed data derived from the US National Health and Nutrition Examination Surveys (NHANES) from 2017 to 2020. This dataset was utilized to perform logarithmic‐logarithmic ordinary least squares regression analysis to determine the association between total activity and domain‐specific activities [16].
NHANES, a comprehensive survey administered on a national scale, employs the Global Physical Activity Questionnaire (GPAQ) as a means to measure leisure, transportation, and occupational activities [17]. This particular instrument enables the establishment of a framework for relating domain‐specific metrics to overall activity levels spanning all domains.
One limitation arises from the NHANES survey's lack of explicit inclusion of household physical activities, which stands in contrast to the International Physical Activity Questionnaire (IPAQ) that encompasses various types of physical activities, including those performed within the household. However, previous studies comparing the assessment of physical activity levels between men and women in developed countries using the GPAQ and IPAQ have revealed no statistically significant differences [18].
The regression coefficients were applied to determine the MET‐minutes/week thresholds for domain‐specific activity categories in the included studies. These thresholds were either reported as MET‐minutes/week or converted directly to MET‐minutes/week. By applying these coefficients, we derived an estimated total weekly activity level corresponding to each RR level.
In cases where physical activity was measured quantitatively, but not in METs, we calculated MET‐minutes/week by utilizing the reported duration and intensity of the activities. We assigned a value of 3.3 METs to the time spent on walking, 4 METs to activities of moderate intensity, and 8 METs to vigorous activities, in accordance with the guidelines provided by the WHO [9].
For studies that employed qualitative assessments of physical activity (e.g., low, moderate, and high) without additional information on activity duration and intensity, we calculated the percentiles of activity distribution and mapped them to the exposure distribution in the GBD 2019 (in MET‐minutes/week) to generate estimates of overall physical activity [19]. Specifically, we assigned a percentile to each reported activity category based on the percentage of the study population belonging to that activity category. Additionally, percentiles were assigned to each GBD 2019 MET‐minute cutoff points (600, 3,999, and 8,000 MET‐minutes/week) based on the estimated exposure distribution from GBD 2019. Within each activity category, we assumed a uniform distribution of exposure. By mapping the percentiles from the studies to those assigned in the GBD 2019 distribution of physical activity exposure, we determined the corresponding MET‐minute values to serve as cutoff points for each activity category reported by a study.
2.6. Data analysis
All statistical analyses were conducted using R software (version: 4.3.0), and all tests were two‐sided. In cases where a study provided separate HR or RR estimates for different subgroups (e.g., male vs. female, premenopausal vs. postmenopausal), we treated each subgroups as a distinct study entity [20]. In epidemiological studies, 3 potential dose‐response relationships are commonly observed: linear, non‐linear, and categorical dose‐response relationships [21]. To establish dose‐response relationships, we employed a regression analysis, treating total physical activity (expressed in MET‐minutes/week) as the independent continuous variable, while the dependent variable was the estimation of cancer incidence risk. Initially, we assumed all outcomes to be non‐linear and used a restricted cubic spline (RCS) function to fit the dose‐response curve [22, 23]. The Wald test was used to assess non‐linearity with the null hypothesis assuming that the coefficients of the non‐linear terms are 0 [24]. A P < 0.05 for the Wald test indicated a non‐linear model, prompting further curve fitting using a restricted three‐sample model. Three nodes were set at the 10%, 50%, and 90% percentiles of the total physical activity distribution, selecting the appropriate node according to the actual situation [23, 24]. For results with a Wald test P > 0.05, a linear model was employed. Statistical heterogeneity among studies was assessed using the Q and I 2 statistics [25], with P < 0.1 or I 2 > 50% indicating heterogeneity [26]. A random effects model (maximum likelihood estimation) was employed for studies exhibiting heterogeneity, while a fixed effects model was used for those without heterogeneity. Studies with missing data on the numbers of participants or cases were excluded from the analysis process.
2.7. Sensitivity analysis and publication bias
To assess the influence of the quality of the included studies on the overall findings, a sensitivity analysis was conducted to evaluate the impact of study quality on the pooled RR by excluding studies with NOS scores < 6. To further assess the influence of imprecise exposure measurement, additional sensitivity analyses were performed. These analyses were conducted separately for studies that measured physical activity quantitatively and those that assessed it qualitatively. For studies employing qualitatively measurement, MET‐minutes were estimated using the GBD 2019 exposure data. To examine the potential for publication bias, funnel plots and the Egger test were employed [27]. These methods allowed for the assessment of any systematic biases in the published studies that could impact the overall findings.
3. RESULTS
3.1. Overall analysis
We identified a total of 5,625 citations through the literature search (Figure 1). After removing duplicate citations, 3,448 studies remained to be screened by reading titles and abstracts. Among these, 180 studies required full‐text reading. We excluded 82 articles that either used the same dataset as other included studies or had insufficient data (e.g., lack of information on the number of individuals or person‐years per activity category needed to convert from qualitative activity levels to MET).
FIGURE 1.
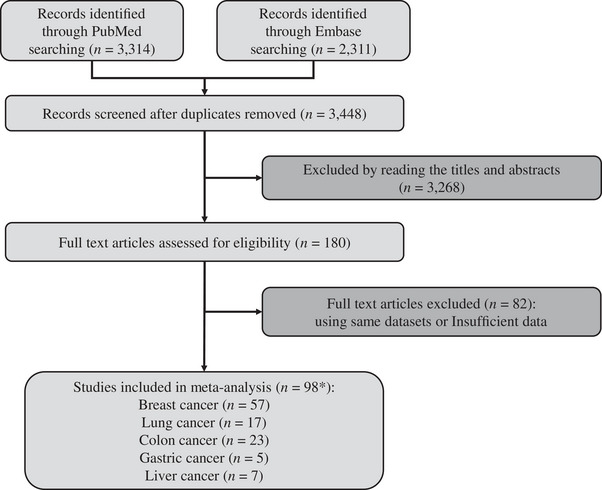
Flow chart of selecting studies for inclusion in dose‐response analysis. *, number of included studies for each outcome adds up to more than 98 because some studies include multiple outcomes.
Our dose‐response analysis included a total of 98 studies, encompassing multiple outcomes and involving a total of 16,418,361 individuals. Specifically, there were 57 studies for breast cancer (4,529,980 individuals), 17 studies for lung cancer (2,561,055 individuals), 23 studies for colon cancer (4,123,457 individuals), 5 studies for gastric cancer (3,129,454 individuals), and 7 studies for liver cancer (2,074,415 individuals). To facilitate the analysis of the collected data, we organized the information obtained from the literature into data tables that fulfilled the requirements for dose‐response relationship analysis. For a detailed overview of each included study, please refer to Supplementary Tables S1‐S6.
3.2. Continuous dose‐response relations
The scatter plots and dose‐response curves illustrating the incidence of the 5 cancers with respect to total physical activity levels are shown in Figures 2, 3, 4, 5, 6, 7. The Wald test for lung cancer risk yielded a P < 0.05, indicating a statistically significant non‐linear relationship. Consequently, an RCS model was selected for further analysis. Conversely, for the remaining 4 cancer types, linear models were chosen as their P values exceeded 0.1. Notably, 3 of the disease risk models (colon cancer, gastric cancer, and liver cancer) demonstrated no heterogeneity, as evidenced by an I 2 of 0%. Thus, these 3 models were combined using a fixed‐effects model. In contrast, the 2 remaining models (breast cancer and lung cancer) exhibited heterogeneity with I 2 values of 37.1% and 45.9%, respectively. Therefore, a random‐effects models was employed to combine the findings of these 2 models. The parameters of these 5 dose‐response risk models are included in Supplementary Table S7.
FIGURE 2.
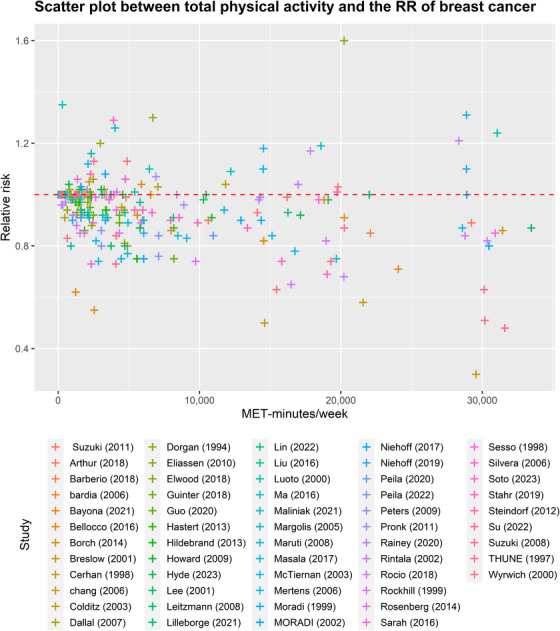
Scatter plot between total physical activity in MET‐minutes/week and the RR of breast cancer. Different colors indicate different studies. Each point represents the average exposure level of individual. The horizontal axis indicates the total physical activity interval in MET‐minutes/week, and the vertical axis indicates the RR. Abbreviations: MET, metabolic equivalent; RR, relative risk.
FIGURE 3.
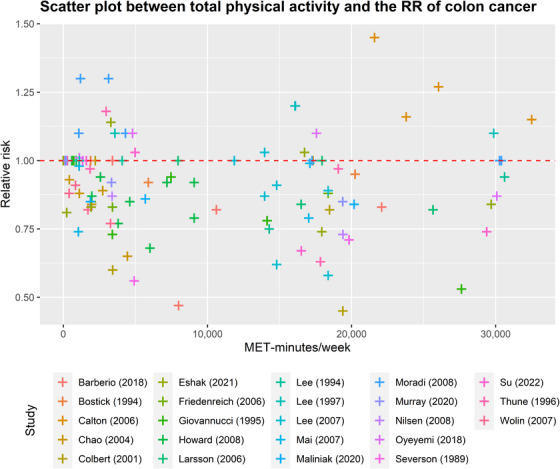
Scatter plot between total physical activity in MET‐minutes/week and the RR of colon cancers. Different colors indicate different studies. Each point represents the average exposure level of individual. The horizontal axis indicates the total physical activity interval in MET‐minutes/week, and the vertical axis indicates the RR. Abbreviations: MET, metabolic equivalent; RR, relative risk.
FIGURE 4.
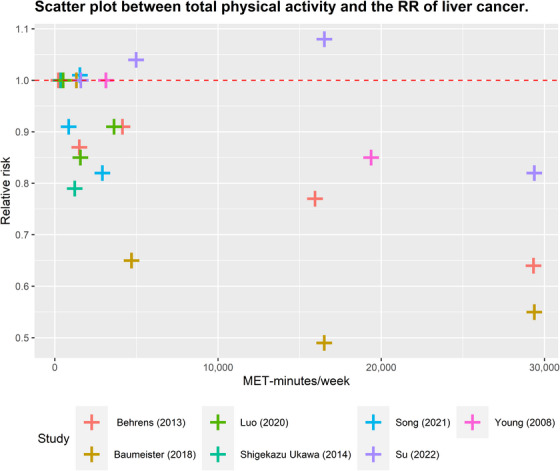
Scatter plot between total physical activity in MET‐minutes/week and the RR of liver cancer. Different colors indicate different studies. Each point represents the average exposure level of individual. The horizontal axis indicates the total physical activity interval in MET‐minutes/week, and the vertical axis indicates the RR. Abbreviations: MET, metabolic equivalent; RR, relative risk.
FIGURE 5.
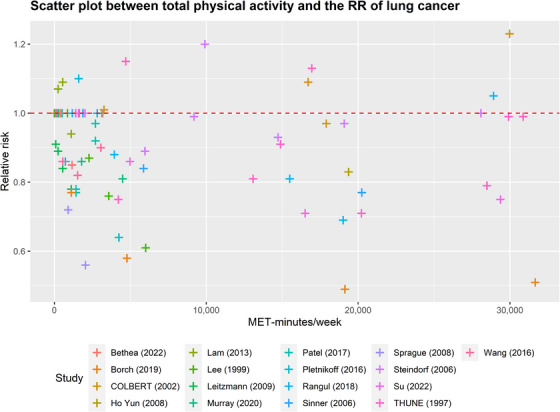
Scatter plot between total physical activity in MET‐minutes/week and the RR of lung cancer. Different colors indicate different studies. Each point represents the average exposure level of individual. The horizontal axis indicates the total physical activity interval in MET‐minutes/week, and the vertical axis indicates the RR. Abbreviations: MET, metabolic equivalent; RR, relative risk.
FIGURE 6.
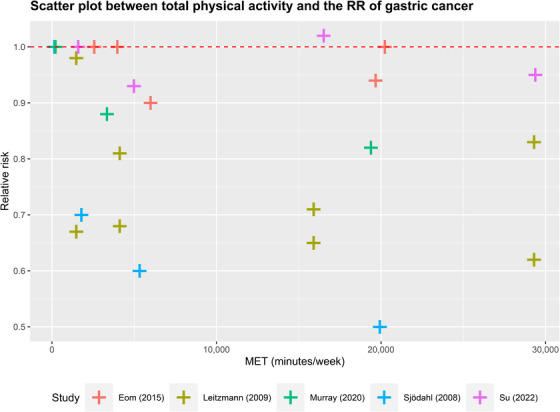
Scatter plot between total physical activity in MET‐minutes/week and the RR of gastric cancer. Different colors indicate different studies. Each point represents the average exposure level of individual. The horizontal axis indicates the total physical activity interval in MET‐minutes/week, and the vertical axis indicates the RR. Abbreviations: MET, metabolic equivalent; RR, relative risk.
FIGURE 7.
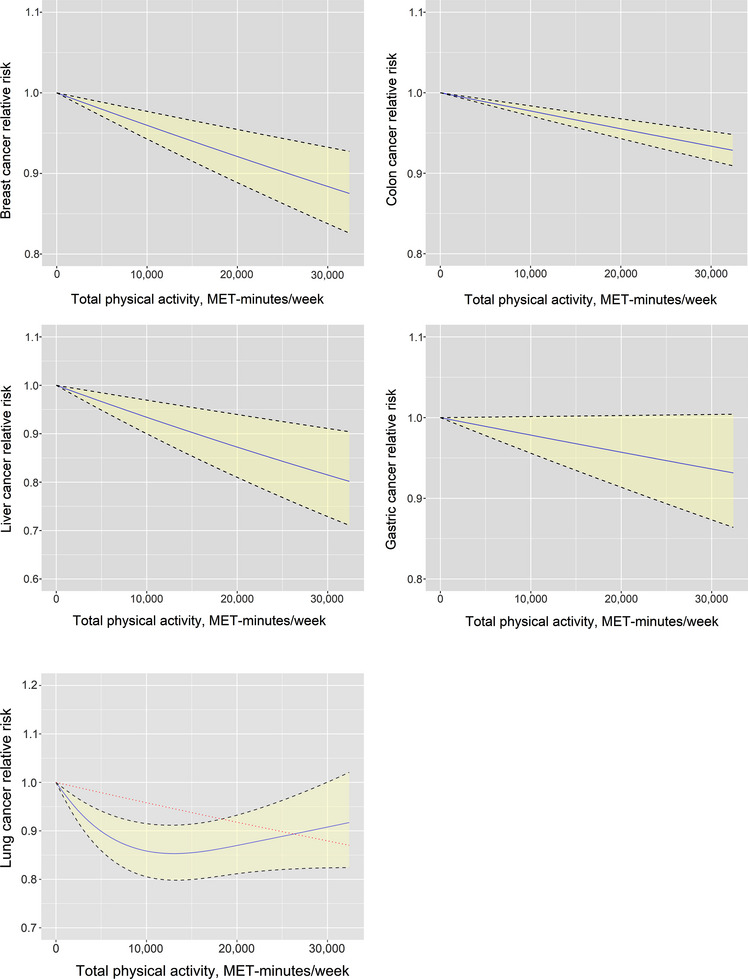
Continuous risk curve for association between physical activity and 5 cancers (breast cancer, colon cancer, liver cancer, gastric cancer, and lung cancer). The RR is represented by the blue solid line and the 95% CI by the black dashed lines on either side of the solid line. The red dashed line represents the linear model in lung cancer. The horizontal axis indicates the total physical activity interval in MET‐minutes/week, and the vertical axis indicates the RR. Abbreviations: MET, metabolic equivalent; RR, relative risk; CI, confidence interval.
As shown in Figure 7, there exists an inverse relationship between the risk of cancer and the level of physical activity in the context of lung cancer (more detailed data are provided in Supplementary Table S6). The risk of developing lung cancer demonstrated a decreasing trend as the total activity level increased from 0 to 13,200 MET‐minutes/week, resulting in a 14.7% reduction in risk (relative risk 0.853, uncertainty interval 0.798 to 0.912). Notably, individuals engaging in the minimum activity level recommended by the WHO (600 MET‐minutes/week) exhibited a 1.5% lower risk of lung cancer compared to those who are physically inactive. Furthermore, increasing the activity level from 600 to 4,000 MET‐minutes/week yielded a risk reduction of 7.1%. Moreover, an additional reduction of 6.1% in the risk of lung cancer was observed when the activity level was further increased from 4,000 to 13,200 MET‐minutes/week. However, beyond 13,200 MET‐minutes/week, the extent of cancer risk reduction gradually diminished, but the risk remained lower than that of the inactive population. Notably, individuals with a total activity level of 30,000 MET‐minutes/week experienced a 9.2% reduction in the risk of lung cancer.
The dose‐response curves for the remaining 4 types of cancer exhibited a linear pattern, wherein higher levels of total physical activity were associated with a decreased cancer risk. Specifically, increasing overall physical activity levels from 0 to 4,000 minutes/week resulted in risk reductions of 1.6% for breast cancer, 0.9% for colon cancer, 0.9% for gastric cancer, and 2.7% for liver cancer. Furthermore, elevating the activity level from 4,000 to 13,200 MET‐minutes/week yielded additional risk reductions of 3.7%, 2.1%, 2.0%, and 5.9% for breast cancer, colon cancer, gastric cancer, and liver cancer, respectively. Notably, the impact of the same increase in physical activity on colon and gastric cancers was comparatively smaller when compared to breast cancer and liver cancer. More detailed data are presented in Supplementary Table S6.
3.3. Categorical dose‐response relations
Table 1 shows the RR and CI for the association between physical activity and the 5 studied outcomes. The results of the categorical dose‐response analysis revealed significant heterogeneity for breast cancer (P < 0.001) and lung cancer (P = 0.009).
TABLE 1.
Categorical dose‐response relations between physical activity and breast cancer, colon cancer, lung cancer, gastric cancer, and liver cancer.
| Physical activity in MET‐minutes/week | Cancer type | ||||
|---|---|---|---|---|---|
| Breast cancer | Lung cancer | Colon cancer | Gastric cancer | Liver cancer | |
| < 600 | Reference | Reference | Reference | Reference | Reference |
| 600‐3,999 (RR [95% CI]) | 0.947 (0.928 to 0.966) | 0.945 (0.908 to 0.983) | 0.935 (0.899 to 0.973) | 0.897 (0.767 to 1.047) | 0.958 (0.904 to 1.015) |
| 4,000‐7,999 (RR [95% CI]) | 0.905 (0.868 to 0.943) | 0.915 (0.857 to 0.977) | 0.917 (0.873 to 0.963) | 0.934 (0.874 to 0.998) | 0.911 (0.797 to 1.042) |
| ≥ 8,000 (RR [95% CI]) | 0.897 (0.860 to 0.934) | 0.941 (0.884 to 1.001) | 0.929 (0.909 to 0.949) | 0.949 (0.908 to 0.992) | 0.829 (0.760 to 0.903) |
| Heterogeneity (P value) | < 0.001 | 0.009 | 0.999 | 0.791 | 0.234 |
Abbreviations: MET, metabolic equivalent; RR, relative risk; CI, confidence interval.
Women classified under different activity levels exhibited varying risks of breast cancer. Those with low activity levels (600‐3,999 MET‐minutes/week), moderate activity levels (4,000‐7,999 MET‐minutes/week), and high activity levels (≥8,000 MET‐minutes/week) experienced risk reductions of 5.3%, 9.5%, and 10.3%, respectively, compared to women with insufficient activity levels (<600 MET‐minutes /week).
The incidence of lung cancer demonstrated risk reductions of 5.5%, 8.5%, and 5.9% among individuals classified as low‐, moderate‐, and high‐activity populations, respectively, as compared to those who exhibited insufficient levels of physical activity (both men and women). Similarly, for colon cancer, corresponding risk reductions of 6.5%, 8.3%, and 7.1% were observed in the same activity populations.
In the results for gastric cancer and liver cancer, the 95% CI of 3 groups overlapped with 1, indicating that there was no statistically significant difference in cancer incidence risk between the comparable groups. However, when comparing individuals with insufficient physical activity levels to those with moderate and high levels of activity, a risk reduction of 6.6% and 5.1% for gastric cancer was observed, respectively. For liver cancer, individuals with high activity levels exhibited a risk reduction of 17.1% compared to those with insufficient activity levels.
3.4. Sensitivity and publication bias
A sensitivity analysis was conducted to evaluate the influence of study quality on the summary RR values by excluding studies with NOS scores lower than 6. Following the exclusion of such studies, the findings from the categorical dose‐response analysis remained largely consistent. However, it is worth noting that the adjusted association between the risk of breast cancer incidence and physical activity was somewhat diminished. The results are summarized in Table 2.
TABLE 2.
Categorical dose‐response relations between physical activity and breast cancer, colon cancer, lung cancer, gastric cancer, and liver cancer in sensitivity analysis excluding studies with quality score < 6 on NOS.
| Physical activity in MET‐minutes/week | Cancer type | ||||
|---|---|---|---|---|---|
| Breast cancer | Lung cancer | Colon cancer | Gastric cancer | Liver cancer | |
| < 600 | Reference | Reference | Reference | Reference | Reference |
| 600‐3,999 (RR [95% CI]) | 0.977 (0.960 to 0.993) | 0.945 (0.908 to 0.983) | 0.927 (0.881 to 0.975) | 0.897 (0.767 to 1.047) | 0.958 (0.904 to 1.015) |
| 4,000‐7,999 (RR [95% CI]) | 0.953 (0.931 to 0.976) | 0.915 (0.857 to 0.977) | 0.901 (0.825 to 0.984) | 0.934 (0.874 to 0.998) | 0.911 (0.797 to 1.042) |
| ≥ 8,000 (RR [95% CI]) | 0.944 (0.935 to 0.952) | 0.941 (0.884 to 1.001) | 0.899 (0.855 to 0.945) | 0.949 (0.908 to 0.992) | 0.829 (0.760 to 0.903) |
| Heterogeneity (P value) | <0.001 | 0.009 | 0.836 | 0.791 | 0.234 |
Abbreviations: MET, metabolic equivalent; RR, relative risk; CI, confidence interval; NOS, Newcastle‐Ottawa Scale.
Publication bias in the included studies was evaluated using funnel plots and Egger's test. The analysis revealed evidence of publication bias in breast cancer (P = 0.038) and gastric cancer (P = 0.004). However, no significant publication bias was found in lung cancer (P = 0.922), colon cancer (P = 0.613), and liver cancer (P = 0.478) (refer to Supplementary Table S7).
4. DISCUSSION
This analysis attempted to quantify the dose‐response relationship between overall physical activity across various domains and the risk of specific cancers. Our investigation involved data from 98 cohort studies, allowing us to calculate the RRs of cancers for different levels of total physical activity measured in MET‐minutes/week. The findings from our dose‐response analysis indicated a consistent trend: as overall levels of physical activity increased, the risk of cancers decreased. While a non‐linear association was observed between lung cancer risk and overall physical activity, the remaining 4 cancer types exhibited linear relationships with physical activity. Notably, the lowest risk of lung cancer was observed at a level of 13,200 MET‐minutes/week of physical activity. Our results showed that the impact of physical activity on breast cancer and liver cancer was stronger than that on colon cancer and gastric cancer, indicating that higher levels of physical activity are associated with greater risk reduction for breast and liver cancers. Additionally, our study suggests that meeting the international physical activity recommendations may not lead to a substantial reduction in the incidence of specific cancers.
This study offers notable extensions and unveils novel insights in comparison to previous meta‐analyses. Firstly, our analysis encompassed a larger pool of studies, surpassing the scope of previous quantitative dose‐response analyses. To ensure comprehensive coverage, we conducted a meticulous literature search published from January 1, 1980 to March 20, 2023 in PubMed and Embase databases. Secondly, while previous systematic reviews predominantly focused on specific areas of the dose‐response relationship between physical activity and cancer [3, 5], our study took a broader perspective by quantifying total physical activity across all domains. This approach allowed us to explore the relationship between physical activity and 5 specific cancers comprehensively. Lastly, by evaluating the dose‐response correlation between physical activity and these 5 specific cancers, our study contributed to the enhanced significance and applicability of our findings in real‐world contexts.
Previous dose‐response analyses exploring the relationship between physical activity and cancer have identified a linear association in various cancer types [18, 28, 29]. Our study aligns with these previous findings, demonstrating that increased levels of physical activity are associated with a reduced incidence of breast, gastric, and colon cancers. However, in contrast to Lin et al. [30], which reported no significant relationship between physical activity and liver cancer, our study found that as physical activity increased, the probability of developing liver cancer decreased.
Our study provided novel insights into the relationship between physical activity and cancer risk. Contrary to the assumption of a linear inverse association, we found a non‐linear relationship between total physical activity and lung cancer risk. Beyond a threshold of 13,200 MET‐minutes/week, the reduction in lung cancer risk gradually diminishes; however, the risk remains lower than that of the inactive population. On the other hand, the dose‐response curves for the remaining four cancer types demonstrated a linear pattern, indicating that higher levels of overall physical activity are associated with a decreased risk of cancer. A distinguishing factor of our study is the coverage of a broader range of physical activities. This differs from most prior studies that focus on a specific type of physical activity, which constitutes a small fraction of total activity. As a result, our findings hold greater practical relevance in real‐world scenarios. Additionally, our study employs a novel methodology, which provides fresh perspectives for dose‐response analysis studies utilizing different exposure classifications. Overall, our research contributes valuable insights to the field, shedding light on the nuanced relationship between physical activity and cancer risk.
Our study presents several notable advantages. Firstly, in comparison to previous dose‐response analyses on breast cancer, gastric cancer, liver cancer, colon cancer, and lung cancer, our study boasts a significantly broader scope of data coverage. This expanded dataset enhances the robustness and generalizability of our findings. Secondly, we employed a standardized assessment of physical activity, improving comparability across studies. Rather than employing a qualitative classification approach, our methodology ensured a more precise and consistent measurement of physical activity. Thirdly, our study encompassed a diverse range of physical activity categories, capturing a comprehensive overview of the association between physical activity and cancer risk.
Despite the above strengths, our study still has several limitations that should be acknowledged. Firstly, the search process limited to two databases and English publications may have resulted in the omission of relevant articles. While language‐unrestricted systematic reviews have reported limited non‐English researches, the combination of Embase and Medline databases provides substantial coverage. Secondly, unmeasured variables and/or potential effect modifiers may have influenced the observed relationship between physical activity and cancer risk. As our analysis relied on data derived from cohort studies, we were unable to account for recurrent confounding or effect modification. In order to explore potential confounding factors, we conducted a stratified analysis using the publication periods of the studies (1982‐2000, 2001‐2010, 2011‐2023) and the geographic regions of the study populations (North America, Europe, Asia) as stratification variables. Gastric and liver cancers were not involved in the analysis because fewer than 10 studies were included. After stratification, we recalculated the point estimates and interval estimates of the model coefficients, and the results showed that the directions of the model coefficients were consistent in breast, colon, and lung cancers. It can be assumed that the stratification factor did not have much effect on the results. Table 1 and Table 2 show significant heterogeneity in the results of categorical dose‐response analysis for breast and lung cancers. We recalculated heterogeneity after stratifying by the above 2 factors, and no significant heterogeneity was detected, the heterogeneity in breast and lung cancers needs to be investigated further. Thirdly, the test for publication bias indicated significant findings for breast and gastric cancers, suggesting the possibility of selective reporting. Finally, we used NHANES survey from 2017 to 2020 to estimate total activity across all domains, which may introduce some degree of imprecision, particularly for countries not represented in the survey. Additionally, the relatively short time period covered by the NHANES survey warrants consideration. Acknowledging these limitations, our study provides valuable insights into the association between physical activity and cancer risk, but further research is warranted to address these shortcomings and expand upon our findings.
5. CONCLUSIONS
Our study highlighted a significant association between higher level of total physical activity and a reduced risk of breast cancer, gastric cancer, liver cancer, colon cancer, and lung cancer. However, the role of physical activities in reducing the incidence of specific cancers may vary. Particularly, we observed that individuals engaging in 13,200 MET‐minutes/week of physical activity had the lowest risk of lung cancer. Further research focusing on the detailed quantification of total physical activity is warranted in order to provide more precise estimates regarding the relationship between different levels of physical activity and the probability of developing various cancers. Such investigations will contribute to a better understanding of the role of physical activity in cancer prevention.
DECLARATIONS
AUTHOR CONTRIBUTIONS
Haibo Qiu, Shanqing Li, and Zhicheng Du conceived, designed, and supervised the study. Xiayao Diao, Yudong Ling, and Yi Zeng developed and implemented the literature search strategy and drafted the manuscript. Xiayao Diao, Yudong Ling, Yi Zeng, Chao Guo, Yukai Jin, Xiaojiang Chen, Shoucheng Feng, Jianrong Guo, Chao Ding, and Feiyu Diao reviewed the literature search results and data abstraction. Zhicheng Du and Yueqian Wu carried out statistical analysis. All authors read and approved the final manuscript.
CONFLICTS OF INTERESTS STATEMENT
The authors declare that they have no competing interests.
FUNDING INFORMATION
This study was supported by the Natural Science Foundation of Guangdong Province (2022A1515012347), the Beijing CSCO research fund (Y‐2019Roche‐157), the Science and Technology Project of Guangdong (2014A020212331), the National Natural Science Foundation of China (82001672), and the National High Level Hospital Clinical Research Funding (2022‐PUMCH‐B‐011).
ETHICS APPROVAL AND CONSENT TO PARTICIPATE
Not applicable.
CONSENT FOR PUBLICATION
Not applicable.
Supporting information
Supporting information
Supporting information
ACKNOWLEDGEMENTS
The authors thank all of the people who helped with this study.
Diao X, Ling Y, Zeng Y, Wu Y, Guo C, Jin Y, et al. Physical activity and cancer risk: a dose‐response analysis for the Global Burden of Disease Study 2019. Cancer Commun.. 2023;43:1229–1243. 10.1002/cac2.12488
Xiayao Diao, Yudong Ling, and Yi Zeng has contributed equally to this work.
Contributor Information
Zhicheng Du, Email: duzhch5@mail.sysu.edu.cn.
Shanqing Li, Email: lishanqing@pumch.cn.
Haibo Qiu, Email: qiuhb@sysucc.org.cn.
DATA AVAILABILITY STATEMENT
The data that support the findings of this study are included in this published article and its supplementary information files.
REFERENCES
- 1. Torre LA, Siegel RL, Ward EM, Jemal A. Global cancer incidence and mortality rates and trends–An update. Cancer Epidemiol Biomarkers Prev. 2016;25(1):16–27. [DOI] [PubMed] [Google Scholar]
- 2. Clinton SK, Giovannucci EL, Hursting SD. The World Cancer Research Fund/American Institute for Cancer Research Third Expert Report on Diet, Nutrition, Physical Activity, and Cancer: Impact and Future Directions. J Nutr. 2020;150(4):663–671. [DOI] [PMC free article] [PubMed] [Google Scholar]
- 3. Sjodahl K, Jia C, Vatten L, Nilsen T, Hveem K, Lagergren J. Body mass and physical activity and risk of gastric cancer in a population‐based cohort study in Norway. Cancer Epidemiol Biomarkers Prev. 2008;17(1):135‐140. [DOI] [PubMed] [Google Scholar]
- 4. Ukawa S, Tamakoshi A, Wakai K, Kurozawa Y. Associations of daily walking and television viewing time with liver cancer mortality: findings from the Japan Collaborative Cohort Study. Cancer Causes Control. 2014;25(7):787–793. [DOI] [PubMed] [Google Scholar]
- 5. Moradi T, Gridley G, Bjork J, Dosemeci M, Ji BT, Berkel HJ, et al. Occupational physical activity and risk for cancer of the colon and rectum in Sweden among men and women by anatomic subsite. Eur J Cancer Prev. 2008;17(3):201–208. [DOI] [PMC free article] [PubMed] [Google Scholar]
- 6. Dong L, Block G, Mandel S. Activities Contributing to Total Energy Expenditure in the United States: Results from the NHAPS Study. Int J Behav Nutr Phys Act. 2004;1(1):4. [DOI] [PMC free article] [PubMed] [Google Scholar]
- 7. Csizmadi I, Lo Siou G, Friedenreich CM, Owen N, Robson PJ. Hours spent and energy expended in physical activity domains: results from the Tomorrow Project cohort in Alberta, Canada. Int J Behav Nutr Phys Act. 2011;8:110. [DOI] [PMC free article] [PubMed] [Google Scholar]
- 8. Global Recommendations on Physical Activity for Health. WHO Guidelines Approved by the Guidelines Review Committee. Geneva: 2010. [Google Scholar]
- 9. Haskell WL, Lee IM, Pate RR, Powell KE, Blair SN, Franklin BA, et al. Physical activity and public health: updated recommendation for adults from the American College of Sports Medicine and the American Heart Association. Med Sci Sports Exerc. 2007;39(8):1423–1434. [DOI] [PubMed] [Google Scholar]
- 10. Collaborators GBDRF . Global, regional, and national comparative risk assessment of 79 behavioural, environmental and occupational, and metabolic risks or clusters of risks, 1990‐2015: a systematic analysis for the Global Burden of Disease Study 2015. Lancet. 2016;388(10053):1659–1724. [DOI] [PMC free article] [PubMed] [Google Scholar]
- 11. Lim SS, Vos T, Flaxman AD, Danaei G, Shibuya K, Adair‐Rohani H, et al. A comparative risk assessment of burden of disease and injury attributable to 67 risk factors and risk factor clusters in 21 regions, 1990‐2010: a systematic analysis for the Global Burden of Disease Study 2010. Lancet. 2012;380(9859):2224–2260. [DOI] [PMC free article] [PubMed] [Google Scholar]
- 12. Page MJ, McKenzie JE, Bossuyt PM, Boutron I, Hoffmann TC, Mulrow CD, et al. The PRISMA 2020 statement: an updated guideline for reporting systematic reviews. BMJ. 2021;372:n71. [DOI] [PMC free article] [PubMed] [Google Scholar]
- 13. Stroup DF, Berlin JA, Morton SC, Olkin I, Williamson GD, Rennie D, et al. Meta‐analysis of observational studies in epidemiology: a proposal for reporting. Meta‐analysis Of Observational Studies in Epidemiology (MOOSE) group. JAMA. 2000;283(15):2008–2012. [DOI] [PubMed] [Google Scholar]
- 14. Lo CK, Mertz D, Loeb M. Newcastle‐Ottawa Scale: comparing reviewers' to authors' assessments. BMC Med Res Methodol. 2014;14:45. [DOI] [PMC free article] [PubMed] [Google Scholar]
- 15. Mendes MA, da Silva I, Ramires V, Reichert F, Martins R, Ferreira R, et al. Metabolic equivalent of task (METs) thresholds as an indicator of physical activity intensity. PLoS One. 2018;13(7):e0200701. [DOI] [PMC free article] [PubMed] [Google Scholar]
- 16. National Center for Health Statistics (NCHS) . United States National Health and Nutrition Examination Survey 2017‐2020. National Center for Health Statistics (NCHS). [Google Scholar]
- 17. Keating XD, Zhou K, Liu X, Hodges M, Liu J, Guan J, et al. Reliability and Concurrent Validity of Global Physical Activity Questionnaire (GPAQ): A Systematic Review. Int J Environ Res Public Health. 2019;16(21):4128. [DOI] [PMC free article] [PubMed] [Google Scholar]
- 18. Kyu HH, Bachman VF, Alexander LT, Mumford JE, Afshin A, Estep K, et al. Physical activity and risk of breast cancer, colon cancer, diabetes, ischemic heart disease, and ischemic stroke events: systematic review and dose‐response meta‐analysis for the Global Burden of Disease Study 2013. BMJ. 2016;354:i3857. [DOI] [PMC free article] [PubMed] [Google Scholar]
- 19. Yin X, Zhang T, Zhang Y, Man J, Yang X, Lu M. The global, regional, and national disease burden of breast cancer attributable to low physical activity from 1990 to 2019: an analysis of the Global Burden of Disease Study 2019. Int J Behav Nutr Phys Act. 2022;19(1):42. [DOI] [PMC free article] [PubMed] [Google Scholar]
- 20. Steindorf K, Friedenreich C, Linseisen J, Rohrmann S, Rundle A, Veglia F, et al. Physical activity and lung cancer risk in the European Prospective Investigation into Cancer and Nutrition Cohort. Int J Cancer. 2006;119(10):2389–2397. [DOI] [PubMed] [Google Scholar]
- 21. Steenland K, Deddens JA. A practical guide to dose‐response analyses and risk assessment in occupational epidemiology. Epidemiology. 2004;15(1):63–70. [DOI] [PubMed] [Google Scholar]
- 22. Durrleman S, Simon R. Flexible regression models with cubic splines. Stat Med. 1989;8(5):551–561. [DOI] [PubMed] [Google Scholar]
- 23. Shim SR, Lee J. Dose‐response meta‐analysis: application and practice using the R software. Epidemiol Health. 2019;41:e2019006. [DOI] [PMC free article] [PubMed] [Google Scholar]
- 24. Xu C, Liu Y, Jia PL, Li L, Liu TZ, Cheng LL, et al. The methodological quality of dose‐response meta‐analyses needed substantial improvement: a cross‐sectional survey and proposed recommendations. J Clin Epidemiol. 2019;107:1–11. [DOI] [PubMed] [Google Scholar]
- 25. Higgins JP, Thompson SG. Quantifying heterogeneity in a meta‐analysis. Stat Med. 2002;21(11):1539–1558. [DOI] [PubMed] [Google Scholar]
- 26. Hedges LV, Pigott TD. The power of statistical tests for moderators in meta‐analysis. Psychol Methods. 2004;9(4):426–445. [DOI] [PubMed] [Google Scholar]
- 27. Egger M, Davey Smith G, Schneider M, Minder C. Bias in meta‐analysis detected by a simple, graphical test. BMJ. 1997;315(7109):629–634. [DOI] [PMC free article] [PubMed] [Google Scholar]
- 28. Wu Y, Zhang D, Kang S. Physical activity and risk of breast cancer: a meta‐analysis of prospective studies. Breast Cancer Res Treat. 2013;137(3):869–882. [DOI] [PubMed] [Google Scholar]
- 29. Psaltopoulou T, Ntanasis‐Stathopoulos I, Tzanninis IG, Kantzanou M, Georgiadou D, Sergentanis TN. Physical Activity and Gastric Cancer Risk: A Systematic Review and Meta‐Analysis. Clin J Sport Med. 2016;26(6):445–464. [DOI] [PubMed] [Google Scholar]
- 30. Lin ZZ, Xu YC, Liu CX, Lu XL, Wen FY. Physical Activity and Liver Cancer Risk: A Systematic Review and Meta‐analyses. Clin J Sport Med. 2021;31(1):86–90. [DOI] [PubMed] [Google Scholar]
Associated Data
This section collects any data citations, data availability statements, or supplementary materials included in this article.
Supplementary Materials
Supporting information
Supporting information
Data Availability Statement
The data that support the findings of this study are included in this published article and its supplementary information files.