

Abstract
Proteins are long chains of amino acid residues that perform a myriad of functions in living organisms, including enzymatic reactions, signalling, and maintaining structural integrity. Protein function is determined directly by the protein structure. X-ray crystallography is the primary technique for determining the 3D structure of proteins, and facilitates understanding the effects of protein structure on function. The first step towards structure determination is crystallizing the protein of interest. We have developed a centrifugally-actuated microfluidic device that incorporates the fluid handling and metering necessary for protein crystallization. Liquid handling takes advantage of surface forces to control fluid flow and enable metering, without the need of any fluidic or pump connections. Our approach requires only the simple steps of pipetting the crystallization reagents into the device followed by either spinning or shaking to set up counter diffusive protein crystallization trials. The use of thin, UV-curable polymers with a high level of X-ray transparency allows for in situ X-ray crystallography, eliminating the manual handling of fragile protein crystals and streamlining the process of protein structure analysis. We demonstrate the utility of our device using hen egg white lysozyme as a model system, followed by the crystallization and in situ, room temperature structural analysis of the hub domain of calcium-calmodulin dependent kinase II (CaMKIIβ).
Introduction
X-ray crystallography has served as the workhorse strategy for protein structure determination since the first report of the structure of hemoglobin in 1960.1–3 The long chains of amino acid residues present in proteins perform a myriad of functions including enzymatic reactions, signaling, and maintaining structural integrity. Since the function of proteins is dictated by their structure, structure determination has allowed us to design new drugs, attempt to minimize possible side effects of existing therapeutics, and understand functional protein-protein interactions.4,5 X-ray crystallography is expected to continue to dominate structural biology efforts well into the future, in parallel with the development of alternative methods such as nuclear magnetic resonance spectroscopy (NMR) 6 and cryo-electron microscopy (cryoEM).7
One of the biggest bottlenecks for protein structure determination is the ability to grow well diffracting crystals.8,9 Under the right conditions, mixing certain amounts of protein and a precipitant solution can yield beautiful crystals, yet identifying these conditions requires a search through highly multi-dimensional chemical, physical, and composition space.10–14 The various parameters that need to be optimized include temperature, pH, buffer, protein concentration, and precipitant concentration.15 It is worth noting that not all mixtures of chemicals allow for crystallization. Therefore, most of the screening efforts involve looking for the mixture of chemicals that will enable crystallization, rather than precipitation. Furthermore, the path by which a sample traverses composition space, and the speed at which it does so can have just as significant of an effect on the crystallization outcome.16 For example, controlled crystal growth has been facilitated using the process of seeding.17–21
A variety of strategies can be used to follow different paths through protein solubility phase space, as shown in Figure 1a. These paths are designed to drive the protein solution to a state of supersaturation that can facilitate the crystallization of folded proteins rather than denaturation and aggregation. For a path that includes the possibility of obtaining a crystalline product, higher levels of supersaturation increase the nucleation rate for new crystals. However, at a certain point the driving force for phase separation can become so high that it results in the formation of an amorphous precipitate, rather than a crystalline solid (i.e., the precipitation zone in Figure 1a). Hence it is important to choose a path where the driving force is strong enough for nucleation but weak enough to allow the formation of an ordered structure. An ideal path for the growth of large, single crystals would involve a brief encounter with conditions of high supersaturation (i.e., the nucleation region), and then a shift to a region of lower supersaturation (i.e., the metastable region), which thermodynamically supports crystal growth, but does not kinetically does not favor nucleation.
Figure 1.
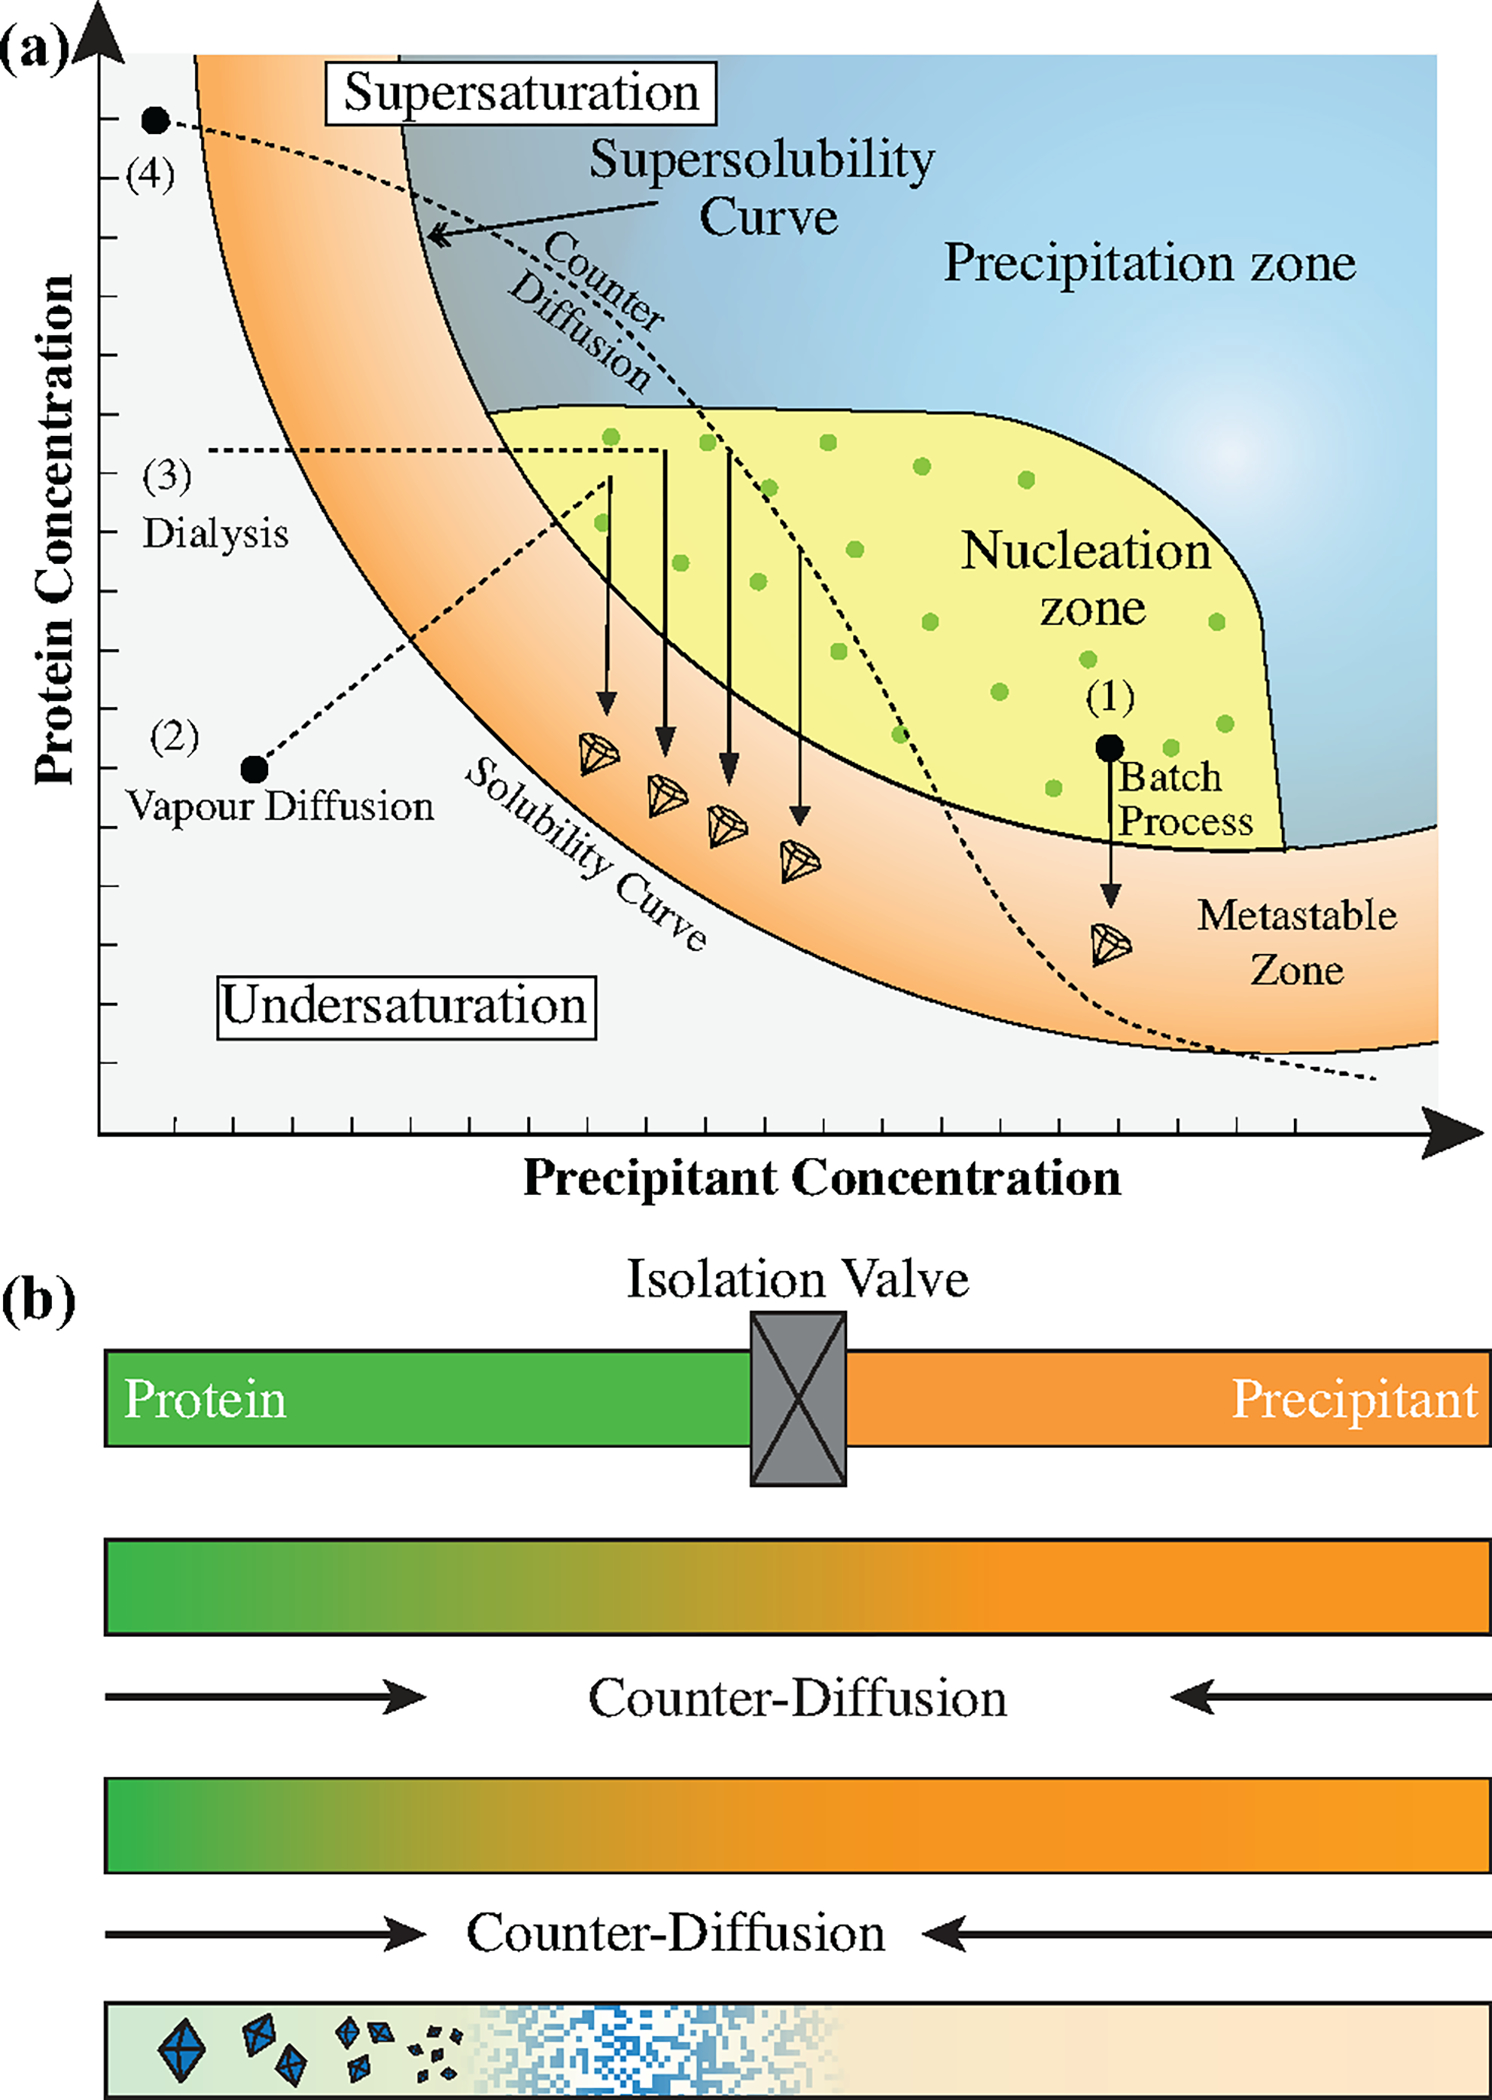
(a) A schematic protein solubility diagram showing the concentration of protein vs. concentration of precipitant. Supersaturation increases with distance from the solubility boundary. Typical crystallization methods include: (1) a batch process where known quantities of protein and precipitant solution are mixed and sealed to check a single condition, (2) vapour diffusion where a mixture of protein and precipitant is placed in vapour contact with a reservoir of precipitant solution and allowed to equilibrate, (3) dialysis where protein and precipitant solution are separated by a semi-permeable membrane that allows the crystallization reagent to enter the sample while maintaining the concentration of the protein and (4) counter-diffusion where protein and precipitant diffuse into each other, sampling a wide range of concentration space. Figure has been redrawn from Chayen and Saridakis, Nature Methods 2008.14 (b) Schematic depiction of a counter-diffusion experiment. Protein (green, left) and precipitant (orange, right) solutions are loaded into a capillary and separated by an isolation valve. Upon opening of the valve, the two solutions counter-diffuse, as indicated by the color gradient. Typically, the precipitant solution will diffuse more quickly than the protein because of the difference in molecular weight. The resulting concentration gradient will sample a range of supersaturation levels as the diffusion fronts move through the sample, resulting in a range of outcomes including potential precipitation at very high supersaturation levels and the growth of crystals at more optimal conditions.
The various methods used to crystallize proteins allow for the exploration of different paths through this phase space (Figure 1a). The simplest method is the batch process, where known quantities of protein and precipitant solution are mixed and incubated in a sealed container.22 As shown in Figure 1a, a single batch experiment would probe exactly one point in solubility space. Thus, while batch methods are simple in that they do not evolve over time, the use of this method to screen for crystallization conditions can be very sample and labor intensive. The second, as well as the most common method for crystallization is vapour diffusion.23,24 In this method, an aqueous drop of protein and precipitant are mixed at a concentration that is typically lower than the required concentration for crystal formation. The drop is then allowed to equilibrate with a reservoir solution that causes the droplet to gradually increase in concentration, allowing for a single trial to survey a somewhat larger range of conditions.25 Dialysis is an alternative method that has been has also been utilized for protein crystallization. It allows the sample to maintain constant protein concentration while increasing in precipitant condition.14,26
While the effort needed to set up large numbers of either batch or vapour diffusion crystallization trials can be mitigated by liquid handling robots, crystallization experiments in general can suffer from both scale and reproducibility issues. Newman et al. discussed the poor reproducibility of crystallization performed in the types of microliter-scale droplets typical of the majority of structural biology studies.27 One contribution to this variability arises from the physical length scales of such droplet-based methods, which do not allow for reproducible control over mixing and concentration gradients within a sample during preparation. Alternative methods, such as microfluidics, allow for improved reproducibility because of the ability to carefully control gradients and enable diffusive mixing of solutions.
One of the crystallization techniques most commonly associated with microfluidics is counter-diffusion. Counter-diffusion is a method that both harnesses the benefits of slow diffusive mixing and is advantageous for screening crystallization conditions. In a counter-diffusion setup, protein and precipitant solutions are placed into contact, with mixing only occurring via diffusion (Figure 1b). An advantage of this approach is that it surveys a large range of crystallization conditions (Figure 1a). Based on the trajectory through solubility space, a single counter-diffusion experiment could include precipitation at very high levels of supersaturation, as well as an array of small and large crystals at lower levels of supersaturation, providing a kind of self-optimization that can be further refined in future experiments. However, one potential limitation of counter-diffusion is the fact that it can only be achieved reproducibly in low gravity and/or microfluidic conditions,28–39 or in the presence of a gel.40,41
In addition to the specific details of the crystallization conditions, anecdote and experience have suggested that higher quality crystals grow when the samples are not jostled or bumped. The most dramatic example of this idea is protein crystallization in space under microgravity conditions.29,32,42–48 The microgravity environment has been attributed to improvements in crystal quality, where the absence of convective effects and the slow growth of crystals in a diffusion-dominated environment allowed for more ordered attachment of proteins to the growing crystal. This type of convective-free environment can be very well described by the dimensionless Grashof number.49 The Grashof number is effectively a Reynolds number for buoyant flow, and describes the ratio of inertial forces due to buoyancy relative to viscous forces and depends on surface tension , concentration gradient , gravity , length scale and dynamic viscosity . The conditions present in a crystallization trial in microgravity are described by .
| (1) |
While the potential benefits of microgravity are very exciting, such experiments are out of reach for most researchers. Instead, similar solution conditions can be achieved by working at the microscale. From Eq. (1), under microgravity conditions due to the small value of . However, the same solution conditions can be achieved at unit gravity by merely decreasing the length-scale of the system by a factor of 100. Hence, it is straightforward to use microfluidics to create a microgravity-like environment where viscous forces dominate over buoyancy forces.
In addition to serving as an easily accessible strategy for performing protein crystallization at small length scales, microfluidics can also be scaled out to facilitate a large number of highly-reproducible parallel experiments while maintaining exquisite control over local crystallization conditions and concentration gradients.50 The reduction of length scale allows for mimicry of microgravity like conditions while simultaneously decreasing sample consumption and increasing experimental reproducibility26,50,51 – aspects that are highly appealing to the scientific community.
Most of the reported works on counter-diffusive microfluidics have incorporated pressure-driven pneumatic valves.33,38,52,53 These require a complex fluid handling system along with a pressure control system and relatively large ancillaries for a very small device. While a number of reports have described counter-diffusion devices that involve simple pipetting of protein solutions into a channel that is then put in contact with a reservoir of precipitant solution,28,35,37 these methods have tended to require relatively large sample volumes from a microfluidic perspective (~1–10 μL). Alternatively, the small scale of microfluidics allows for the use of surface forces to manipulate fluid flow – a potentially simple and straightforward solution to the challenge of fluid handling that eliminates the need for an external pump. We propose the use of centrifugal valves which, would take advantage of microscale physics and not require macroscale ancillaries while also allowing for a decrease in the volumetric scale of the experiment.
Looking beyond crystallization to X-ray protein crystallography, while microfluidics has been shown to enable the reproducible crystallization of proteins, harvesting of the resulting crystals for analysis is extremely challenging and undesirable. Instead, we developed our centrifugal devices using an X-ray compatible chip architecture so as to enable on-chip diffraction analysis.51 Furthermore, the reproducibility of microfluidics would allow us to collect and merge data from multiple crystals. Additionally, the sealed nature of our devices helps to enable the straightforward collection of room temperature X-ray data. Thus, we could potentially look at the protein structure in its native state without “freezing out” functional motions that can skew results by favoring some confirmation over others.54–56
Here we have reported novel polymeric devices to control fluid flow using surface forces and capillary action to facilitate counter-diffusive, on-chip protein crystallization. UV curable polymers have been used to fabricate devices that have good X-ray transparency and can facilitate in situ room temperature crystallography. Photolithography and nanoimprint lithography have been implemented to create the multilayer device structure with high degrees of functionality like metering and valving. We demonstrated the utility of our device using hen egg white lysozyme as a model system. We further validated our approach via the crystallization and in situ room temperature structural analysis of the β paralogue of the hub domain of calcium-calmodulin dependent kinase II (CaMKIIβ),57,58 a multidomain serine/threonine protein kinase related to memory formation that forms high-order oligomeric structures including dodecameric and tetradecameric states.59–61
Materials and Methods
1. Photomask Design
Three different photomasks were designed in Adobe Illustrator for the various layers of the device. The design for each mask was made to fit on a 3” (76.2 mm) silicon wafer. Each mask also included markers on 3 sides for alignment during multistep photolithography. The designs were printed onto polyester film (Fineline Imaging, Colorado Springs, CO, USA) using a resolution of 10,160 d.p.i. and a right-reading down plotting strategy.
2. Device Fabrication
Negative-tone photoresist (SU-8 2100, SU-8 2010, SU-8 2002) and a lift-off layer (LOR 3A) were purchased from Kayaku Advanced Materials (formerly Microchem, Westborough, MA, USA) and stored away from UV light. Propylene glycol methyl ether acetate (PGMEA), which was used to develop SU-8, was bought from Sigma–Aldrich. RD6 developer for the LOR 3A (tetramethylammonium hydroxide) was bought from Futurrex (Franklin, NJ, USA). Silicon wafers (76.2 mm, Type P, test grade, 100 orientation) were bought from University Wafer, Boston, MA, USA.
A fabrication procedure similar to that of Sui et al.51 was followed, with few modifications (Figure 2). Nitrogen gas was used to remove any particulates or dust from the wafer surface. As shown in Figure 2a, a sacrificial layer of 100 nm LOR 3A was first coated onto the wafer via spin coating (Laurell WS-650–23) at 3000 rpm for 60 s, followed by heating at 185°C on a hot plate (Heidolph MR Hei-Tec ϕ145). Next, SU-8 2010 was spin coated at 2000 rpm for 60 s to yield a 10 μm-thick layer that would act as the top inlet layer of the device containing the inlet holes. The thickness of each layer, baking and exposure time were based on the manufacturer’s suggestion. The 10 μm inlet layer was heated on a hot plate for 5 min at 95°C and was then patterned using the inlet layer photomask by standard photolithography with a Mask Aligner (SUSS MA/BA 6, UV lamp wavelength – 365 nm, power 9.6 mWcm2) for 12.5 s to achieve a total exposure dose of 120 mJ/cm2. This was followed by a 3 min post exposure bake at 95°C, after which the sample was allowed to cool.
Figure 2.
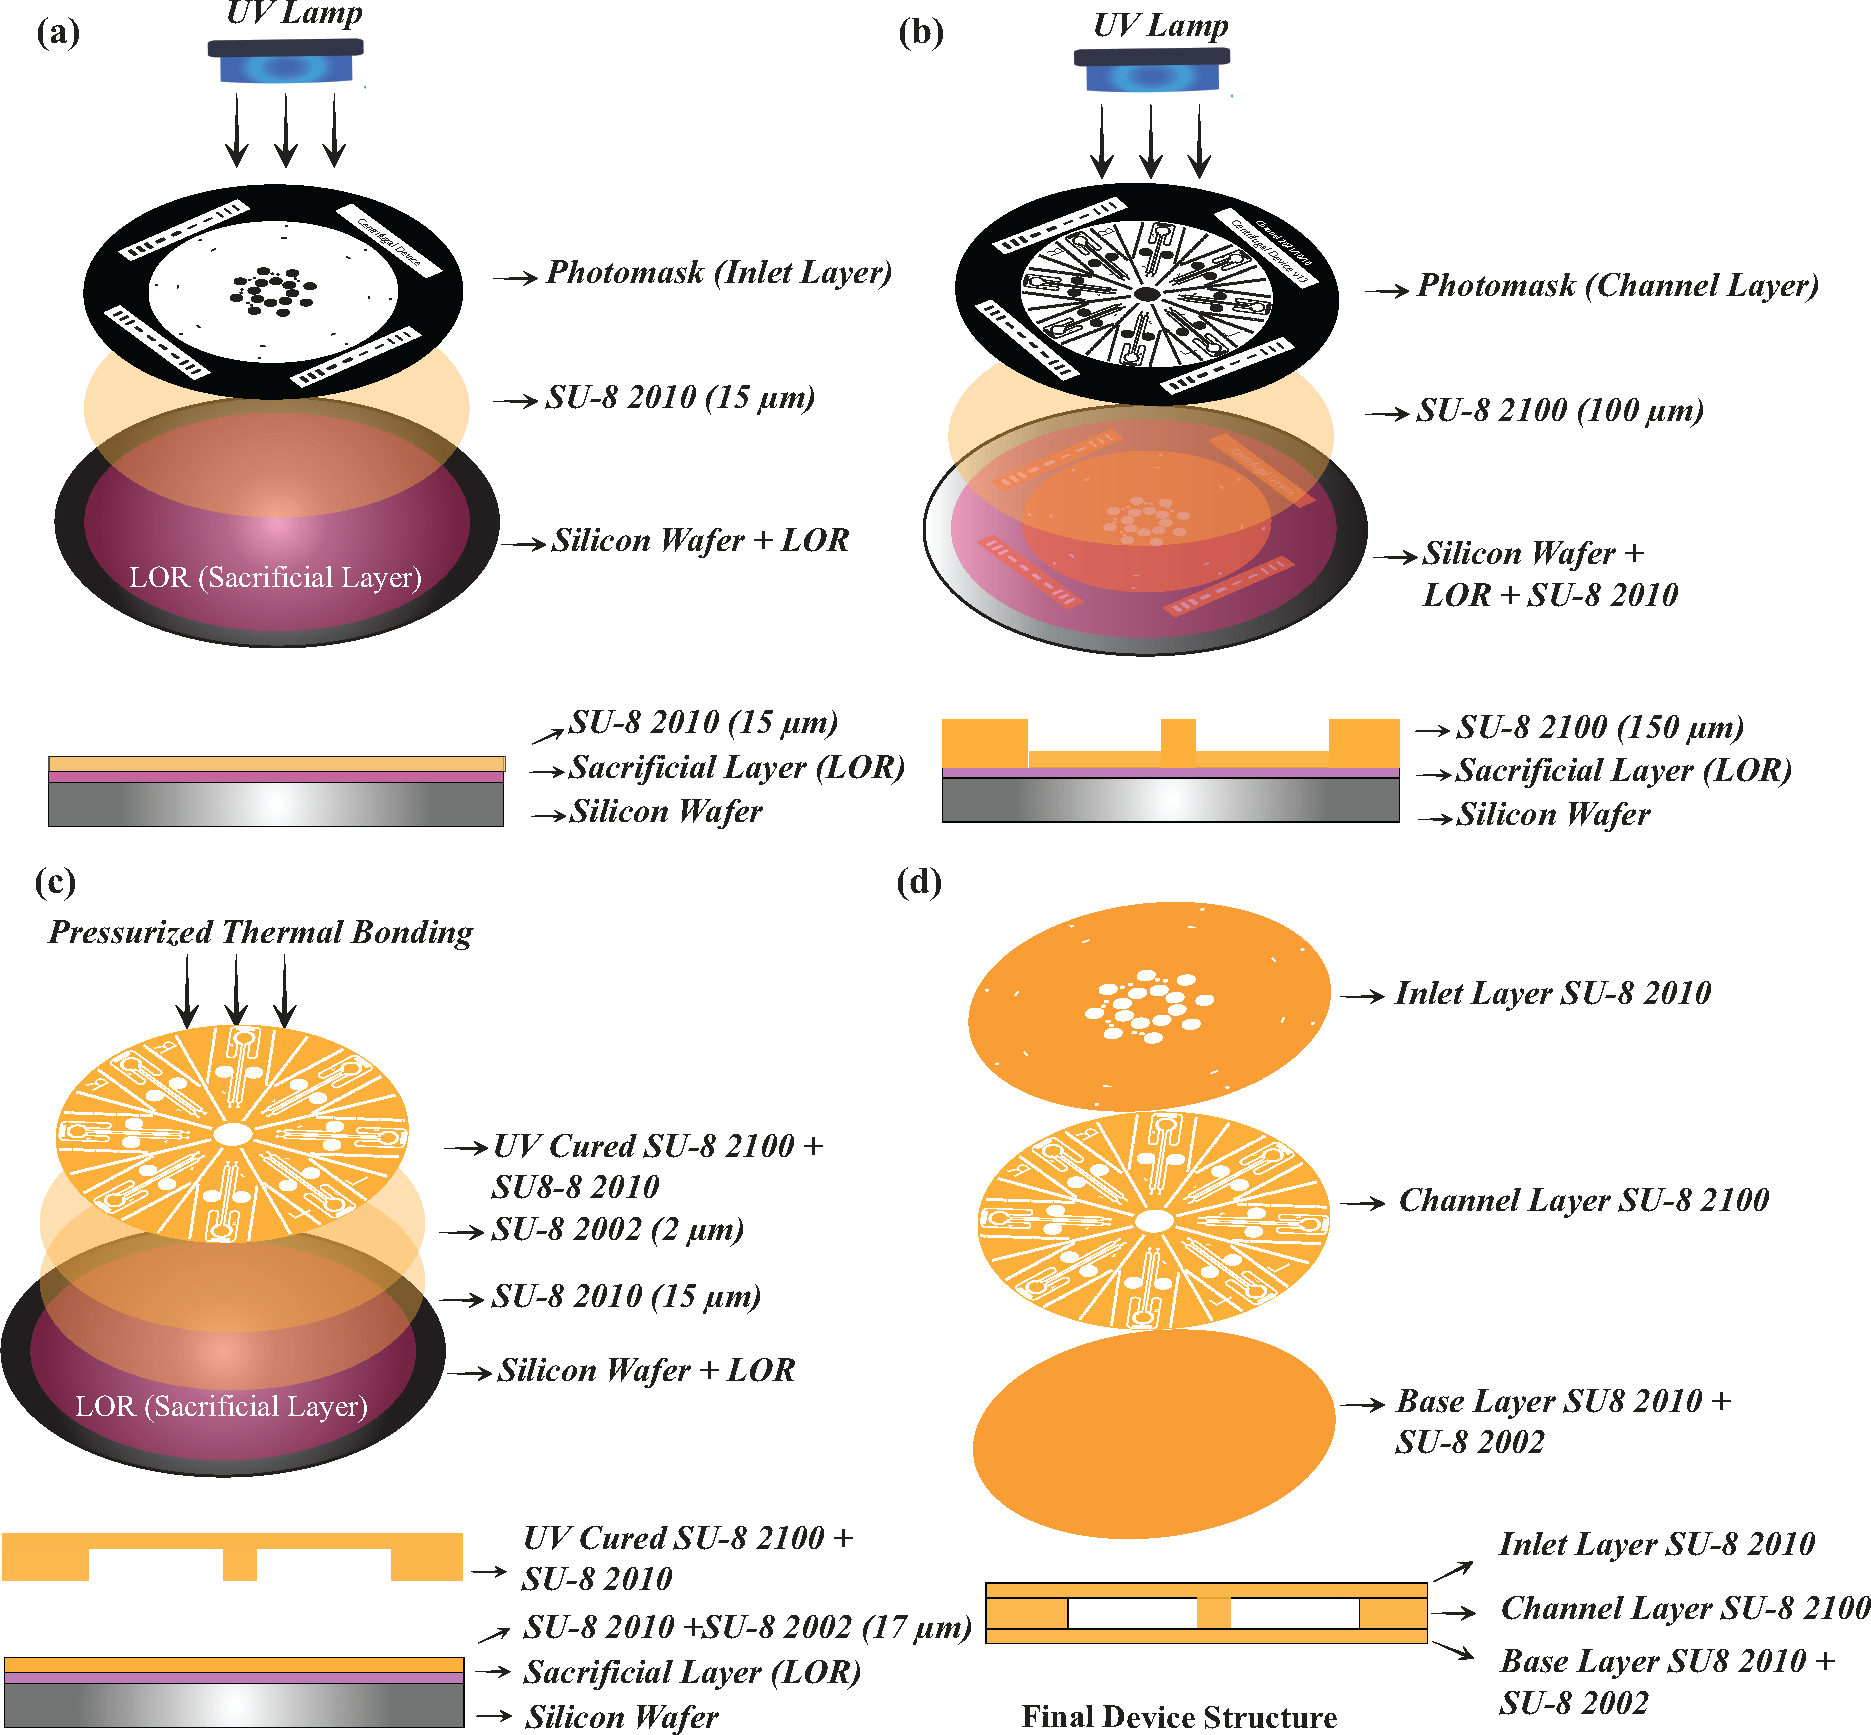
Schematics of the process for device fabrication, including photolithography and thermal bonding to create the multi-layered centrifugal device. (a)-(b) The use of photolithography for the fabrication of the inlet layer and the channel layer. (c) Attachment of the combined inlet and channel layers to the base layer is achieved using pressurized thermal bonding. (d) An exploded view of the three layers (top) and a side view of the assembled device (bottom).
Next, we created the channel layer (Figure 2b) by spin coating SU-8 2100 on top of the inlet layer at 2000 rpm for 60 s, yielding a thickness of 113 μm. This was followed by a two-step soft/hard bake, starting at 65°C for 5 min and 95°C for 30 min. The channel layer mask was aligned to the inlet layer using fiducial markers and patterned using a 26 s UV exposure to achieve a total exposure dose of 250 mJ/cm2. Following exposure, the sample again underwent a two-step bake – 65°C for 5 min and 95°C for 12 min. After 5 min of cooling in air, the samples were developed in PGMEA to wash away the uncured SU-8 and reveal the channel and inlet features. The wafer containing the designs was dried with nitrogen and developed overnight in RD6 to dissolve the sacrificial LOR layer. The resulting free-standing SU-8 structure was rinsed with isopropanol and allowed to air dry.
To fabricate the base layer of the device, a second wafer was cleaned, and spin coated with LOR 3A and 10 μm-thick SU-8 2010 as described above. The sample was baked at 95°C for 5 min, followed by a 15 s UV exposure using the base layer mask, and an additional bake at 95°C for 4 min. Next, a 2 μm layer of SU-8 2002 was spin coated at 2000 rpm for 60 s and was soft baked at 95°C for 1 min, but not exposed to UV light, to act as an adhesion layer. The previously developed inlet and channel layer that had been released from the silicon wafer was then visually aligned to the second silicon wafer containing the bottom layer (Figure 2c). The bottom layer photomask was then aligned with the assembly. The bonding was achieved using a nanoimprinting machine (Nanonex, Monmouth Junction, NJ, USA) at 69°C, 10 psi (68.95 kPa) which maintained the pressure and temperature for 3 min. 1 min of UV exposure was added to the recipe at the end to cure the 2 μm adhesion layer and laminate the entire device together. Immediately after bonding, the silicon wafer containing the structure were removed from the nanoimprinter and baked at 95°C on a hotplate for 1 min and allowed to cool slowly at a rate of 3°C/min. The bonded structure was again aligned with the bottom layer photomask, UV exposed for 10 s, and then baked at 95°C for 4 min, followed by slow cooling at 3°C/min. A cotton swab, (Fisherbrand™) was dipped in PGMEA and used to wipe away the uncured SU-8 at the edges of the wafer. The process was repeated 3–4 times to remove uncured SU-8 completely. The entire assembly was not dipped in PGMEA because we observed that uncured SU-8 often entered and blocked the channels. Finally, the developed and bonded structure was immersed in fresh RD6 overnight to release the three-layer SU-8 device. Once released, the device was then rinsed with DI water and dried under vacuum.
Selective deposition of (tridecafluoro-1,1,2,2-tetrahydrooctyl) trichlorosilane (Gelest Inc., Morrisville, PA, USA) was performed via vapour treatment under vacuum. Since we wanted the silane to selectively deposit at the valve opening, a silicone sheet (Green Rubber Co. Woburn, MA, USA) was used as a mask. As shown in Figure S2e, a small circular silicon sheet covered the inlet holes while leaving the valve structures open for silane deposition. 100 μL of the silane was placed into a small 20 mL vial in vacuum chamber along with the silicone-covered devices and allowed to incubate for 6 hours under vacuum.
3. Device Characterization
Contact angle measurements were performed using an Attension Theta Optical Tensiometer from Biolin Scientific and 5 μL of DI water. Optical micrographs of the device were captured using Microscope Illuminator 385B (Bausch & Lomb Model – ASZ45L3) and Zeiss SteREO Discovery V12 stereo Microscope. The height of the various device features was measured using a Zygo Nexview Optical Profilometer.
4. Device Operation
The SU-8 centrifugal devices were attached to 50×50 mm glass slides (Fisherbrand™) using adhesive tape (3M™ 810 Scotch Tape). 0.2 μL of liquid was pipetted into the inlet holes, and capillary action was used to fill in the device up to the valves (Figure 4a). Excess liquid present in the inlet after filling was blotted away using a Kimwipe (Kimtech™, Roswell, GA, USA). The glass slides were then rotated at 1500 rpm using a spin coater (WS-650MZ-23NPPB, Laurell Technologies) to overcome the capillary pressure of the centrifugal valve and allow fluid to enter crystallization chamber. The process was repeated sequentially to set up the crystallization trials and allow for the two liquids to come in contact without an air gap separating them. The device operation was also validated using a bench top centrifuge (myFuge, Benchmark Scientific Inc., NJ, USA), where a single device was put inside a 2 mL microcentrifuge tube and centrifuged at 5500 rpm. To test device operation without the need for any ancillaries, the device was attached to a glass slide and flicked 2–3 times using our wrist to overcome the unfavorable wetting conditions present at the valve and mix the liquid.
Figure 4.

Optical micrographs showing (a) sequential loading of the device. (a1) An aqueous solution containing orange food dye was first pipetted into the device, filling into the long channel before stopping at the valve. (a2) Spinning at 1500 rpm metered the orange solution into the crystallization chamber. Similarly, (a3) a solution containing a green food dye was pipetted and (a4) spun at 1500 rpm to set up a counter-diffusion experiment. (b) An enlarged view of the counter-diffusive arrangement obtained from sequential loading, generating good contact of liquids with no air gap vs. (c) the results of simultaneous loading of the two liquids, which traps air between the two liquids.
5. Protein Purification and Crystallization
Lysozyme Crystallization
A solution of 120 mg/mL hen egg white lysozyme (HEWL, Hampton Research Inc.) was prepared gravimetrically and dissolved in 50 mM sodium acetate buffer (Fisher Scientific, ACS grade) at pH 4.6 with 20% (w/v) glycerol (Fisher Scientific). The precipitant solution contained 1 M sodium chloride (Fisher Scientific, ACS reagent) in 50 mM sodium acetate, pH 4.6 and 20% (w/v) glycerol (Fisher Scientific). 0.5 μL protein solution was first pipetted into the centrifugal chips through the inlet holes, followed by spinning at 1500 rpm for 5 s to facilitate loading of 0.16 μL in the crystallization chamber, followed by loading of the same volume of precipitant solution in a similar manner. The inlet holes, valves, and vents were sealed using 5-minute epoxy (Loctite Epoxy Five Minute Instant Mix) and the devices were stored in a petri dish sealed with Parafilm M® Laboratory Film. Crystals were observed after overnight incubation in a refrigerator at 4°C (Fisher Scientific Isotemp).
Hub Domain of Human CaMKIIβ – Purification and Crystallization
Ca2+/calmodulin-dependent protein kinase II β hub domain (residues 534–666) (CaMKIIβ) with a 6xHis tag at the N-terminus in a pET-28 vector was expressed in E. coli BL21(DE3) cells. Protein expression was induced at 18°C with 1 mM isopropyl β-a-D-1-thiogalactopyranoside (IPTG) and grown overnight. Following ~16 hours of incubation, cell pellets were resuspended in Buffer A (25 mM Tris, pH 8.5, 50 mM KCl, 40 mM imidazole, 10% glycerol) and commercially available protease inhibitors (0.5 mM benzamidine, 0.2 mM 4-(2-aminoethyl)benzenesulfonyl fluoride hydrochloride (AEBSF), 0.1 mg/mL trypsin inhibitor, 0.005 mM leupeptin, 1 μg/mL pepstatin), 1 μg/mL DNase/50 mM MgCl2 were added, then the cells were lysed. The following purification steps were performed using an ÄKTA Pure Chromatography system at 4°C. Filtered cell lysate was loaded onto a 5 mL His Trap FF Ni Sepharose column (GE Research) and eluted with 50% Buffer B (25 mM Tris-HCl pH 8.5, 150 mM KCl, 1 M imidazole, 10% glycerol). The protein was desalted from excess imidazole using a HiPrep 26/10 desalting column using Buffer C (50 mM Tris-HCl pH 8, 75 mM NaCl, 1 mM dithiothreitol (DTT), 10% glycerol). The 6xHis-tag was cleaved using PreScission protease overnight at 4°C. Proteins were eluted from a HiTrap Q-FF ion exchange column with a step-gradient from 0% to 17% using Buffer BQ (25 mM Tris-HCl pH 8.5, 1 M KCl, 10% glycerol). Eluted proteins were concentrated and further purified in gel filtration buffer (25 mM Tris-HCl pH 8.0, 150 mM KCl, 1 mM tris(2-carboxyethyl)phosphine (TCEP), 10% glycerol) using a HiLoad 16/600 Superose 6 pg size exclusion column. Fractions were pooled, concentrated, aliquoted and flash frozen in liquid nitrogen, and stored at −80°C until needed.
CaMKIIβ hub domain crystallization in the microfluidic device was performed at 20°C. 0.5 μL each of a 1.9 mM (29 mg/mL) protein solution and a 0.1 M imidazole pH 7, 0.15 M D,L-malic acid pH 7 and 22% poly(ethylene glycol)monomethyl ether 550 (PEGmme550) precipitant solution were loaded using the aforementioned sequential technique used for lysozyme crystallization. The device was sealed using 5-minute epoxy and stored in a petri dish sealed with Parafilm as described above. To maintain the humidity inside the petri dish, a Kimwipe (Kimtech™, Roswell, GA, USA) was placed inside the petri dish and soaked with 2 mL of precipitant solution before sealing. Crystals were observed in the device after incubation for 4–5 days.
CaMKIIβ hub domain crystals were also obtained using the hanging drop vapour diffusion method (VDX™ plate, HR3–141, Hampton Research Corp) using the same concentration of protein and precipitant solution at 20°C. The hanging drop contained 1 μL of each protein and precipitant solution, while the well contained 500 μL of the precipitant solution.
6. X-ray Data Collection
a. On-Chip Room Temperature Data Collection
Crystal-containing devices were cut along the perforated marks using a razor blade and shipped via overnight courier service to SSRL. To maintain humidity during shipping, the devices were placed inside a petri dish, with a Kimwipe soaked in 2 mL of precipitant solution and sealed with Parafilm. The devices were mounted on a magnetic base (Crystal Positioning Systems, Jamestown, NY, USA) at SSRL. Data collection was performed at room temperature (293 K) at beamline 12–1 using an X-ray wavelength of 0.98 Å and a beam size of 40×75 μm using a transmission factor of 2%. 90° of data was collected using 0.2° of oscillation per frame. The device was mounted perpendicular to the X-ray beam (defined as 0°), and data was collected from −45° to +45°. The sample-to-detector distance was set at 250 mm, and an Eiger 16M Pixel Array Detector was used.
b. Cryogenic Data Collection
CaMKIIβ crystals grown by the hanging drop vapour diffusion method (VDX™ plate, HR3–141, Hampton Research Corp) were looped with Mitegen MicroMounts 200 μm aperture loops. The crystals were cryoprotected via soaking in a precipitant solution supplemented with 20% glycerol and flash-frozen in liquid nitrogen. Cyrogenic diffraction data were collected at the University of Massachusetts Amherst X-ray facility at a wavelength of 1.54178 Å using a Rigaku MicroMax-007 HF X-ray source, which was coupled to a Rigaku VariMax HF optic system at 100 K.
7. Data Analysis
Diffraction data sets were integrated, merged, and scaled using HKL-3000.62 The structures were solved by molecular replacement (MR) with Phaser63 using the coordinates of CaMKIIγ hub domain (PDB ID: 2UX0) as a search model. The structures were built into electron density using Coot64 and refinement was performed with REFMAC5.65,66 Nika software for 2D diffraction data reduction in Igor Pro (Wavemetrics Inc.)67 was used to analyze the background scattering. Integration was performed in 2θ with log binning using the calibrated beam center and sample-to-detector distance.
Results and Discussion
The goal of this work was to develop an X-ray compatible microfluidic setup that has the ability to control fluid movement for counter-diffusive crystallization and achieve on-chip X-ray diffraction analysis. To this end, we have demonstrated a polymeric device that can be easily fabricated using photolithography. The low background scattering of this polymer also enhances its utility in the manufacture of X-ray compatible microfluidics. Our ultimate goal is to perform on-chip structure determination at room temperature with no manual handling of crystals to facilitate the process of structure determination. To achieve this, we established design criteria that would enable us to perform crystallization using counter-diffusion. Firstly, the most important aspect is to achieve a counter-diffusive setup is to integrate a liquid handling system into the polymeric devices that allows for controlled contact of liquids and the reproducible formation of concentration gradients. Secondly, we ensured stability of the grown crystals at room temperature for long period of time. Lastly, our devices are designed to avoid direct handling of crystals for X-ray diffraction analysis.
Device Design
With regards to the design criterion of X-ray compatibility, we looked at the attenuation of the various materials that can be used for microfluidic device fabrication. Figure S6 shows the transmission factor for 1 Å X-rays as a function of thickness for potential candidate materials. It can be seen that hydrocarbon-based polymers give a higher range of transmission factor (~97%), even at the 20 μm thickness necessary to provide sufficient strength to form a device. This high transmission is in contrast to the silicone-based elastomers more typically used in microfluidic devices that would attenuate nearly 53% of the signal for the same thickness of material. We selected SU-8, a UV curable polymer, as the ability to pattern structures with light using photolithography makes it a favourable material for making multilayered devices. This ability to pattern polymeric structures directly with light is also advantageous for making multilayered structures, as compared with alternative etching techniques.
Using SU-8, we fabricated a three-layered device that includes the integrated fluid handling and metering system needed for counter-diffusion experiments. As shown in Figure 2, we used a similar protocol to that reported by Sui et al.,51 taking advantage of a combination of multilayer photolithography and thermal nanoimprinting to create monolithic channels and thermally bond the device layers together. Importantly, regarding the fabrication, we found that if the silicon wafer containing the bonded structure is removed from the hot plate prematurely during the post baking step, the bonded layers start to delaminate. However, when the bonded structure was cooled down slowly (3°C/min), no such failures were observed. We hypothesize that there was a stress build up caused by the differences in the coefficients of thermal expansion for the SU-8 layers as compared to the silicon wafer and the sacrificial LOR layer that caused this detachment. We also observed that the thermal bonding at high pressure caused the SU-8 film on the top of the device to sag into the crystallization chamber. This sagging was maximal at the center of the chamber and was approximately 30 μm in magnitude (Figure S1d). Thus, the sagging resulted in the height of the crystallization chamber ranging from 83 μm at the center to 113 μm at the edges.
Device Structure and Operation
The overall assembly consists of 8 identical sections, as shown in Figure 3a, which can each run independent experiments and be easily separated from the others by cutting along a series of perforated lines. The lines have been incorporated into the design for this purpose and help to separate the individual sections for X-ray analysis. Figure 3b shows the overall design of a single device. The device design includes three openings: inlet holes, air vents, and the centrifugal valve. The inlets are connected to the crystallization chamber by a long channel containing a U-turn. The air vent is located at the top of the U-turn, while the centrifugal valve is located right before the crystallization chamber.
Figure 3.
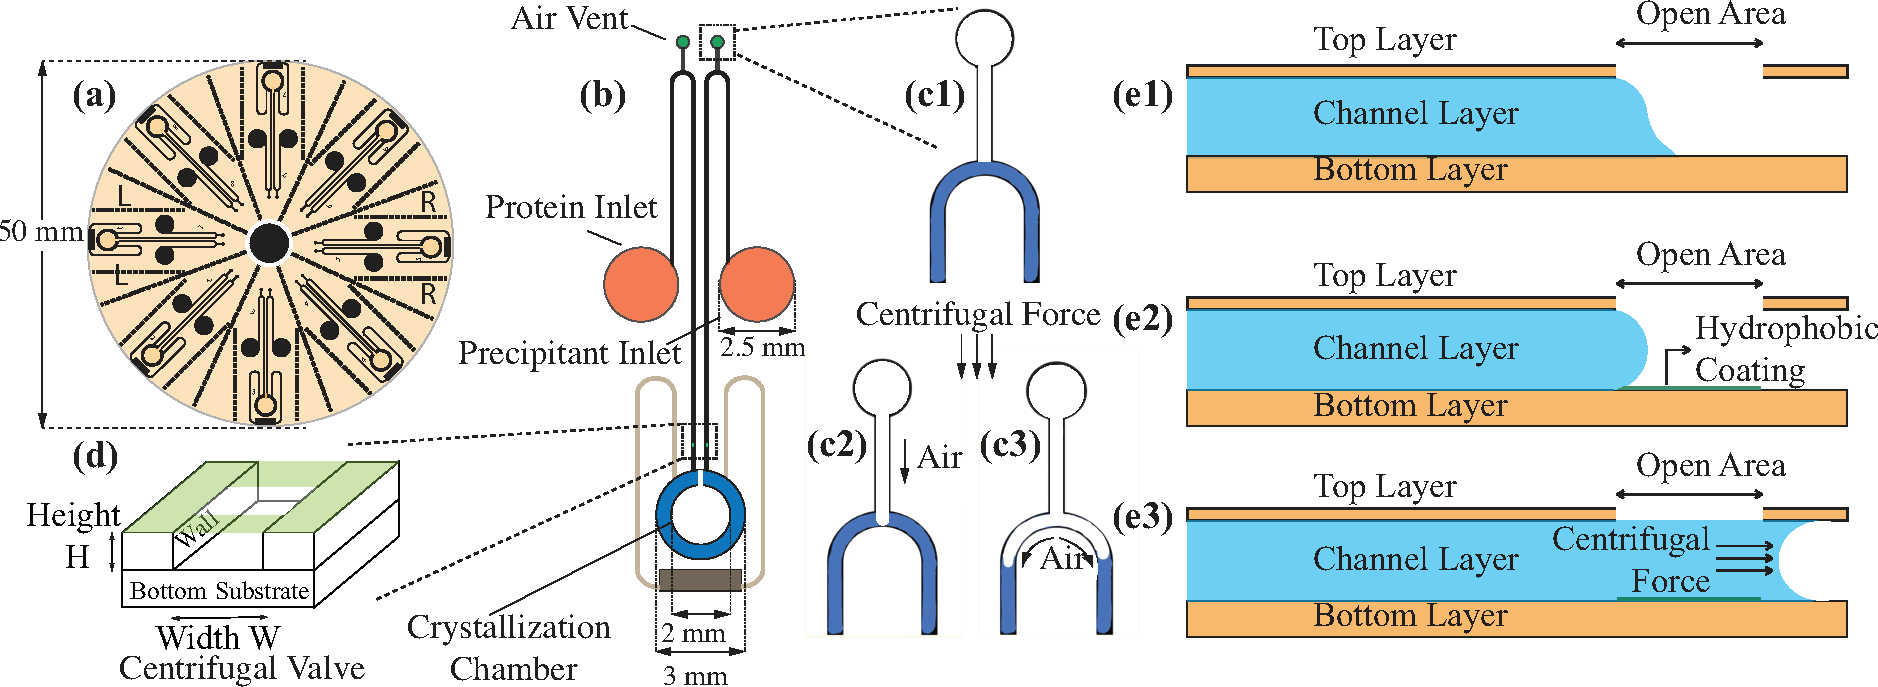
(a) Schematic of the overall device design containing 8 identical sections. (b) Schematic of each individual section depicting the inlet hole, air vent and centrifugal valve. (c) Schematic depicting the function of the air vent during liquid metering. (d) 3D view of the centrifugal valve and (e) a 2D cross-sectional view showing the role of surface forces and wetting related to the operation of the centrifugal valve.
Inlet holes are used to introduce liquid into the device. The hydrophilic nature of the SU-8 polymer facilitates easy filling of the device by capillary action, the long channel enables metering of liquid, and the position of the centrifugal valve before the crystallization chamber serves to stop the flow of liquid.
We take advantage of capillary forces to both drive and control flow in our devices. In a rectangular channel, the capillary forces can be described as
| (2) |
Here, refers to the liquid-vapour surface tension, and are the contact angles with the bottom surface, side walls and top surface respectively, is the channel height and is the channel width. Flow occurs when and stops when , therefore the capillary force expression when we want liquid to stop is:
| (3) |
Here, since both the walls and the bottom of the device are made of same material and have the same contact angle. Introducing a small air gap creates a region in the channel that is effectively superhydrophobic (, meaning ). This large negative term dominates over the other terms for which . Thus, Eq. (3) can be rearranged to give an expression for the critical channel dimensions (i.e., channel height and width ) needed for capillary valving:
| (4) |
Using this design parameter, we would require channels with a low aspect ratio for the valves to be effective with water. However, using various protein solutions and crystallization buffers means that the contact angle may vary widely and may lead to a requirement of an even lower aspect ratio. Therefore, to make our devices more robust, we deposited a layer of fluorinated alkyl silane into the valve region, as shown in Figure 3e2, which causes with water (Figure S2c). We optimized the timing of silane deposition to 6 hours. Longer deposition times (12 hours) often caused the silane to penetrate deeper into the metering channel, which caused the liquid to stop several millimeters before the valve, and thus changing the amount of liquid entering the crystallization chamber. In contrast, shorter deposition times (1–2 hours) were not sufficient to deposit sufficient silane to stop the flow. We demonstrated successful operation of the valve with solutions containing varying concentrations of potassium chloride (0–2 M), tris(2-carboxyethyl) phosphine (0–25 mM), PEGmme550 (0–22 wt%), imidazole (0–100 mM), malic acid (0–150 mM), glycerol (0–20 wt%), sodium chloride (0–2 M), sodium acetate (0–50 mM) and potassium bromide (0–4 M). While this list does not represent an exhaustive analysis of potential crystallization reagents, the physics of capillary wetting suggests that our device design should function with reagents that have a wetting angle as low as ~53° on a fluorinated surface, meaning that the majority of crystallization solutions should likely be compatible. It is also worth noting that viscosity plays no role in this valving phenomenon. Therefore, provided the capillary action is sufficient to draw a highly viscous material (e.g., high molecular weight PEG solutions) into our device, the valve should also function successfully.
SU-8 in its freshly crosslinked state after photolithography has a contact angle of 84° (Figure S2a). However, we observed a change following RD6 treatment, which decreased the contact angle to 53° (Figure S2b). It is worth nothing the RD6 treatment was used during device fabrication to release the device from the silicon wafer. Theoretically, an 84° contact angle should be adequate for capillary action. However, we often observed that the liquid did not flow through the device without the RD6 treatment. We speculate that this lack of spontaneous capillary flow could be a result of the microscopic roughness on inner channel surface, but further investigations into this phenomenon were beyond the scope of the current work.
Having developed a robust fluid control strategy for our devices, the next step was to be able to trigger the movement of liquid. We used centrifugal and capillary forces that allowed for easy operation without involving a pressure pump and numerous connecting tubes. Capillary forces enabled easy filling of the device, and then the application of centrifugal force was used to overcome the unfavorable wetting conditions present at the valve to meter liquid into the crystallization chamber. In particular, the device was designed to feed in both protein and precipitant solution in parallel channels with a goal of creating a counter-diffusion setup. In Figure 4 we demonstrated this process using food dye dissolved in water. Each liquid was sequentially loaded into the device, as shown in Figure 4a. We first pipetted 0.5 μL of orange liquid (Figure 4a1), and then spun the device to drive it into the crystallization chamber (Figure 4a2). Next, we pipetted 0.5 μL of green liquid (Figure 4a3), and then spun the device to drive the fluid into the chamber where it could contact and mix counter-diffusively with the orange liquid (Figures 4a4 and 4b). Importantly, there are two air vent channels on both sides of the crystallization chamber, to allow for the air to escape when the liquid enters the chamber. It is essential to load the liquids sequentially in order to allow for the air to escape. If the liquids are loaded simultaneously, the air ends up being trapped between the two liquids, as shown in Figure 4c, precluding the possibility of setting up a counter-diffusion crystallization trial.
In addition to the vents in the crystallization chamber, metering of liquid is facilitated by the presence of air vents at the top of the U-turn in the channel (Figure 3c). When centrifugal force is applied to the device, it acts on the liquid on both sides of the U-turn. In the absence of an air vent, the longer channel going into the crystallization chamber would result in siphoning of liquid from the inlet into the crystallization chamber. However, the addition of the air vent allows for the creation of a meniscus at the peak of the U-turn, such that the liquid can split and flow separately into the inlet and the crystallization chamber. This facilitates the reproducible metering of a known volume of liquid (0.16 μL) into the crystallization chamber.
When centrifugal force is applied, the two liquids enter the crystallization chamber to create a counter-diffusion setup. A spin speed of 1500 rpm allowed for gentle introduction of liquids into the crystallization chamber yielding counter-diffusive mixing as shown in Figure 4b. The force exerted from the centrifugation can be calculated as
| (5) |
Here is the angular velocity, is the radial distance and is the mass of the liquid. For the given geometry of our device and considering density of water (997 kg/m3), and . The resultant force ends up being 6.7 × 10⁻⁵ N and the corresponding pressure drop at the valve interface is 3.6 kPa or 0.52 psi. The resultant acceleration from spinning (50 m/s2) did not significantly affect the Reynolds number, thus we still operate under laminar conditions. Interestingly, if we spin faster at a spin speed of 2500 rpm, more force is generated, causing chaotic mixing (Figure S4b), and establishing the potential to formulate both counter-diffusion (unmixed) and batch (mixed) crystallization trials. This flexibility in operation could be useful if the exact crystallization conditions are known, and one wishes merely to take advantage of the X-ray transparent setup that has been developed. On the other hand, counter-diffusive crystallization allows for the screening of large number of conditions from a single experiment in addition to avoiding manual handling of delicate protein crystals.
We also demonstrated the ability to successfully operate the device by placing single chip in a common laboratory centrifuge – a strategy that could be easily adopted in most structural biology laboratories. Furthermore, we demonstrated operation of the device by hand to completely remove the need for any ancillaries. To this end, we attached a single device onto a glass slide, loaded liquid, and then flicked the device a few times by hand to overcome the unfavorable wetting conditions present at the valve. Figure S4c shows the mixing of food dye when performed in this manner.
Sample Stability
We have previously demonstrated the ability of our SU-8 based devices to maintain sample stability and resist dehydration over time.51 The tests, which tracked the formation of bubbles in chambers containing aqueous food dye, had shown very high stability for devices sealed with epoxy and stored in a humid environment (no visible bubble formation over the span of 24 hrs), but did suffer from a ~40% loss when stored at ambient laboratory conditions over the same time period. While no significant evaporative losses are expected to occur during the relatively short time associated with X-ray data collection, regardless of the sample environment, water loss was a consideration during crystal growth. When crystallizing lysozyme, the devices were stored at 4°C whereas hub domain of human CaMKIIβ was crystallized at room temperature. This resulted in two different storage requirements for the different proteins due to the difference in the relative humidity of these two conditions. For lysozyme, simply sealing the device with epoxy and storing them in the refrigerator where the relative humidity was approximately 75% proved to be sufficient – very minimal evaporation was observed even after a week. The low evaporation can also be attributed to the relative humidity of saturated NaCl at 4°C being 76%. In contrast, CaMKIIβ crystals were grown at room temperature on the lab bench, where the relative humidity of the environment was in the range of 40–50%, while that of vapour in equilibrium with a saturated PEGmme550 was nearly 100%. Thus, for the CaMKIIβ trials simply sealing the device with epoxy was not sufficient to avoid evaporative losses. After only a day, enough liquid evaporated from the crystallization chamber to change the sample concentration and we were not able to successfully grow crystals. In order to stop this evaporation, we placed the device in a petri dish along with a wet Kimwipe containing 2 mL of the precipitant solution. This allowed the growth of CaMKIIβ hub domain crystal inside our devices without the problem of evaporation. For CaMKIIβ crystals, once the devices were placed into the humid environment, crystals typically appeared after 2–3 days and grew to a maximum size over the course of 1 week. Importantly, these samples remained stable for 3–4 weeks with negligible evaporation. Similar humidified sealing strategies were also implemented to ship devices containing crystals for X-ray analysis. As already demonstrated, the crystals remained stable for 3–4 weeks in such environment, and overnight shipping was accomplished without any apparent effect on the samples.
Protein Crystallization
Similar to the counter-diffusion experiment shown using food dye in Figure 4b, we set up crystallization trials using protein and precipitant solutions. Though we were unable to directly visualize the concentration gradients upon setup, the results of our crystallization trials for both lysozyme and CaMKIIβ were indicative of a counter-diffusion experiment (Figure 5). We observed a gradient in crystal size with smaller crystals forming closer to the precipitant side, and larger crystals forming closer to the protein side. This result was expected, as the high levels of supersaturation occurring near the initial interface of the two liquids were expected to drive significant nucleation. This high number of nucleation events would deplete the amount of available protein, and therefore result in smaller crystals. In contrast, lower levels of supersaturation deeper into the gradient towards the protein side resulted in only a few or even a single nucleation event such that the surrounding protein contributed to the growth of a significantly larger crystal.
Figure 5.

Polarized optical micrographs depicting the results of the counter-diffusive crystallization of (a) lysozyme and (b) the CaMKIIβ hub domain.
Background Scattering
Having demonstrated counter-diffusive protein crystallization, we investigated the background scattering of the devices with a goal of performing in situ X-ray structure determination. We designed our devices using a polymeric material that allowed for 97% transmission of 1 Å X-rays while providing sufficient thickness for device stability. While these transmission factor calculations (Figure S3 and Table S1) help us understand the total signal lost when the X-ray travels through the material, this does not characterize how background scattering will affect the signal-to-noise for diffraction data collected on-chip. To quantify background scattering we measured the diffraction signal in our device following the path shown in Figure 6c, where the X-ray goes through the device material surrounding the crystal. We picked three different locations in our device to investigate the effect of background scattering on signal-to-noise as a function of resolution. First, we examined the signal resulting from X-ray transmission through an empty crystallization chamber. This involves passage through 20 μm of polymeric material. We observed a maximum intensity of 0.6 A.U. resulting from scattering from the polymer at a resolution of 10 Å (Figure 6d orange plot). Next, we picked a spot in the crystallization chamber filled with the mother liquor. Here we observed scattering with an intensity just above 1 A.U. due to the presence of solvent (Figure 6d blue plot). Finally, we compared the scattering of a CaMKIIβ crystal grown on-chip (Figure 6d red plot). Interestingly, the background observed for the mother liquor was higher than that of the crystal, suggesting that the crystal largely fills the space within the device and excludes excess mother liquor. As part of future experimental optimization it could be possible to maximize signal-to-noise ratio by matching the chamber height to that of the protein crystals. It is noteworthy that even without such optimization, comparison of both 2D diffraction images (Figure 6e) and the corresponding 1D integrations (Figure 6d) show excellent signal-to-noise when comparing the observed diffraction peaks from the crystal with the diffuse scattering signal from the background.
Figure 6.

(a) Photograph of the circular centrifugal device containing 8 identical sections and (b) a single section cut out after successful on-chip crystallization and mounted on a magnetic mount. (c) Schematic depiction of the path of the X-ray follows through the device and crystal. (d) Graph of the 1D integrated X-ray intensity profiles comparing the relative strength of the observed diffraction signal from a CaMKIIβ crystal compared to the noise from background scattering due to the presence of device materials and crystallization solution as a function of resolution. (e) The 2D diffraction signal for the CaMKIIβ crystal collected in our centrifugal device at room temperature, corresponding to the red curve in (d). Data were collected at SSRL beamline 12–1.
It is also worth noting that the background scattering from our SU-8 devices has been shown previously to be lower than from the extruded cyclic olefin copolymer (COC) films typically used in commercial X-ray compatible crystallization platforms.51 While we estimate that the composition of SU-8 vs. COC would actually result in COC having slightly higher transmission (see Figure S6 and Table S1), we hypothesize that the higher background scattering for the COC is a result of alignment of the polymer chains during extrusion processing of the films. Thus, in situ crosslinking has potential advantages as a processing strategy for X-ray compatible devices broadly, though the experimental benefits would need to be weighed with production and cost considerations.
X-ray Crystallography
While the circular design of the overall device facilitates parallel processing of multiple crystallization trials, the size of a single device is better suited to the sample handling requirements in a typical X-ray instrument. The circular device containing protein crystals was cut into eight individual sections along the perforations, each of which were mounted onto a magnetic base (Figure 6b). Data collection was performed at beamline 12–1 at SSRL. To begin with, we collected diffraction data on lysozyme crystals grown on chip. The large size of our lysozyme crystals allowed for collection of a complete data set from a single crystal without significant signal loss due to radiation damage. The resulting diffraction data was analyzed and showed diffraction to high resolution (1.35 Å) with excellent completeness and good statistics (Table S3).
While we also attempted to collect a complete data set from each crystal of CaMKIIβ, we observed that signal loss due to radiation damage on smaller crystals (20–30 μm) prevented the collection of a complete data set. In contrast, larger crystals of CaMKIIβ (100–150 μm) allowed for the collection of a complete data set at room temperature (293 K). During data collection, we occasionally observed slight movement of the crystal, but it did not affect the diffraction signal or data processing. Examination of electron density maps generated from the best single crystal data set for CaMKIIβ resulted in a 2.64 Å resolution structure with reasonable statistics and completeness (Table 1).
Table 1.
Crystallographic statistics for data obtained at room temperature using on-chip diffraction of CaMKIIβ.a
| On-chip CaMKIIβ hub domain (PDB:7URY) | |
|---|---|
| Data collection | |
| Space group | C2221 |
| Cell dimensions | |
| a, b, c (Å) | 105.71, 182.8, 110.52 |
| α, β, γ (°) | 90, 90, 90 |
| Resolution (Å) | 50 – 2.64 (2.69 – 2.64) |
| R merge | 0.072 (0.443) |
| Mean I/σI | 4.4 (1.86) |
| Completeness (%) | 88.9 (91.5) |
| Redundancy | 3.6 (3.7) |
| CC1/2 | 0.997 (0.826) |
| CC* | 0.999 (0.951) |
| Refinement | |
| Resolution (Å) | 38.23 – 2.64 (2.707 – 2.64) |
| Unique reflections | 26822 (1942) |
| Rwork/Rfree (%) | 20.37/23.53 |
| No. atoms | |
| Protein | 7036 |
| Water | - |
| Ligand | 36 |
| Ramachandran plot | |
| In preferred regions (%) | 98.86 |
| In allowed regions (%) | 1.02 |
| Outliers (%) | 0.11 |
| B-factors | |
| Protein | 58.1 |
| Water | - |
| Ligand | 85.71 |
| R.M.S. deviationsb | |
| Bond lengths (Å) | 0.0044 |
| Bond angles (°) | 1.3236 |
Statistics for the high-resolution shell are indicated between brackets
Comparison of the final value for the geometric parameter (bond distance, bond angle etc.) to the ideal value, taken from the dictionary.65
Here we report a structure for the human CaMKIIβ tetradecameric hub domain (PDB:7URY, Figure 7a). Ca2+/calmodulin-dependent protein kinase II (CaMKII) is a multidomain serine/threonine protein kinase that is ubiquitously expressed. CaMKII subunits form a high-order oligomeric structure, and the hub domain of CaMKII confers this oligomerization.57 The oligomerization is mediated by two stacked ring shaped structures. There are four paralogue CaMKII genes which share high identity in their hub domains.58 Previous structural studies have shown that the hub domains of human CaMKII crystallized in dodecameric and tetradecameric states.59–61 One asymmetric unit for the tetradecamer consists of seven monomers, and the tetradecameric oligomer is completed by 2-fold symmetry. The quality of the data allows for the interpretation of structural details, including side chain conformations, as shown in Figure 7c.
Figure 7.

(a) Structure of the tetradecameric CaMKIIβ hub domain, as viewed from the top and side. (b) Overlay of monomeric hub domains of CaMKIIβ (blue), CaMKIIα (light grey), CaMKIIδ (grey) and CaMKIIγ (dark grey). (c) Representative 2Fo-Fc map contoured at σ=1.1 from the data collected from a single crystal grown on-chip.
To compare the reproducibility of our approach we collected data from 14 different crystals of CaMKIIβ across 5 microfluidic devices. Each of the data sets was indexed and we performed a statistical analysis of the unit cell parameters of all 14 individual crystals grown in the microfluidic device. We observed highly reproducible unit cell parameters amongst the crystals, which can be credited to reproducible gradient formations in the microfluidic device, as well as the low Grashoff number environment that minimizes the effect of buoyancy driven convection. The statistical analysis was performed after indexing and geometric refinement using methods described by Liu et al.68,69 We observed that the coefficient variation for the unit cell parameters , and was quite low: 0.66%, 0.70% and 0.69%, respectively (Figure S9a–c), demonstrating highs level of isomorphism. The variation of unit cell parameters were also calculated using standard Euclidean distance, and we observed that all indexable crystals had a value of only 1.9, which is significantly below the cutoff of 3.0 recommended by Liu et al. (Figure S7d.68,69 Similar results have also been reported previously by Perry et al. for protein crystallization performed in a PDMS-based microfluidic device.50
Although it was not designed as a systematic study, and it is difficult to know if the results might be altered with different cryoprotection strategies, we compared data for CaMKIIβ collected on-chip at room temperature and data obtained using more traditional single-crystal cryogenic conditions. Our results showed that the data obtained at room temperature from crystals grown on chip extended to higher resolution and with significantly higher quality than the data obtained using traditional cryocooling methods (Tables 1 and S2). While this result could be interpreted as evidence in favor of room temperature crystallography, it is important to acknowledge that the cryocooled sample required soaking in a cryoprotectant solution that the samples analyzed at room temperature did not experience, and that the handling and treatment of the cryocooled sample could have introduced damage into the crystal. However, structures are expected to have more dynamic motion at room temperature, and to suffer from more significant radiation damage – factors that would both be expected to adversely affect the structural resolution of the room temperature sample. Interestingly, we could clearly observe structural details, including clear electron density for 3 to 5 residues at the flexible C-terminus of the hub domain which were not distinguishable in the cryogenic data set. Thus, while we draw no conclusions about the potential data that might be achievable with further optimization of cryocooling procedures, the high quality and reproducibility of the diffraction data obtained from crystals grown on-chip and analyzed at room temperature suggests the possibility of successfully applying this approach to a broad range of targets, particularly those that may be challenging to cryoprotect.
Conclusion
In summary, we have developed a device capable of both on-chip protein crystallization via counter-diffusion and in situ X-ray crystallography to eliminate the manual handling of fragile protein crystals and streamline the process of protein structure analysis. A combination of photolithography and nanoimprint lithography allowed for the fabrication of hollow channels and chambers for metering and protein crystallization. While there are reports of microfluidic devices that crystallize proteins for on-chip analysis, many of these reports have required the use of silicone-based elastomers that have a higher scattering signal in tandem with external pressure pump-based systems that often employ very sophisticated manifold and connections.21,70–72 We took advantage of surface forces to create a liquid handling system that enables the metering necessary for protein crystallization, without the need for fluidic or pump connections. Our protocol involves simple pipetting and either spinning, centrifugation, or hand shaking to actuate the device. This allows for the straightforward setup of counter-diffusion protein crystallization trials to help survey a wide range of supersaturation conditions in a consistent and reproducible manner.
Using our setup, we crystallized both hen egg white lysozyme as a model system and human CaMKIIβ hub domain as a novel target and performed in situ X-ray diffraction at a synchrotron source. In addition to demonstrating the utility of our experimental strategy, the resulting data enabled analysis of the room temperature structure of the human CaMKIIβ hub domain as a tetradecameric oligomer. Furthermore, our results support the hypothesis that microfluidic control over concentration gradients, coupled with a microgravity-like environment help to enable the growth of reproducible, high-quality crystals. The ability to perform room temperature data collection on-chip has the potential to enable structure determination at physiologically-relevant conditions, and could prove useful for protein targets that are challenging to cryoprotect.
The use of UV curable polymer enables rapid prototyping and custom tailoring to address various experimental needs, such as varying the device thickness based on the anticipated crystal size to reduce background from the mother liquor, modifying channel dimensions to meter different volumes of samples, etc. This flexibility can be combined with the ability for counter-diffusion experiments to screen a wide range of crystallization space in a single experiment. Looking forward, this setup has the potential to facilitate microfluidics-assisted structure determination, even in laboratory settings without specialized equipment. Furthermore, this approach could be adapted for more complex experiments where the addition of a ligand for soaking experiments, or a triggering chemical for time-resolved studies is needed.
Supplementary Material
Figure 8.

Summary of the overall utility of the device. Operation involves simple pipetting and spinning of the device to set up counter-diffusive crystallization trials, while X-ray compatibility enables direct mounting of samples for in situ data collection at room temperature, and structure determination.
Acknowledgements
We would like acknowledge Dr. Shuo Sui, Diwakaran Rathinam Palaniswamy and Yaozu Chen for helpful discussions, Prof. Scott Garman for his assistance in processing the data, John Nicholson for clean room assistance, Neel Prakashchandra, for profilometer assistance, and Xiaoshuang Wei from the Bradley lab for assistance with contact angle measurements. All devices were fabricated at the University of Massachusetts Amherst Nanofabrication Cleanroom with support from the Institute for Applied Life Sciences.
This research was partially supported by a fellowship from the University of Massachusetts as part of the Chemistry-Biology Interface Training Program (National Research Service Award T32 GM139789). This investigation was also supported by the National Science Foundation STC award 1231306, PPG Corporation and NIGMS R01123157 (M.S.). In-house X-ray diffraction data were obtained at the University of Massachusetts Biophysical Characterization Facility. Use of the Stanford Synchrotron Radiation Lightsource, SLAC National Accelerator Laboratory, is supported by the U.S. Department of Energy, Office of Science, Office of Basic Energy Sciences under Contract No. DE-AC02-76SF00515. The SSRL Structural Molecular Biology Program is supported by the DOE Office of Biological and Environmental Research, and by the National Institutes of Health, National Institute of General Medical Sciences (including P41GM103393). The contents of this publication are solely the responsibility of the authors and do not necessarily represent the official views of NIGMS or NIH.
References
- 1.Berman HM, Kleywegt GJ, Nakamura H and Markley JL, Structure, 2012, 20, 391–396. [DOI] [PMC free article] [PubMed] [Google Scholar]
- 2.Giegé R, FEBS J, 2013, 280, 6456–6497. [DOI] [PubMed] [Google Scholar]
- 3.Perutz MF, Rossmann MG, Cullis AF, Muirhead H, Will G and North ACT, Nature, 1960. [DOI] [PubMed] [Google Scholar]
- 4.Grabowski M, Chruszcz M, Zimmerman MD, Kirillova O and Minor W, Infect. Disord. Targets (Formerly Curr. Drug Targets-Infectious Disord., 2009, 9, 459–474. [DOI] [PMC free article] [PubMed] [Google Scholar]
- 5.Drews J, Science (80-. )., 2000, 287, 1960–1964. [DOI] [PubMed] [Google Scholar]
- 6.Grudziąż K, Zawadzka-Kazimierczuk A and Koźmiński W, Methods, 2018, 148, 81–87. [DOI] [PubMed] [Google Scholar]
- 7.Bai X, McMullan G and Scheres SHW, Trends Biochem. Sci, 2015, 40, 49–57. [DOI] [PubMed] [Google Scholar]
- 8.Luft JR, Snell EH and DeTitta GT, Expert Opin. Drug Discov, 2011, 6, 465–480. [DOI] [PMC free article] [PubMed] [Google Scholar]
- 9.Luft JR, Newman J and Snell EH, Acta Crystallogr. Sect. F Struct. Biol. Commun, 2014, 70, 835–853. [DOI] [PMC free article] [PubMed] [Google Scholar]
- 10.Luft JR, Newman J and Snell EH, Acta Crystallogr. Sect. F, 2014, 70, 835–853. [DOI] [PMC free article] [PubMed] [Google Scholar]
- 11.Luft JR, Snell EH and DeTitta GT, Expert Opin. Drug Discov, 2011, 6, 465–480. [DOI] [PMC free article] [PubMed] [Google Scholar]
- 12.Luft JR, Collins RJ, Fehrman NA, Lauricella AM, Veatch CK and DeTitta GT, J. Struct. Biol, 2003, 142, 170–179. [DOI] [PubMed] [Google Scholar]
- 13.Caffrey M, J. Struct. Biol, 2003, 142, 108–132. [DOI] [PubMed] [Google Scholar]
- 14.Chayen NE and Saridakis E, Nat. Methods, 2008, 5, 147–153. [DOI] [PubMed] [Google Scholar]
- 15.McPherson A, Methods, 2004, 34, 254–265. [DOI] [PubMed] [Google Scholar]
- 16.Chayen NE, Prog. Biophys. Mol. Biol, 2005, 88, 329–337. [DOI] [PubMed] [Google Scholar]
- 17.Chayen NE, Saridakis E, El-Bahar R and Nemirovsky Y, J. Mol. Biol, 2001, 312, 591–595. [DOI] [PubMed] [Google Scholar]
- 18.D’Arcy A, Bergfors T, Cowan-Jacob SW and Marsh M, Acta Crystallogr. Sect. F, 2014, 70, 1117–1126. [DOI] [PMC free article] [PubMed] [Google Scholar]
- 19.Shaw Stewart PD, Kolek SA, Briggs RA, Chayen NE and Baldock PFM, Cryst. Growth Des, 2011, 11, 3432–3441. [Google Scholar]
- 20.Gavira JA, Hernandez-Hernandez MA, Gonzalez-Ramirez LA, Briggs RA, Kolek SA and Shaw Stewart PD, Cryst. Growth Des, 2011, 11, 2122–2126. [Google Scholar]
- 21.Pawate AS, Šrajer V, Schieferstein J, Guha S, Henning R, Kosheleva I, Schmidt M, Ren Z, Kenis PJA and Perry SL, Acta Crystallogr. Sect. F Struct. Biol. Commun, 2015, 71, 823–830. [DOI] [PMC free article] [PubMed] [Google Scholar]
- 22.Chayen NE, Stewart PDS and Blow DM, J. Cryst. Growth, 1992, 122, 176–180. [Google Scholar]
- 23.Benvenuti M and Mangani S, Nat. Protoc, 2007, 2, 1633–1651. [DOI] [PubMed] [Google Scholar]
- 24.Hampel A, Labanauskas M, Connors PG, Kirkegard L, Rajbhandary UL, Sigler PB and Bock RM, Science (80-. )., 1968, 162, 1384–1387. [DOI] [PubMed] [Google Scholar]
- 25.Chayen N, Acta Crystallogr. Sect. D, 1998, 54, 8–15. [DOI] [PubMed] [Google Scholar]
- 26.Junius N, Jaho S, Sallaz-Damaz Y, Borel F, Salmon J-B and Budayova-Spano M, Lab Chip, 2020, 20, 296–310. [DOI] [PubMed] [Google Scholar]
- 27.Newman J, Xu J and Willis MC, Acta Crystallogr. Sect. D Biol. Crystallogr, 2007, 63, 826–832. [DOI] [PubMed] [Google Scholar]
- 28.de Wijn R, Hennig O, Roche J, Engilberge S, Rollet K, Fernandez-Millan P, Brillet K, Betat H, Mörl M and Roussel A, IUCrJ, 2019, 6, 454–464. [DOI] [PMC free article] [PubMed] [Google Scholar]
- 29.Sauter C, Otálora F, Gavira JA, Vidal O, Giegé R and García-Ruiz JM, Acta Crystallogr. Sect. D Biol. Crystallogr, 2001, 57, 1119–1126. [DOI] [PubMed] [Google Scholar]
- 30.Zegers I, Carotenuto L, Evrard C, Garcia-Ruiz J, De Gieter P, Gonzales-Ramires L, Istasse E, Legros J-C, Martial J and Minetti C, Microgravity-Science Technol, 2006, 18, 165–169. [Google Scholar]
- 31.Hansen CL, Classen S, Berger JM and Quake SR, J. Am. Chem. Soc, 2006, 128, 3142–3143. [DOI] [PubMed] [Google Scholar]
- 32.Garcĺa-Ruiz JM, Otálora F, Novella ML, Gavira JA, Sauter C and Vidal O, J. Cryst. Growth, 2001, 232, 149–155. [Google Scholar]
- 33.Hansen C and Quake SR, Curr. Opin. Struct. Biol, 2003, 13, 538–544. [DOI] [PubMed] [Google Scholar]
- 34.Anderson MJ, Hansen CL and Quake SR, Proc. Natl. Acad. Sci, 2006, 103, 16746–16751. [DOI] [PMC free article] [PubMed] [Google Scholar]
- 35.Pinker F, Brun M, Morin P, Deman A-L, Chateaux J-F, Oliéric V, Stirnimann C, Lorber B, Terrier N and Ferrigno R, Cryst. Growth Des, 2013, 13, 3333–3340. [Google Scholar]
- 36.Carter DC, Rhodes P, McRee DE, Tari LW, Dougan DR, Snell G, Abola E and Stevens RC, J. Appl. Crystallogr, 2005, 38, 87–90. [Google Scholar]
- 37.Dhouib K, Malek CK, Pfleging W, Gauthier-Manuel B, Duffait R, Thuillier G, Ferrigno R, Jacquamet L, Ohana J and Ferrer J-L, Lab Chip, 2009, 9, 1412–1421. [DOI] [PubMed] [Google Scholar]
- 38.Hansen CL, Skordalakes E, Berger JM and Quake SR, Proc. Natl. Acad. Sci. U. S. A, 2002, 99, 16531–16536. [DOI] [PMC free article] [PubMed] [Google Scholar]
- 39.Van Der Woerd M, Ferree D and Pusey M, J. Struct. Biol, 2003, 142, 180–187. [DOI] [PubMed] [Google Scholar]
- 40.Garcia-Ruiz JM, Gonzalez-Ramirez LA, Gavira JA and Otálora F, Acta Crystallogr. Sect. D Biol. Crystallogr, 2002, 58, 1638–1642. [DOI] [PubMed] [Google Scholar]
- 41.Otálora F, Gavira JA, Ng JD and García-Ruiz JM, Prog. Biophys. Mol. Biol, 2009, 101, 26–37. [DOI] [PubMed] [Google Scholar]
- 42.Sui S and Perry SL, Struct. Dyn, , DOI: 10.1063/1.4979640. [DOI] [Google Scholar]
- 43.Kundrot CE, Judge RA, Pusey ML and Snell EH, Cryst. Growth Des, 2001, 1, 87–99. [Google Scholar]
- 44.Lorber B, Biochim. Biophys. Acta (BBA)-Proteins Proteomics, 2002, 1599, 1–8. [DOI] [PubMed] [Google Scholar]
- 45.Snell EH and Helliwell JR, Reports Prog. Phys, 2005, 68, 799. [Google Scholar]
- 46.Judge RA, Snell EH and Van Der Woerd MJ, Acta Crystallogr. Sect. D Biol. Crystallogr, 2005, 61, 763–771. [DOI] [PubMed] [Google Scholar]
- 47.McPherson A and DeLucas LJ, npj Microgravity, 2015, 1, 1–20. [DOI] [PMC free article] [PubMed] [Google Scholar]
- 48.Boyko KM, Timofeev VI, Samygina VR, Kuranova IP, Popov VO and Koval’chuk MV, Crystallogr. Reports, 2016, 61, 718–729. [Google Scholar]
- 49.WATANABE T, SASSA F, YOSHIZUMI Y and SUZUKI H, Electron. Commun. Japan, 2017, 100, 25–32. [Google Scholar]
- 50.Perry SL, Guha S, Pawate AS, Henning R, Kosheleva I, Srajer V, Kenis PJA and Ren Z, J. Appl. Crystallogr, 2014, 47, 1975–1982. [DOI] [PMC free article] [PubMed] [Google Scholar]
- 51.Sui S, Mulichak A, Kulathila R, McGee J, Filiatreault D, Saha S, Cohen A, Song J, Hung H, Selway J, Kirby C, Shrestha OK, Weihofen W, Fodor M, Xu M, Chopra R and Perry SL, J. Appl. Crystallogr, , DOI: 10.1107/S1600576721004155. [DOI] [PMC free article] [PubMed] [Google Scholar]
- 52.Haeberle S and Zengerle R, Lab Chip, 2007, 7, 1094–1110. [DOI] [PubMed] [Google Scholar]
- 53.Li L and Ismagilov RF, Annu. Rev. Biophys, 2010, 39, 139–158. [DOI] [PubMed] [Google Scholar]
- 54.Warkentin M and Thorne RE, Acta Crystallogr. Sect. D Biol. Crystallogr, 2010, 66, 1092–1100. [DOI] [PMC free article] [PubMed] [Google Scholar]
- 55.Nave C and Garman EF, J. Synchrotron Radiat, 2005, 12, 257–260. [DOI] [PubMed] [Google Scholar]
- 56.Fraser JS, van den Bedem H, Samelson AJ, Lang PT, Holton JM, Echols N and Alber T, Proc. Natl. Acad. Sci, 2011, 108, 16247–16252. [DOI] [PMC free article] [PubMed] [Google Scholar]
- 57.Bhattacharyya M, Karandur D and Kuriyan J, Cold Spring Harb. Perspect. Biol, 2020, 12, a035147. [DOI] [PMC free article] [PubMed] [Google Scholar]
- 58.Tobimatsu T and Fujisawa H, J. Biol. Chem, 1989, 264, 17907–17912. [PubMed] [Google Scholar]
- 59.Leurs U, Klein AB, McSpadden ED, Griem-Krey N, Solbak SMØ, Houlton J, Villumsen IS, Vogensen SB, Hamborg L and Gauger SJ, Proc. Natl. Acad. Sci. [Google Scholar]
- 60.Rellos P, Pike ACW, Niesen FH, Salah E, Lee WH, Von Delft F and Knapp S, PLoS Biol, 2010, 8, e1000426. [DOI] [PMC free article] [PubMed] [Google Scholar]
- 61.Bhattacharyya M, Stratton MM, Going CC, McSpadden ED, Huang Y, Susa AC, Elleman A, Cao YM, Pappireddi N and Burkhardt P, Elife, 2016, 5, e13405. [DOI] [PMC free article] [PubMed] [Google Scholar]
- 62.Minor W, Cymborowski M, Otwinowski Z and Chruszcz M, Acta Crystallogr. Sect. D Biol. Crystallogr, 2006, 62, 859–866. [DOI] [PubMed] [Google Scholar]
- 63.McCoy AJ, Grosse-Kunstleve RW, Adams PD, Winn MD, Storoni LC and Read RJ, J. Appl. Crystallogr, 2007, 40, 658–674. [DOI] [PMC free article] [PubMed] [Google Scholar]
- 64.Emsley P, Lohkamp B, Scott WG and Cowtan K, Acta Crystallogr. Sect. D Biol. Crystallogr, 2010, 66, 486–501. [DOI] [PMC free article] [PubMed] [Google Scholar]
- 65.Winn MD, Ballard CC, Cowtan KD, Dodson EJ, Emsley P, Evans PR, Keegan RM, Krissinel EB, Leslie AGW and McCoy A, Acta Crystallogr. Sect. D Biol. Crystallogr, 2011, 67, 235–242. [DOI] [PMC free article] [PubMed] [Google Scholar]
- 66.Murshudov GN, Vagin AA and Dodson EJ, Acta Crystallogr. Sect. D Biol. Crystallogr, 1997, 53, 240–255. [DOI] [PubMed] [Google Scholar]
- 67.Ilavsky J, J. Appl. Crystallogr, 2012, 45, 324–328. [Google Scholar]
- 68.Liu Q and Hendrickson WA, Acta Crystallogr. Sect. D Biol. Crystallogr, 2013, 69, 1314–1332. [DOI] [PMC free article] [PubMed] [Google Scholar]
- 69.Liu Q, Dahmane T, Zhang Z, Assur Z, Brasch J, Shapiro L, Mancia F and Hendrickson WA, Science (80-. )., 2012, 336, 1033–1037. [DOI] [PMC free article] [PubMed] [Google Scholar]
- 70.Perry SL, Higdon JJL and Kenis PJA, Lab Chip, 2010, 10, 3112–3124. [DOI] [PMC free article] [PubMed] [Google Scholar]
- 71.Perry SL, Guha S, Pawate AS, Bhaskarla A, Agarwal V, Nair SK and Kenis PJA, Lab Chip, 2013, 13, 3183. [DOI] [PMC free article] [PubMed] [Google Scholar]
- 72.Hansen CL, Skordalakes E, Berger JM and Quake SR, Proc. Natl. Acad. Sci, 2002, 99, 16531–16536. [DOI] [PMC free article] [PubMed] [Google Scholar]
Associated Data
This section collects any data citations, data availability statements, or supplementary materials included in this article.