eLife logoLink to eLife
. 2023 Oct 20;12:e90681. doi: 10.7554/eLife.90681

Conserved biophysical compatibility among the highly variable germline-encoded regions shapes TCR-MHC interactions

Christopher T Boughter 1,, Martin Meier-Schellersheim 1,
Editors: Armita Nourmohammad2, Tadatsugu Taniguchi3
PMCID: PMC10631762  PMID: 37861280

Abstract

T cells are critically important components of the adaptive immune system primarily responsible for identifying and responding to pathogenic challenges. This recognition of pathogens is driven by the interaction between membrane-bound T cell receptors (TCRs) and antigenic peptides presented on major histocompatibility complex (MHC) molecules. The formation of the TCR-peptide-MHC complex (TCR-pMHC) involves interactions among germline-encoded and hypervariable amino acids. Germline-encoded and hypervariable regions can form contacts critical for complex formation, but only interactions between germline-encoded contacts are likely to be shared across many of all the possible productive TCR-pMHC complexes. Despite this, experimental investigation of these interactions have focused on only a small fraction of the possible interaction space. To address this, we analyzed every possible germline-encoded TCR-MHC contact in humans, thereby generating the first comprehensive characterization of these largely antigen-independent interactions. Our computational analysis suggests that germline-encoded TCR-MHC interactions that are conserved at the sequence level are rare due to the high amino acid diversity of the TCR CDR1 and CDR2 loops, and that such conservation is unlikely to dominate the dynamic protein-protein binding interface. Instead, we propose that binding properties such as the docking orientation are defined by regions of biophysical compatibility between these loops and the MHC surface.

Research organism: Human

Introduction

The interaction between T cell receptors (TCRs) and the peptide-presenting major histocompatibility complex (pMHC) molecule is a nanometer-scale recognition event with macroscopic consequences for health and control of disease. In αβ T cells, the six complementarity-determining region (CDR) loops of the TCR are responsible for scanning the pMHC surface and determining the appropriate immunological response. Since the first crystal structures of a TCR-pMHC complex were solved in 1996 (Garcia et al., 1996; Garboczi et al., 1996), general ‘rules of engagement’ between TCR and pMHC have been identified and reliably reproduced in subsequent structures (Garcia et al., 1999; Yin et al., 2012). First, the peptide is presented in the ‘groove’ formed by the two α-helices of either the class I or class II MHC molecule (Bjorkman et al., 1987; Brown et al., 1993). The TCR then scans this peptide primarily using the highly diverse CDR3 loops of the TCRα and TCRβ chains, whose sequences are determined by V(D)J recombination (Wu et al., 2002; Jung and Alt, 2004). The sequences of the remaining two CDR1 and CDR2 loops of the α and β chains are entirely determined by germline TRAV and TRBV genes, respectively. In a majority of structures, these CDR1 and CDR2 loops make a number of key contacts with well-defined regions of the likewise germline-encoded MHC α-helices (Gras et al., 2012).

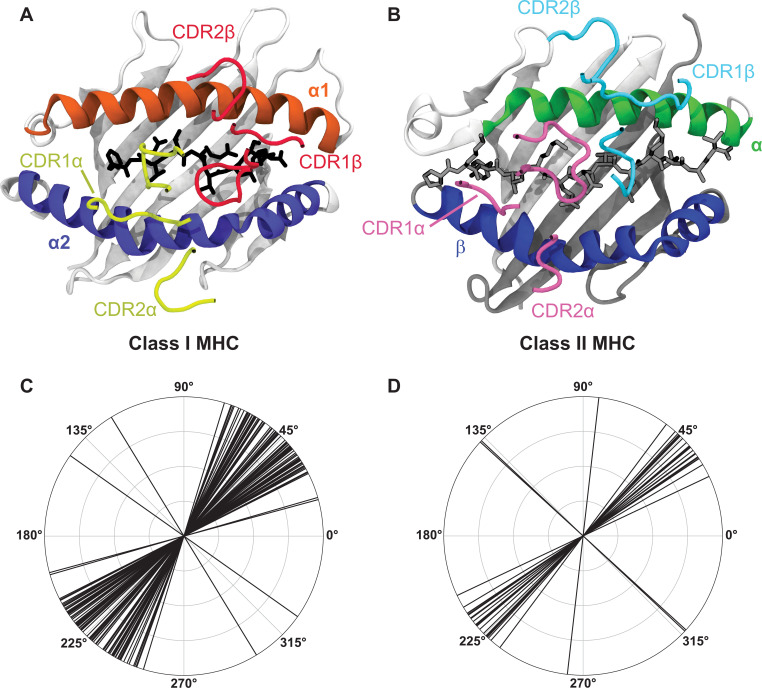
Importantly, previous work has found a large list of deviations from these classic ‘rules of engagement’. The hypervariable CDR3 residues can dominate the interactions with the germline-encoded MHC α-helices (Piepenbrink et al., 2013; Singh et al., 2022), germline-encoded CDRs can interact strongly with peptide (Piepenbrink et al., 2013), an exceptionally long peptide can ‘bulge’ causing separation between germline-encoded regions (Tynan et al., 2005), or the docking orientation can even be entirely reversed (Beringer et al., 2015; Gras et al., 2016; Zareie et al., 2021). When considering the large number of possible TCR-pMHC interactions and the substantial crossreactivity of TCRs (Riley et al., 2018; Sewell, 2012), these historically non-canonical interactions may in fact be rather common. Despite this great variability inherent in TCR-pMHC complex formation, the docking orientation of the TCR over MHC molecules (Figure 1A and B) falls within a tight distribution of angles for the majority of structures solved thus far (Figure 1C and D) nearly independent of the strong variation in the CDR3 and peptide sequences involved. This suggests that interactions between germline-encoded regions play fundamentally important roles.

Figure 1. A breakdown of the canonical docking orientation adopted by TCRs over the pMHC complex in all solved crystal structures to date highlights the strong structural conservation of the TCR-pMHC interaction.

Figure 1.

(A, B) Example renderings of TCR-pMHC complexes for class I (A, PDB: 6MTM) and class II (B, PDB: 1J8H) MHC molecules. The CDR loops are largely representative of the placement over the MHC helices and peptide for the vast majority of TCR-pMHC complexes. (C, D) Polar coordinate plots of TCR docking angles over class I (C) and class II (D) MHC molecules (data via the TCR3D database Gowthaman and Pierce, 2019). Note that these docking angles do not perfectly overlay on to the structures of panels A and B, as there are also slight deviations in the location of the TCR center of mass over the MHC complex.

However, it remains unclear whether germline-encoded residues enforce the orientational preference highlighted in Figure 1, or if this preference is a consequence of thymic selection (Van Laethem et al., 2007; Tikhonova et al., 2012; Van Laethem et al., 2012), whereby T cells are first positively selected on TCR recognition of MHC molecules and later negatively selected against autoreactivity towards MHC molecules loaded with organismal self-peptides (Blackman et al., 1990; Juang et al., 2010; Germain, 2002). This selection occurs in the presence of the potentially orientation-determining co-receptors CD4 or CD8. However, evidence for this hypothesis of docking determined by selection comes largely from a study utilizing a knockout system that deviates strongly from the physiological norm (Van Laethem et al., 2007), or from the identification of rare ‘reverse-docking’ TCRs (Beringer et al., 2015; Gras et al., 2016; Zareie et al., 2021). Alternatively, the extent of this orientational preference may reflect a co-evolution of interacting, germline-encoded regions of TCR and MHC molecules. In support of this hypothesis, a number of mouse studies have identified key residue pairs critical for TCR-pMHC binding which were later structurally validated and found in other, distantly related organisms (Scott-Browne et al., 2009; Krovi et al., 2019; Feng et al., 2007; Blevins et al., 2016; Scott-Browne et al., 2011; Dai et al., 2008). While these studies find evidence of conserved interactions for a small subset of alleles, no work thus far has found consistent conservation across the full range of possible TCR-MHC molecule interactions.

These observations underscore the need for a more thorough understanding of the fundamental role of CDR1 and CDR2 in the recognition of pMHC complexes, either as sculptors of the TCR-pMHC interface, or as opportunistic reinforcements to a protein-protein interaction largely determined by the CDR3 loops and peptide involved. Due in part to the concentration of diversity at the CDR3-peptide interface, a majority of studies characterizing TCR-pMHC interactions have focused on describing immune recognition events in the context of this interface (Birnbaum et al., 2014; Sharon et al., 2016; Sibener et al., 2018; Krovi et al., 2019; Burrows et al., 2010; Ishigaki et al., 2022). This runs counter to the relative contributions of the germline-encoded regions that account for a majority (75–80%) of the binding interface (Garcia et al., 2009). The progress made thus far can largely be attributed to X-ray crystallography, the gold standard for the study of TCR-pMHC interactions. However, this approach is severely limited by its low-throughput nature, calling its utility for this particular combinatorial problem into question. While a majority of the 45 productive TCRα-encoding TRAV and 48 productive TCRβ-encoding TRBV genes in humans have been crystallized at least once in complex with pMHC (Gowthaman and Pierce, 2019), the total of 149 crystallized human TCR-pMHC complexes pales in comparison to the 2160 possible productive TRAV-TRBV pairings. When we further consider the nearly 900 known unique amino acid sequences of class I MHC in humans (also referred to as class I human leukocyte antigen - HLA), we find that structural studies to date have covered less than 0.01% of the total possible TCR-MHC germline interaction space.

While structural modeling is an intriguing alternative (Milighetti et al., 2021), predictions of the conformations adopted by flexible TCR or antibody CDR loops and the placement of the antigen-contacting amino acid side chains on these loops have been found to be somewhat unreliable (Evans et al., 2022). In the work reported here, we explore how much insight about TCR-MHC interactions can be gained using a simplified, pseudo-structural representation of the biophysics of protein interactions that scores amino acid interactions as either productive, neutral, or counter-productive with regard to complex formation. Using the Automated Immune Molecule Separator (AIMS) software (Boughter et al., 2020; Boughter and Meier-Schellersheim, 2023) we generated the first systematic characterization of every germline-encoded TRAV-MHC and TRBV-MHC interaction through such a pseudo-structural approach. The AIMS architecture allows us to analyze the CDR1 and CDR2 contributions to interactions with MHC molecules independent of CDR3, providing a not previously explored antigen-independent perspective on the TCR-MHC complex. We find that the great diversity present in the CDR1 and CDR2 loops encoded by TRAV and TRBV genes in humans, as well as the dynamic nature of amino acid side chains, makes strongly conserved interactions between TCR germline-encoded residues and MHC α-helices highly unlikely. This suggests that the few strongly evolutionarily conserved interactions that have been identified previously in the literature should be considered exceptions and not the rule. Importantly, however, analyzing the biophysical compatibility for each germline-encoded CDR residue and those on the MHC α-helices, we find evidence of an evolutionary conserved region of permissible binding on the MHC molecular surface responsible for the observed canonical orientation of the TCR-MHC molecular complex. These measures of biophysical compatibility between germline CDRs and MHC α-helices can be used as a basis for understanding TCR-pMHC interactions, and as a tool for understanding how perturbations to these regions alter these interactions.

Results

Starting from the TRAV and TRBV protein entries from the ImMunoGeneTics (IMGT) database (Brochet et al., 2008; Lefranc, 2014) and the IMGT-HLA database containing all identified HLA alleles (Mack et al., 2013), we include only productive genes and unique amino acid sequences in our final analysis dataset. This final dataset included a total of 882 unique class I MHC sequences (HLA-A, B, and C), 44 class II α chain sequences (HLA-DQα, DRα, and DPα), and 431 class II β chain sequences (HLA-DQβ, DRβ, and DPβ). Due to significant differences in the alignments and more nuanced differences in the structures of these MHC molecules, we analyzed these three groups separately and compare the results as appropriate.

Polymorphic HLA molecules are far less diverse than human TRAV and TRBV genes

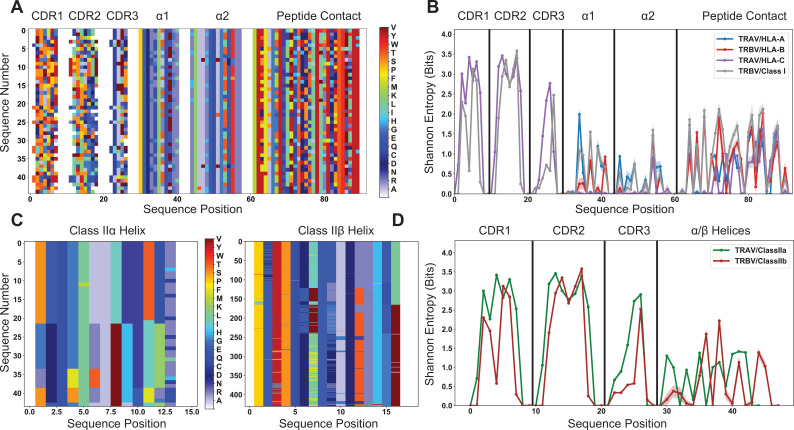
We first searched for potentially conserved interactions between TCR and MHC molecules that would suggest a strong coevolution between the two. Such biases in the amino acid usage of TCR and MHC molecules at specific sites can occur either in the form of full amino acid conservation, or as pairs of meaningfully co-varying amino acids found across multiple diverse sites. Without the structural data necessary to precisely identify these conserved interactions, we can characterize the diversity present in TRAV, TRBV, and HLA amino acid sequences using bioinformatic approaches and determine whether a conserved germline-encoded interaction is possible for each unique molecular combination. We quantified the diversity in these molecular subsets using concepts from information theory. Specifically, the amino acid diversity of each TRAV, TRBV, and HLA sequence encoded into an alignment matrix (Figure 2A) was quantified by calculating the Shannon entropy (Shannon, 1948) for each individual dataset (Figure 2B). The alignment matrix of Figure 2A provides the basis for all of our pseudo-structural analyses throughout this manuscript. The incorporated structural information goes as far as picking out the CDR loops of each TRAV/TRBV sequence and α-helices of each MHC sequence, but does not make explicit assumptions about relative structural orientations.

Figure 2. Quantification of diversity of TRAV, TRBV, and HLA alleles reveals limited sites for fully conserved interactions.

(A) Visualization of the TRAV amino acid sequences paired with a subsampled HLA class I dataset. (B) This subsampling is repeated 1000 times to generate the average population Shannon entropy for each allelic subset as a function of position in the matrix of (A). (C) Visualization of the alignment-encoded matrices of HLA class IIa and classIIb datasets. (D) Calculated position-sensitive entropy for the HLA class IIa and class IIb datasets using the same subsampling scheme as (B). The color bar for panels (A) and (C) give the amino acid key for the matrix encoding, where each individual color represents an individual amino acid, and gaps in the matrix are colored white. In panels (B) and (D), the maximal entropy for the 20 possible amino acids at a given site is 4.3 bits, whereas an entropy of 0 bits represents a fully conserved amino acid. Variation in the entropies over subsampling repetitions is represented by the standard deviation as shadowed regions around the solid line averages.

Figure 2.

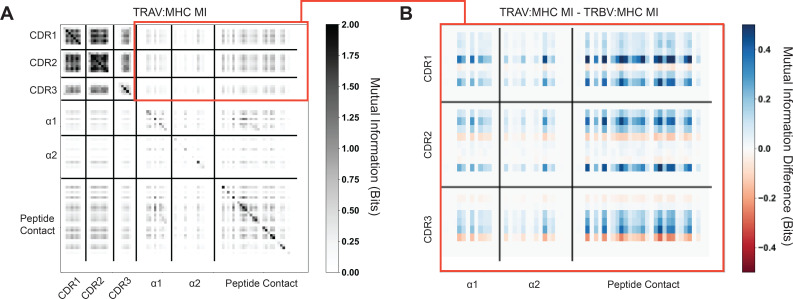
Figure 2—figure supplement 1. Quantification of mutual information (MI) between germline encoded TCR regions and MHC α-helices show no strong signal.

Figure 2—figure supplement 1.

Peptide-contacting residues of the MHC platform domain are included as a reference. (A) Mutual information calculated between TRAV germline encoded regions and specific structural features of class I HLA molecules. The boxed red region highlights the TCR-MHC mutual information, which is then further characterized in (B). Within-molecule mutual information (i.e. TCR-TCR and MHC-MHC) shows clear signals of co-variation over each dataset, contrasting strongly with the TCR-MHC mutual information. (B) Difference calculated between TRAV-MHC mutual information (MI) and TRBV-MHC mutual information (MI) to search for patterns in co-varying residues that differ between the two datasets. Positive values signify increased TRAV-MHC MI in that region, whereas negative values signify increased TRBV-MHC MI in that region. We would expect that TRBV-MHC MI should be higher (blue) in the α1-helix region, whereas TRAV-MHC MI should be higher (red) in the α2-helix region. Neither trend is seen strongly here.
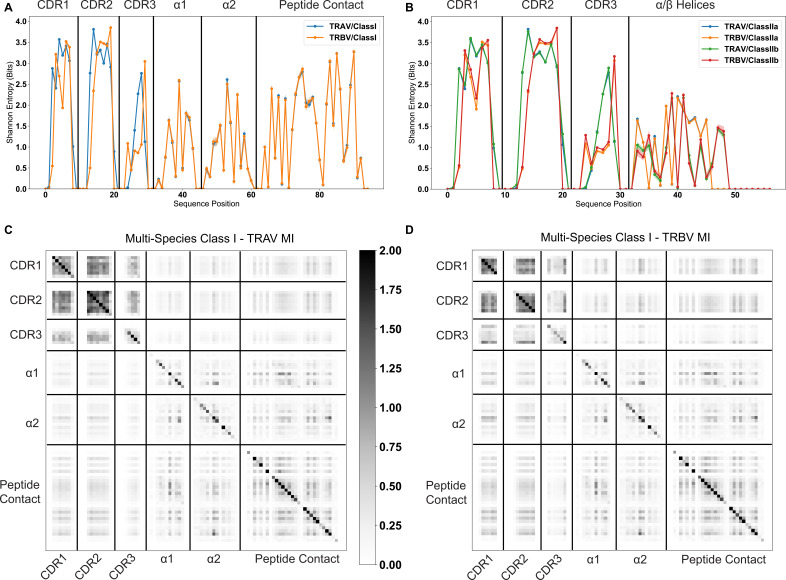
Figure 2—figure supplement 2. Information theoretic analysis of TCR-MHC pairs from a range of mammalian species shows that strongly co-varying residues between TCR and MHC germline sequences are rare.

Figure 2—figure supplement 2.

TCR-MHC pairs are matched for each bootstrapped sample, as discussed in the above methods. (A) Average bootstrapped Shannon entropy of CDR1, CDR2, and CDR3 for TRAV and TRBV amino acid sequences coupled with class I sequences. (B) Average bootstrapped Shannon entropy of CDR1, CDR2, and CDR3 for TRAV and TRBV amino acid sequences coupled with class II sequences. Standard deviation given by width of lines. Site-wise mutual information is calculated from the entropies in panel (A), with class I - TRAV MI calculated in (C) and class I - TRBV MI in (D).
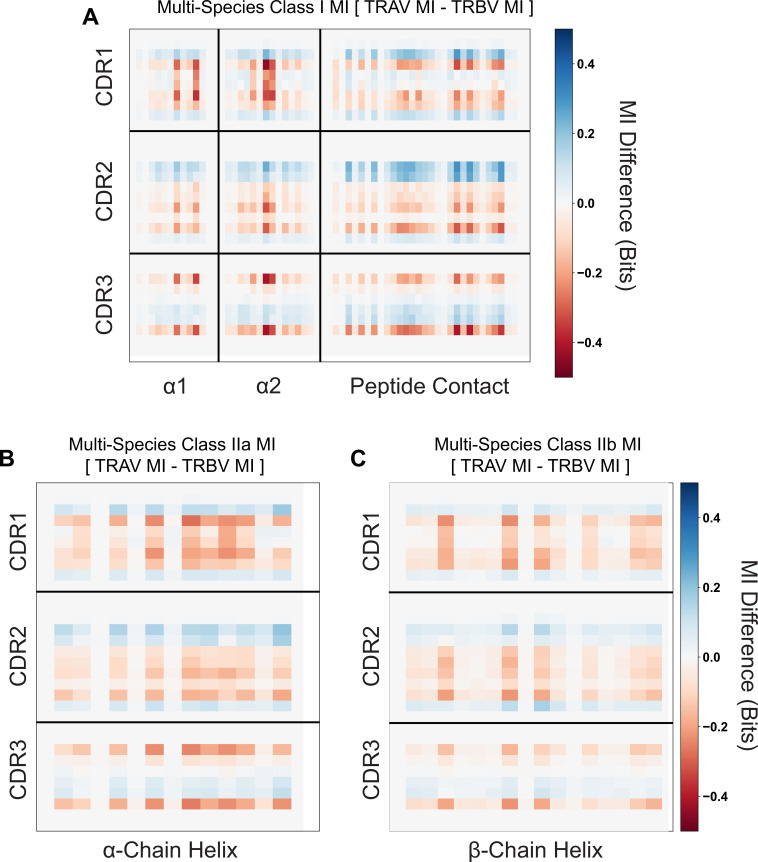
Figure 2—figure supplement 3. Mutual information differences between calculated TRAV and TRBV quantities from Figure 2—figure supplement 2C, D (A), or from class IIa (B), or class IIb (C) quantities.

Figure 2—figure supplement 3.

Positions shaded blue represent a stronger MHC-TRAV signal, whereas red positions represent stronger MHC-TRBV signals.
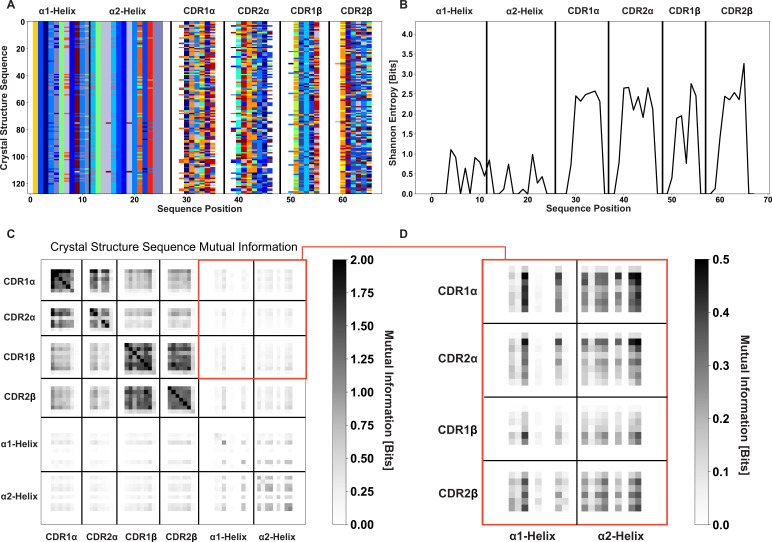
Figure 2—figure supplement 4. Information theoretic metrics for crystallized TCR-MHC pairs validate the combinatorial calculation approaches of Figure 2 and Figure 2—figure supplements 13.

Figure 2—figure supplement 4.

(A) AIMS encoding of the germline-encoded amino acids of crystallized class I complexes deposited to the PDB. (B) Shannon entropy calculations show roughly similar MHC diversity to the full dataset but substantially decreased CDR diversity. Despite this, we still find substantial TRAV-TRAV and TRBV-TRBV mutual information (C). However, a zoom in of the mutual information between TRAV/TRBV and MHC (D) shows no clear signal for a preference between TRAV-α2 and TRBV-α1 interactions.

Figure 2B indicates that the TRAV and TRBV genes are very diverse, even more so than the polymorphic HLA alleles. Despite the low number of TRAV and TRBV genes significant diversity persists in CDR1 and CDR2, suggesting limited conservation in those residues most likely to contact the MHC surface. Further, most of the entropy in MHC class I alleles is concentrated in the peptide-binding region. In this more diverse region the entropy tops out at around 2 bits, which corresponds to at most 4 equiprobable amino acids, or a distribution of a slightly larger number of amino acids strongly skewed towards one particular amino acid. In the α-helical regions that are in contact with the germline-encoded CDR loops, the class I entropy reaches a maximum of 1.5 bits, or at most 3 equiprobable amino acids. These same trends persist for the analysis of class II HLA alleles, with sequence diversity more limited in the class II α-helices when compared to the germline-encoded CDR loops (Figure 2C and D).

HLA alleles are polymorphic, which can be misconstrued as having high sequence diversity in MHC molecules across the human population. However, the polymorphic sites are limited to a minority of the total variable positions within the MHC nucleotide sequences (Robinson et al., 2017), which suggests even more limited variability at the amino acid level. While there are many unique alleles, these alleles are largely similar, especially when compared to other, more diverse protein families that are strongly structurally conserved but sequentially divergent, as in the neuronal Dpr-DIP system in Drosophila melanogaster (Nandigrami et al., 2022). Conversely, despite the low number of TCR germline genes present in humans, the diversity is substantial, with multiple sites across the CDR loops harboring over 10 unique amino acids. This mismatched diversity between the TCR germline-encoded CDR loops and the MHC α-helices suggests that conserved germline-encoded interactions are unlikely to exist for every possible molecular combination, either within a single individual or across the human population more broadly. Mutual information calculations (see Methods) corroborate these observations by quantifying this lack of co-variation of germline-encoded TCR and MHC residues in both humans (Figure 2—figure supplement 1) and in a wider range of mammals (Figure 2—figure supplements 2 and 3). If we limit these mutual information calculations solely to those TCR-MHC pairs that have been crystallized in complex, we see this lack of co-variation persists (Figure 2—figure supplement 4).

Biophysical diversity in TRAV and TRBV genes makes strongly conserved contacts across HLA molecules unlikely

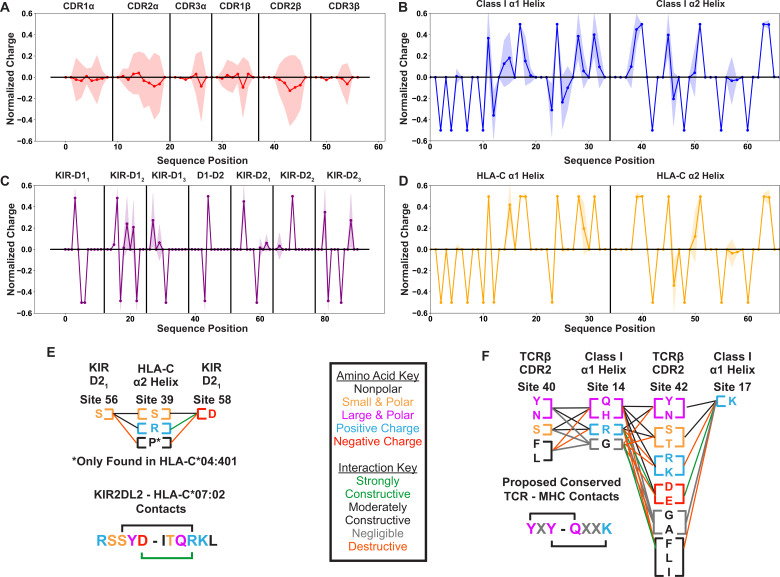
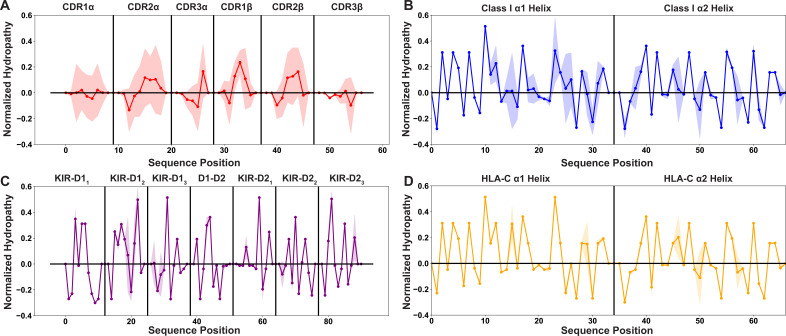
The diversity in TRAV and TRBV germline-encoded regions that we had found excluded the possibility of conserved contacts as key mediators across all TCR-MHC germline-encoded interactions. However, this did not rule out the possibility that within this diversity, there are conserved biophysical interactions. For example, a site on CDR2β could be highly diverse, but only allow expression of hydrophilic residues of neutral charge. Pairing this with an α-helical site on HLA molecules which likewise only permits hydrophilic residues would represent a likely site of conserved interaction. We can test for such relations by quantifying the position-sensitive amino acid biophysical properties for both the germline-encoded TCR (Figure 3A) and HLA (Figure 3B) residues. Looking at both the position-sensitive charge (Figure 3) and the position-sensitive hydropathy (Figure 3—figure supplement 1), we see that the substantial diversity in the TRAV and TRBV sequences corresponds to a similar biophysical diversity in the amino acids found across the germline-encoded CDR loops.

Figure 3. Position sensitive biophysical characterization of germline-encoded CDR loops highlights increased variation when compared to KIR or MHC sequences.

Position sensitive amino acid charge averaged over all germline-encoded TCR CDR loops (n=48) (A), MHC class I α-helices (n=882) (B), KIR MHC-contacting regions (n=31) (C), or HLA-C α-helices (n=265) (D). Solid lines represent averages over unique amino acid sequences, while the standard deviations about these averages are given by the shaded regions. Visualization of specific interactions for KIR-MHC (E) or TCR-MHC (F) and their relative conservation across each respective dataset. Interactions are represented either in a single sequence context where a known binding network exists or as columns of residues present across polymorphisms or across TRBV genes. Key in the center gives color coding for either the biophysical properties of each amino acid (letters) or the relative contribution of these amino acids to an interaction interface (lines). Charges are normalized to a mean of 0 and a standard deviation of 1. Only polymorphisms across two-domain KIRs with well-characterized binding partners (KIR2DL1, 2DL2, 2DL3, 2DS1, 2DS2) are considered.

Figure 3.

Figure 3—figure supplement 1. Position-sensitive hydropathy shows similar trends to the position-sensitive charge, showing higher variability in the germline-encoded TCR CDR loops than all other tested datasets.

Figure 3—figure supplement 1.

Position sensitive amino acid hydropathy averaged over all germline-encoded TCR CDR loops (n=48) (A), MHC class I α-helices (n=882) (B), KIR MHC-contacting regions (n=31) (C), or HLA-C α-helices (n=265) (D). Solid lines represent averages over unique amino acid sequences, while the standard deviations about these averages are given by the shaded regions. A positive hydropathy score corresponds to a hydrophilic residue, while a negative score corresponds to a hydrophobic residue. Scores are normalized to a mean of 0 and a standard deviation of 1.
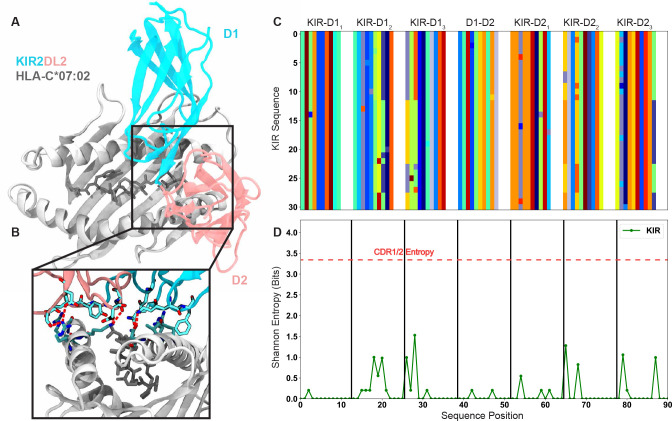
Figure 3—figure supplement 2. The killer cell immunoglobulin-like receptors (KIRs) and their recognition of HLA-C represent a suitable comparison to the germline-encoded CDR loops and their recognition of MHC.

Figure 3—figure supplement 2.

(A) Structure of KIR2DL2 in complex with HLA-C*07:02 [PDB: 6PA1] highlights the conserved binding mode of KIR. (B) Inset highlighting the salt bridge and hydrogen bonding network in the KIR-MHC interface shown in (A). Red lines represent electrostatic interactions. (C) Matrix encoding and alignment of the MHC-contacting regions of the KIR. Each color represents a unique amino acid. (D) Position-sensitive Shannon entropy from the matrix in (C) highlighting the exceptionally low diversity of the KIRs in the MHC-contacting regions.

To put these results into perspective, we compared them to corresponding variabilities found for another class of molecules that interact with the MHC. The killer cell immunoglobulin-like receptors (KIRs) largely recognize the MHC class I subset HLA-C, subsequently relaying either inhibitory or stimulatory signals to the natural killer cell expressing these KIRs (Thielens et al., 2012). While each individual possesses a fixed subset of KIRs, with no analogous diversity introduced by a V(D)J-like process, polymorphisms in these KIRs exist across the human population (Robinson et al., 2010). The interactions between these KIRs and HLA-C molecules are more well-defined than the germline-encoded interactions between TCR and MHC molecules, with strong salt bridge and hydrogen bond networks in place between two immunoglobulin-like domains of the KIR and each α-helix of HLA-C (Figure 3—figure supplement 2A, B; Moradi et al., 2015; Moradi et al., 2021).

We found that from an initial dataset of 369 KIR polymorphisms compiled from the IPD-KIR database (Robinson et al., 2010), only 31 productive alleles have unique amino acid sequences in the MHC molecule-binding region with very limited diversity (Figure 3—figure supplement 2C, D). Further, within the few moderately diverse sites, we found almost no variation in the biophysical properties of the amino acids contacting the MHC molecule, or in those of the amino acids on the HLA-C α-helices (Figure 3C and D). We further contextualized these findings with specific examples from KIR-MHC and TCR-MHC molecular interactions (Figure 3E and F). We selected a key hydrogen bonding network in the KIR2DL2-HLA-C*07:02 interface (Moradi et al., 2021) and compared this to the evolutionarily conserved YXY motif of CDR2β (Feng et al., 2007; Scott-Browne et al., 2011) found in a small subset of human TRBV genes. From this, we can see how diversity in each region reinforces or disrupts potentially conserved interactions at each site. Across all KIRs tested, the interacting residues are fully conserved, suggesting diversity is not tolerated at these sites. Similarly, diversity is exceptionally limited at the interacting sites on the HLA-C α2 helix.

Contrasting this with the regions involved in the YXY motif interactions, we see much higher diversity across both the TCR and MHC molecules. Considering specifically the conserved lysine on the α1 helix, we see that some of the residues utilized by TRBV-encoded CDR2 would create a strong conflict with the proposed conserved interaction site. While the YXY motif present on a few TRBV genes is clearly evolutionarily conserved (Scott-Browne et al., 2011) it is evident that substitutions either on CDR2β or on the MHC α1 helix would disrupt this interaction. These results strongly suggest that conserved interactions between germline-encoded CDR loops and MHC α-helices are deviations from the norm, and that CDR1 and CDR2 loops of TCRα and TCRβ likely adopt a more opportunistic binding strategy.

Calculation of TCR-MHC interaction potentials finds strong differences in germline-encoded recognition strategies

While our information-theoretic and biophysical analyses suggested limited conserved contacts between TCR α/β CDR1 and CDR2 loops and MHC helices, they did not rule out coevolution at the level of biophysical compatibility over a broader interaction region. To explore the possibility of such coevolution that does not manifest itself at the level of genetic correlations, we analyzed TCR-MHC compatibility using the previously-validated (Nandigrami et al., 2022) AIMS interaction potential. Using a simplified potential to estimate protein interaction propensities, analyses performed with AIMS contain few implicit assumptions and compare favorably with more detailed and computationally expensive models. In a binary classification of a large database of structurally similar protein complexes, a combination of the AIMS interaction potential and a linear discriminant analysis-based classifier was capable of distinguishing binders and non-binders to an accuracy of 80%, whereas calculations run on over 45 µs of simulated all-atom trajectories could only distinguish to an accuracy of 50%. While not as biophysically descriptive as methods such as alchemical free energy perturbation (Gumbart et al., 2013b) or potential of mean force-based calculations (Gumbart et al., 2013a), the AIMS interaction potential generates accurate predictions for problems that are intractable with current limitations to computation due to the number of protein complexes of interest.

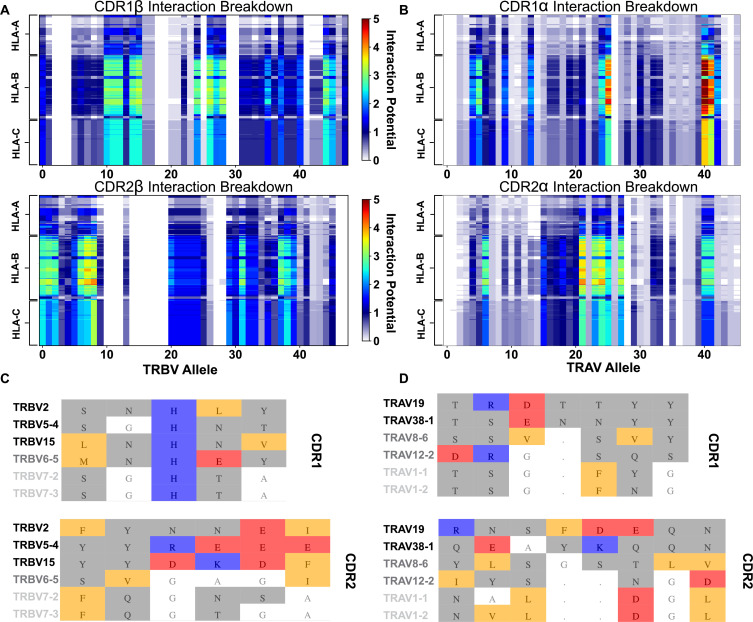
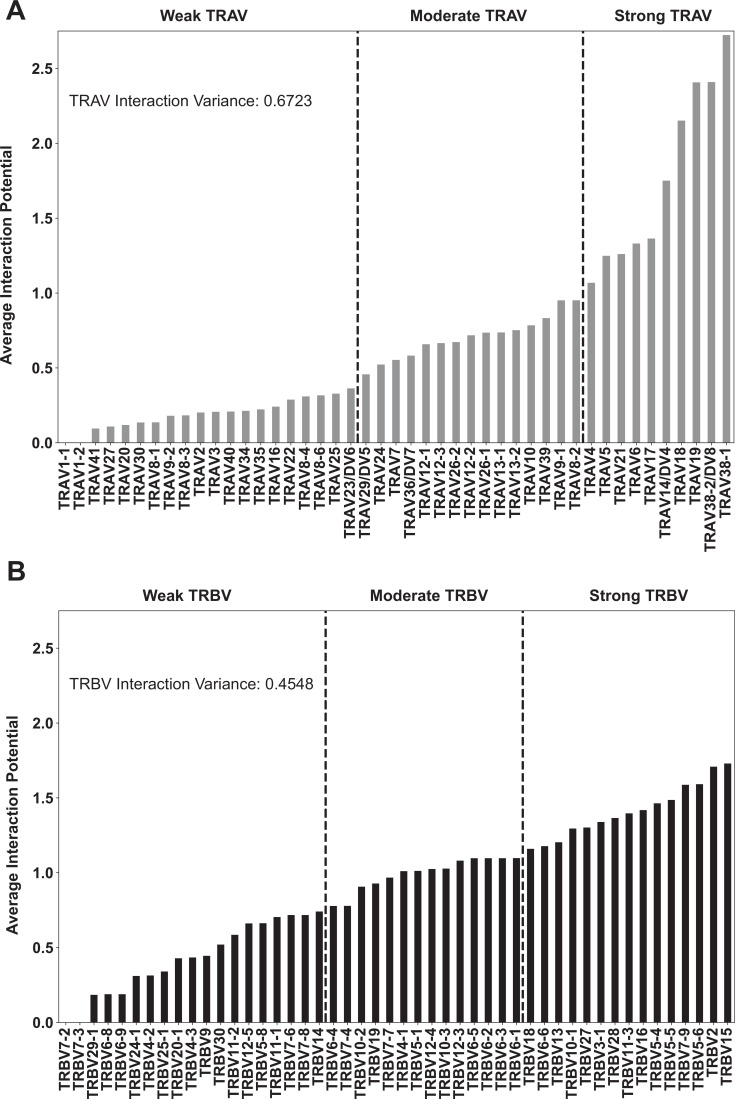
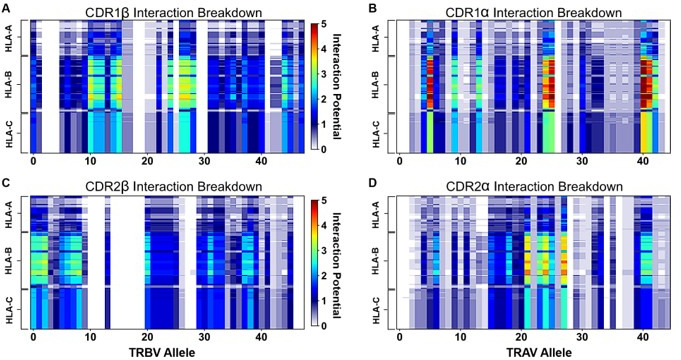
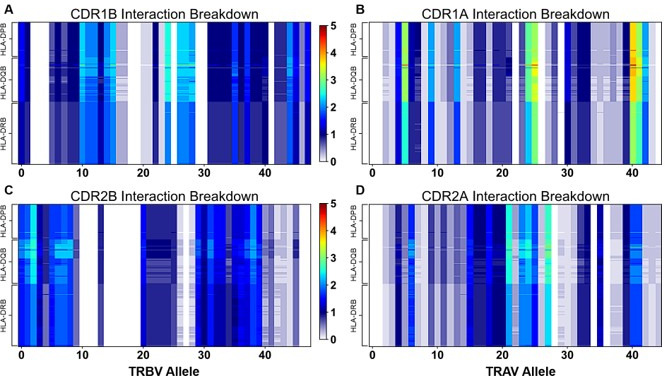
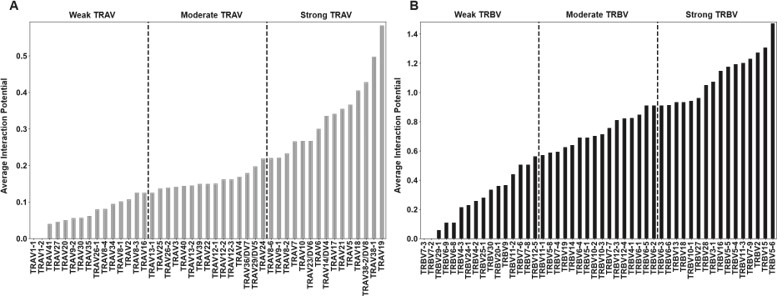
These interaction scores are calculated between all possible interacting amino acid sequences of HLA alleles and TRAV or TRBV genes (i.e. without preference for a canonical binding orientation), providing a useful quantification of the relative contribution of germline-encoded CDR1 and CDR2 loops to a given TCR-MHC complex (See Methods). Figure 4 shows the results of this scoring metric, focusing on the resultant patterns evident in both the x-axis, corresponding to the TRBV (Figure 4A) or TRAV (Figure 4B) genes, and the y-axis, corresponding to each HLA allele. We note that the variance in the strength of interaction with MHC class I is greater for the CDR1 and CDR2 loops of TCRα than those of TCRβ (Figure 4—figure supplement 1). Our analysis showed that TRAV38-1, 38–2, and 19 have the strongest potential interactions with class I HLA molecules of any TCR genes. Conversely, the TRBV genes 7–2 and 7–3 are predicted to have a severely limited interaction potential with HLA molecules (Figure 4C and D). Interestingly, these alleles, TRBV7-2 and 7–3, are of significant interest in autoimmunity as they have been associated with celiac disease (Gunnarsen et al., 2017; Qiao et al., 2014) and multiple sclerosis (Sethi et al., 2013), respectively. Similarly, those TRBV alleles most strongly enriched in celiac patients (7–2, 20–1, and 29–1) (Qiao et al., 2014) likewise all have a corresponding low AIMS interaction potential with class I and class II HLA molecules (Figure 4—figure supplement 2).

Figure 4. Interaction score between every TRBV (A) or TRAV (B) sequence and HLA allele for all four germline-encoded CDR loops.

The x-axis moves across each productive germline-encoded TCR gene (see Supplementary file 2 for key), while the y-axis is grouped by each broad HLA class I allele group. The color bar gives the interaction potential (unitless, higher potentials suggest stronger interactions). Alignments of TRBV (C) or TRAV (D) sequences highlighting genes with a range of interaction potentials, colored by biophysical property. Gene names for each sequence are colored by interaction potential: high-black, moderate-gray, and negligible-light gray. Color coding for alignment: grey - hydrophilic, blue - positive, red - negative, orange - hydrophobic, white - non-interacting. Gaps in an alignment are denoted by a dot (.).

Figure 4.

Figure 4—figure supplement 1. Per-gene interaction potentials averaged over all class I HLA molecules for TRAV genes (A) and TRBV genes (B).

Figure 4—figure supplement 1.

The variance across all of these interaction potentials, in other words over all genes, is reported within each plot. Reported values give interaction potential averaged over both HLA helices, not just the helix each TCR chain ”canonically” interacts with, and over both CDR1 and CDR2.
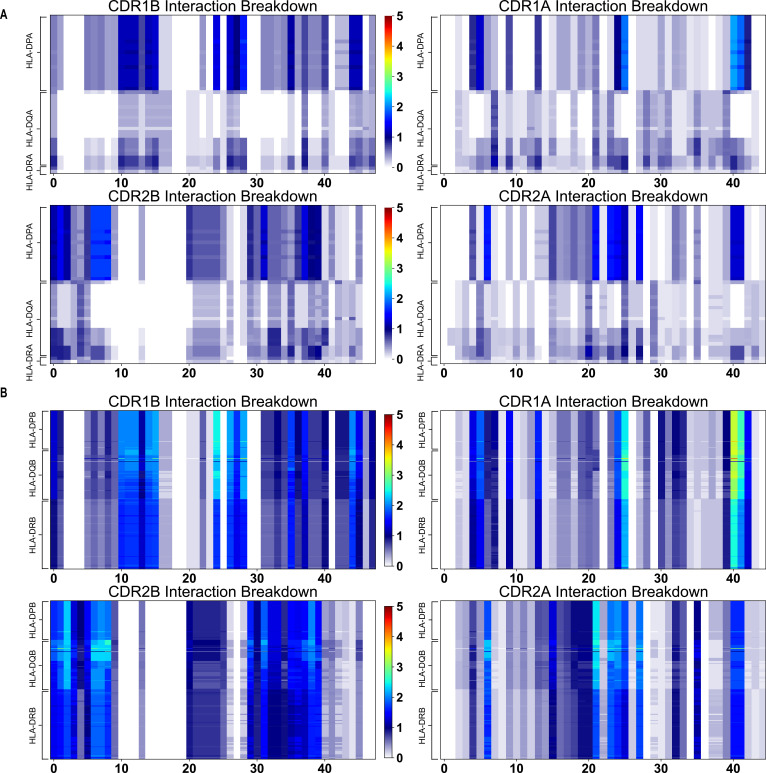
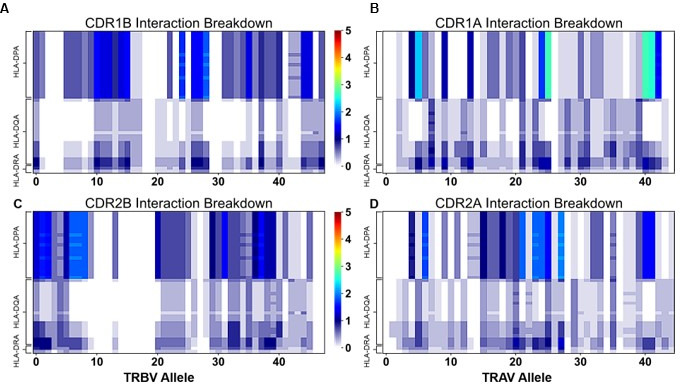
Figure 4—figure supplement 2. AIMS interaction potentials for CDR1 and CDR2 β and α chains with HLA class II molecules.

Figure 4—figure supplement 2.

These calculations are made separately for class IIa (A) and class IIb (B) alleles. The interaction potential scale is given in the center of each plot. The key for which TRAV or TRBV gene corresponds to which number on the x-axis of each plot can be found in Supplementary file 2.

These interaction potentials suggest that not only do germline-encoded CDR loops not contact the same conserved regions of the HLA molecule, but further imply that different TRAV/TRBV gene usage encourages differential utilization of the CDR loops. For instance, TRBV6-5 has a high CDR1 interaction potential and a negligible CDR2 interaction potential. Conversely, the suggested CDR bias is reversed for TRBV11-2. These trends are similarly found for analysis of germline-encoded interactions with HLA class II molecules (Figure 4—figure supplement 2). These results further highlight the variability across the full repertoire of germline-encoded CDR1 and CDR2 loops and the role of this variability in interactions with MHC molecules.

Interaction scores show good agreement with structural data

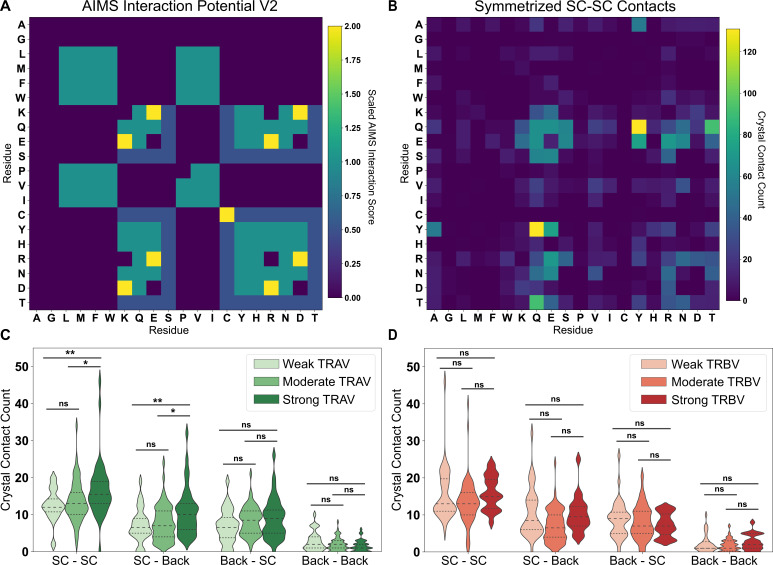
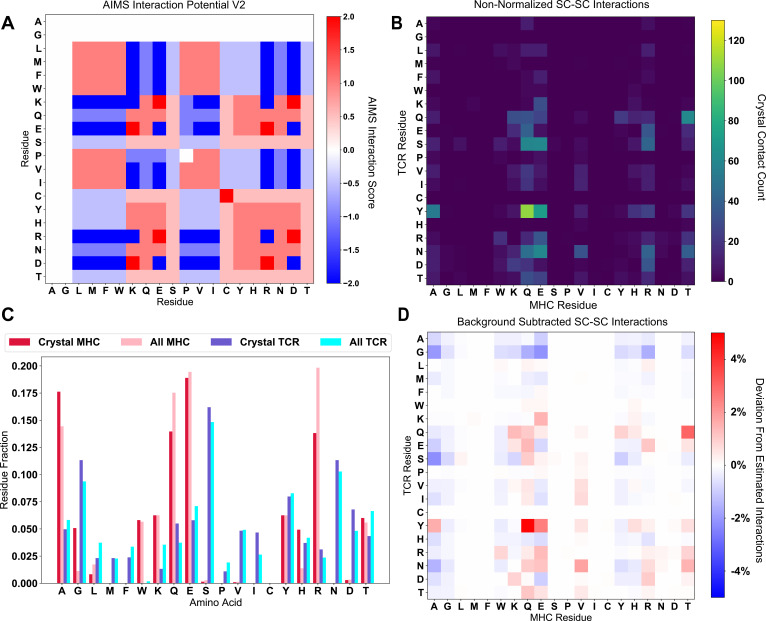
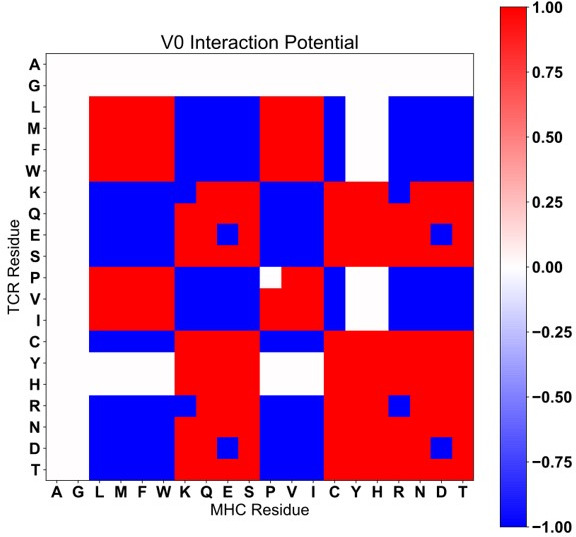
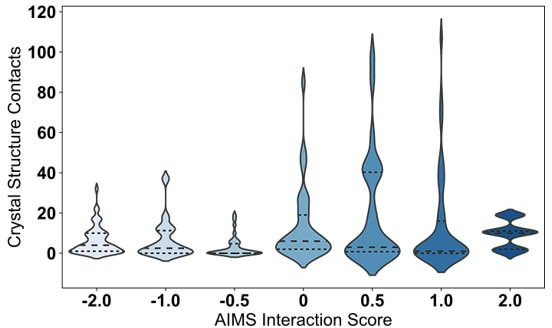
To test our scoring of CDR-MHC interactions, we analyzed all TCR-pMHC complexes crystallized thus far. Using the TCR3D Database (Gowthaman and Pierce, 2019), we were able to process 182 total human TCR-pMHC complexes and quantify germline-encoded contacts. Final interactions included in the analysis were defined using somewhat generous cutoffs of 6 Å for charged interactions and 4.5 Å for van der Waals interactions (Methods). This comparison shows good agreement between our bioinformatic results and structural analyses (Figure 5). The results show that a normalized version of our AIMS interaction potential (Figure 5A) is in qualitative agreement with a symmetrized version of the count matrix generated from crystal structure contacts between TCR and class I MHC molecule side chains (Figure 5B). Normalization of these matrices is necessary, as residues with a negative or zero interaction potential are indistinguishable in the empirical contact map; that is, a negative number of contacts are not possible. Non-normalized versions of these matrices can be found in Figure 5—figure supplement 1A, B. The largest discrepancies between the interaction potential and the empirical matrix occurs in regions of hydrophobic interactions, as strongly hydrophobic residues are relatively rare on the MHC α-helices and TCR CDR loops (Figure 5—figure supplement 1C). Further, biases in the PDB from repeated crystallization of identical molecular species are evident, particularly in Ala-Tyr and Gln-Tyr MHC-TCR interactions (Figure 5—figure supplement 1D).

Figure 5. Comparison of interaction predictions to crystallized TCR-pMHC complexes.

(A) Heat map representation of the AIMS interaction potential (version 2), normalized by mapping negative interaction potentials to 0. (B) A similar heat map representation for an empirical comparison to crystallized TCR-pMHC, showing a symmetrized version of the count matrix of crystal contacts between germline-encoded sidechains. Colorbars give either the AIMS interaction potential (A) or the raw contact count (B). A more rigorous quantitative comparison between the AIMS interaction potential and crystallized TCR-pMHC complexes gives these contact counts as violin plots for TRAV (C) or TRBV (D) encoded CDRs predicted to be weak (TRAV: n = 32; TRBV: n = 38), moderate (TRAV: n = 68; TRBV: n = 82), or strong (TRAV: n = 40; TRBV: n = 20) binders to MHC. Dashed inner lines give the quartiles of each distribution. Statistics determined using a non-parametric permutation test, * - p<0.05, ** - p<0.01, ns - not significant. X-axis Key: SC-SC:Sidechain-Sidechain, SC-Back:TCR Sidechain-MHC Backbone, Back-SC: TCR Backbone-MHC Sidechain, Back-Back:Backbone-Backbone.

Figure 5.

Figure 5—figure supplement 1. Non-normalized profiles of the data in Figure 5.

Figure 5—figure supplement 1.

(A) The raw AIMS interaction potential (V2) highlights the nuanced details in the amino acid interactions. (B) The raw (non-symmetrized) crystal contact count matrix for sidechain interactions. (C) Comparison of the frequency of each amino acid in either the studied crystallized structures (Crystal MHC and TCR) or in the unique amino acid sequences available via IMGT (All MHC and TCR). (D) These expected IMGT frequencies can be used to create a background-subtracted version of panel B, highlighting over-represented interactions (like Y-Q).
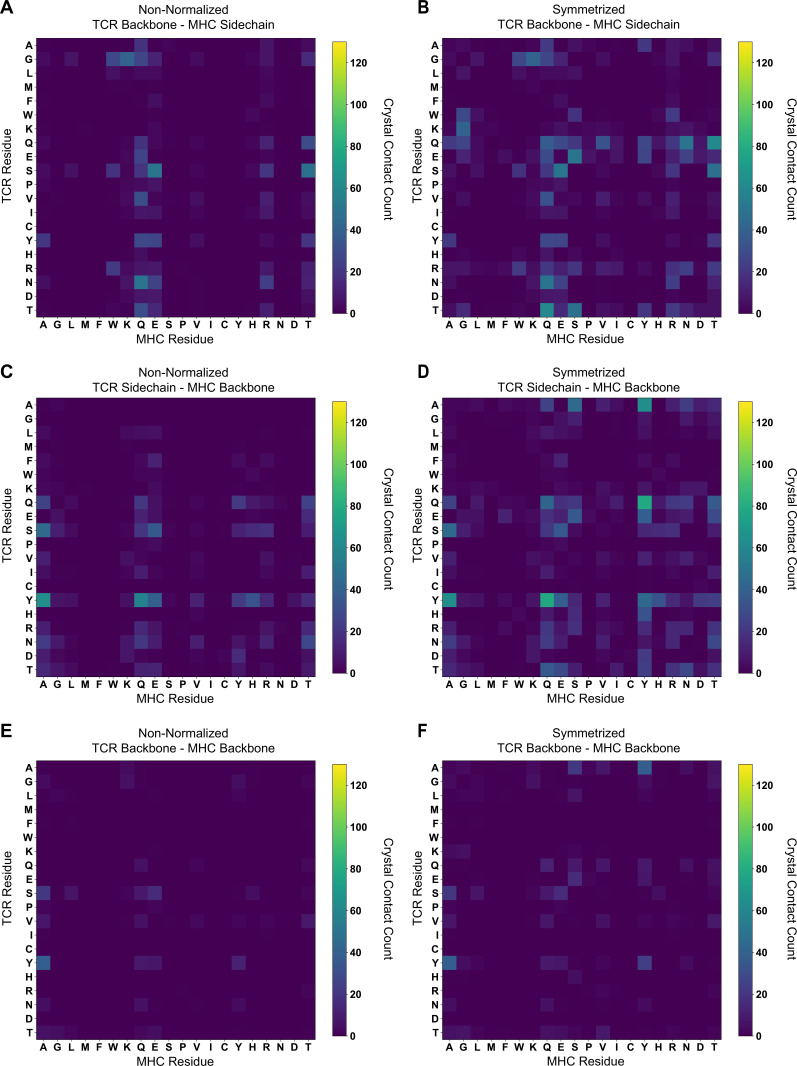
Figure 5—figure supplement 2. The (non-symmetrized, symmetrized) crystal contact count matrices for (A, B) TCR Backbone - MHC Sidechain; (C, D) TCR Sidechain - MHC Backbone; and (E, F) TCR Backbone - MHC Backbone interactions.

Figure 5—figure supplement 2.

Contact counts are solely for class I TCR-MHC complexes.
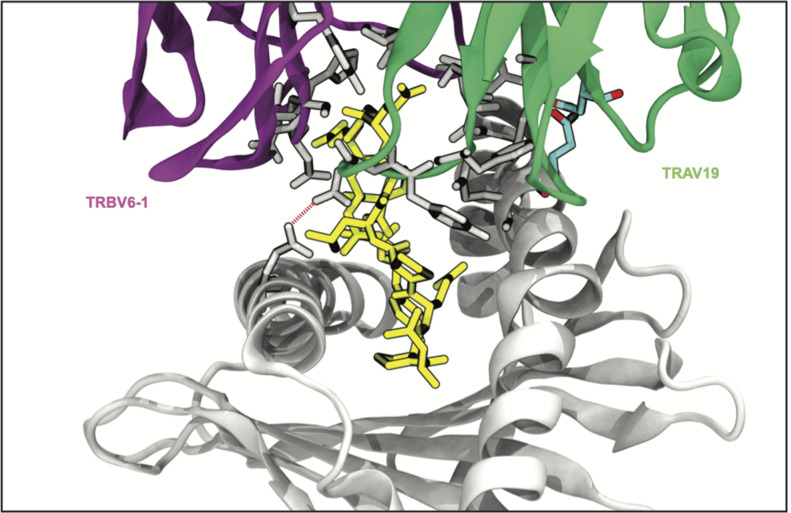
Figure 5—figure supplement 3. Rendering of a TCR-MHC complex dominated by CDR3-peptide interactions (PDB:2AK4).

Figure 5—figure supplement 3.

Interactions with CDR3 or peptide are rendered in gray, germline-encoded interactions are colored cyan, and the peptide is shown in yellow.

While the AIMS interaction potential only scores possible contacts between amino acid sidechains, there exists evidence in the literature that interactions with backbone atoms are often critical for overall complex stability (Huseby et al., 2006). However, incorporation of such information for a given interaction requires extensive knowledge of the structural details of the complex of interest, which as discussed previously, is not available for all possible TRAV/TRBV pairings. Quantification of sidechain-backbone (Figure 5—figure supplement 2A, B), backone-sidechain (Figure 5—figure supplement 2C, D), and backbone-backbone (Figure 5—figure supplement 2E, F) contacts across TCR-pMHC complexes show some intuitive results, such as increased involvement of alanine and glycine, but other results are clearly counter-intuitive, or biased by the structures crystallized thus far. For instance, we shouldn’t expect a priori that a Tyr-Gln interaction would be a common backbone-sidechain or sidechain-sidechain interaction, as both of these sidechains are relatively bulky. While the ‘biases’ introduced by the structures solved thus far may not be biases at all, and could in fact be signatures of TCR recognition, it is difficult to decouple the signal from the noise without more structural information.

Despite the challenges associated with aligning model predictions with structural data, AIMS interaction scores are useful to identify those germline TRAV- and TRBV-encoded CDR loops that may make more frequent contacts with the MHC α-helices (Figure 5C and D). We find significant increases in the number of CDR1/2 sidechain contacts with both MHC helix sidechain and backbone atoms in TRAV sequences predicted by the AIMS interaction potential to be stronger interaction partners. While a similar agreement between interaction potential and sidechain contacts is seen for TRBV, these differences are not statistically significant. This effect is less pronounced for TCR backbone atom interactions with MHC sidechain and backbone atoms, as one would expect given that these interactions are not accounted for in the AIMS interaction potential. Interestingly, these interaction potentials show better experimental agreement and predictive power for TRAV-encoded sequences compared to TRBV-encoded sequences. This could be due either to a fundamental difference in how TCRα and TCRβ contact the MHC α-helices, or in part due to the aforementioned higher interaction potential variance for TRAV-encoded CDR loops (Figure 4—figure supplement 1).

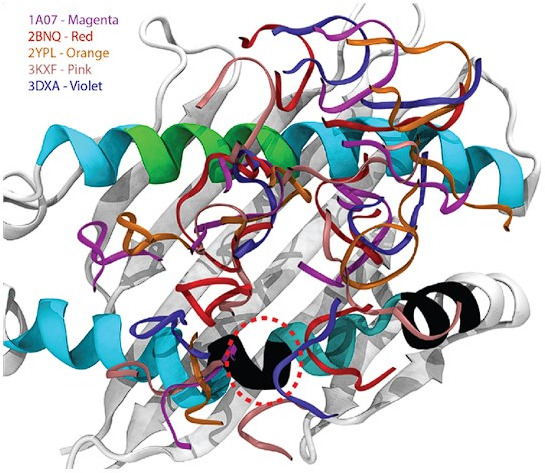
However, there are still clear deviations from the predictions we can achieve at this point. In these structures, it appears that the CDR3-peptide interactions dominate the interface, overruling all other trends in germline-encoded interactions. We can consider an extreme example, looking at the germline-encoded and peptide contacts of a so-called ‘super-bulged’ peptide bound to MHC class I (Figure 5—figure supplement 3; Tynan et al., 2005). In this structure, the TRAV19 and TRBV6-1 encoded CDR loops, which are both identified as having a high interaction potential with HLA class I molecules, make limited germline-encoded contacts with MHC side-chains. There is only a single germline-encoded sidechain interaction between TRAV19 and the MHC α2-helix. As is evident from this structure, significant CDR3-peptide interactions are capable of strongly altering the TCR-MHC interface, regardless of which TRAV and TRBV genes are used. Absent these dominating CDR3-peptide contacts, the interaction potentials serve as a strong, structurally validated quantification of the likelihood of each germline-encoded CDR loop to interact with MHC α-helices.

Biophysical constraints on the MHC surface create germline-encoded biases in docking angles

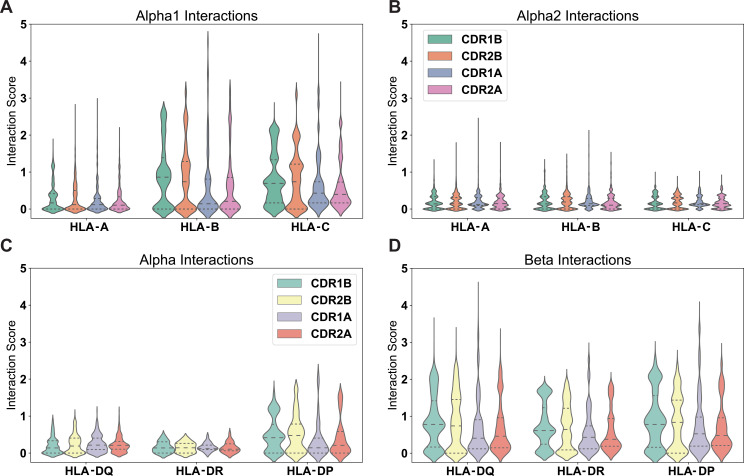
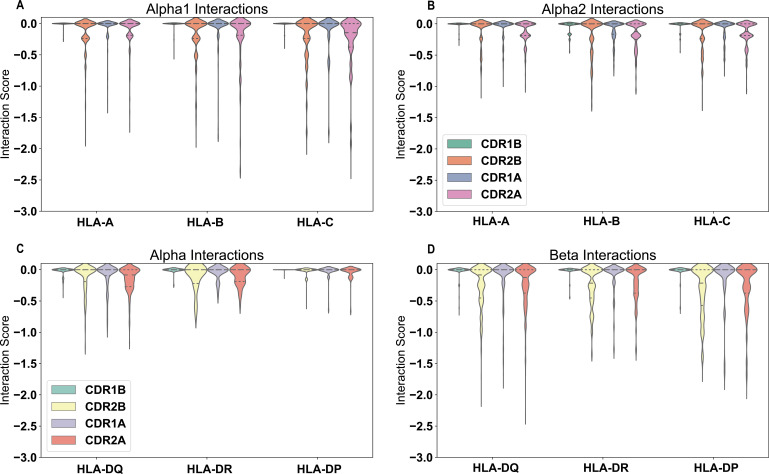
Having experimentally validated the interaction matrices in Figure 4, we explored whether there exist structural biases in the interactions between germline-encoded TCR CDR loops and MHC α-helices. First, we divided these matrices into separate datasets for each HLA group A, B, and C. We then calculated the interaction potentials across every HLA allele and TRAV or TRBV gene and identified the relative contribution of each CDR loop interacting with each HLA α-helix. From these distributions of contributions, our interaction potentials suggest that the constructive TCR β-chain interactions with the HLA α1-helix (Figure 6A), and perhaps to a lesser extent destructive interactions between the TCR α-chain and the MHC α1-helix (Figure 6—figure supplement 1), may moderately bias the binding orientation between TCR and class I HLA molecules. This reliance on TCR β-chain interactions to guide the overall TCR-MHC interaction has been suggested previously in the literature based upon multiple early observations in mice (Marrack and Kappler, 1987). It is also in line with previous findings that CDR1 and CDR2 of the TCR β-chain are key drivers of the TCR-MHC docking orientation (Feng et al., 2007; Garcia et al., 2009). Conversely, our calculations suggest the α2-helix is only weakly involved in the determination of binding orientation (Figure 6B). The exposed residues on the α2-helix of HLA class I molecules are enriched in alanine and glycine relative to the β1-helix, which are highly unlikely to be involved in a specific, orientation-altering productive interaction.

Figure 6. Positive interactions between each germline-encoded TCR CDR loop and all HLA alleles.

Violin plots give distribution of interaction scores, with dashed lines separating quartiles of the distributions. The individual interaction potentials are shown for the individual CDR loop interactions with MHC Class I α1-helix (A), MHC Class I α2-helix (B), MHC Class II α-helix (C), and MHC Class II β-helix (D). Reported values are averages for each individual TRAV or TRBV gene and their interactions with each individual MHC allele over both CDR loops. Number of points in each violin plot given as follows (MHC: n = #TRAV, #TRBV): HLA-A: n = 10755, 11472; HLA-B: n = 17010, 18144; HLA-C: n = 11925, 12720; HLA-DQα: n=945, 1008; HLA-DRα: n = 45, 48; HLA-DPα: n = 990, 1056; HLA-DQβ: n = 5985, 6384; HLA-DRβ: n = 8550, 9120; HLA-DPβ: n=4860, 5184.

Figure 6.

Figure 6—figure supplement 1. AIMS clash potentials calculated for all possible CDR-MHC helix interactions.

Figure 6—figure supplement 1.

Clashes are estimated from single sites in the CDR and MHC that should form unfavorable interactions (as shown in Supplementary file 1). Calculations are shown for HLA class I interactions with the α1 helix (A), the α2 helix (B), and for HLA class II interactions with the α-helix (C) and the β helix (D). Reported values are averages for each individual TRAV or TRBV gene and their proposed possible clashes with each individual MHC polymorphism. Clashes are, on the whole, rare between germline-encoded CDR loops and MHC α-helices. Number of points in each violin plot given as follows (MHC: n = #TRAV, #TRBV): HLA-A: n = 10755, 11472; HLA-B: n = 17010, 18144; HLA-C: n = 11925, 12720; HLA-DQα: n=945, 1008; HLA-DRα: n = 45, 48; HLA-DPα: n = 990, 1056; HLA-DQβ: n = 5985, 6384; HLA-DRβ: n = 8550, 9120; HLA-DPβ: n=4860, 5184.

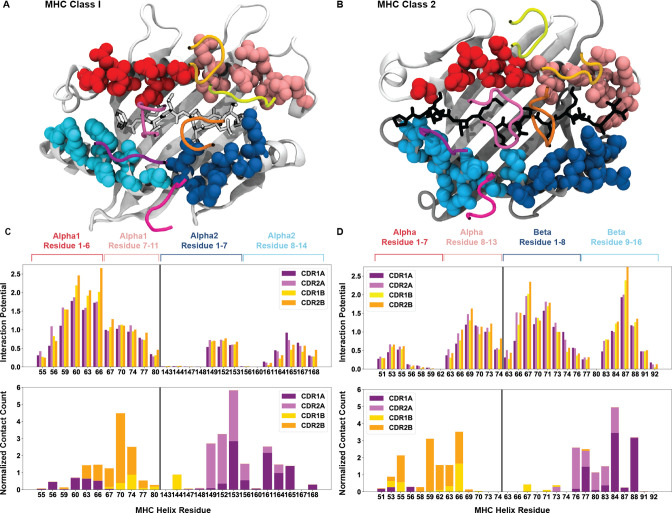
Interestingly, the TCR-HLA interaction potential appears flipped for class II molecules: interactions between TCR germline-encoded regions and HLA class II molecules are broadly driven instead by the β-chain helix (Figure 6C and D). We note that the interaction potential incorrectly predicts that the TCR β-chain CDR loops should be the strongest interaction partners with the HLA class II β-chain helix. Nearly every crystallized TCR-HLA class II complex solved thus far adopts the canonical docking orientation whereby the TCR β-chain binds to the HLA α-chain helix, while the TCR α-chain binds to the HLA β-chain helix, with few notable exceptions (Beringer et al., 2015). It is important to note that these interaction potentials take an unbiased approach, calculating every possible interaction between TCR and MHC residues to produce this final score. Therefore, this inconsistency between our interaction potential distributions and crystallized structures may arise from variations across a given MHC helix obscuring the interaction potentials within the canonical binding region, highlighting the need for a more precise approach. To more carefully characterize the CDR loop interactions with MHC α-helices and attempt to alleviate this inconsistency, we isolated the contributions of each individual residue in the HLA class I and class II sequence alignments to the interaction potentials (Figure 7).

Figure 7. Breakdown of the interaction potential for every exposed residue on HLA surfaces.

Figure 7.

Color coded structures of HLA class I (A, PDB: 6MTM) and class II (B, PDB: 1J8H) provide the structural context to the bioinformatic results. The colors of the amino acid side-chains match the labels of the later panels. The averaged interaction potential across TRAV and TRBV genes with each individual MHC helix is shown in the top panels for HLA class I (C) and HLA class II (D). Lower panels of (C) and (D) compare these interaction potentials to total crystal contacts with these same residues (n = 149 HLA class I structures, n = 44 HLA class II structures).

Figure 7A and B show a structural visualization of the amino acids of interest on the class I (Figure 7A) and class II (Figure 7B) HLA molecules. These TCR-exposed residues are colored based approximately upon the register a TCR would adopt upon binding each subset, whereby TCRs adopting the canonical binding orientation would contact the residues colored in cyan and pink, and non-canonical binders would contact the blue and red residues. For both HLA class I (Figure 7C, top) and class II (Figure 7D, top), we found a conserved pattern of specific regions of peak interaction potentials surrounded by immediate drop-offs in these interaction potentials. In all but the HLA class I α1-helix, the interaction potentials adopt a distinctly bimodal distribution over the surface of the HLA molecules. In the case of class I molecules, our interaction analysis suggests that the TCR β-chain binds to the HLA class I α1-helix nearly indiscriminately, with potential to form many interactions. The TCR α-chain then contributes to the orientation of the interactions by binding to the HLA class I α2-helix in one of two discrete regions. Conversely, interactions between the αβ TCR and HLA class II molecules appear to have a more defined register for binding, with both the HLA class II α-chain and β-chain interactions with TCR forming distinct bimodal distributions.

We then compared these by-residue interaction breakdowns to crystallized TCR-pMHC structures, counting the number of side-chain interactions between CDR loops and the solvent-exposed residues of the MHC helices. For HLA class I (Figure 7C, bottom), we found good agreement between our predictions and the crystal contacts. Particularly for contacts with the α2-helix, we see that the majority of CDR1/2α contacts fall directly within the predicted regions of non-zero interaction potential. Comparisons to HLA class II (Figure 7D, bottom) are more difficult, again due to the relative dearth of crystallized structures. Overall, these results further contextualize the seemingly inconsistent findings of Figure 6D. While the interactions with the class II β-chain are stronger, we see that the average over all interactions with the α-chain are subdued by the very weak interaction potential of the non-canonical binding region. Within the canonical binding regions of the class II molecule, the TCR α-chain and β-chain CDR loops have similar binding potentials with either α-helix.

The binding register of MHC molecules is well conserved by areas of low interaction potential

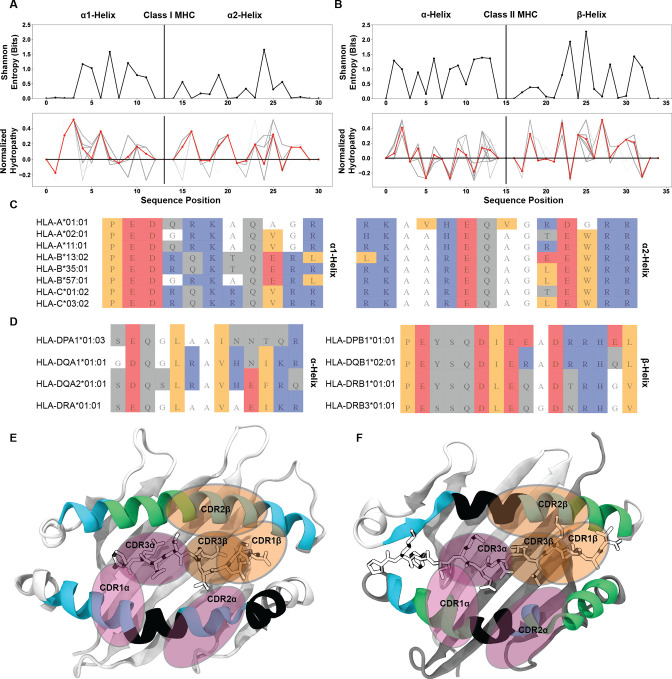
The identification of these localized regions of low interaction potential contrasts with what has been postulated previously to be the root of the conserved TCR-pMHC docking orientation. Instead of confirming that conserved interactions determine the docking orientation, our results suggested that regions that are less likely to contact the TCR generate this preference. To further characterize these regions of low interaction potential flanked by regions of increased interaction potential on the MHC surface, we examined position-sensitive biophysical properties to characterize the exposed residues of the MHC α-helices. Specifically, we directly compared the position-sensitive Shannon entropy to the position-sensitive hydropathy of these residues across all MHC class I (Figure 8A) and class II (Figure 8B) molecules.

Figure 8. Identification of well conserved regions of low interaction potential finalize a working model for the root cause of canonical TCR-MHC docking orientations.

Position-sensitive Shannon entropy (top) and normalized amino acid hydropathy (bottom) for class I (A) and class II (B) HLA molecules. Red lines in the hydropathy plots indicate an average over all HLA molecules, while gray lines give the position-sensitive biophysical properties of individual molecules. Alignments of class I (C) or class II (D) HLA alleles from a subsampling of parental alleles, colored by biophysical property. Color coding for alignment: grey - hydrophilic, blue - positively charged, red - negatively charged, orange - hydrophobic, white - non-interacting. Renders of class I (E, PDB: 6MTM) and class II (F, PDB: 1J8H) HLA molecules with α-helices colored by interaction potential. Green - regions of high interaction potential, cyan - regions of moderate interaction potential, black - regions of negligible interaction potential. Orange ovals give probable contact regions for TCRβ, while purple ovals give probable contact regions for TCRα, defining canonical docking orientations.

Figure 8.

Figure 8—figure supplement 1. Across a range of mammalian species, the regions of low interaction potential on class I and class II MHC α-helices are very well conserved.

Figure 8—figure supplement 1.

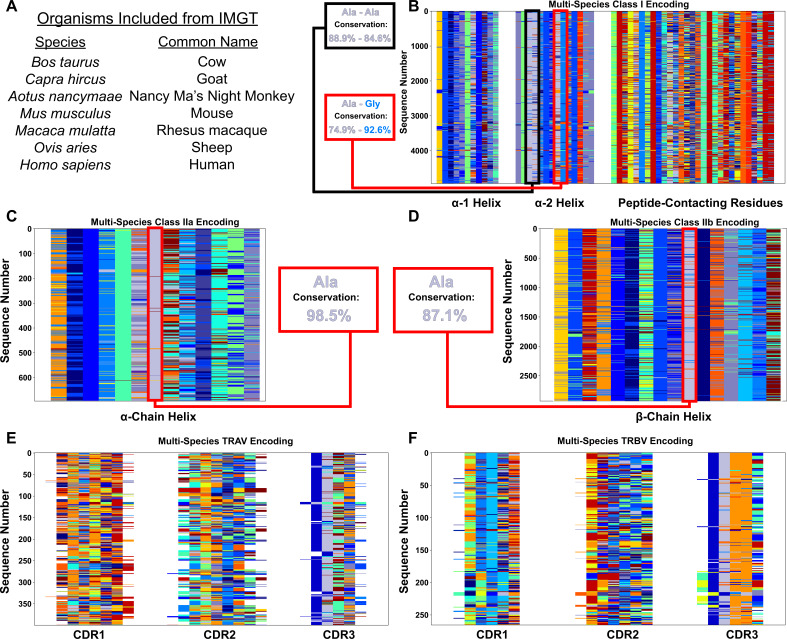
Species used in this analysis highlighted in (A) as found in the IPD-MHC Database. Color-coded matrix alignments of MHC class I (B), MHC class IIa (C), MHC class IIb (D), TRAV (E), and TRBV (F) highlight the extent of this conservation. Specifically for the MHC alignments, the regions of conserved low interaction potential have the extent of conservation quantified, along with the amino acid identity at these sites. Colors of the named amino acids match the colors in the matrices. By comparison, we can see by eye that outside of the TRBV CASS motif and the TRAV AV motif in the germline-encoded region of CDR3, there is almost no clear conservation in the germline-encoded CDR loops.

We found that in many of the regions where the hydropathy is at or near zero, meaning the region is neither hydrophilic nor hydrophobic, there is drop in the entropy to a value near zero. These residues with a hydropathy near zero likewise have an interaction potential near zero. This suggests that these residues with a lower interaction potential are well-conserved across HLA molecules. Indeed, looking again at alignments of HLA class I (Figure 8C) and class II (Figure 8D) sequences, we found that these regions of alanine and glycine usage are well conserved in a sampling of the so-called ‘parental’ HLA alleles (Robinson et al., 2017). Further inspection of a matrix encoding of a broader set of mammalian MHC molecules (Figure 8—figure supplement 1) showed that alanine and glycine are well conserved in specific regions across species in the α2-helix of MHC class I molecules, as well as in both helices of MHC class II molecules.

These observations completed our final model for the source of bias in the conserved TCR-MHC docking orientation (Figure 8E and F). The structures of HLA class I (Figure 8E) and HLA class II (Figure 8F) are colored based on their average interaction potentials as shown in Figure 7. We readily see the well-conserved areas of negligible interaction potential (black) occur near the centers of the α-helices for each MHC. By overlaying typical CDR contact regions, we can visualize how these regions of low interaction potential may be capable of dictating the docking angle. The α2 and β-chain helices, due in part to the centrally located region of reduced interaction potential and in part due to the kink in helix, appear to play a key role in determining the conserved docking angle.

Discussion

The concept of evolutionarily conserved interactions guiding immune recognition dates back half a century to work by Jerne, 1971. Despite predating the first TCR-MHC structures the prediction has withstood the test of time. Canonical TCR-MHC docking orientations have repeatedly been observed and specific instances of evolutionarily conserved contacts have been identified in a subset of structures (Feng et al., 2007; Blevins et al., 2016; Scott-Browne et al., 2011). However, the identification of TCRs that are capable of binding to non-MHC ligands (Van Laethem et al., 2007) or in a reversed docking orientation (Beringer et al., 2015; Gras et al., 2016; Zareie et al., 2021) call into question the general validity of these findings of evolutionary conservation and highlight the need for systematic analyses covering the entire space of TRAV, TRBV, and MHC alleles. Even without these eccentric exceptions, evidence for evolutionarily conserved interactions have only been convincingly shown for a small subset of TRAV and TRBV genes. Here, we report the results of the first systematic study across these variable alleles.

Diversity analysis rules out the existence of specific conserved contacts for a majority of TRAV- and TRBV-encoded CDR loops

Using AIMS, a recently developed software (Boughter et al., 2020; Boughter and Meier-Schellersheim, 2023) for encoding and analyzing amino acid sequences and their biophysical properties in the context of molecular interactions, we found that across all tested TRAV, TRBV, and HLA alleles, there is no evidence of strongly conserved germline-encoded interactions that exist for all possible combinations of TRAV/TRBV genes and HLA polymorphisms. The sequence-level diversity in the germline-encoded TCR CDR loops alone makes such interactions highly unlikely. Biophysical analysis further confirmed that the wide range of physical properties of these highly diverse germline-encoded CDR loops can lead to steric conflicts in regions where other germline genes create productive interaction networks. These findings suggest that conserved TCR-MHC interactions spanning species identified thus far (Blevins et al., 2016; Scott-Browne et al., 2009; Scott-Browne et al., 2011; Dai et al., 2008) may be rare across the entirety of the immune repertoire. To characterize these TCR-MHC germline-encoded interactions outside the lens of this evolutionary context, we employed a biophysical scoring function to quantify the pairwise interaction potential for every TRAV/HLA and TRBV/HLA pair.

Biophysically compatible regions of MHC play a key role in determining the canonical docking orientation

These by-allele interaction potentials can further be broken down on a per-residue basis for each MHC α-helix. Surprisingly, this analysis may suggest why, in spite of the observed sequence variability, we find rather well-conserved TCR-pMHC docking orientations. Across nearly all tested human polymorphisms, we found that class I and class II MHC helices are composed of moderately diverse regions of increased interaction potential interrupted by centrally located, well-conserved regions of low interaction potential. These regions of low interaction potential define a conserved docking orientation, with room for slight variability in orientation about the flanking regions of higher interaction potential. Our findings do not contradict the previously proposed concept of ‘interaction codons’ whereby specific TCR-MHC pairs are predisposed to interact in multiple registers dependent upon the peptide bound to the MHC (Adams et al., 2016; Feng et al., 2007; Garcia et al., 2009). However, these codons as currently posited suggest the existence of multiple rigid docking modes, consistent with their ideation deriving from solved crystal structures. The results of our analyses suggest a broader, dynamic interpretation of the TCR-pMHC interface (Baker et al., 2012; Devlin et al., 2020; Smith et al., 2021; Borbulevych et al., 2009; Scott et al., 2011), with the TCR CDR loops sampling local regions of increased interaction potential on the MHC surface, utilizing a more opportunistic approach to binding. Further, while the interaction codon hypothesis suggests co-evolved interaction interfaces between the TCR and MHC, our analysis suggests that each TRAV-TRBV pairing finds a unique approach to binding within the constraints permitted by the MHC molecular surface. In other words, the MHC molecule largely defines the interface.

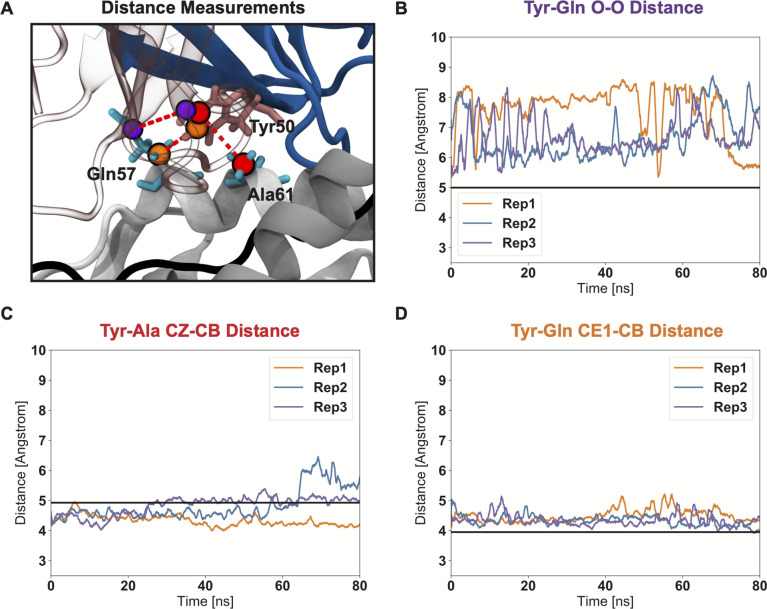
In further extending these dynamic interpretations of the TCR-pMHC interface, all-atom molecular dynamics simulations highlight the inherently fleeting nature of sidechain interactions. As a case study, we can consider a well-studied tyrosine-alanine-glutamine interaction which appears to be an example of exceptional shape complementarity between the TCR and MHC surfaces (Figure 9A). Triplicate, all-atom molecular dynamics simulations of a TCR-pMHC complex (PDB: 1FYT Hennecke et al., 2000) highlight the short lifetimes of such intricate molecular interaction networks (Figure 9B). Over the course of these simulations (Figure 9—figure supplement 1), the intrinsic motility of the glutamine sidechain in the interface significantly alters the interpretation of the tyrosine-alanine interaction from a well-evolved notch reserved for TCR binding to merely a consequence of other factors determined strongly by the potentially more dominant CDR3 interactions with the interface.

Figure 9. Molecular simulations of the so-called ”knob-in-hole” interaction (Garcia, 2012) highlight the dynamic nature of protein sidechains.

(A) The starting crystal structure (PDB:1FYT) suggests a tight packing between TYR50 on CDR2β and GLN57 and ALA61 on the class II α-chain. (B) Short all-atom simulations show that this suggestive tight packing is due to the static nature of crystal structures, with GLN57 freely adopting alternate conformations over the course of the simulation.

Figure 9.

Figure 9—figure supplement 1. Triplicate molecular dynamics simulations highlight the short-lived nature of the ”knob-in-hole” interaction.

Figure 9—figure supplement 1.

(A) Structural visualization of the atoms used to measure distances and track the motion of the Tyr-Ala-Gln sidechain interaction trio (PDB: 1FYT). (B) The Tyr-Gln O-O tracks the strong deviations made by Gln 52 over the course of simulated trajectories, causing the ‘knob-in-hole’ to become a more flat interface that no longer appears specially evolved solely for interactions with Tyr. Measurements of Tyr-Ala and Tyr-Gln atomic distances closer to the MHC molecule backbone (C, D) show that these measured Gln sidechain deviations are not due to strong variation in the overall TCR-pMHC interaction, but instead due almost solely due to side-chain flexibility. The black lines in each figure give the crystal structure distances as a reference. Each line in panels B-D reperesent the atomic distances measured across the three replicate (Rep) simulations.

These simulations are hardly the first investigations into TCR and MHC dynamics (Baker et al., 2012), but highlight that care should be taken when discussing sidechain interactions within these protein-protein complexes. While we focus briefly on only a trio of interacting residues, one should generally expect that sidechain bonds in crystal structures are unlikely to persist over the entire microsecond-scale binding process. Further, crystal structures should be considered snapshots in a local energy minimum, which at near-physiological temperatures likely sample a wide range of contacts (Mei et al., 2020; Bradford et al., 2021). These dynamic interpretations are consistent with the broad biophysical compatibility suggested by the interaction potential results.

Quantification of germline-encoded CDR interactions with MHC α-helices identifies V-gene-dependent recognition strategies

The granular details of the TCR-MHC interaction potential provides an antigen-independent prediction of the relative contributions of the germline-encoded CDR loops to the overall interaction interface. The CDR loops encoded by these TRAV and TRBV genes each have largely distinct binding strategies with MHC. While many V-genes encode CDR1 and CDR2 loops with equal interaction potentials with MHC α-helices, a small subset appears to favor one or the other for binding to MHC molecules. Importantly, these preferences seem to be accompanied by compensatory contributions to binding; the interaction potentials of TRBV6-1, 6–2, and 6–3 have negligible CDR2β contributions to binding, but in turn have a stronger propensity for MHC binding via CDR1β (Figure 4.). These compensatory contributions to binding are suggestive of a mix-and-match strategy for peptide-MHC complex recognition, consistent with previous findings highlighting the strong dependence of complex geometry on CDR3 residues (Stadinski et al., 2014; Piepenbrink et al., 2013; Lu et al., 2019).

What these previous studies and our computational results suggest is that for a T cell to recognize a given antigen, the CDR3 loops must bind sufficiently strongly to the peptide, while the CDR1 and CDR2 loops can provide a basal level of support for the more complex-specific CDR3-induced binding. If all V-genes encoded CDR1 and CDR2 that dominate the interaction with strong, specific contacts with MHC, they may well impede the exquisite specificity of the overall TCR-pMHC interaction determined by the CDR3 loops. The diversity in the V-genes instead permits a range of recognition strategies independent of, and complementary to, the V(D)J recombination-generated CDR3 loops.

Biophysical compatibility between germline encoded TCR sequences and MHC does not rule out alternative binding modes

The general TCR-MHC compatibility as suggested by our results does not rule out the possibility of reversed-docking TCRs, suggesting both evolution and selection play a strong role in the conservation of the canonical docking orientation. While it is unclear how prevalent these reversed-docking TCRs are in the pre-selected immune repertoire, it is clear that they are deficient in their ability to signal due to the distance-sensitivity of the coreceptor-associated Lck in interactions with the CD3 signaling complex (Adams et al., 2011; Gras et al., 2016; Zareie et al., 2021). In our analysis of the biophysical compatibility between germline-encoded TCR sequences and their potential interaction sites on the MHC molecule, we found strong indications that this may be a necessary coevolutionary tradeoff. Over evolutionary history, TCR and MHC molecules have had to balance a conservation of canonical modes of contact with the need to maintain sequence variability in the face of evolutionary pressure. This pressure, exerted by pathogenic challenges, may have forced a drift away from rigid coevolution at the level of amino acid sequences, necessitating this loose compatibility, even at the cost of a major subset of receptors being destined for thymic deletion due to an inability to generate productive signal.

New results further suggest the extent of the germline interaction permissiveness, with a class-mismatched CD4+ T cell capable of binding to and being activated by MHC class I, albeit with a slightly abnormal, but not reversed, docking orientation (Singh et al., 2022). These results further highlight the opportunism, expanding on previous work in this space (Blevins et al., 2016), of TCR interactions in general, where the ‘rules’ of TCR-pMHC binding seem to be more like guidelines. The literature has long focused on rules of interaction and commonalities between structures (Ysern et al., 1998; Al-Lazikani et al., 2000), which have been very helpful in guiding research over the past few decades. However, results such as the class-mismatched TCR, reversed docking TCRs, and super-bulged peptide suggest that perhaps such TCR-MHC specific rules may be too restrictive, and that these interactions may frequently involve more opportunistic configurations that call for unbiased evaluation.

Towards generating a generalizable model for TCR-pMHC recognition

The ideal approach for studying TCR-pMHC interactions would involve generating a comprehensive set of crystallized structures, exhaustive biochemical experiments to pinpoint contributions to binding affinity and kinetics, and activation assays to thoroughly understand the nuances that underlie complex formation. While such thorough efforts have been undertaken to understand structural strategies of binding to HLA-A2 (Blevins et al., 2016), the potential evolutionary conservation of TRBV8-2 in binding MHC molecules (Scott-Browne et al., 2009; Scott-Browne et al., 2011; Garcia, 2012; Feng et al., 2007), and the by-residue contributions of binding of the A6 TCR (Piepenbrink et al., 2013), the diversity inherent to the TCR-pMHC interaction makes such efforts impossible to scale across all possible binding partners.

The work presented here cannot replace these comprehensive experimental techniques. However, it can provide a good first estimate of how well given TCR-MHC pairs may bind. Absent rich experimental data on major parts of the TCR and MHC repertoire space, can we attempt to approximate how a fictitious TCR-MHC interaction would form independent of peptide and CDR3? Comparisons of our computational results to experiment suggest that yes, in fact, we can generate some strong approximations to build off of, with clear deviations from these predictions largely driven by outlier structures. While the simplified interaction potential we have used for the analyses presented here performed surprisingly well in its predictions for overall protein-protein binding propensities, it is clear that it leaves room for improvement, in particular with regard to aspects such as the relative spatial positioning of the interacting structures. As we continue to build these interaction potentials and the AIMS software as a whole, we hope to continually add modular improvements to consider how these initial germline interaction assumptions are altered by peptide and CDR3 to build more predictive tools for interactions and binding.

Ideas and speculation: multi-modal recognition strategies provide a mechanism for autoimmune and non-canonical TCRs

The existence of V-genes with weakly interacting CDR loops that have little to no propensity for binding to the MHC α-helices suggests surprising modes of immune recognition. Among them, those with the weakest interactions may, in fact, be the most interesting. V-genes including TRBV7-2, 7–3, 20–1, and 29–1 have no potential for interaction with MHC, and are associated with celiac disease (Gunnarsen et al., 2017; Qiao et al., 2014) and multiple sclerosis (Sethi et al., 2013). Previous studies have shown that TCR-pMHC interactions dominated by non-germline-encoded CDR3 contacts enable TCR cross-reactivity, and in some cases autoimmunity (Ciacchi et al., 2022; Petersen et al., 2014; Petersen et al., 2020; Sethi et al., 2013; Hahn et al., 2005). This, coupled with the aforementioned germline associations with autoimmune disorders, leads to the intriguing possibility that interactions between germline-encoded TCR regions and the MHC provide a framework for reliable peptide differentiation whereas the lack of such interactions, while granting more flexibility, may lead to higher instances of misguided T cell activation.

Thinking of the entire TCR, not just the germline-encoded CDR loops, as a necessarily cross-reactive (Mason, 1998; Sewell, 2012) opportunistic binder (Singh et al., 2022) provides a potential mechanism for the thymic escape of autoimmune TCRs and reversed docking TCRs. Consider a TCR utilizing TRAV1-1 and TRBV7-3, a V-gene pairing with the lowest possible MHC interaction potential. While a few CDR1 and CDR2 backbone interactions may contribute to the overall complex stability, the CDR3 loops would be largely responsible for forming strong interactions with MHC. In the absence of the germline-encoded binding framework, such strong dependence on CDR3-mediated interactions would make antigen recognition similarly dependent on the CDR3 loop conformation. If this TCR were to encounter a potentially strongly binding (auto-)antigen in the thymus, its probability of being negatively selected would somewhat stochastically depend on the conformations adopted by those TCRs when binding to the pMHC complexes, thereby increasing the chances for thymic escape and subsequent autoimmune events in the periphery.

While over-reliance on CDR3 may bias TCRs towards auto- and cross-reactivity, the role of the MHC molecule in autoimmunity remains unclear from these results. In contexts such as celiac disease, a particular allele (HLA-DQ2.5) is enriched in patients with the disease (Qiao et al., 2014; Gunnarsen et al., 2017). Given that the interaction potentials largely predict similar interaction strengths across HLA molecules (Figure 4, Figure 4—figure supplement 2) such enrichment cannot yet be explained by AIMS. However, considering that the majority of diversity across HLA alleles is concentrated in the peptide binding regions (Figure 2), these correlations between HLA molecules and disease may largely be related to the peptides presented by these molecules, as has been suggested previously (Ishigaki et al., 2022). In trying to understand how allelic variation alters peptide presentation, and how this in turn impacts the onset of autoimmunity, the lack of strong rules for binding again complicates the problem. While HLA molecules have amino acid preferences at certain anchor positions, there are many exceptions to these ‘rules’ (Nguyen et al., 2021), and mutations to peptides that should improve stability in the HLA binding pocket can have unintended consequences on T cell activation (Smith et al., 2021). The substantial diversity of possible presented peptides makes the systematic analysis of this aspect of the autoimmunity problem exceptionally challenging.

Methods

The AIMS software package used to generate the analysis in this manuscript is available here, including the original Jupyter Notebook used to generate the Figures in this manuscript as well as a generalized Notebook and a python-based GUI application for analysis of novel datasets. The AIMS software is constantly evolving, so to ensure exact recapitulation of results presented here AIMS v0.8 should be used. Detailed descriptions of the analysis and the instructions for use can be found at https://aims-doc.readthedocs.io.

Repertoire analysis using AIMS

As with all AIMS analyses, the first step is to encode each sequence into an AIMS-compatible matrix. In this encoding each amino acid in structurally conserved regions is represented as a number 1–21, with zeros padding gaps between these structurally conserved features. The encoding is straightforward for the TCR sequences, with only the germline encoded regions of the CDR loops included for each gene. For the MHC encoding, only the structurally relevant amino acids are included for optimal alignment of each unique sequence. In this case, the structurally relevant amino acids of the class I (or class II) molecules were divided into three distinct groups; the TCR-exposed residues of the α1 (or α) helix, the TCR-exposed residues of the α2 (or β) helix, and the peptide-contacting residues of the given MHC.

Standard AIMS analysis, including calculation of information-theoretic metrics and position-sensitive biophysical properties, is then derived from these AIMS-encoded matrices. The AIMS interaction scoring is based on a matrix that quantifies a basic pairwise interaction scheme (Supplementary file 1), whereby productive amino acid interactions (salt bridges, hydrogen bonds) are scored positively while destructive interactions (hydrophilic-hydrophobic and like-charge clashes) are scored negatively. The first version of this interaction scoring matrix has previously been used to classify interacting and non-interacting molecular partners with a distinguishability of nearly 80% (Nandigrami et al., 2022).

In calculating the interaction score, we assume that productive contacts are only made by the side-chains of the interacting residues. This simplification does not capture all TCR-pMHC complex contacts, but here we are looking for selectivity enforced by specific TCR-MHC interactions mediated by side-chains in a structure-free manner. Further, given that any single pair of amino acids on adjacent interfaces of protein binding partners can potentially form strong interactions without being meaningful for the formation of a given complex, we require that any productive interaction include a trigram of at least weakly interacting residues.

For example, for the TCR sequence YNNKEL, we break the sequence into trigrams YNN, NNK, NKE, KEL. A portion of an MHC α1 helix with the sequence EDQRKA is similarly broken intro trigrams EDQ, DQR, QRK, RKA. While AIMS takes into account every possible interaction combination of these triads, the interaction partners TCR:NNK and MHC:EDQ would be scored positively, while TCR:KEL and MHC:RKA would be discounted as an unfavorable interaction. In the former case the scores according to the AIMS interaction matrix come out to [+1,+1,+1] while in the latter case the score [−2,+2,+0] includes clashing residues, and is therefore not counted as a possible interacting triad. This scoring methodology defines our search parameters for broad biophysical compatibility between TCR CDR loops and the MHC helices, from which we can generate averaged interaction potentials for every TRAV and TRBV gene with every possible HLA allele.

Sequence processing

All sequences used in this work are derived from the ImMunoGeneTics (IMGT) (Brochet et al., 2008; Lefranc, 2014) database of TRAV and TRBV alleles (https://www.imgt.org/IMGTrepertoire/Proteins) from the following organisms: Bos taurus (cow), Capra hircus (goat), Aotus nancymaae (Nancy Ma’s Night Monkey), Mus musculus (mouse), Macaca mulatta (rhesus macaque), and Ovis aries (sheep). MHC sequences are derived from the IMGT-HLA database containing all identified HLA alleles from human and a wide range of organisms (https://www.ebi.ac.uk/ipd/imgt/hla/download) (Mack et al., 2013). Only unique, productive sequences are included, which excludes all open reading frames and pseudogenes. Specific structural features are identified from these productive sequences for each molecular species. For TCRs, these structural features are the complementarity determining region (CDR) loops as defined by IMGT. For MHC molecules, these are the TCR-exposed residues of the MHC α-helices as defined in Bjorkman and Parham, 1990 for class I and as identified in visual molecular dynamics (VMD) (Humphrey et al., 1996) for class II. Class I identifications were likewise validated in VMD. For comparison to non-TCR contacting residues, the peptide-contacting residues were also included for class I molecules, again from identification in Bjorkman and Parham, 1990. All downstream sequence processing was done from these regions of each TCR and MHC sequence.

Structural comparison processing pipeline

We accessed 149 human TCR-pMHC class I structures and 44 human TCR-pMHC class II structures with PDB IDs drawn from the TCR3D database (Gowthaman and Pierce, 2019) and each PDB loaded into python using the mdtraj package (McGibbon et al., 2015). After parsing the TCR3D database for degenerate structures and improperly deposited PDBs, we compiled a final dataset of 96 class I structures and 36 class II structures. We extracted CDR-MHC distances for all contacts. The interaction cutoff is set to 4.5Å for van der Waals interactions and 6Å for charged interactions. Oxygen-Oxygen/Nitrogen-Nitrogen were only counted as productive electrostatic bonding pairs if Ser/Thr/Tyr were involved in O-O contacts or if His was involved in N-N contacts. Through a random selection of 10 complex structures analyzed using this pipeline, we were able to validate structural distance measurements using VMD and found that 100% of the identified contacts match those in structures. All code for sequence processing and structural analysis is included in a separate repository, PRESTO (PaRsEr of Solved Tcr cOmplexes). Code for reproducing the analysis can be found here.

Information theoretic calculations

Information theory, a theory classically applied to communication across noisy channels, is incredibly versatile in its applications and has been applied with success to a range of immunological problems (Shannon, 1948; Román-Roldán et al., 1996; Cheong et al., 2011; Vinga, 2014; Mora et al., 2010; Murugan et al., 2012). In this work, we utilize two powerful concepts from information theory, namely Shannon entropy and mutual information. Shannon entropy, in its simplest form, can be used as a proxy for the diversity in a given input population. This entropy, denoted as H, has the general form:

H(X)=Xp(x)log2p(x) (1)

where p(x) is the occurrence probability of a given event, and X is the set of all events. We can then calculate this entropy at every position along the CDR loops or MHC α-helices, where X is the set of all amino acids, and p(x) is the probability of seeing a specific amino acid at the given position. In other words we want to determine, for a given site in a CDR loop or MHC helix, how much diversity (or entropy) is present. Given there are only 20 amino acids used in naturally derived sequences, we can calculate a theoretical maximum entropy of 4.32 bits, which assumes that every amino acid occurs at a given position with equal probability.

Importantly, from this entropy we can calculate an equally interesting property of the dataset, namely the mutual information. Mutual information is similar, but not identical to, correlation. Whereas correlations are required to be linear, if two amino acids vary in any linked way, this will be reflected as an increase in mutual information. In this work, mutual information I(X;Y) is calculated by subtracting the Shannon entropy described above from the conditional Shannon entropy H(X|Y) at each given position as seen in Equations 2; 3:

H(X|Y)=yYp(y)xXp(x|y)log2p(x|y) (2)
I(X;Y)=H(X)H(X|Y) (3)

These equations for the entropy and the mutual information are used for all information theoretic calculations in this manuscript, but special consideration of the TCR and MHC sequences must be applied in order to reformulate these sequences into the classic input/output framework necessary for information theory. Keeping with the terminology of information theory, we would define the TCR-pMHC interactions as a ‘communication channel’, and thus think of each TCR sequence as a given input. In this picture, each HLA allele would be seen as a corresponding output. If there exists some systematic relationship between the amino acids in the TCR and HLA sequences, we would see a significant influence of TCR sequence variations on HLA sequences, and this should manifest as an increase in the mutual information.

To calculate this mutual information, we start with the assumption that if the concept of evolutionary conservation of TCR-pMHC interactions is correct, then one should assume that every TCR should interact with every HLA allele. Humans largely possess the same TRAV and TRBV alleles, but each individual possesses a maximum of 12 HLA alleles. We expect that specific alleles that are unable to enforce the supposed evolutionary rules for canonical docking will not be allowed to persist in the population. Continuing from this assumption we then subsample the data and calculate the mutual information on this subsampled dataset. Each TRAV and TRBV allele (the input) is matched with a single HLA allele (the output), and the mutual information is calculated for these pairings. This process is repeated 1000 times and the average mutual information is reported. Further validation of our approach on non-human organisms was carefully formulated to only reclassify TRAV/TRBV alleles and MHC sequences as input/output sequences from the same organismal source. The mutual information calculation was then carried out across organisms, with this within-species architecture conserved.

All-atom MD simulations

All simulations performed were prepared using the CHARMM-GUI Input Generator (Jo et al., 2007; Jo et al., 2008; Lee et al., 2016). Three replicas of PDB 1FYT were fully hydrated with TIP3P water molecules and neutralized with 0.15 M KCl. All simulations were carried out in simulation boxes with periodic boundary conditions using the additive PARAM36m force field from the CHARMM (Chemistry at HARvard Macromolecular Mechanics; Brooks et al., 2009). Simulations were run on GPUs using the AMBER architecture for a simulated time of 80 ns, with a 4 fs time step and hydrogen mass repartitioning at 303.15 K (Hopkins et al., 2015). For all simulated systems run on the Locus Computing Cluster at the NIAID, NIH, at least two replicas were run to confirm the results’ independence on initial velocity assignments. Data were analyzed using a customized python package.

To reduce simulation size while maintaining the molecular architecture enforced upon TCR-pMHC complex formation, we removed the TCR Cα and Cβ regions of the TCR, as well as the α2 and β2 regions of the class II MHC molecule. To replace the lost stability introduced by these regions, weak restraints (0.1 kcal/[mol*Å2]) were applied to the β-strands of the MHC class II platform domain and the C-termini of the Vα and Vβ domains of the TCR. Restraints were only applied to the carbon-α atoms of these regions.

Acknowledgements

This work was supported by the intramural program of the National Institute of Allergy and Infectious Diseases (NIAID), NIH. We would like to thank David Margulies, Pamela Schwartzberg, Alexander Brown, and Charles Dulberger for their insightful comments.

Funding Statement

The funders had no role in study design, data collection and interpretation, or the decision to submit the work for publication.

Contributor Information

Christopher T Boughter, Email: christopher.boughter@nih.gov.

Martin Meier-Schellersheim, Email: mms@niaid.nih.gov.

Armita Nourmohammad, University of Washington, United States.

Tadatsugu Taniguchi, University of Tokyo, Japan.

Funding Information

This paper was supported by the following grant:

  • National Institutes of Health ZIA AI001076-16 to Martin Meier-Schellersheim.

Additional information

Competing interests

No competing interests declared.

Author contributions

Conceptualization, Resources, Data curation, Software, Formal analysis, Validation, Investigation, Visualization, Methodology, Writing - original draft, Writing – review and editing.

Supervision, Funding acquisition, Project administration, Writing – review and editing, Conceptualization, Resources.

Additional files

Supplementary file 1. Table used for the second version of the AIMS scoring of pairwise amino acid interactions.

The table attempts to recapitulate the interactions between amino acids at the level of an introductory biochemistry course.

elife-90681-supp1.csv (1.3KB, csv)
Supplementary file 2. Key for Figure 4 and Figure 4—figure supplement 1 relating the numbers on the X-axis of each plot to the corresponding TRAV or TRBV gene.

Note, the pairing of TRAV and TRBV genes to a specific X-axis number has no meaningful relation. Genes are listed in the same order as found on IMGT, with pseudogenes not included.

elife-90681-supp2.csv (961B, csv)
MDAR checklist

Data availability

All data and code used for the analysis in this manuscript are freely available online with no restrictions. All input FASTA sequences and code needed to recreate the analysis can be found via the AIMS GitHub page. Specific analysis for structural comparisons between interaction potentials and TCR-pMHC complexes are found via a separate repository, called PRESTO, also hosted on GitHub. Due to the significant time required to calculate the interaction scores calculated via AIMS, the calculated scores can be found on Zenodo. In case of future updates to either AIMS or PRESTO, the specific versions used for this manuscript are also hosted on Zenodo, as AIMS v0.8 and PRESTO v0.1.

References

  1. Adams JJ, Narayanan S, Liu BY, Birnbaum ME, Kruse AC, Bowerman NA, Chen W, Levin AM, Connolly JM, Zhu C, Kranz DM, Garcia KC. T cell receptor signaling is limited by docking geometry to peptide-major histocompatibility complex. Immunity. 2011;35:681–693. doi: 10.1016/j.immuni.2011.09.013. [DOI] [PMC free article] [PubMed] [Google Scholar]
  2. Adams JJ, Narayanan S, Birnbaum ME, Sidhu SS, Blevins SJ, Gee MH, Sibener LV, Baker BM, Kranz DM, Garcia KC. Structural interplay between germline interactions and adaptive recognition determines the bandwidth of TCR-peptide-MHC cross-reactivity. Nature Immunology. 2016;17:87–94. doi: 10.1038/ni.3310. [DOI] [PMC free article] [PubMed] [Google Scholar]
  3. Al-Lazikani B, Lesk AM, Chothia C. Canonical structures for the hypervariable regions of T cell alphabeta receptors. Journal of Molecular Biology. 2000;295:979–995. doi: 10.1006/jmbi.1999.3358. [DOI] [PubMed] [Google Scholar]
  4. Baker BM, Scott DR, Blevins SJ, Hawse WF. Structural and dynamic control of T-cell receptor specificity, cross-reactivity, and binding mechanism. Immunological Reviews. 2012;250:10–31. doi: 10.1111/j.1600-065X.2012.01165.x. [DOI] [PubMed] [Google Scholar]
  5. Beringer DX, Kleijwegt FS, Wiede F, van der Slik AR, Loh KL, Petersen J, Dudek NL, Duinkerken G, Laban S, Joosten A, Vivian JP, Chen Z, Uldrich AP, Godfrey DI, McCluskey J, Price DA, Radford KJ, Purcell AW, Nikolic T, Reid HH, Tiganis T, Roep BO, Rossjohn J. T cell receptor reversed polarity recognition of a self-antigen major histocompatibility complex. Nature Immunology. 2015;16:1153–1161. doi: 10.1038/ni.3271. [DOI] [PubMed] [Google Scholar]
  6. Birnbaum ME, Mendoza JL, Sethi DK, Dong S, Glanville J, Dobbins J, Ozkan E, Davis MM, Wucherpfennig KW, Garcia KC. Deconstructing the peptide-MHC specificity of T cell recognition. Cell. 2014;157:1073–1087. doi: 10.1016/j.cell.2014.03.047. [DOI] [PMC free article] [PubMed] [Google Scholar]
  7. Bjorkman PJ, Saper MA, Samraoui B, Bennett WS, Strominger JL, Wiley DC. Structure of the human class I histocompatibility antigen, HLA-A2. Nature. 1987;329:506–512. doi: 10.1038/329506a0. [DOI] [PubMed] [Google Scholar]
  8. Bjorkman PJ, Parham P. Structure, function, and diversity of class I major histocompatibility complex molecules. Annual Review of Biochemistry. 1990;59:253–288. doi: 10.1146/annurev.bi.59.070190.001345. [DOI] [PubMed] [Google Scholar]
  9. Blackman M, Kappler J, Marrack P. The role of the T cell receptor in positive and negative selection of developing T cells. Science. 1990;248:1335–1341. doi: 10.1126/science.1972592. [DOI] [PubMed] [Google Scholar]
  10. Blevins SJ, Pierce BG, Singh NK, Riley TP, Wang Y, Spear TT, Nishimura MI, Weng ZP, Baker BM. How structural adaptability exists alongside HLA-A2 bias in the human αβ TCR repertoire. PNAS. 2016;113:E1276–E1285. doi: 10.1073/pnas.1522069113. [DOI] [PMC free article] [PubMed] [Google Scholar]
  11. Borbulevych OY, Piepenbrink KH, Gloor BE, Scott DR, Sommese RF, Cole DK, Sewell AK, Baker BM. T cell receptor cross-reactivity directed by antigen-dependent tuning of peptide-MHC molecular flexibility. Immunity. 2009;31:885–896. doi: 10.1016/j.immuni.2009.11.003. [DOI] [PMC free article] [PubMed] [Google Scholar]
  12. Boughter CT, Borowska MT, Guthmiller JJ, Bendelac A, Wilson PC, Roux B, Adams EJ. Biochemical patterns of antibody polyreactivity revealed through a bioinformatics-based analysis of CDR loops. eLife. 2020;9:e61393. doi: 10.7554/eLife.61393. [DOI] [PMC free article] [PubMed] [Google Scholar]
  13. Boughter CT, Meier-Schellersheim M. An integrated approach to the characterization of immune repertoires using AIMS: An Automated Immune Molecule Separator. PLOS Computational Biology. 2023;19:e1011577. doi: 10.1371/journal.pcbi.1011577. [DOI] [PMC free article] [PubMed] [Google Scholar]
  14. Bradford SYC, El Khoury L, Ge Y, Osato M, Mobley DL, Fischer M. Temperature artifacts in protein structures bias ligand-binding predictions. Chemical Science. 2021;12:11275–11293. doi: 10.1039/d1sc02751d. [DOI] [PMC free article] [PubMed] [Google Scholar]
  15. Brochet X, Lefranc MP, Giudicelli V. IMGT/V-QUEST: the highly customized and integrated system for IG and TR standardized V-J and V-D-J sequence analysis. Nucleic Acids Research. 2008;36:W503–W508. doi: 10.1093/nar/gkn316. [DOI] [PMC free article] [PubMed] [Google Scholar]
  16. Brooks BR, Brooks CL, Mackerell AD, Nilsson L, Petrella RJ, Roux B, Won Y, Archontis G, Bartels C, Boresch S, Caflisch A, Caves L, Cui Q, Dinner AR, Feig M, Fischer S, Gao J, Hodoscek M, Im W, Kuczera K, Lazaridis T, Ma J, Ovchinnikov V, Paci E, Pastor RW, Post CB, Pu JZ, Schaefer M, Tidor B, Venable RM, Woodcock HL, Wu X, Yang W, York DM, Karplus M. CHARMM: the biomolecular simulation program. Journal of Computational Chemistry. 2009;30:1545–1614. doi: 10.1002/jcc.21287. [DOI] [PMC free article] [PubMed] [Google Scholar]
  17. Brown JH, Jardetzky TS, Gorga JC, Stern LJ, Urban RG, Strominger JL, Wiley DC. Three-dimensional structure of the human class II histocompatibility antigen HLA-DR1. Nature. 1993;364:33–39. doi: 10.1038/364033a0. [DOI] [PubMed] [Google Scholar]
  18. Burrows SR, Chen ZJ, Archbold JK, Tynan FE, Beddoe T, Kjer-Nielsen L, Miles JJ, Khanna R, Moss DJ, Liu YC, Gras S, Kostenko L, Brennan RM, Clements CS, Brooks AG, Purcell AW, McCluskey J, Rossjohn J. Hard wiring of T cell receptor specificity for the major histocompatibility complex is underpinned by TCR adaptability. PNAS. 2010;107:10608–10613. doi: 10.1073/pnas.1004926107. [DOI] [PMC free article] [PubMed] [Google Scholar]
  19. Cheong R, Rhee A, Wang CJ, Nemenman I, Levchenko A. Information transduction capacity of noisy biochemical signaling networks. Science. 2011;334:354–358. doi: 10.1126/science.1204553. [DOI] [PMC free article] [PubMed] [Google Scholar]
  20. Ciacchi L, Farenc C, Dahal-Koirala S, Petersen J, Sollid LM, Reid HH, Rossjohn J. Structural basis of T cell receptor specificity and cross-reactivity of two HLA-DQ2.5-restricted gluten epitopes in celiac disease. The Journal of Biological Chemistry. 2022;298:101619. doi: 10.1016/j.jbc.2022.101619. [DOI] [PMC free article] [PubMed] [Google Scholar]
  21. Dai S, Huseby ES, Rubtsova K, Scott-Browne J, Crawford F, Macdonald WA, Marrack P, Kappler JW. Crossreactive T Cells spotlight the germline rules for alphabeta T cell-receptor interactions with MHC molecules. Immunity. 2008;28:324–334. doi: 10.1016/j.immuni.2008.01.008. [DOI] [PMC free article] [PubMed] [Google Scholar]
  22. Devlin JR, Alonso JA, Ayres CM, Keller GLJ, Bobisse S, Vander Kooi CW, Coukos G, Gfeller D, Harari A, Baker BM. Structural dissimilarity from self drives neoepitope escape from immune tolerance. Nature Chemical Biology. 2020;16:1269–1276. doi: 10.1038/s41589-020-0610-1. [DOI] [PMC free article] [PubMed] [Google Scholar]
  23. Evans R, O’Neill M, Pritzel A, Antropova N, Senior A, Green T, Žídek A, Bates R, Blackwell S, Yim J, Ronneberger O, Bodenstein S, Zielinski M, Bridgland A, Potapenko A, Cowie A, Tunyasuvunakool K, Jain R, Clancy E, Kohli P, Jumper J, Hassabis D. Protein complex prediction with alphafold-multimer. bioRxiv. 2022 doi: 10.1101/2021.10.04.463034. [DOI]
  24. Feng D, Bond CJ, Ely LK, Maynard J, Garcia KC. Structural evidence for a germline-encoded T cell receptor-major histocompatibility complex interaction “codon.”. Nature Immunology. 2007;8:975–983. doi: 10.1038/ni1502. [DOI] [PubMed] [Google Scholar]
  25. Garboczi DN, Ghosh P, Utz U, Fan QR, Biddison WE, Wiley DC. Structure of the complex between human T-cell receptor, viral peptide and HLA-A2. Nature. 1996;384:134–141. doi: 10.1038/384134a0. [DOI] [PubMed] [Google Scholar]
  26. Garcia KC, Degano M, Stanfield RL, Brunmark A, Jackson MR, Peterson PA, Teyton L, Wilson IA. An alphabeta T cell receptor structure at 2.5 A and its orientation in the TCR-MHC complex. Science. 1996;274:209–219. doi: 10.1126/science.274.5285.209. [DOI] [PubMed] [Google Scholar]
  27. Garcia KC, Teyton L, Wilson IA. Structural basis of T cell recognition. Annual Review of Immunology. 1999;17:369–397. doi: 10.1146/annurev.immunol.17.1.369. [DOI] [PubMed] [Google Scholar]
  28. Garcia KC, Adams JJ, Feng D, Ely LK. The molecular basis of TCR germline bias for MHC is surprisingly simple. Nature Immunology. 2009;10:143–147. doi: 10.1038/ni.f.219. [DOI] [PMC free article] [PubMed] [Google Scholar]
  29. Garcia KC. Reconciling views on T cell receptor germline bias for MHC. Trends in Immunology. 2012;33:429–436. doi: 10.1016/j.it.2012.05.005. [DOI] [PMC free article] [PubMed] [Google Scholar]
  30. Germain RN. T-cell development and the CD4-CD8 lineage decision. Nature Reviews. Immunology. 2002;2:309–322. doi: 10.1038/nri798. [DOI] [PubMed] [Google Scholar]
  31. Gowthaman R, Pierce BG. TCR3d: The T cell receptor structural repertoire database. Bioinformatics. 2019;35:5323–5325. doi: 10.1093/bioinformatics/btz517. [DOI] [PMC free article] [PubMed] [Google Scholar]
  32. Gras S, Burrows SR, Turner SJ, Sewell AK, McCluskey J, Rossjohn J. A structural voyage toward an understanding of the MHC-I-restricted immune response: lessons learned and much to be learned. Immunological Reviews. 2012;250:61–81. doi: 10.1111/j.1600-065X.2012.01159.x. [DOI] [PubMed] [Google Scholar]
  33. Gras S, Chadderton J, Del Campo CM, Farenc C, Wiede F, Josephs TM, Sng XYX, Mirams M, Watson KA, Tiganis T, Quinn KM, Rossjohn J, La Gruta NL. Reversed T cell receptor docking on a major histocompatibility class i complex limits involvement in the immune response. Immunity. 2016;45:749–760. doi: 10.1016/j.immuni.2016.09.007. [DOI] [PubMed] [Google Scholar]
  34. Gumbart JC, Roux B, Chipot C. Efficient determination of protein-protein standard binding free energies from first principles. Journal of Chemical Theory and Computation. 2013a;9:ct400273t. doi: 10.1021/ct400273t. [DOI] [PMC free article] [PubMed] [Google Scholar]
  35. Gumbart JC, Roux B, Chipot C. Standard binding free energies from computer simulations: What is the best strategy? Journal of Chemical Theory and Computation. 2013b;9:794–802. doi: 10.1021/ct3008099. [DOI] [PMC free article] [PubMed] [Google Scholar]
  36. Gunnarsen KS, Høydahl LS, Risnes LF, Dahal-Koirala S, Neumann RS, Bergseng E, Frigstad T, Frick R, du Pré MF, Dalhus B, Lundin KE, Qiao S-W, Sollid LM, Sandlie I, Løset GÅ. A TCRα framework-centered codon shapes A biased T cell repertoire through direct MHC and CDR3β interactions. JCI Insight. 2017;2:17. doi: 10.1172/jci.insight.95193. [DOI] [PMC free article] [PubMed] [Google Scholar]
  37. Hahn M, Nicholson MJ, Pyrdol J, Wucherpfennig KW. Unconventional topology of self peptide-major histocompatibility complex binding by a human autoimmune T cell receptor. Nature Immunology. 2005;6:490–496. doi: 10.1038/ni1187. [DOI] [PMC free article] [PubMed] [Google Scholar]
  38. Hennecke J, Carfi A, Wiley DC. Structure of a covalently stabilized complex of a human alphabeta T-cell receptor, influenza HA peptide and MHC class II molecule, HLA-DR1. The EMBO Journal. 2000;19:5611–5624. doi: 10.1093/emboj/19.21.5611. [DOI] [PMC free article] [PubMed] [Google Scholar]
  39. Hopkins CW, Le Grand S, Walker RC, Roitberg AE. Long-time-step molecular dynamics through hydrogen mass repartitioning. Journal of Chemical Theory and Computation. 2015;11:1864–1874. doi: 10.1021/ct5010406. [DOI] [PubMed] [Google Scholar]
  40. Humphrey W, Dalke A, Schulten K. VMD: visual molecular dynamics. Journal of Molecular Graphics. 1996;14:33–38. doi: 10.1016/0263-7855(96)00018-5. [DOI] [PubMed] [Google Scholar]
  41. Huseby ES, Crawford F, White J, Marrack P, Kappler JW. Interface-disrupting amino acids establish specificity between T cell receptors and complexes of major histocompatibility complex and peptide. Nature Immunology. 2006;7:1191–1199. doi: 10.1038/ni1401. [DOI] [PubMed] [Google Scholar]
  42. Ishigaki K, Lagattuta KA, Luo Y, James EA, Buckner JH, Raychaudhuri S. HLA autoimmune risk alleles restrict the hypervariable region of T cell receptors. Nature Genetics. 2022;54:393–402. doi: 10.1038/s41588-022-01032-z. [DOI] [PMC free article] [PubMed] [Google Scholar]
  43. Jerne NK. The somatic generation of immune recognition. European Journal of Immunology. 1971;1:1–9. doi: 10.1002/eji.1830010102. [DOI] [PubMed] [Google Scholar]
  44. Jo S, Kim T, Im W. Automated builder and database of protein/membrane complexes for molecular dynamics simulations. PLOS ONE. 2007;2:e880. doi: 10.1371/journal.pone.0000880. [DOI] [PMC free article] [PubMed] [Google Scholar]
  45. Jo S, Kim T, Iyer VG, Im W. CHARMM-GUI: A web-based graphical user interface for CHARMM. Journal of Computational Chemistry. 2008;29:1859–1865. doi: 10.1002/jcc.20945. [DOI] [PubMed] [Google Scholar]
  46. Juang J, Ebert PJR, Feng D, Garcia KC, Krogsgaard M, Davis MM. Peptide-MHC heterodimers show that thymic positive selection requires a more restricted set of self-peptides than negative selection. The Journal of Experimental Medicine. 2010;207:1223–1234. doi: 10.1084/jem.20092170. [DOI] [PMC free article] [PubMed] [Google Scholar]
  47. Jung D, Alt FW. Unraveling V(D)J recombination; insights into gene regulation. Cell. 2004;116:299–311. doi: 10.1016/s0092-8674(04)00039-x. [DOI] [PubMed] [Google Scholar]
  48. Krovi SH, Kappler JW, Marrack P, Gapin L. Inherent reactivity of unselected TCR repertoires to peptide-MHC molecules. PNAS. 2019;116:22252–22261. doi: 10.1073/pnas.1909504116. [DOI] [PMC free article] [PubMed] [Google Scholar]
  49. Lee J, Cheng X, Swails JM, Yeom MS, Eastman PK, Lemkul JA, Wei S, Buckner J, Jeong JC, Qi Y, Jo S, Pande VS, Case DA, Brooks CL, MacKerell AD, Klauda JB, Im W. CHARMM-GUI Input Generator for NAMD, GROMACS, AMBER, OpenMM, and CHARMM/OpenMM Simulations Using the CHARMM36 Additive Force Field. Journal of Chemical Theory and Computation. 2016;12:405–413. doi: 10.1021/acs.jctc.5b00935. [DOI] [PMC free article] [PubMed] [Google Scholar]
  50. Lefranc MP. Immunoglobulins: 25 years of immunoinformatics and IMGT-ONTOLOGY. Biomolecules. 2014;4:1102–1139. doi: 10.3390/biom4041102. [DOI] [PMC free article] [PubMed] [Google Scholar]
  51. Lu J, Van Laethem F, Bhattacharya A, Craveiro M, Saba I, Chu J, Love NC, Tikhonova A, Radaev S, Sun X, Ko A, Arnon T, Shifrut E, Friedman N, Weng N-P, Singer A, Sun PD. Molecular constraints on CDR3 for thymic selection of MHC-restricted TCRs from a random pre-selection repertoire. Nature Communications. 2019;10:1019. doi: 10.1038/s41467-019-08906-7. [DOI] [PMC free article] [PubMed] [Google Scholar]
  52. Mack SJ, Cano P, Hollenbach JA, He J, Hurley CK, Middleton D, Moraes ME, Pereira SE, Kempenich JH, Reed EF, Setterholm M, Smith AG, Tilanus MG, Torres M, Varney MD, Voorter CEM, Fischer GF, Fleischhauer K, Goodridge D, Klitz W, Little AM, Maiers M, Marsh SGE, Müller CR, Noreen H, Rozemuller EH, Sanchez-Mazas A, Senitzer D, Trachtenberg E, Fernandez-Vina M. Common and well-documented HLA alleles: 2012 update to the CWD catalogue. Tissue Antigens. 2013;81:194–203. doi: 10.1111/tan.12093. [DOI] [PMC free article] [PubMed] [Google Scholar]
  53. Marrack P, Kappler J. The T cell receptor. Science. 1987;238:1073–1079. doi: 10.1126/science.3317824. [DOI] [PubMed] [Google Scholar]
  54. Mason D. A very high level of crossreactivity is an essential feature of the T-cell receptor. Immunology Today. 1998;19:395–404. doi: 10.1016/s0167-5699(98)01299-7. [DOI] [PubMed] [Google Scholar]
  55. McGibbon RT, Beauchamp KA, Harrigan MP, Klein C, Swails JM, Hernández CX, Schwantes CR, Wang LP, Lane TJ, Pande VS. MDTraj: a modern open library for the analysis of molecular dynamics trajectories. Biophysical Journal. 2015;109:1528–1532. doi: 10.1016/j.bpj.2015.08.015. [DOI] [PMC free article] [PubMed] [Google Scholar]
  56. Mei Z, Treado JD, Grigas AT, Levine ZA, Regan L, O’Hern CS. Analyses of protein cores reveal fundamental differences between solution and crystal structures. Proteins. 2020;88:1154–1161. doi: 10.1002/prot.25884. [DOI] [PMC free article] [PubMed] [Google Scholar]
  57. Milighetti M, Shawe-Taylor J, Chain B. Corrigendum: predicting t cell receptor antigen specificity from structural features derived from homology models of receptor-peptide-major histocompatibility complexes. Frontiers in Physiology. 2021;12:790998. doi: 10.3389/fphys.2021.790998. [DOI] [PMC free article] [PubMed] [Google Scholar]
  58. Mora T, Walczak AM, Bialek W, Callan CG. Maximum entropy models for antibody diversity. PNAS. 2010;107:5405–5410. doi: 10.1073/pnas.1001705107. [DOI] [PMC free article] [PubMed] [Google Scholar]
  59. Moradi S, Berry R, Pymm P, Hitchen C, Beckham SA, Wilce MCJ, Walpole NG, Clements CS, Reid HH, Perugini MA, Brooks AG, Rossjohn J, Vivian JP. The structure of the atypical killer cell immunoglobulin-like receptor, KIR2DL4. The Journal of Biological Chemistry. 2015;290:10460–10471. doi: 10.1074/jbc.M114.612291. [DOI] [PMC free article] [PubMed] [Google Scholar]
  60. Moradi S, Stankovic S, O’Connor GM, Pymm P, MacLachlan BJ, Faoro C, Retière C, Sullivan LC, Saunders PM, Widjaja J, Cox-Livingstone S, Rossjohn J, Brooks AG, Vivian JP. Structural plasticity of KIR2DL2 and KIR2DL3 enables altered docking geometries atop HLA-C. Nature Communications. 2021;12:2173. doi: 10.1038/s41467-021-22359-x. [DOI] [PMC free article] [PubMed] [Google Scholar]
  61. Murugan A, Mora T, Walczak AM, Callan CG. Statistical inference of the generation probability of T-cell receptors from sequence repertoires. PNAS. 2012;109:16161–16166. doi: 10.1073/pnas.1212755109. [DOI] [PMC free article] [PubMed] [Google Scholar]
  62. Nandigrami P, Szczepaniak F, Boughter CT, Dehez F, Chipot C, Roux B. Computational assessment of protein-protein binding specificity within a family of synaptic surface receptors. The Journal of Physical Chemistry. B. 2022;126:7510–7527. doi: 10.1021/acs.jpcb.2c02173. [DOI] [PubMed] [Google Scholar]
  63. Nguyen AT, Szeto C, Gras S. The pockets guide to HLA class I molecules. Biochemical Society Transactions. 2021;49:2319–2331. doi: 10.1042/BST20210410. [DOI] [PMC free article] [PubMed] [Google Scholar]
  64. Petersen J, Montserrat V, Mujico JR, Loh KL, Beringer DX, van Lummel M, Thompson A, Mearin ML, Schweizer J, Kooy-Winkelaar Y, van Bergen J, Drijfhout JW, Kan W-T, La Gruta NL, Anderson RP, Reid HH, Koning F, Rossjohn J. T-cell receptor recognition of HLA-DQ2-gliadin complexes associated with celiac disease. Nature Structural & Molecular Biology. 2014;21:480–488. doi: 10.1038/nsmb.2817. [DOI] [PubMed] [Google Scholar]
  65. Petersen J, Ciacchi L, Tran MT, Loh KL, Kooy-Winkelaar Y, Croft NP, Hardy MY, Chen Z, McCluskey J, Anderson RP, Purcell AW, Tye-Din JA, Koning F, Reid HH, Rossjohn J. T cell receptor cross-reactivity between gliadin and bacterial peptides in celiac disease. Nature Structural & Molecular Biology. 2020;27:49–61. doi: 10.1038/s41594-019-0353-4. [DOI] [PubMed] [Google Scholar]
  66. Piepenbrink KH, Blevins SJ, Scott DR, Baker BM. The basis for limited specificity and MHC restriction in a T cell receptor interface. Nature Communications. 2013;4:1948. doi: 10.1038/ncomms2948. [DOI] [PMC free article] [PubMed] [Google Scholar]
  67. Qiao S-W, Christophersen A, Lundin KEA, Sollid LM. Biased usage and preferred pairing of α- and β-chains of TCRs specific for an immunodominant gluten epitope in coeliac disease. International Immunology. 2014;26:13–19. doi: 10.1093/intimm/dxt037. [DOI] [PubMed] [Google Scholar]
  68. Riley TP, Hellman LM, Gee MH, Mendoza JL, Alonso JA, Foley KC, Nishimura MI, Vander Kooi CW, Garcia KC, Baker BM. T cell receptor cross-reactivity expanded by dramatic peptide-MHC adaptability. Nature Chemical Biology. 2018;14:934–942. doi: 10.1038/s41589-018-0130-4. [DOI] [PMC free article] [PubMed] [Google Scholar]
  69. Robinson J, Mistry K, McWilliam H, Lopez R, Marsh SGE. IPD--the immuno polymorphism database. Nucleic Acids Research. 2010;38:D863–D869. doi: 10.1093/nar/gkp879. [DOI] [PMC free article] [PubMed] [Google Scholar]
  70. Robinson J, Guethlein LA, Cereb N, Yang SY, Norman PJ, Marsh SGE, Parham P. Distinguishing functional polymorphism from random variation in the sequences of >10,000 HLA-A, -B and -C alleles. PLOS Genetics. 2017;13:e1006862. doi: 10.1371/journal.pgen.1006862. [DOI] [PMC free article] [PubMed] [Google Scholar]
  71. Román-Roldán R, Bernaola-Galván P, Oliver JL. Application of information theory to DNA sequence analysis: A review. Pattern Recognition. 1996;29:1187–1194. doi: 10.1016/0031-3203(95)00145-X. [DOI] [Google Scholar]
  72. Scott DR, Borbulevych OY, Piepenbrink KH, Corcelli SA, Baker BM. Disparate degrees of hypervariable loop flexibility control T-cell receptor cross-reactivity, specificity, and binding mechanism. Journal of Molecular Biology. 2011;414:385–400. doi: 10.1016/j.jmb.2011.10.006. [DOI] [PMC free article] [PubMed] [Google Scholar]
  73. Scott-Browne JP, White J, Kappler JW, Gapin L, Marrack P. Germline-encoded amino acids in the alphabeta T-cell receptor control thymic selection. Nature. 2009;458:1043–1046. doi: 10.1038/nature07812. [DOI] [PMC free article] [PubMed] [Google Scholar]
  74. Scott-Browne JP, Crawford F, Young MH, Kappler JW, Marrack P, Gapin L. Evolutionarily conserved features contribute to αβ T cell receptor specificity. Immunity. 2011;35:526–535. doi: 10.1016/j.immuni.2011.09.005. [DOI] [PMC free article] [PubMed] [Google Scholar]
  75. Sethi DK, Gordo S, Schubert DA, Wucherpfennig KW. Crossreactivity of a human autoimmune TCR is dominated by a single TCR loop. Nature Communications. 2013;4:2623. doi: 10.1038/ncomms3623. [DOI] [PMC free article] [PubMed] [Google Scholar]
  76. Sewell AK. Why must T cells be cross-reactive? Nature Reviews. Immunology. 2012;12:669–677. doi: 10.1038/nri3279. [DOI] [PMC free article] [PubMed] [Google Scholar]
  77. Shannon CE. A mathematical theory of communication. Bell System Technical Journal. 1948;27:623–656. doi: 10.1002/j.1538-7305.1948.tb00917.x. [DOI] [Google Scholar]
  78. Sharon E, Sibener LV, Battle A, Fraser HB, Garcia KC, Pritchard JK. Genetic variation in MHC proteins is associated with T cell receptor expression biases. Nature Genetics. 2016;48:995–1002. doi: 10.1038/ng.3625. [DOI] [PMC free article] [PubMed] [Google Scholar]
  79. Sibener LV, Fernandes RA, Kolawole EM, Carbone CB, Liu F, McAffee D, Birnbaum ME, Yang X, Su LF, Yu W, Dong S, Gee MH, Jude KM, Davis MM, Groves JT, Goddard WA, Heath JR, Evavold BD, Vale RD, Garcia KC. Isolation of a Structural Mechanism for Uncoupling T Cell Receptor Signaling from Peptide-MHC Binding. Cell. 2018;174:672–687. doi: 10.1016/j.cell.2018.06.017. [DOI] [PMC free article] [PubMed] [Google Scholar]
  80. Singh NK, Alonso JA, Devlin JR, Keller GLJ, Gray GI, Chiranjivi AK, Foote SG, Landau LM, Arbuiso AG, Weiss LI, Rosenberg AM, Hellman LM, Nishimura MI, Baker BM. A class-mismatched TCR bypasses MHC restriction via an unorthodox but fully functional binding geometry. Nature Communications. 2022;13:7189. doi: 10.1038/s41467-022-34896-0. [DOI] [PMC free article] [PubMed] [Google Scholar]
  81. Smith AR, Alonso JA, Ayres CM, Singh NK, Hellman LM, Baker BM. Structurally silent peptide anchor modifications allosterically modulate T cell recognition in a receptor-dependent manner. PNAS. 2021;118:e2018125118. doi: 10.1073/pnas.2018125118. [DOI] [PMC free article] [PubMed] [Google Scholar]
  82. Stadinski BD, Trenh P, Duke B, Huseby PG, Li G, Stern LJ, Huseby ES. Effect of CDR3 sequences and distal V gene residues in regulating TCR-MHC contacts and ligand specificity. Journal of Immunology. 2014;192:6071–6082. doi: 10.4049/jimmunol.1303209. [DOI] [PMC free article] [PubMed] [Google Scholar]
  83. Thielens A, Vivier E, Romagné F. NK cell MHC class I specific receptors (KIR): from biology to clinical intervention. Current Opinion in Immunology. 2012;24:239–245. doi: 10.1016/j.coi.2012.01.001. [DOI] [PubMed] [Google Scholar]
  84. Tikhonova AN, Van Laethem F, Hanada K, Lu J, Pobezinsky LA, Hong C, Guinter TI, Jeurling SK, Bernhardt G, Park J-H, Yang JC, Sun PD, Singer A. αβ T cell receptors that do not undergo major histocompatibility complex-specific thymic selection possess antibody-like recognition specificities. Immunity. 2012;36:79–91. doi: 10.1016/j.immuni.2011.11.013. [DOI] [PMC free article] [PubMed] [Google Scholar]
  85. Tynan FE, Burrows SR, Buckle AM, Clements CS, Borg NA, Miles JJ, Beddoe T, Whisstock JC, Wilce MC, Silins SL, Burrows JM, Kjer-Nielsen L, Kostenko L, Purcell AW, McCluskey J, Rossjohn J. T cell receptor recognition of a “super-bulged” major histocompatibility complex class I-bound peptide. Nature Immunology. 2005;6:1114–1122. doi: 10.1038/ni1257. [DOI] [PubMed] [Google Scholar]
  86. Van Laethem F, Sarafova SD, Park J-H, Tai X, Pobezinsky L, Guinter TI, Adoro S, Adams A, Sharrow SO, Feigenbaum L, Singer A. Deletion of CD4 and CD8 coreceptors permits generation of alphabetaT cells that recognize antigens independently of the MHC. Immunity. 2007;27:735–750. doi: 10.1016/j.immuni.2007.10.007. [DOI] [PubMed] [Google Scholar]
  87. Van Laethem F, Tikhonova AN, Singer A. MHC restriction is imposed on a diverse T cell receptor repertoire by CD4 and CD8 co-receptors during thymic selection. Trends in Immunology. 2012;33:437–441. doi: 10.1016/j.it.2012.05.006. [DOI] [PMC free article] [PubMed] [Google Scholar]
  88. Vinga S. Information theory applications for biological sequence analysis. Briefings in Bioinformatics. 2014;15:376–389. doi: 10.1093/bib/bbt068. [DOI] [PMC free article] [PubMed] [Google Scholar]
  89. Wu LC, Tuot DS, Lyons DS, Garcia KC, Davis MM. Two-step binding mechanism for T-cell receptor recognition of peptide MHC. Nature. 2002;418:552–556. doi: 10.1038/nature00920. [DOI] [PubMed] [Google Scholar]
  90. Yin L, Scott-Browne J, Kappler JW, Gapin L, Marrack P. T cells and their eons-old obsession with MHC. Immunological Reviews. 2012;250:49–60. doi: 10.1111/imr.12004. [DOI] [PMC free article] [PubMed] [Google Scholar]
  91. Ysern X, Li H, Mariuzza RA. Imperfect interfaces. Nature Structural Biology. 1998;5:412–414. doi: 10.1038/nsb0698-412. [DOI] [PubMed] [Google Scholar]
  92. Zareie P, Szeto C, Farenc C, Gunasinghe SD, Kolawole EM, Nguyen A, Blyth C, Sng XYX, Li J, Jones CM, Fulcher AJ, Jacobs JR, Wei Q, Wojciech L, Petersen J, Gascoigne NRJ, Evavold BD, Gaus K, Gras S, Rossjohn J, La Gruta NL. Canonical T cell receptor docking on peptide-MHC is essential for T cell signaling. Science. 2021;372:eabe9124. doi: 10.1126/science.abe9124. [DOI] [PubMed] [Google Scholar]

Editor's evaluation

Armita Nourmohammad 1

This important work presents evidence that evolved biophysical compatibility between T cell receptors (TCRs) and MHC molecules is possible and a potential solution to the question of how TCRs could be biased towards MHC proteins given the massive diversity in both receptor and ligand. The evidence supporting the claims of the authors is solid, although the nature of these evolutionary questions makes it difficult to confidently answer some of the raised questions. The work will be of interest to immunologists, structural biologists, and evolutionary biologists.

Decision letter

Editor: Armita Nourmohammad1
Reviewed by: Eric Huseby2, Brian Baker3

In the interests of transparency, eLife publishes the most substantive revision requests and the accompanying author responses.

[Editors' note: this paper was reviewed by Review Commons.]

Decision letter after peer review:

[Editors’ note: the authors submitted for reconsideration following the decision after peer review. What follows is the decision letter after the first round of review.]

Thank you for submitting the paper "Conserved Biophysical Compatibility Among the Highly Variable Germline-Encoded Regions Shapes TCR-MHC Interactions" for consideration by eLife. Your article has been reviewed by 3 peer reviewers, and the evaluation has been overseen by a Reviewing Editor and a Senior Editor. The following individuals involved in the review of your submission have agreed to reveal their identity: Eric Huseby (Reviewer #2); Brian Baker (Reviewer #3).

Comments to the Authors:

We are sorry to say that, after consultation with the reviewers, we have decided that this work will not be considered further for publication by eLife.

All reviewers agree that this study addresses an important topic, namely the sequence determinants of TCR-MHC binding modes. The sequence analysis in the study illustrates that the diversity of CDR loops and MHC contact surfaces is likely incompatible with hard-wired interaction motifs. However, the reviewers argue that the subsequent claims about the true origins of TCR:MHC docking orientations, and speculation about the origins of self-reactive TCRs, are based on flawed and unconvincing analyses. The reviews provide detailed suggestions as to how to improve the analyses to test the claims. We believe the substantial steps needed to address these reviews go beyond the scope of this manuscript but if the authors decide to expand on these suggestions, they can submit the manuscript as a new submission.

Reviewer #1 (Recommendations for the authors):

The authors investigate the origins of TCR:MHC docking orientation using information-theoretic sequence analysis simplified biophysical scoring, and inter-atomic contact analysis of solved TCR:pMHC ternary complexes. First, the authors show that the TCR CDR loops are more variable in sequence and in biophysical properties than the surface-exposed regions of the MHC. They conclude that "This mismatched diversity between the TCR germline-encoded CDR loops and the MHC α-helices suggests that conserved germline-encoded interactions are unlikely to exist for every possible molecular combination". Though not conclusive, this is consistent with the observed variability in the solved ternary structure databases, which show smoothly varying binding orientations rather than discrete recurring binding solutions. The authors also claim to see very little mutual information between TCR and MHC sequence positions, but they appear to be matching them up randomly (rather than using established TCR:MHC pairings from epitope-specific TCRs, for example, or TCRs from HLA-typed individuals), so it's not clear how this analysis could possibly find any covariation.

The heart of the study relies on a simplified 20x20 amino acid interaction matrix that is meant to capture basic biophysical interaction propensities. The sign of the values in the matrix is chosen to accord with intuition (opposite charges are favorable, like charges are unfavorable, etc), but the absolute values of the matrix values seem pretty arbitrary (all either 0, 0.5, 1, or 2). All matrix values for alanine and glycine are zero, despite their frequent involvement in tight hydrophobic packing interactions. The core calculation is to take all the residues in a given CDR1 loop (regardless of orientation: pointing toward MHC or toward the core of the TCR), and look up the interaction matrix scores for all surface residues (or maybe even all residues, period, it's hard to tell) of an MHC molecule, and sum up all the interaction scores. This single number (averaged over all HLA alleles) then reports the "interaction propensity" for that CDR1 loop sequence; if it's negative, then the loop/V gene has "severely limited interaction potential with HLA molecules". Despite the obvious problems with this – that the matrix is crude and arbitrary, that the sum involves many pairs of residues that couldn't possibly interact, etc, etc – the authors take these summed interaction scores as the basis for subsequent conclusions. For example, Figure 4 shows that TRBV7-2 and 7-3 have limited interaction potential (which appears to be related to them having glycine and alanine in their loops) with class I MHC; this finding is linked by the authors to the fact that these V genes are enriched in certain epitope-specific responses in celiac disease and multiple sclerosis, despite these enrichments being found in CD4 T cells. I looked at several TRBV7-2/7-3 containing ternary complexes (4mji, 5eu6, 5d2l, 4grl, 4ozh) and in fact, the TRBV7 segments are making extensive MHC contacts, dominating the TRAV segments in every case (4grl is a great example). It seems doubtful that the interaction scores derived from all pairwise residue matrix values are telling us anything about the intrinsic binding properties of the TCR V genes.

Next is a section entitled "Structural Data Validate Interaction Scores", in which they analyze atomic contacts in ternary complexes. Figure 5A certainly looks impressive at first glance, with tall bars for "predicted binders" and short or non-existent bars for "predicted NonBinders". But the problem is that there is no correction for the number of "nonbinder" V genes, and for example for CDR1A there only appear to be only 2 or 3 (Figure 4B), which may or may not have contributed to the database of solved structures. Thus the preponderance of observed contacts coming from "predicted binders" could just be due to the structural database composition, with binder and non-binder V genes making interactions at the same rate. The other problem with this analysis is that the contact analysis itself is flawed: the distance threshold is too small for hydrophobic interactions (4.5A would be better); there are too few total contacts being found (average of 1.35 per structure) the atom types included (referring here to the jupyter notebook https://github.com/ctboughter/PRESTO/blob/main/AIMS_interact_compare.ipynb) don't look right, since oxygen-oxygen and nitrogen-nitrogen can both form an H-bond donor-acceptor pair, and there's no evidence that hydrogens are being added to the structure; and the rules for counting "productive" contacts are too prescriptive (no carbon-carbon hydrophobic contacts allowed between polar or charged residues, even arg and lys with their long side chains). This latter has the consequence that the comparison to interaction scores becomes a little circular because the contact counting is driven by the same simplified biochemical intuition embodied in the pairwise interaction matrix. Much better would be to combine unbiased contact analysis (including backbone atoms) with an orthogonal measure such as buried surface area, and then look to see if predicted non-binder V genes really do make fewer interactions with MHC.

The remainder of the manuscript uses these interaction-matrix sums to investigate the determinants of the TCR:MHC docking mode. This is just not convincing, for the reasons outlined above, and also because there appear to be logical inconsistencies here. The concept is that MHC surfaces of "low interaction potential" (ie, alanine and glycine) define guardrails that limit the binding mode. Figure 8E has a nice cartoon showing the central ala/gly region in the class I alpha2 helix. The problem is that there are actually contacts throughout and on both sides of that "guardrail", which can be seen from Figure 7C, lower panel (161,164,165) or from a cursory examination of a few ternary complex structures. It's also not clear why, for class I α helix 2, MHC positions 143 and 144 have such low interaction scores (Figure 7C, upper panel) when in the alignment in Figure 8C those positions look similar to other R/K-containing positions.

On the positive side, the authors make their analysis scripts and notebooks very easily accessible, which is a big plus for reproducibility and transparency.

A few additional comments:

"The exposed residues on the α2-helix of HLA class I molecules are enriched in alanine and glycine relative to the α1- helix, which is highly unlikely to be involved in a specific, orientation-altering productive interaction" – alanine and glycine can be involved in highly specific packing interactions. Glycine, for example, can create pockets into which other side chains fit.

"Every crystallized TCR-HLA class II complex solved thus far adopts the canonical docking orientation whereby the TCR β-chain binds to the HLA α-chain helix, while the TCR α-chain binds to the HLA β-chain helix" – this is not correct, see 4y19 and 4y1a from the Rossjohn group.

"…obviating the need for a more precise approach" – do you mean "highlighting"?

This part of the methods is super-confusing (and I couldn't find it in the code): "Further, given that any single pair of amino acids on adjacent interfaces of protein binding partners can potentially form strong interactions without being meaningful for the formation of a given complex, we require that any productive interaction include a triad of at least weakly interacting residues".

As mentioned above, the whole mutual information analysis seems bonkers. How could there be any mutual information if the pairing between TCR and MHC is random/arbitrary? Please explain this part better:

"…every TCR should interact with every HLA allele. Humans largely possess the same TRAV and TRBV alleles, but each individual possesses a maximum of 12 HLA alleles. We expect that specific alleles that are unable to enforce the supposed evolutionary rules for canonical docking will not be allowed to persist in the population. Continuing from this assumption we then subsample the data and calculate the mutual information on this subsampled dataset. Each TRAV and TRBV allele (the input) is matched with a single HLA allele (the output), and the mutual information is calculated for these pairings".

Reviewer #2 (Recommendations for the authors):

The authors take an all-encompassing computational approach to analyzing TCR CDR – MHC interactions with the goal of identifying repetitive use of complementary protein-protein interaction events. On a first pass, there does not appear to be a significant contribution (to the T cell repertoire) of truly conserved pairwise interactions that drive MHC restriction. In contrast, their 'whole repertoire-wide approach' strongly supports the general concept that TCRs find opportunistic ways to bind pMHC using biochemically similar interactions.

First, I want to state that I really enjoyed reading this paper. I think it is written very well, which is quite important for papers on this topic as it can be a struggle even for seasoned immunologists to comprehend how there might be 'rules of engagement' when both the TCR and MHC/HLA are highly variable proteins. My comments will largely focus on issues that may help the authors provide the readers with a better understanding of the background and what their program does, and does not do. I will use statements within the manuscript to highlight these challenges.

In the abstract, "The formation of the TCR-peptide-MHC complex (TCR-pMHC) can be broken into two types of interactions, one between the hypervariable TCR CDR3α/β loops and the presented peptide and the second between germline-encoded regions of the TCR and MHC. "

– This is not an accurate statement. There are significant interactions between the CDR3 and MHC, as well as CDR1 and peptides. E.g., CDR1a often engages p-1 and p2 peptide residues, CDR3b almost always engages at some level, MHC-IIa61 area, and CDR3a with MHC-IIb 60area. Within the manuscript, the authors back off a bit from their hyper-simplistic statement, however, having such a blunt untrue statement in the abstract is not reasonable.

"Instead, binding properties such as the docking orientation is defined by regions of biophysical compatibility between these loops and the MHC surface."

– The authors spend a lot of effort working through certain variables that contribute to the binding reaction. I am wondering if the authors took account of shape complementarity (e.g., PMID: 9628472) and CDR loops that carry different types of conserved canonical structures (e.g., PMID: 10656805). One could imagine that based on the protein folding requirements of CDR regions, certain residues are in the interface whereas others are internal to the CDR structure and cannot actually contribute directly to binding.

"We selected a key hydrogen bonding network in the KIR2DL2-HLA-C*07:02 interface [50] and compared this to the evolutionarily conserved YXY motif of CDR2β [19, 21]".

– This is a good example to discuss the point above. it is important to know structurally, where each residue is. For example, the first Y (46 or 48 depending upon the nomenclature, above) often does not directly contribute to pMHC binding but may be important for the "outline structure" of the CDR loop itself. In addition, the authors do not discuss Van der Waals interactions really at all. Much of the TCR-pMHC interface (binding affinity) is driven by the exclusion of water, a property that is very difficult to assess on an amino acid-amino acid pairwise allotment of interaction energy. I was hoping that once the authors started to discuss "areas of binding potential" the contribution of non-side chain to side chain interactions would be discussed. It is unclear to this reviewer if these types of interactions are accounted for within their algorithm or if they are largely ignored.

In discussing the interaction potential, of amino acids, the authors cite and discuss a single manuscript.

42. P. Nandigrami, F. Szczepaniak, C.T. Boughter, F. Dehez, C. Chipot, and B. Roux. Computational assessment of protein-protein binding specificity within a family of synaptic surface receptors. Journal of Physical Chemistry B, 2022.

There is of course an empirical and computational field of study for how proteins bind one another as well as for TCRs and pMHC (e.g., PMID: 10410805, PMID: 16193038, PMID: 18946038, PMID: 27348411). Some more inclusive discussion of past ideas about how proteins interact with one another and whether old ideas remain accurate could add to the overall discussion.

"Figure 4: Interaction score between every TRBV (A) or TRAV (B) sequence and HLA allele for all four germline-encoded CDR loops. "

– Why are alanine and glycines assumed to be zero/non-interacting? Does a binding reaction care if a contact is a side chain-side chain, backbone-backbone, or mix? Indeed, when the authors "counted the contacts" I assume many of the side chains were indeed interacting with backbone atoms. It has also been suggested that some side chains can contribute negatively to interfaces (e.g., PMID: 17041605). Another question, perhaps for the algorithm used, does it take into account the frequency at which say X and Y amino acids actually occur at a possible site of interactions. It is mentioned that autoimmune-prone T cell repertoires are biased for certain TCR usage, does this bias include matching/non-matching HLA areas of recognition? There was some discussion on this but a clearer picture (if there is one) could be spelled out for the non-expert.

The interaction potentials also succeed in predicting TCR complexes that will not make contact with MHC. 20 of the 22 structures predicted to have poor CDR2β binding make no contact with MHC, while the last two only make one contact with MHC (Figure 5C). Further, all 8 structures predicted to have poor CDR1β binding make no contact with MHC. (Figure 5C). Again, this prediction accuracy is lower for class II predictions (Figure 5D).

– This is a super interesting idea that may unlock a lot of what is going on. One wonders how much of this is random chance, i.e., if a different TCR-pMHC with the same V genes and HLA would behave similarly. Also, do these structures preclude (or are driven by) CD1-peptide contacts, or are the structures carry such a different docking orientation as to completely preclude the CDR1 and CDR2 regions from being part of the binding interface?

The exposed residues on the α2-helix of HLA class I molecules are enriched in alanine and glycine relative to the α1- helix, which is highly unlikely to be involved in a specific, orientation-altering productive interaction.

– In practice, it is this reviewer's understanding that there are exit contributions of Van der Waals interactions at these sites. Indeed, early ideas suggested that the diagonal area of pMHC (MHCa 61, MHCb73) used this divot for shape complementary purposes.

It is important to note that these interaction potentials take an unbiased approach, calculating every possible interaction between TCR and MHC residues to produce this final score.

– It was unclear if the authors mean position by position, or did they weigh whether a residue was actually surface exposed and capable of being part of the binding interface.

productive side-chain interactions between CDR loops and the solvent-exposed residues of the MHC helices.

– There does seem to be an (over) emphasis on side-chain interactions. And less so on the clustered ability for VDW and/or inhibitory interaction.

– In general, there are quite a number of T cell development citations with actually very little discussed the role of thymic selection in and/or clonal T cell responses in skewing the TCR-pMHC interface to conform to selective pressures. E.g., TCRs can't be too good/cross-reactive or they would undergo central tolerance.

"In calculating the interaction score, we assume that productive contacts are only made by the side chains of the interacting residues. This simplification does not capture all TCR-pMHC complex contacts, but here we are looking for selectivity enforced by specific TCR-MHC interactions mediated by side-chains."

– Though stated as a caveat, perhaps some effort could be made to include side-chain to the backbone, etc interactions.

Reviewer #3 (Recommendations for the authors):

Boughter and Meier-Schellersheim describe an analysis of TCR-peptide/MHC complexes, aiming to gain an understanding of the underpinnings of the "common" TCR binding geometry. This is fundamental to understanding the MHC restriction of TCRs and how T cells scan and readout peptides. They begin with a comprehensive bioinformatics approach, move to a structural analysis to help interpret the informatics, and bring in biophysical computations. The overall conclusion that specific contacts between TCR genes and MHC proteins are not necessarily pre-programmed and that traditional TCR binding geometries emerge from biophysical compatibility is supported by the data and consistent with recent findings. In general, the work and the conclusions are an advance and place recent findings into perspective. However, the strength of evidence is weakened by choices made in characterizing structures, computing energies, and a strained reliance on "roles" played the parts of the interface which have been discounted many times yet persist in the literature. The latter in particular weakens the discussion and how the authors view the impact of their work.

The major strength of the paper is the approach taken; I found the comparative analysis of TCR and MHC genetic variability at the sequence level particularly compelling. Bringing in KIRs as a control was also a strong way to support the arguments. There is one major technical weakness in that, as far as is clear from the methods, interatomic interactions were considered with a 3.5 Å cutoff. This is woefully inadequate. Electrostatic interactions can be strong at long distances, which the authors really need to consider – say, going out to 6 Angstroms or so (there is much-published literature on short- and long-range electrostatics in protein interfaces). The importance of long-range electrostatics in TCR-peptide/MHC complexes has been demonstrated previously, particularly in prior work that aimed to address the same problem studied here. The authors also fall victim to the common immunology trope that CDR3-peptide interactions drive specificity, leaving CDR1/CDR2 to bind MHC proteins, i.e., the CDR loops have "roles" in binding. In the very first high-resolution structure of a TCR-peptide/MHC complex, CDR3 interactions with a class I MHC were noted and remarked on, as were CDR1 and CDR2 interactions with the peptide. Later work showed that these CDR3-MHC and CDR2-peptide interactions were critical for binding. These findings have been replicated several times now. The authors' introduction of this perspective of different loops of the TCR playing evolved roles (CDR3->peptide, CDR1/2->MHC), and their interpretation of their findings in light of it, weakens the papers' conclusions and impact, and it is a missed opportunity that can be addressed with the authors' approach.

The authors also should consider other literature for a greater impact on their work. For example, they also exclude backbone interactions – this is a curious omission from a biophysical perspective, and others in the field have published on the importance of backbone-mediated interactions (hydrogen bonds mostly) in stabilizing TCR interfaces. The authors also mention but fail to address T cell selection and the role of selection (and possibly coreceptor) in 'enforcing' what we get and have seen structurally (i.e., the idea that pre-selection TCRs bind all over the place, but selection ensures we get ones that bind right and work). Much has been written about this and it should be included.

1) The very first high-resolution crystal structure of a TCR-pMHC complex by Garboczi and Wiley in the 90s (PMID 8906788) showed CDR3 contacts to the MHC and germline CDR1/2 contacts to the MHC. Later biophysical studies by our own group showed these were crucial for binding (PMID 23736024). Other work has shown the same. Thus, although it is common to say that diverse CDR3 loops bind peptide and germline-encoded CDR1/2 loops bind the MHC, this is not supported at the atomic or energetic level. It actually plays INTO the authors' argument about opportunism/compatibility, but curiously the authors do not discuss it. They should. These observations and the idea that "roles" are not hardcoded into the TCR CDR loops play right into the authors' opportunistic argument introduced at the end of the paper.

2) A 3.5 Å cutoff is far too limited and ignores long-range electrostatics. Our own work addressing the same problem (which also introduced the notion of opportunism/compatibility) found signals for some "sloppy" evolved compatibility but only if we moved to longer ranges (PMID 26884163). The authors should re-evaluate their energetic analysis using longer-range cutoffs. To avoid greatly complicating the analysis, longer ranges could be done only with charged side chains. It was also very curious to omit main chain interactions, something which the authors might want to work back in (see PMID 17041605).

3) The authors should really address the question of how thymic education influences what we see. For example, we recently published a TCR that binds with an outlier geometry (not reverse) which signals just fine – an example of a class-mismatched TCR (emerged from a CD4+ T cell but binds a class I). This TCR is a bit weird in that it has an unusually long CDR3b loop that contacts both peptide and MHC (point 1 again). We also concluded that this is a weird TCR that somehow escaped normal thymic selection, implying that maybe the pre-selection repertoire has TCRs that bind crazily and one role of thymic selection is to filter these, giving us TCRs that are somehow "better" biologically (maybe they signal better, or possess lower x-reactivity, etc.). The authors need to work this thinking in. Relevant papers are PMID 36424374 and PMID 30833553.

4) The authors use "compatibility" and "opportunistic" to describe TCR binding from a biophysical perspective, contrasting this with the hard-coded model. These are not new concepts though, and although the authors have greatly expanded on the topic (albeit with the limitations above), they should make note of this. They do reference some of the appropriate literature, but clarifying how they are expanding on the topic would strengthen the impact of the work.

[Editors’ note: further revisions were suggested and these were then sufficiently addressed prior to acceptance, as described below.]

Thank you for resubmitting your work entitled "Conserved Biophysical Compatibility Among the Highly Variable Germline-Encoded Regions Shapes TCR-MHC Interactions" for further consideration by eLife. Your revised article has been evaluated by Tadatsugu Taniguchi (Senior Editor) and a Reviewing Editor.

The manuscript has been improved but there are some remaining issues that need to be addressed, as outlined below:

Essential revisions:

As you can see from the report, the reviewers appreciate the changes done for revision. After an extensive discussion, the overall consensus of the reviewers is that while the concept of evolved biophysical compatibility is possible and a potential solution to the question of how TCRs could be biased towards MHC proteins given the massive diversity in both receptor and ligand, it is a concept that is exceptionally difficult to demonstrate and the paper still has some wishful thinking. For this manuscript to move forward, we request that you tone down the paper, remove the claims highlighted by reviewer #1, and present the concept as an interesting possibility for which some evidence is offered but no solid proof (see report from reviewer #1 for details).

We also had a discussion with regards to the suggestion of reviewer #2 to perform a similar analysis on BCRs to verify that the signal is not spurious. We acknowledge that this might be beyond the scope of the current paper. However, if the authors chose to do this analysis, it can help solidify some of the claims.

Reviewer #1 (Recommendations for the authors):

I recognize the time and effort that the authors have invested in responding to the reviews of the first version of the manuscript. It is appreciated that they recognized the circularity of the original Figure 5 and removed it, adjusted the distance thresholds and sequence-filters for contacts analysis, and that they have also removed references to the origin of self-reactive TCRs.

My concerns with regard to the claims about V-gene interaction potential and determinants of the binding mode still stand, since the relevant text hasn't been modified and the author's responses are not convincing. For example, the detailed analysis of the TRBV7-2 containing complexes provided by the authors in the response appears to disprove the AIMS-based prediction that this gene has low interaction potential: "Certainly PRESTO agrees with these structural interpretations, suggesting CDR2B dominates the germline interactions here, with 13/15 SC-SC contacts." The contorted logic that the authors produce to explain this disconnect doesn't really make sense: "However, yet again we have an abnormally high number of CDR2B backbone-backbone interactions, 14, suggestive of nonspecific tight packing not driven by TCRB specific interactions". What exactly is "nonspecific tight packing"?

The authors also continue to over-sell their findings in the newly introduced text. For example, in describing the new Figure 5, the authors state: "This comparison shows exceptional agreement between our bioinformatic results and structural analyses". But when one compares Figure 5a and 5b, for example, the agreement is pretty dubious. And in 5d, *none* of the differences are significant, and many show the wrong directionality, for example, the median value for "Weak TRBV" is always greater than or equal to the median value for "Moderate TRBV". And in the new text describing the AIMS potential: "The AIMS interaction potential, which can swiftly analyze thousands of sequences, has significantly outperformed more physically detailed and computationally expensive models. In a binary classification of a large database of structurally similar protein complexes, the AIMS interaction potential was capable of distinguishing binders and non-binders to an accuracy of 80%, whereas calculations run on over 45µs of simulated all atom trajectories could only distinguish to an accuracy of 50%. " I looked back at this reference, and what the authors neglect to mention is that the 80% performance comes from a highly parameterized model based on a linear discriminant analysis fitting a weight for each pair of residues in the interface-- it's not at all analogous to the calculation here in which AIMS scores are directly summed up. It's also a single family of interacting proteins.

Reviewer #2 (Recommendations for the authors):

With regards to the manuscript in general, in some places, the authors seem to want to have their cake and eat it too. Particularly, the idea that TCRs are evolutionarily biased to recognize MHC, included stating support for the "codon model" while at others suggesting that CDR1s and CDR2s have only minimal (complementary) roles in binding. With the extension suggesting that some TRAVs and TRBVs have no (or very minimal) MHC/HLA binding potential. This later argument would suggest that antibodies, fully capable of creating diverse CDR3s, should similarly have a (modest, strong) ability to bind pMHC ligands. I suppose a computational test of the general idea the authors are putting forward would be to use their AIMs platform with human antibody CDR1s and CDR2s to see if these were all net no-binding or negative binding with MHC. However, I do not like the idea of bringing up additional questions/tests of the model during a re-review.

eLife. 2023 Oct 20;12:e90681. doi: 10.7554/eLife.90681.sa2

Author response


[Editors’ note: the authors resubmitted a revised version of the paper for consideration. What follows is the authors’ response to the first round of review.]

Comments to the Authors:

We are sorry to say that, after consultation with the reviewers, we have decided that this work will not be considered further for publication by eLife.

All reviewers agree that this study addresses an important topic, namely the sequence determinants of TCR-MHC binding modes. The sequence analysis in the study illustrates that the diversity of CDR loops and MHC contact surfaces is likely incompatible with hard-wired interaction motifs. However, the reviewers argue that the subsequent claims about the true origins of TCR:MHC docking orientations, and speculation about the origins of self-reactive TCRs, are based on flawed and unconvincing analyses. The reviews provide detailed suggestions as to how to improve the analyses to test the claims. We believe the substantial steps needed to address these reviews go beyond the scope of this manuscript but if the authors decide to expand on these suggestions, they can submit the manuscript as a new submission.

While we will go through the reviewer comments point-by-point, we believe it would be helpful to summarize our most important changes beforehand, and reference these throughout the point-by-point comments. The concerns of the reviewers were largely focused on similar features of the first submission of this manuscript.

Issue 1: The AIMS interaction matrix is untested, arbitrary, or has not been sufficiently compared to other methods in the literature.

To address the relatively arbitrary assignment of absolute values in the AIMS interaction matrix, the analysis has been repeated with a 3-value matrix, which we will refer to as V0. Interactions are either deemed negative (-1), neutral (0), or positive (+1). Due to the large number of supplemental figures already included, we include these V0 figures in the end of this review (Author response images 1-4). We find that overall, our observations remain the same regardless of the interaction matrix used (V0 or the original matrix, which we will refer to as V2). This is in line with previous work taking a similar interaction potential approach, where the results are largely unchanged by minute differences in the potential used [Kosmrlj et al. PNAS 2008. PMID: 18946038].

Author response image 1. Class I Interaction Scoring with v0 Matrix (Compare to Figure 4).

Author response image 1.

Author response image 2. Class IIa Interaction Scoring matrix with V0 scoring (Compare to Figure S8A).

Author response image 2.

Author response image 3. Class IIb interaction scoring matrix with V0 scoring (Compare to Figure S8B).

Author response image 3.

Author response image 4. The V0 scoring matrix (for direct comparison with Supplemental Figure 9A).

Author response image 4.

In addition to the binarized form of the matrix, it should be noted that the AIMS interaction matrix significantly outperforms methods that attempt to capture more details of the interactions. Specifically, looking at the ability of various algorithms to predict interacting or non-interacting molecules (Figures 7, 8, 9, and 10 in the cited Nandigrami et al. manuscript) AIMS distinguishes between known binders or non-binders with a significantly higher accuracy compared to calculations based on all-atom molecular dynamics simulations starting from crystals or modelled structures. In other words, the software outperforms more physically detailed models in predicting protein-protein interactions, the exact problem we are interested in at present.

A paragraph dedicated to the high performance of the AIMS interaction matrix approach is now included in the main text, lines 212-221:

“The AIMS interaction potential, which can swiftly analyze thousands of sequences, has significantly outperformed more physically detailed and computationally expensive models. In a binary classification of a large database of structurally similar protein complexes, the AIMS interaction potential was capable of distinguishing binders and non-binders to an accuracy of 80%, whereas calculations run on over 45us of simulated all-atom trajectories could only distinguish to an accuracy of 50%. While not as biophysically descriptive as methods such as alchemical free energy perturbation [Gumbart 2013a] or potential of mean force-based calculations [Gumbart 2013b], the AIMS interaction potential generates accurate predictions for problems that are intractable with current limitations to computation due to the number of protein complexes of interest.”

Issue 2: Closely related to Issue 1, the scoring of alanine and glycine interactions as “0” in the interaction matrix was largely deemed incorrect by the reviewers, due to the ability of these amino acids to be involved in “tight packing” hydrophobic interactions, or as hydrogen bond partners using backbone atoms.

In this response, we will discuss only the side chain interactions of glycine and alanine. For a discussion on backbone hydrogen bonding (with sidechains or other backbones), see issue/response 5.

The decision to refer to alanine and glycine interactions as “0” in the matrix is largely due to their lack of sidechain hydrogen-bonding capability and relatively limited (de)solvation penalty. With their minimal sidechains, the energetic benefit of a hydrophobic interaction is likewise minimal. Whether one considers the hydrophobic effect as driven by ordered waters or disruption of water-water hydrogen bonds, the smaller hydrophobic volume of Ala and Gly will have a more limited entropic or enthalpic effect. The smaller the hydrophobic volume, the smaller the effect of the singular hydrophobic molecule [Chandler Nature Insight Review 2005. PMID: 16193038].

We further quantitatively confirm that such interactions are rare in TCR:pMHC complexes crystallized thus far (see new Figure 5). Of note, this new figure appears to show 1. That, in fact, glycine and alanine rarely make sidechain-sidechain (SC-SC) contacts and 2. That the qualitative agreement between the AIMS interaction potential and these counted contacts further supports the use of the interaction potential in this study (see issue/response 1). It is important to note these figures are generated using the new structural cutoffs discussed in issue/response 3.

There is an exception to the lack of SC-SC interactions involving Ala or Gly, with the only enriched interaction coming from Tyr-Ala interactions. However, it is important to note that such interactions have been the center of intense study [Feng et al. Nat. Immuno 2007; Garcia et al. Nat Immuno 2008; and others] and may potentially be biasing the PDB. Further, while this interaction may genuinely be important for immune recognition, not every TRAV/TRBV gene includes tyrosine in the CDR loops. 9/45 TRAV and 18/48 TRBV alleles do not contain a single tyrosine.

Upon further consideration of these “tight hydrophobic packings” that have been observed between Tyrosine and Alanine, it is important to note that such packing (as in the “knob-in-hole” interaction) is unlikely to be long-lived in many structures. Side chains are inherently motile, and shifting of these side chains is likely to occur over the course of the formation of an interaction interface. More stable are hydrogen bonds, charged interactions, and stronger hydrophobic interactions.

To support this dynamic interpretation of side chain interactions, we now include a paragraph in the discussion dedicated to a truly dynamic interpretation of TCR-pMHC interactions. We note that in triplicate all-atom molecular dynamics trajectories of PDB 1FYT, the tyrosine-alanine “tight packing” lasts only between 10-20ns across these triplicate trajectories (Figure 9, Supplemental Figure S14), suggesting again that this interaction is less key to the interface, and more an opportunistic placement for this side chain. We further include new text in the discussion focused on how such a dynamic interpretation has been considered previously, and what these new results mean for TCR-pMHC interactions.

Issue 3: The cutoffs used in the analysis of previously published structures were improperly estimated, and the consideration of only “productive” contacts artificially boosted the agreement between the AIMS scoring and structural data.

The structure parser suggestions have now been implemented per the comments of Reviewers 1 and 3, with hydrophobic interactions of 4.5Å, charged interactions of 6Å, and a more permissive definition of “productive” interactions (i.e. C-C packing interactions between hydrophobic and hydrophilic residues counted, O-O hydrogen bonds allowed if Ser, Tyr, and Thr are involved, N-N allowed if His involved). We also now include all interactions with the protein backbone, and discuss these interactions more in the text.

We agree with reviewer 1 that upon re-inspection of Figure 5 and the way a “productive contact” was defined, the original structural validation can be seen as somewhat circular. As such, we have removed the original figure 5 and instead replaced it with results that:

1. Further validate the form of the AIMS interaction matrix itself (panels A, B) and

2. Provide a more robust, quantitative structural validation of the AIMS interaction matrix (panels C, D).

3. Issues regarding the normalization between groups and the over/underrepresentation of certain weak or strong binders have also been addressed, with more robust statistical tests included to determine significance in differences between groups, rather than simple bar plots.

Issue 4: The treatment of the TCR:pMHC interaction as mediated exclusively by germline-germline or CDR3-peptide interactions does not reflect the reality of the interface. CDR3 can frequently contact germline regions, and germline CDR loops can frequently contact peptide.

Originally these statements were written from the theoretical sense “it is useful to approximate this interaction as one between germline-encoded regions or hypervariable regions”. This is obviously not an accurate reflection of reality. However, upon re-reading the manuscript with the reviewers’ comments in mind, we find that our intent was not clearly reflected in the text.

We have significantly updated the abstract and main text to more properly reflect our assessment of these interactions. It is important to note, however, that our analysis still explicitly ignores CDR3 and peptide interactions that would be well beyond the scope of the current manuscript. Our goal here is to consider the TCR-pMHC interface in a reductionist approach and consider just the regions that are unchanging across all complexes. In almost all structures solved thus far, the germline CDR1/2 loops interact with the MHC α helices. So, our goal is to determine rules for how might happen for the “average” TCR-pMHC complex, while realizing that there will be strong deviations from this average complex. Hence why we make a point to discuss these outliers at length (lines 34-45):

“Importantly, previous work has found a large list of deviations from these classic "rules of engagement". The hypervariable CDR3 residues can dominate the interactions with the germline-encoded MHC α-helices [Piepenbrink 2013, Singh 2022], germline encoded CDRs can interact strongly with peptide [Piepenbrink 2013], an exceptionally long peptide can "bulge" causing separation between germline regions [Tynan 2005], or the docking orientation can even be entirely reversed [Gras 2016, Zareie 2021]. When considering the large number of possible TCR-pMHC interactions and the substantial cross reactivity of TCRs [Riley 2018, Sewell 2012], these historically non-canonical interactions may in fact be rather common.”

Issue 5: The analysis presented in this manuscript, specifically the AIMS interaction matrix, does not account for various structural features, including shape complementarity, backbone interactions, and relative solvation/desolvation of certain sidechains.

We understand and appreciate the vast structural and biochemical literature that has contributed to our understanding of TCR-pMHC interactions thus far. A complete understanding of how a TCR discriminates between self, non-self, or altered-self peptides will require understanding the precise contributions of these structural features, and some not mentioned by the reviewers (catch bonds, dwell time, dynamic matching, etc). Unfortunately, the explicit incorporation of such structural, energetic, and dynamic features is outside of the scope of the AIMS analysis, and to our knowledge, well beyond the abilities of any modeling approach. We now explicitly address what our manuscript does and does not attempt to do in the discussion (lines 511-528) and elaborate further below:

“The ideal approach for studying TCR-pMHC interactions would involve generating a comprehensive set of crystallized structures, exhaustive biochemical experiments to pinpoint contributions to binding affinity and kinetics, and activation assays to thoroughly understand the nuances that underlie complex formation. While such thorough efforts have been undertaken to understand structural strategies of binding to HLA-A2 [Blevins 2016], the potential evolutionary conservation of TRBV8-2 in binding MHC molecules [Scott-Browne 2009, Scott-Browne 2011, Garcia 2012, Feng 2007], and the by residue contributions of binding of the A6 TCR [Piepenbrink2013], the diversity inherent to the TCR-pMHC interaction makes such efforts impossible to scale across all possible binding partners.

The work presented here cannot replace these comprehensive experimental techniques. However, it can provide a good first estimate of how well given TCR-MHC pairs may bind. Absent rich experimental data on major parts of the TCR and MHC repertoire space, can we attempt to approximate how a fictitious TCR-MHC interaction would occur absent peptide and CDR3? Comparisons of our computational results to experiment suggest that yes, in fact, we can generate some strong approximations to build off of, with clear deviations from these predictions largely driven by outlier structures. As we continue to build these interaction potentials and the AIMS software as a whole, we hope to continually add modular improvements to consider how these initial germline interaction assumptions are altered by peptide and CDR3 to build more predictive tools for interactions and binding.”

In short, crystallography and biochemistry are the gold standard for understanding the many of nuances of TCR-pMHC interactions. Structural modeling could provide insights, but thus far has proven unreliable for adaptive immune interactions [Evans et al. 2022 https://doi.org/10.1101/2021.10.04.463034]. Likewise, structure-free machine learning approaches have largely failed to be predictive outside of narrow parameter spaces [Montemurro et al. 2021. PMID: 34508155; Jokinen et al. 2022. PMID: 36477794; Meysman et al. 2023. https://doi.org/10.1016/j.immuno.2023.100024 ]. Our goal is to explore how well a reductionist model that encodes some degree of physical realism can generate explanations for experimental observations made thus far.

Inclusion of phenomena such as specific sidechain-main chain interactions or shape complementarity would imply knowledge of the structures of interest, which is grossly overestimating the scope of our knowledge of these interactions thus far. Referring specifically to the percentages of complex space crystallized to date (lines 70-78), we simply don’t have the data to extrapolate out to all possible complexes. Absent these data, we would need to generate strong assumptions about the presumed structural interactions between the TCR and the MHC, which are going to be strongly influenced by the CDR3, the peptide, the TRAV/TRBV pairing, and the MHC involved in the interaction.

Despite the lack of inherently structure-dependent interactions in AIMS, the newest version of the manuscript now more explicitly counts SC-backbone interactions in our structural analysis (Supplemental Figure S10). While we could potentially generate an empirical SC-backbone interaction matrix from these values, we find that the contact maps are too strongly biased by the structures crystallized thus far.

Reviewer #1 (Recommendations for the authors):

The authors investigate the origins of TCR:MHC docking orientation using information-theoretic sequence analysis simplified biophysical scoring, and inter-atomic contact analysis of solved TCR:pMHC ternary complexes. First, the authors show that the TCR CDR loops are more variable in sequence and in biophysical properties than the surface-exposed regions of the MHC. They conclude that "This mismatched diversity between the TCR germline-encoded CDR loops and the MHC α-helices suggests that conserved germline-encoded interactions are unlikely to exist for every possible molecular combination". Though not conclusive, this is consistent with the observed variability in the solved ternary structure databases, which show smoothly varying binding orientations rather than discrete recurring binding solutions. The authors also claim to see very little mutual information between TCR and MHC sequence positions, but they appear to be matching them up randomly (rather than using established TCR:MHC pairings from epitope-specific TCRs, for example, or TCRs from HLA-typed individuals), so it's not clear how this analysis could possibly find any covariation.

1A.The heart of the study relies on a simplified 20x20 amino acid interaction matrix that is meant to capture basic biophysical interaction propensities. The sign of the values in the matrix is chosen to accord with intuition (opposite charges are favorable, like charges are unfavorable, etc), but the absolute values of the matrix values seem pretty arbitrary (all either 0, 0.5, 1, or 2).

See response 1.

1B. All matrix values for alanine and glycine are zero, despite their frequent involvement in tight hydrophobic packing interactions.

See response 2.

1C. The core calculation is to take all the residues in a given CDR loop (regardless of orientation: pointing toward MHC or toward the core of the TCR), and look up the interaction matrix scores for all surface residues (or maybe even all residues, period, it's hard to tell) of an MHC molecule, and sum up all the interaction scores. This single number (averaged over all HLA alleles) then reports the "interaction propensity" for that CDR1 loop sequence; if it's negative, then the loop/V gene has "severely limited interaction potential with HLA molecules". Despite the obvious problems with this – that the matrix is crude and arbitrary, that the sum involves many pairs of residues that couldn't possibly interact, etc, etc – the authors take these summed interaction scores as the basis for subsequent conclusions.

Due to multiple confusions regarding the calculation of the interaction scoring, a more precise description has been provided in the methods (lines 604-614). We apologize that the initial explanations were not sufficiently clear.

Regarding the “arbitrariness” of the matrix, see response 1.

Lastly, regarding the pairs of residues that couldn’t possibly interact, the software is capable of extending or limiting the scope of the amino acids involved in the calculation. In the main text, the entirety of the TCR-accessible residues on both MHC α-helices are included in the calculation, to reflect the fact that, a priori, we don’t have a reason to expect any given TCR to bind in the “canonical” conformation. However, including just amino acids on the “proper” α helix does not strongly change the calculations (Author response image 5).

Author response image 5. By-gene interaction scores with “proper” helix interactions (i.e. TRAV interactions with Class I alpha2 helix, TRBV interactions with Class I alpha1 helix).

Author response image 5.

2. For example, Figure 4 shows that TRBV7-2 and 7-3 have limited interaction potential (which appears to be related to them having glycine and alanine in their loops) with class I MHC; this finding is linked by the authors to the fact that these V genes are enriched in certain epitope-specific responses in celiac disease and multiple sclerosis, despite these enrichments being found in CD4 T cells. I looked at several TRBV7-2/7-3 containing ternary complexes (4mji, 5eu6, 5d2l, 4grl, 4ozh) and in fact, the TRBV7 segments are making extensive MHC contacts, dominating the TRAV segments in every case (4grl is a great example). It seems doubtful that the interaction scores derived from all pairwise residue matrix values are telling us anything about the intrinsic binding properties of the TCR V genes.

We thank the reviewer for pointing out the mistake made in the text. We were well aware that the TRBV7 enrichments were found in CD4+ T cells, and instead meant to point readers to the interaction matrix with Class II MHC found in Supplemental Figure S8. This has now been fixed in the text.

We hope that our previous responses to reviewers clear up what the interaction scoring matrix is telling us about the intrinsic binding properties of the TCR V-genes. Further, we greatly appreciate the list of specific PDBs to examine to back up our claims to an even greater extent. We can go through point by point and discuss the binding mechanisms of these example PDBs using structural visualization and the PRESTO software with new interaction cutoff settings.

5EU6 [Altered Self Antigen] – At first glance, CDR2B does appear to dominate the interface [17/26 SC-SC contacts], although these appear to simply be an artifact due to tight packing of CDR2B, which makes 8 backbone-backbone contacts according to our new, permissive interaction cutoffs. This is far above the median number of backbone backbone contacts in our analysis (see Figure 5D). A closer inspection of the structure suggests this tight packing is a due to CDR3B dominating the interface, both with peptide and with MHC. This in turn forces the germline CDR loops into closer contact with MHC. Details of the contacts made by CDR2B confirm this loop is unlikely responsible for tight packing, as the majority of contacts involve nonspecific packing interactions between hydrophobic and hydrophilic residues near the edge of the interaction cutoff [all above 4Å, near the more generous packing cutoff]. More specific interactions (salt bridges) are formed between TCRB and MHC, but these are TCR framework interactions, again due to the biased docking angle generated by CDR3B.

5D2L [CMV Antigen] – Not dominated by TCRB, only 8/36 SC-SC contacts made by TCRB. There are some interactions between CDR2B and MHC sidechains and backbone atoms, but these are limited. Further, these non-sidechain interactions are not meant to be covered by the AIMS interaction potential, as discussed elsewhere in the manuscript and in these review responses. Further, we should expect by the AIMS interaction potential that TRAV contributes just slightly more contacts than TRBV, as TRAV24 is likewise binned on the lowest end of the “moderately interacting” TRAV genes. We would predict, as we find here, that CDR3 would need to dominate the interface.

4MJI [HIV Antigen] – Not dominated by TCRB, only 16/45 SC-SC contacts made by TCRB. Of these 16, 10 are nonspecific packing C-C interactions between hydrophilic amino acids. Again, the dominance of TCRA is consistent with the predictive power of the AIMS interaction potential, as TRAV17 is a predicted strong binder. Indeed, we see multiple strong, specific interactions [ILE-LEU hydrophobic interaction, THR-ARG Hbond, ASN-GLN Hbond, ARG-GLU Salt Bridge, ARG-GLN Hbond, ASN-ARG Hbond]. Suggesting the AIMS interaction potential’s exceptional ability to provide insights into the intrinsic binding properties of TCR V genes.

40ZH [Celiac Autoimmune] – While a cursory look at the structure or the PRESTO structure parser may suggest a strong involvement of TCRB [10/23 SC-SC contacts], the original study provides further context [PMID 24777060]. The authors find that while there is skewed TRBV7-2 usage in DQ2.5-glia-α2 reactive TCRs, CDR1B and CDR2B only contribute a combined 14% to the overall buried surface area. Further, mutagenesis of what appear to be key contacting residues in CDR1B and CDR2B were insufficient to abrogate binding. Contrast this with mutations in TRAV germline regions or CDR3 loops, which did result in undetectable binding. Consistent with TRBV7-2 as an inherently weak interacting germline gene.

4GRL [MS Autoimmune] – Certainly PRESTO agrees with these structural interpretations, suggesting CDR2B dominates the germline interactions here, with 13/15 SC-SC contacts. However, yet again we have an abnormally high number of CDR2B backbone-backbone interactions, 14, suggestive of nonspecific tight packing not driven by TCRB specific interactions. Indeed, the original study [PMID 24136005] suggests that the titular dominating “single loop” is CDR3A. Suggesting that the CDR2B contacts are essentially bystanders in the binding process that happen to make contact with MHC due to the strong docking angle enforced by CDR3A.

Each of these structures offer important lessons that have been highlighted both throughout the manuscript and throughout this response to reviewers.

1. The CDR3 loops are capable of dominating interactions, bypassing every other “rule” imposed in this and other papers. In multiple cases, these CDR3-dominated interactions occur in the context of autoimmune events.

2. In considering a given TCR-pMHC complex, a distinction should likely be made between “contacts” and “interactions”, akin to the original PRESTO analysis that distinguished between hydrophobic-hydrophilic and hydrophobic-hydrophobic carboncarbon interactions. In the former (hydrophobic-phillic) case, which could be referred to as a simple “contact” there exists some VDW contribution to the binding energy, but potentially not a large enough contribution to overcome the de-solvation penalty of the hydrophilic residue. In the latter (hydrophobic-phobic) case, there is no such desolvation penalty for the hydrophobic residues, and this interaction can contribute strongly to the overall interface.

In the case of PDBs 40ZH and 4GRL, we see many such “contacts” made between MHC and TRBV7-2, but as is backed up by mutagenesis studies, these contacts contribute little to the overall binding free energy. Consistent with what the AIMS interaction potential suggests the intrinsic binding properties of TRBV7-2 should be.

3. Next is a section entitled "Structural Data Validate Interaction Scores", in which they analyze atomic contacts in ternary complexes. Figure 5A certainly looks impressive at first glance, with tall bars for "predicted binders" and short or non-existent bars for "predicted NonBinders". But the problem is that there is no correction for the number of "nonbinder" V genes, and for example for CDR1A there only appear to be only 2 or 3 (Figure 4B), which may or may not have contributed to the database of solved structures. Thus the preponderance of observed contacts coming from "predicted binders" could just be due to the structural database composition, with binder and non-binder V genes making interactions at the same rate. The other problem with this analysis is that the contact analysis itself is flawed: the distance threshold is too small for hydrophobic interactions (4.5A would be better); there are too few total contacts being found (average of 1.35 per structure) the atom types included (referring here to the jupyter notebook https://github.com/ctboughter/PRESTO/blob/main/AIMS_interact_compare.ipy nb) don't look right, since oxygen-oxygen and nitrogen-nitrogen can both form an Hbond donor-acceptor pair, and there's no evidence that hydrogens are being added to the structure; and the rules for counting "productive" contacts are too prescriptive (no carbon-carbon hydrophobic contacts allowed between polar or charged residues, even arg and lys with their long side chains). This latter has the consequence that the comparison to interaction scores becomes a little circular because the contact counting is driven by the same simplified biochemical intuition embodied in the pairwise interaction matrix. Much better would be to combine unbiased contact analysis (including backbone atoms) with an orthogonal measure such as buried surface area, and then look to see if predicted non-binder V genes really do make fewer interactions with MHC.

See response 3.

4. The remainder of the manuscript uses these interaction-matrix sums to investigate the determinants of the TCR:MHC docking mode. This is just not convincing, for the reasons outlined above, and also because there appear to be logical inconsistencies here. The concept is that MHC surfaces of "low interaction potential" (ie, alanine and glycine) define guardrails that limit the binding mode. Figure 8E has a nice cartoon showing the central ala/gly region in the class I alpha2 helix. The problem is that there are actually contacts throughout and on both sides of that "guardrail", which can be seen from Figure 7C, lower panel (161,164,165) or from a cursory examination of a few ternary complex structures. It's also not clear why, for class I α helix 2, MHC positions 143 and 144 have such low interaction scores (Figure 7C, upper panel) when in the alignment in Figure 8C those positions look similar to other R/K-containing positions.

We hope that we have largely addressed the “reasons outlined above” regarding how convincing our use and validation of the interaction matrix is.

We thank the author for their comments regarding Figure 8. The cartoon has been changed to more accurately reflect how the TCRs lay over the MHC, which is not as some singular shape laying over the surface, but rather as distinct loops contacting distinct portions of the MHC surface. These distinct loops reflect the results of Figure 7, but also were checked structurally (Author response image 6). Changes have also been made in the text to reflect that of course deviations to this general rule can be made. We just choose to show what is likely the most optimal configurational arrangement.

Author response image 6. Structural information used to generate the cartoons of Figure 8.

Author response image 6.

Overlay of a range of class I TCR-MHC structures with strong, moderate, and weak TRAV/TRBV AIMS-predicted binding propensity. While there is variation in the precise location of the CDR loops, they typically occupy a similar space over the class I MHC surface (colored to match the class I MHC in Figure 8E). We highlight with a dashed red circle where CDR loops tend to avoid docking directly over, likely due to the region of low interaction potential.

5. On the positive side, the authors make their analysis scripts and notebooks very easily accessible, which is a big plus for reproducibility and transparency.

We thank the reviewer for taking the time to go through the analysis scripts and notebooks. We hope that the changes we have made (with the help of the reviewer) will make the scripts and notebooks even more useful for the research community.

A few additional comments:

6. "The exposed residues on the α2-helix of HLA class I molecules are enriched in alanine and glycine relative to the α1- helix, which is highly unlikely to be involved in a specific, orientation-altering productive interaction" – alanine and glycine can be involved in highly specific packing interactions. Glycine, for example, can create pockets into which other side chains fit.

See response 2.

7. "Every crystallized TCR-HLA class II complex solved thus far adopts the canonical docking orientation whereby the TCR β-chain binds to the HLA α-chain helix, while the TCR α-chain binds to the HLA β-chain helix" – this is not correct, see 4y19 and 4y1a from the Rossjohn group.

We appreciate the correction. This has been updated in the text.

8. "obviating the need for a more precise approach" – do you mean "highlighting"?

Yes, we have corrected this now.

9. This part of the methods is super-confusing (and I couldn't find it in the code): "Further, given that any single pair of amino acids on adjacent interfaces of protein binding partners can potentially form strong interactions without being meaningful for the formation of a given complex, we require that any productive interaction include a triad of at least weakly interacting residues".

We have changed the methods to hopefully clarify this confusion, and refer the reviewer to the updated methods section mentioned earlier in this response.

10. As mentioned above, the whole mutual information analysis seems bonkers. How could there be any mutual information if the pairing between TCR and MHC is random/arbitrary? Please explain this part better:

"…every TCR should interact with every HLA allele. Humans largely possess the same TRAV and TRBV alleles, but each individual possesses a maximum of 12 HLA alleles. We expect that specific alleles that are unable to enforce the supposed evolutionary rules for canonical docking will not be allowed to persist in the population. Continuing from this assumption we then subsample the data and calculate the mutual information on this subsampled dataset. Each TRAV and TRBV allele (the input) is matched with a single HLA allele (the output), and the mutual information is calculated for these pairings".

We have now calculated this mutual information for crystallized complexes. However, the PDB must be considered a strongly biased source for these calculations. Of the 140 crystallized human class I structures, only 68 of these are unique in their

TRAV/TRBV/HLA usage. Further, as many as 91/140 involve HLA-A*02:01. All of these could potentially alter the mutual information in unpredictable ways that are not at all indicative of how these molecules were evolved.

Despite these caveats, new calculations of the mutual information using only those structures found in the PDB suggest that our initial approach to calculating the mutual information was accurate (Supplemental Figure S4). We see similar trends in the mutual information between CDR loops and the MHC α-helices, with no clear increase in information for interacting regions (TCRA-alpha2 and TCRB-alpha1). Instead, we see higher mutual information between the TRAV-TRBV pairings than TRAV-MHC or TRBVMHC.

Reviewer #2 (Recommendations for the authors):

The authors take an all-encompassing computational approach to analyzing TCR CDR – MHC interactions with the goal of identifying repetitive use of complementary protein-protein interaction events. On a first pass, there does not appear to be a significant contribution (to the T cell repertoire) of truly conserved pairwise interactions that drive MHC restriction. In contrast, their 'whole repertoire-wide approach' strongly supports the general concept that TCRs find opportunistic ways to bind pMHC using biochemically similar interactions.

1. First, I want to state that I really enjoyed reading this paper. I think it is written very well, which is quite important for papers on this topic as it can be a struggle even for seasoned immunologists to comprehend how there might be 'rules of engagement' when both the TCR and MHC/HLA are highly variable proteins. My comments will largely focus on issues that may help the authors provide the readers with a better understanding of the background and what their program does, and does not do. I will use statements within the manuscript to highlight these challenges.

We thank the reviewer for these encouraging comments.

2. In the abstract, "The formation of the TCR-peptide-MHC complex (TCR-pMHC) can be broken into two types of interactions, one between the hypervariable TCR CDR3α/β loops and the presented peptide and the second between germline-encoded regions of the TCR and MHC. "

– This is not an accurate statement. There are significant interactions between the CDR3 and MHC, as well as CDR1 and peptides. E.g., CDR1a often engages p-1 and p2 peptide residues, CDR3b almost always engages at some level, MHC-IIa61 area, and CDR3a with MHC-IIb 60area. Within the manuscript, the authors back off a bit from their hyper-simplistic statement, however, having such a blunt untrue statement in the abstract is not reasonable.

See response 4.

3. "Instead, binding properties such as the docking orientation is defined by regions of biophysical compatibility between these loops and the MHC surface."

– The authors spend a lot of effort working through certain variables that contribute to the binding reaction. I am wondering if the authors took account of shape complementarity (e.g., PMID: 9628472) and CDR loops that carry different types of conserved canonical structures (e.g., PMID: 10656805). One could imagine that based on the protein folding requirements of CDR regions, certain residues are in the interface whereas others are internal to the CDR structure and cannot actually contribute directly to binding.

See response 5.

4. "We selected a key hydrogen bonding network in the KIR2DL2-HLA-C*07:02 interface [50] and compared this to the evolutionarily conserved YXY motif of CDR2β [19, 21]"

– This is a good example to discuss the point above. it is important to know structurally, where each residue is. For example, the first Y (46 or 48 depending upon the nomenclature, above) often does not directly contribute to pMHC binding but may be important for the "outline structure" of the CDR loop itself. In addition, the authors do not discuss Van der Waals interactions really at all. Much of the TCR-pMHC interface (binding affinity) is driven by the exclusion of water, a property that is very difficult to assess on an amino acid-amino acid pairwise allotment of interaction energy. I was hoping that once the authors started to discuss "areas of binding potential" the contribution of non-side chain to side chain interactions would be discussed. It is unclear to this reviewer if these types of interactions are accounted for within their algorithm or if they are largely ignored.

See response 5.

Diving into this a bit more, this section was explicitly focused on debunking the concept of “conserved contact regions” where TCRs might be expected to frequently contact the same regions of the MHC molecule. The biophysical property analysis and sequence based analysis of Figure 3 suggests such rigidity in binding modes is unlikely. So, while one or the other Tyr may be involved in interacting with the MHC molecule, our main point is to say that we cannot know, a priori, precisely how these sidechains are arranged.

5. In discussing the interaction potential, of amino acids, the authors cite and discuss a single manuscript.

42. P. Nandigrami, F. Szczepaniak, C.T. Boughter, F. Dehez, C. Chipot, and B. Roux. Computational assessment of protein-protein binding specificity within a family of synaptic surface receptors. Journal of Physical Chemistry B, 2022.

There is of course an empirical and computational field of study for how proteins bind one another as well as for TCRs and pMHC (e.g., PMID: 10410805, PMID: 16193038, PMID: 18946038, PMID: 27348411). Some more inclusive discussion of past ideas about how proteins interact with one another and whether old ideas remain accurate could add to the overall discussion.

See response 1. We have also attempted to contextualize our results with previous studies in the discussion.

Regarding the citations listed, given the employment of the CHARMM force field in this newest version of the manuscript, we are aware of the exceptional literature focused on the empirical and computational study of protein binding. It is through our familiarity with this literature that we have sought to expand upon what has been done previously.

Again, in our eyes the ideal study would start entirely from crystal structures and simulate these structures using these empirically- and theoretically-derived force fields, and generate experimental predictions based upon these results. However, given the scale of the problem of interest of this manuscript, we need to reconsider how the problem is approached. We believe that the AIMS pseudo-structural approach is a complementary tool to these more explicit structural analyses.

6. "Figure 4: Interaction score between every TRBV (A) or TRAV (B) sequence and HLA allele for all four germline-encoded CDR loops. "

– Why are alanine and glycines assumed to be zero/non-interacting? Does a binding reaction care if a contact is a side chain-side chain, backbone-backbone, or mix? Indeed, when the authors "counted the contacts" I assume many of the side chains were indeed interacting with backbone atoms. It has also been suggested that some side chains can contribute negatively to interfaces (e.g., PMID: 17041605). Another question, perhaps for the algorithm used, does it take into account the frequency at which say X and Y amino acids actually occur at a possible site of interactions.

See response 2.

Regarding the final question of amino acid frequency, the algorithm does not take this into account. The hope is that the AIMS interaction potential can provide unbiased estimates of CDR interaction propensities, allowing users to input mutated CDR loops or CDR/MHC sequences from other organisms.

7. It is mentioned that autoimmune-prone T cell repertoires are biased for certain TCR usage, does this bias include matching/non-matching HLA areas of recognition? There was some discussion on this but a clearer picture (if there is one) could be spelled out for the non-expert.

We thank the reviewer for highlighting another area where we can expand upon our thinking in the discussion regarding how our results tie into the greater picture of autoimmunity. Unfortunately, there are too few structures of TCRs with singular autoimmune antigens and TRAV/TRBV usage to make any broad claims about repeated regions of recognition. Further, our results actually predict that these autoimmune TCRs may not have matching contact regions on the HLA surface. Rather, the weaker interacting TRAV/TRBV alleles should encourage an increased dependence on CDR3 involvement.

Instead of adding further speculation regarding how our results may tie into the recognition of autoimmune pMHC complexes, we have added an extra paragraph to the discussion to provide context as to where our analysis is currently incapable of explaining certain patterns of autoimmunity:

“While over-reliance on CDR3 may bias TCRs towards auto- and cross-reactivity, the role of the MHC molecule in autoimmunity remains unclear from these results. In contexts such as celiac disease, a particular allele (HLA-DQ2.5) is enriched in patients with the disease [Qiao 2014, Gunnarsen 2017]. Given that the interaction potentials largely predict similar interaction strengths across HLA molecules (Figures 4, S8) such enrichment cannot yet be explained by AIMS. However, considering that the majority of diversity across HLA alleles is concentrated in the peptide binding regions (Figure 2), these correlations between HLA molecules and disease may largely be related to the peptides presented by these molecules, as has been suggested previously [Ishigaki 2022]. In trying to understand how allelic variation alters peptide presentation, and how this in turn impacts the onset of autoimmunity, the lack of strong rules for binding again complicates the problem. While HLA molecules have amino acid preferences at certain anchor positions, there are many exceptions to these "rules" [Nguyen 2021], and mutations to peptides that should improve stability in the HLA binding pocket can have unintended consequences on T cell activation [Smith 2021]. The substantial diversity of possible presented peptides makes the systematic analysis of this aspect of the autoimmunity problem exceptionally challenging.”

8. The interaction potentials also succeed in predicting TCR complexes that will not make contact with MHC. 20 of the 22 structures predicted to have poor CDR2β binding make no contact with MHC, while the last two only make one contact with MHC (Figure 5C). Further, all 8 structures predicted to have poor CDR1β binding make no contact with MHC. (Figure 5C). Again, this prediction accuracy is lower for class II predictions (Figure 5D).

– This is a super interesting idea that may unlock a lot of what is going on. One wonders how much of this is random chance, i.e., if a different TCR-pMHC with the same V genes and HLA would behave similarly. Also, do these structures preclude (or are driven by) CDR1-peptide contacts, or are the structures carry such a different docking orientation as to completely preclude the CDR1 and CDR2 regions from being part of the binding interface?

We appreciate the excitement of the reviewer, but as reviewer 1 pointed out, our original methods were somewhat flawed. Our original definition of “contacts” was too stringent. However, with these new, more lenient definitions of contacts, we still find that AIMS-identified weak interacting V-gene encoded CDR loops still make fewer contacts than those that AIMS predicts to be strong interactors.

Looking at the Reviewer 1 Comment 2 Response, we can see an entire list of TCR-pMHC complexes that utilize the same V-gene. In some cases, there really is little involvement of the CDR1 and CDR2 loops in the interface. In others, we see that many of these germline “interactions” might be more properly classified as “contacts” that have limited energetic contributions to the interaction interface. So, the AIMS interaction potential may provide less of a prediction of where or how sidechain contacts will form, but more of a prediction of the relative contributions of these contacts. The docking orientations in many cases will likely be dominated by CDR3, especially in the case of weakly interacting V-gene encoded CDR loops.

9. The exposed residues on the α2-helix of HLA class I molecules are enriched in alanine and glycine relative to the α1- helix, which is highly unlikely to be involved in a specific, orientation-altering productive interaction.

- In practice, it is this reviewer's understanding that there are exit contributions of Van der Waals interactions at these sites. Indeed, early ideas suggested that the diagonal area of pMHC (MHCa 61, MHCb73) used this divot for shape complementary purposes.

See response 3

10. It is important to note that these interaction potentials take an unbiased approach, calculating every possible interaction between TCR and MHC residues to produce this final score.

– It was unclear if the authors mean position by position, or did they weigh whether a residue was actually surface exposed and capable of being part of the binding interface.

As discussed in lines 579-587 we take only surface exposed residues of the MHC and the CDR loops of TCRalpha and TCRbeta as defined by IMGT:

“As with all AIMS analyses, the first step is to encode each sequence into an AIMS compatible matrix. In this encoding each amino acid in structurally conserved regions is represented as a number 1-21, with zeros padding gaps between these structurally conserved features. The encoding is straightforward for the TCR sequences, with only the germline encoded regions of the CDR loops included for each gene. For the MHC encoding, only the structurally relevant amino acids are included for optimal alignment of each unique sequence. In this case, the structurally relevant amino acids of the class I (or class II) molecules were divided into three distinct groups; the TCR-exposed residues of the alpha1 (or α) helix, the TCR-exposed residues of the alpha2 (or β) helix, and the peptide-contacting residues of the given MHC.”

11. Productive side-chain interactions between CDR loops and the solvent-exposed residues of the MHC helices.

– There does seem to be an (over) emphasis on side-chain interactions. And less so on the clustered ability for VDW and/or inhibitory interaction.

This is true, and is again due to our structure-free treatment of the interaction. As SCSC interactions are the most common in the interface, we believe this is a good first approximation to understanding how the germline regions of the TCR interact (see Response 5).

12. In general, there are quite a number of T cell development citations with actually very little discussed the role of thymic selection in and/or clonal T cell responses in skewing the TCR-pMHC interface to conform to selective pressures. E.g., TCRs can't be too good/cross-reactive or they would undergo central tolerance.

Unfortunately, given the datasets currently available to us for the analysis of the effects of selection and clonal expansion on repertoire skewing, any of our thoughts on this matter would be purely speculative in nature. We discuss the fantastic work done on the role of selection in shaping the docking angle solely to introduce the concept of “conserved contacts”. Our calculated interaction potentials are assumed to be antigen independent, and act as first approximations to the probable TCR-pMHC interface that is then likely altered by the antigen-CDR3 interaction. We briefly discuss these concepts in the results (Lines 292-304) and the Discussion (Lines 475-481).

13. "In calculating the interaction score, we assume that productive contacts are only made by the side chains of the interacting residues. This simplification does not capture all TCR-pMHC complex contacts, but here we are looking for selectivity enforced by specific TCR-MHC interactions mediated by side-chains."

– Though stated as a caveat, perhaps some effort could be made to include side-chain to the backbone, etc interactions.

In addition to the incorporation of SC-backbone interactions in the parsing of deposited structures, we had initially also hoped to be able to include a backbone scoring function into the AIMS analysis. However, this appears to be beyond the scope of the current study, as the propensity for each sidechain to participate in backbone hydrogen bonding (either as the backbone partner or sidechain partner) is strongly determined by the distribution of the amino acids in either the CDRs or MHC α-helices of structures crystallized thus far.

The ideal backbone interaction scoring matrix would be unbiased, allowing for us to make estimates into the interactions between as yet uncrystallized TCR-MHC pairs. Currently, the Tyr-Ala and Tyr-Gln interactions would dominate the SC-backbone interaction scoring matrix, despite this potentially being a consequence of other, stronger interactions across the interface.

Reviewer #3 (Recommendations for the authors):

Boughter and Meier-Schellersheim describe an analysis of TCRpeptide/MHC complexes, aiming to gain an understanding of the underpinnings of the "common" TCR binding geometry. This is fundamental to understanding the MHC restriction of TCRs and how T cells scan and readout peptides. They begin with a comprehensive bioinformatics approach, move to a structural analysis to help interpret the informatics, and bring in biophysical computations. The overall conclusion that specific contacts between TCR genes and MHC proteins are not necessarily preprogrammed and that traditional TCR binding geometries emerge from biophysical compatibility is supported by the data and consistent with recent findings. In general, the work and the conclusions are an advance and place recent findings into perspective. However, the strength of evidence is weakened by choices made in characterizing structures, computing energies, and a strained reliance on "roles" played the parts of the interface which have been discounted many times yet persist in the literature. The latter in particular weakens the discussion and how the authors view the impact of their work.

The major strength of the paper is the approach taken; I found the comparative analysis of TCR and MHC genetic variability at the sequence level particularly compelling. Bringing in KIRs as a control was also a strong way to support the arguments. There is one major technical weakness in that, as far as is clear from the methods, interatomic interactions were considered with a 3.5 Å cutoff. This is woefully inadequate. Electrostatic interactions can be strong at long distances, which the authors really need to consider – say, going out to 6 Angstroms or so (there is much-published literature on short- and long-range electrostatics in protein interfaces). The importance of long-range electrostatics in TCR-peptide/MHC complexes has been demonstrated previously, particularly in prior work that aimed to address the same problem studied here. The authors also fall victim to the common immunology trope that CDR3-peptide interactions drive specificity, leaving CDR1/CDR2 to bind MHC proteins, i.e., the CDR loops have "roles" in binding. In the very first high-resolution structure of a TCR-peptide/MHC complex, CDR3 interactions with a class I MHC were noted and remarked on, as were CDR1 and CDR2 interactions with the peptide. Later work showed that these CDR3MHC and CDR2-peptide interactions were critical for binding. These findings have been replicated several times now. The authors' introduction of this perspective of different loops of the TCR playing evolved roles (CDR3->peptide, CDR1/2->MHC), and their interpretation of their findings in light of it, weakens the papers' conclusions and impact, and it is a missed opportunity that can be addressed with the authors' approach.

The authors also should consider other literature for a greater impact on their work. For example, they also exclude backbone interactions – this is a curious omission from a biophysical perspective, and others in the field have published on the importance of backbone-mediated interactions (hydrogen bonds mostly) in stabilizing TCR interfaces. The authors also mention but fail to address T cell selection and the role of selection (and possibly coreceptor) in 'enforcing' what we get and have seen structurally (i.e., the idea that pre-selection TCRs bind all over the place, but selection ensures we get ones that bind right and work). Much has been written about this and it should be included.

1) The very first high-resolution crystal structure of a TCR-pMHC complex by Garboczi and Wiley in the 90s (PMID 8906788) showed CDR3 contacts to the MHC and germline CDR1/2 contacts to the MHC. Later biophysical studies by our own group showed these were crucial for binding (PMID 23736024). Other work has shown the same. Thus, although it is common to say that diverse CDR3 loops bind peptide and germlineencoded CDR1/2 loops bind the MHC, this is not supported at the atomic or energetic level. It actually plays INTO the authors' argument about opportunism/compatibility, but curiously the authors do not discuss it. They should. These observations and the idea that "roles" are not hardcoded into the TCR CDR loops play right into the authors' opportunistic argument introduced at the end of the paper.

See response 5. Additionally, we have added this point about the “opportunism” of CDR1/2 binding peptide and CDR3 binding MHC to the discussion, elaborating further on our previous point about these loops needing to adapt to each individual target (as in the case of the super-bulged peptide)

2) A 3.5 Å cutoff is far too limited and ignores long-range electrostatics. Our own work addressing the same problem (which also introduced the notion of opportunism/compatibility) found signals for some "sloppy" evolved compatibility but only if we moved to longer ranges (PMID 26884163). The authors should re-evaluate their energetic analysis using longer-range cutoffs. To avoid greatly complicating the analysis, longer ranges could be done only with charged side chains. It was also very curious to omit main chain interactions, something which the authors might want to work back in (see PMID 17041605).

See response 3.

3) The authors should really address the question of how thymic education influences what we see. For example, we recently published a TCR that binds with an outlier geometry (not reverse) which signals just fine – an example of a class-mismatched TCR (emerged from a CD4+ T cell but binds a class I). This TCR is a bit weird in that it has an unusually long CDR3b loop that contacts both peptide and MHC (point 1 again). We also concluded that this is a weird TCR that somehow escaped normal thymic selection, implying that maybe the pre-selection repertoire has TCRs that bind crazily and one role of thymic selection is to filter these, giving us TCRs that are somehow "better" biologically (maybe they signal better, or possess lower x-reactivity, etc.). The authors need to work this thinking in. Relevant papers are PMID 36424374 and PMID 30833553.

At the time of depositing this preprint, your group’s very interesting class-mismatched TCR structure was not yet published. It does, however, fit nicely into our existing discussion of the reverse-docking TCRs and super-bulged peptide. It provides another, distinct example of non-canonical binding. Further speculation into how this fits into the greater picture of TCR-pMHC binding has now been added to the discussion lines 498508:

“New results further suggest the extent of the germline interaction permissiveness, with a class-mismatched CD4+ T cell capable of binding to and being activated by MHC class I, albeit with a slightly abnormal, but not reversed, docking orientation [Singh 2022]. These results further highlight the opportunism, expanding on previous work in this space [Blevins 2016], of TCR interactions in general, where the "rules" of TCR-pMHC binding seem to be more like guidelines. The literature has long focused on rules of interaction and commonalities between structures [Ysern 1998, al-lazikani 2000], which have been very helpful in guiding research over the past few decades. However, results such as the class-mismatched TCR, reversed docking TCRs, and super-bulged peptide suggest that perhaps such TCR-MHC specific rules may be too restrictive, and that these interactions may frequently involve more opportunistic configurations that call for unbiased evaluation.”

4) The authors use "compatibility" and "opportunistic" to describe TCR binding from a biophysical perspective, contrasting this with the hard-coded model. These are not new concepts though, and although the authors have greatly expanded on the topic (albeit with the limitations above), they should make note of this. They do reference some of the appropriate literature, but clarifying how they are expanding on the topic would strengthen the impact of the work.

We of course realize that this idea of broad biophysical compatibility and opportunism is not solely our own. We have expanded upon the previous discussion, and more explicitly described where our work expands on these previous ideas (see above excerpt from the text).

[Editors’ note: what follows is the authors’ response to the second round of review.]

The manuscript has been improved but there are some remaining issues that need to be addressed, as outlined below:

Essential revisions:

As you can see from the report, the reviewers appreciate the changes done for revision. After an extensive discussion, the overall consensus of the reviewers is that while the concept of evolved biophysical compatibility is possible and a potential solution to the question of how TCRs could be biased towards MHC proteins given the massive diversity in both receptor and ligand, it is a concept that is exceptionally difficult to demonstrate and the paper still has some wishful thinking. For this manuscript to move forward, we request that you tone down the paper, remove the claims highlighted by reviewer #1, and present the concept as an interesting possibility for which some evidence is offered but no solid proof (see report from reviewer #1 for details).

We thank the editor for this summary, and hope that our edits now more clearly illustrate the novel insights our analysis provides while pointing out that alternative interpretations are possible, as is always the case in research.

However, we also wish to note respectfully that several of the issues brought forth by reviewer # 1 must be refuted based on careful analysis of the agreement between our computational predictions and experimental structural analyses.

We also had a discussion with regards to the suggestion of reviewer #2 to perform a similar analysis on BCRs to verify that the signal is not spurious. We acknowledge that this might be beyond the scope of the current paper. However, if the authors chose to do this analysis, it can help solidify some of the claims.

We agree that such an analysis of BCR interactions would be very useful if BCRs represented a suitable negative control for the results presented here. Unfortunately, that is not the case, as we explain in our response to Reviewer #2.

Reviewer #1 (Recommendations for the authors):

I recognize the time and effort that the authors have invested in responding to the reviews of the first version of the manuscript. It is appreciated that they recognized the circularity of the original Figure 5 and removed it, adjusted the distance thresholds and sequence-filters for contacts analysis, and that they have also removed references to the origin of self-reactive TCRs.

We thank Reviewer 1 for their initial comments, which have improved the quality of the manuscript.

My concerns with regard to the claims about V-gene interaction potential and determinants of the binding mode still stand, since the relevant text hasn't been modified and the author's responses are not convincing.

In their previous assessment, Reviewer 1 had raised issues regarding the “arbitrary” nature of the interaction potential, the details of the calculation of TCR-MHC interaction propensities, the aforementioned circularity of the original Figure 5, and then provided examples where our computational predictions might fall short of describing experimental observations.

In addition to the modifications we introduced in our previous response we have now edited the text where remaining issues were pointed out, changing language such as “validate” to “shows good agreement” and “exceptional agreement” to “good agreement” among other changes in the discussion. We hope these changes address the concerns of the reviewer and editor.

For example, the detailed analysis of the TRBV7-2 containing complexes provided by the authors in the response appears to disprove the AIMS-based prediction that this gene has low interaction potential: "Certainly PRESTO agrees with these structural interpretations, suggesting CDR2B dominates the germline interactions here, with 13/15 SC-SC contacts."

Here we do concede the selected text in the initial response to reviewers displays unclear writing. We meant “PRESTO agrees with the structural interpretations [of the reviewer]”. Given that PRESTO could be confused with the AIMS interaction scoring, we apologize for this lack of clarity. PRESTO is instead solely used for the automated counting of contacts in structures.

However, notwithstanding the initially unclear wording for this PDB entry, the remainder of our detailed analysis strongly supports our computational predictions. We could reiterate the analyses we provided for 5EU6 [Altered Self Antigen], 5D2L [CMV Antigen], 4MJI [HIV Antigen], and 40ZH [Celiac Autoimmune] but refer to the previous rebuttal instead, emphasizing that the conclusions we provided remain valid and appear to suggest the CDR loops encoded by TRBV7-2/7-3 have a propensity for limited or weak interactions with MHC.

The contorted logic that the authors produce to explain this disconnect doesn't really make sense: "However, yet again we have an abnormally high number of CDR2B backbone-backbone interactions, 14, suggestive of nonspecific tight packing not driven by TCRB specific interactions". What exactly is "nonspecific tight packing"?

We apologize if the notion of 'nonspecific tight packing’ was unclear in this context. We were using this term to describe regions of close contacts between two proteins that are formed not due to their own strong interactions, but instead due to distal interactions elsewhere on the TCR-pMHC interface.

We note that the authors of the PDB 4GRL study [PMID 24136005] highlight that CDR3A “dominate[s] the energetic landscape” of the interaction, supporting our interpretation of the predicted interaction propensity of TRBV7-2/7-3 and its agreement with experimental results.

In this case, CDR3A is the aforementioned “distal interaction” driving the complex formation, and the tight packing of CDR2B is merely a consequence of the docking, i.e. nonspecific. Briefly, CDR3A is the cause of the tight packing of CDR2B, and CDR2B in turn has no specific side chain interactions with the MHC. These claims are further quantitatively supported by Supplemental Table S5 of PMID 24136005 where mutagenesis of the β chain has only a modest impact on binding affinity, yet again suggestive of a limited interaction between the side chains of TRBV7-3 and the MHC α helix, further supporting the claims put forward by our analysis.

The authors also continue to over-sell their findings in the newly introduced text. For example, in describing the new Figure 5, the authors state: "This comparison shows exceptional agreement between our bioinformatic results and structural analyses". But when one compares Figure 5a and 5b, for example, the agreement is pretty dubious.

As noted before, we are now even more careful and have modified the text and replaced “exceptional agreement” by “good agreement”. However, we can quantify this agreement more rigorously by flattening the matrices of Figure 5a and 5b and comparing the distributions of contacts for each residue pair interaction potential score (Author response image 7).

Author response image 7.

Author response image 7.

We see that in the case of AIMS interactions scores greater than or equal to zero, we find the majority of our high frequency amino acid contacts. Note that the poor correlation (correlation coefficient 0.2) is expected for multiple reasons. First the TCR-pMHC crystal contact matrix is sparse, giving a high instance of “0” contact pairs. Further, hydrophobic amino acids are relatively rare both in the CDR loops and in the TCR contacting residues on the MHC helix. Lastly, “negative” interactions, such as Lys-Lys or Arg-Phe pairings, cannot have a corresponding negative contact count. Instead we see a higher proportion of 0 contacts between residue pairs.

And in 5d, *none* of the differences are significant, and many show the wrong directionality, for example, the median value for "Weak TRBV" is always greater than or equal to the median value for "Moderate TRBV".

Looking at Figure 5C/5D and Supplemental Figure S7, the data are consistent with the differences (or lack thereof) pointed out by us. Whereas the TRAV alleles identified as “strong” binders have much higher AIMS interaction scores than either the “moderate” (~1.5 unit difference) or the “weak” (~2 unit difference) binders, these interaction score differences are more modest for TRBV (~1 unit difference between “strong” and “weak” highest scores). This rationale is already highlighted in the text:

“Interestingly, these interaction potentials show better experimental agreement and predictive power for TRAV-encoded sequences compared to TRBV-encoded sequences. This could be due either to a fundamental difference in how TCRα and TCRβ contact the MHC α-helices, or in part due to the aforementioned higher interaction potential variance for TRAV-encoded CDR loops (Figure S7).”

And in the new text describing the AIMS potential: "The AIMS interaction potential, which can swiftly analyze thousands of sequences, has significantly outperformed more physically detailed and computationally expensive models. In a binary classification of a large database of structurally similar protein complexes, the AIMS interaction potential was capable of distinguishing binders and non-binders to an accuracy of 80%, whereas calculations run on over 45µs of simulated all atom trajectories could only distinguish to an accuracy of 50%. " I looked back at this reference, and what the authors neglect to mention is that the 80% performance comes from a highly parameterized model based on a linear discriminant analysis fitting a weight for each pair of residues in the interface-- it's not at all analogous to the calculation here in which AIMS scores are directly summed up. It's also a single family of interacting proteins.

We agree with the reviewer that the parametrization of the model plays an important role here. But we also wish to point out that in the reference in question [PMID 35787023] the more physically detailed and computationally expensive model used the same linear discriminant analysis-based approach on a similarly highly parametrized model, and was still substantially outperformed by the AIMS model (Figure 8: Computationally expensive method, Figure 9: AIMS model, in the referenced manuscript). Nonetheless, we have updated the text to highlight that the AIMS accuracies highlighted in the text do come from a linear discriminant-based analysis.

Further, this reference is directly analogous to the calculations presented in this manuscript, we just do not currently have a similar classification scheme in which to test TCR-pMHC binding. In fact, to our knowledge there exists no dataset where some number of CDR3-peptide pairings are kept constant while CDR1/2 are varied. This would provide the ideal test for the predictions included herein.

Lastly, while the Dpr-DIP interactome does concern a single family of interacting proteins, the TCR-pMHC interactome likewise concerns a single family of interacting proteins. Using a minimalist coarse graining of interactions between protein families with conserved structural features, we are able to provide reliable estimates of the tendencies for specific side chains to form productive interactions.

Reviewer #2 (Recommendations for the authors):

With regards to the manuscript in general, in some places, the authors seem to want to have their cake and eat it too. Particularly, the idea that TCRs are evolutionarily biased to recognize MHC, included stating support for the "codon model" while at others suggesting that CDR1s and CDR2s have only minimal (complementary) roles in binding. With the extension suggesting that some TRAVs and TRBVs have no (or very minimal) MHC/HLA binding potential.

We agree with reviewer 2 that our conclusions could be more directed, and hope that the added text in the discussion reflects this. Specifically, we have added the point:

“Further, while the interaction codon hypothesis suggests co-evolved interaction interfaces between the TCR and MHC, our analysis instead suggests that each TRAV-TRBV pairing finds a unique approach to binding within the constraints permitted by the MHC molecular surface. In other words, the MHC molecule largely defines the interface.”

We note that we do not suggest that TCRs are evolutionarily biased to recognize MHC anywhere in the text. While we say our results are somewhat in agreement with the “codon model”, we note a “broader, dynamic interpretation” of the interaction is suggested by AIMS. In other words, there is no evolutionary bias. The “biophysical compatibility” we suggest is a much weaker assumption than an explicit evolutionary bias at the sequence level.

We wish to point out that, while reviewer 2 presents the codon model and a model with minimally interacting CDR 1/2 loops as models in opposition, both models are compatible with the data presented in this manuscript.

Specifically, we do not disregard or attempt to disprove the previous finding of evolutionary TCR-pMHC interactions involving TRBV8-2. Instead, we suggest that such conserved interactions are rare, and that some TRAV/TRBV alleles may exist that show very different tendencies, with a limited propensity for binding MHC. Indeed, this diversification of binding strategies may be evolutionarily advantageous, giving TCRs a range of possible strategies for recognizing antigen. In other words, given the large number of possible TRAV and TRBV combinations, TCRs can realize a multitude of distinct binding strategies.

This later argument would suggest that antibodies, fully capable of creating diverse CDR3s, should similarly have a (modest, strong) ability to bind pMHC ligands. I suppose a computational test of the general idea the authors are putting forward would be to use their AIMs platform with human antibody CDR1s and CDR2s to see if these were all net no-binding or negative binding with MHC. However, I do not like the idea of bringing up additional questions/tests of the model during a re-review.

We appreciate the reviewer’s concern with our workload in this re-review. However, we have already considered antibody CDR loops as a negative control, and were surprised to find that they represent a poor negative control. Why we don’t see more natural antibody-pMHC interactions seems to be an immunological question, rather than a biophysical one.

A relatively recent review [PMID 31544838] highlights 52 previously published “TCR-like” antibodies binding to class I MHC molecules with peptide specificities, with all measured affinities in the nanomolar range. The authors of this review note that despite excellent synthetic CDR loop libraries, most TCR-like antibodies are “isolated from libraries built on endogenous variable gene repertoires”. In other words, using native IGHV/IGLV/IGKV libraries does not preclude these antibodies from binding to pMHC. While some (or perhaps the majority) of these “TCR-like” antibodies do not adopt this canonical TCR-pMHC docking orientation, at least one study [PMID 19307587] finds a “TCR-like” antibody that does. Importantly, while the heavy chain overlaps with the TCR-α interface and the light chain overlaps with the TCR-β interface, the antibody germline CDR loops bear little to no resemblance to either chain (Author response table 2).

Author response table 1. Comparison of CDR loop sequences of TCR 1G4 and the TCR-like antibody that binds to the same pMHC complex.

Sequences identified via PMID 19307587

Loop CDR1A/H CDR2A/H CDR1B/L CDR2B/L
TCR Seq DSAIYN IQSSQRE MNHEY SVGAGI
Antibody Seq GFTFSTYQ IVSSGGST TGTSRDVGGYNYVS DVIERSS

As such, the latter argument outlined by reviewer 2 does seem, at least in part, to be consistent for antibodies, and further they do not represent a suitable negative control.

Associated Data

    This section collects any data citations, data availability statements, or supplementary materials included in this article.

    Supplementary Materials

    Supplementary file 1. Table used for the second version of the AIMS scoring of pairwise amino acid interactions.

    The table attempts to recapitulate the interactions between amino acids at the level of an introductory biochemistry course.

    elife-90681-supp1.csv (1.3KB, csv)
    Supplementary file 2. Key for Figure 4 and Figure 4—figure supplement 1 relating the numbers on the X-axis of each plot to the corresponding TRAV or TRBV gene.

    Note, the pairing of TRAV and TRBV genes to a specific X-axis number has no meaningful relation. Genes are listed in the same order as found on IMGT, with pseudogenes not included.

    elife-90681-supp2.csv (961B, csv)
    MDAR checklist

    Data Availability Statement

    All data and code used for the analysis in this manuscript are freely available online with no restrictions. All input FASTA sequences and code needed to recreate the analysis can be found via the AIMS GitHub page. Specific analysis for structural comparisons between interaction potentials and TCR-pMHC complexes are found via a separate repository, called PRESTO, also hosted on GitHub. Due to the significant time required to calculate the interaction scores calculated via AIMS, the calculated scores can be found on Zenodo. In case of future updates to either AIMS or PRESTO, the specific versions used for this manuscript are also hosted on Zenodo, as AIMS v0.8 and PRESTO v0.1.


    Articles from eLife are provided here courtesy of eLife Sciences Publications, Ltd

    RESOURCES