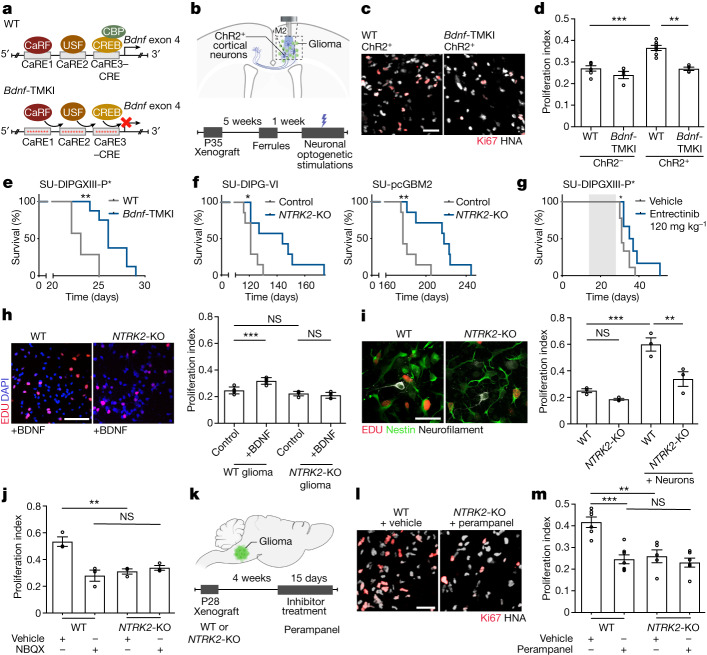
Fig. 1. Activity-regulated BDNF promotes glioma progression.
a, The Bdnf-TMKI model. CaRE, calcium regulatory element binding site; CRE, cAMP response element; WT, wild type. b, Optogenetic paradigm. M2, mouse premotor frontal cortex; P, postnatal day. c, Representative images of glioma (SU-DIPG-VI) xenografted into wild-type and Bdnf-TMKI cortex following blue-light stimulation of ChR2+ cortical neurons. HNA (grey) marks glioma cells, Ki67 (red) marks proliferating cells. Scale bar, 50 µm. d, Proliferation index (Ki67+ cells/HNA+ glioma cells) of xenografted SU-DIPG-VI glioma in wild-type or Bdnf-TMKI mice stimulated optogenetically (ChR2+ cortical neurons) or mock-stimulated (ChR2− neurons). n = 6 (wild-type ChR2−), 4 (Bdnf-TMKI ChR2−), 7 (wild-type ChR2+) and 4 (Bdnf-TMKI ChR2+) mice. e, Survival curves of wild-type and Bdnf-TMKI mice bearing SU-DIPG-XIII-P* xenografts. n = 7 (wild type) and 8 (Bdnf-TMKI mice). f, Survival curves of mice bearing wild-type and NTRK2-KO orthotopic xenografts (SU-DIPG-VI and SU-pcGBM; n = 7 mice per group). g, Survival curves of SU-DIPG-XIII-P* xenografted mice treated with entrectinib versus vehicle-treated controls. Grey shading indicates drug treatment. h, Representative images (left) and proliferation index (right; EdU+ cells/DAPI cells) of wild-type and NTRK2-KO glioma cultures (SU-DIPG-VI) with or without BDNF treatment (n = 5 coverslips per group). Scale bar, 100 µm. i, Representative images (left) and proliferation index (right; EdU+ cells/Nestin+ glioma cells) of wild-type and NTRK2-KO glioma (SU-DIPG-VI) cultured alone or with neurons (n = 3 coverslips per group). Scale bar, 50 µm. j, Proliferation index of SU-DIPG-VI wild-type and NTRK2-KO glioma co-culture with neurons (as in representative image in i), with or without NBQX (n = 3 coverslips per group; repeated in Extended Data Fig. 5a,b). k–m, Experimental scheme (k), Representative images (l) and quantification of proliferation rate (Ki67+ cells/HNA+ glioma cells) of wild-type and NTRK2-KO glioma xenografts (SU-DIPG-VI) treated with perampanel or vehicle control (m). n = 6 (wild type + vehicle), 7 (wild type + perampanel), 5 (NTRK2-KO + vehicle) and 6 (NTRK2-KO + perampanel) mice. Scale bar, 50 µm. Data are mean ± s.e.m. One-way ANOVA with Tukey’s post hoc analysis (d,h–j,m); two-tailed log rank analysis (e–g). *P < 0.05, **P < 0.01, ***P < 0.001, ****P < 0.0001; NS, not significant.

