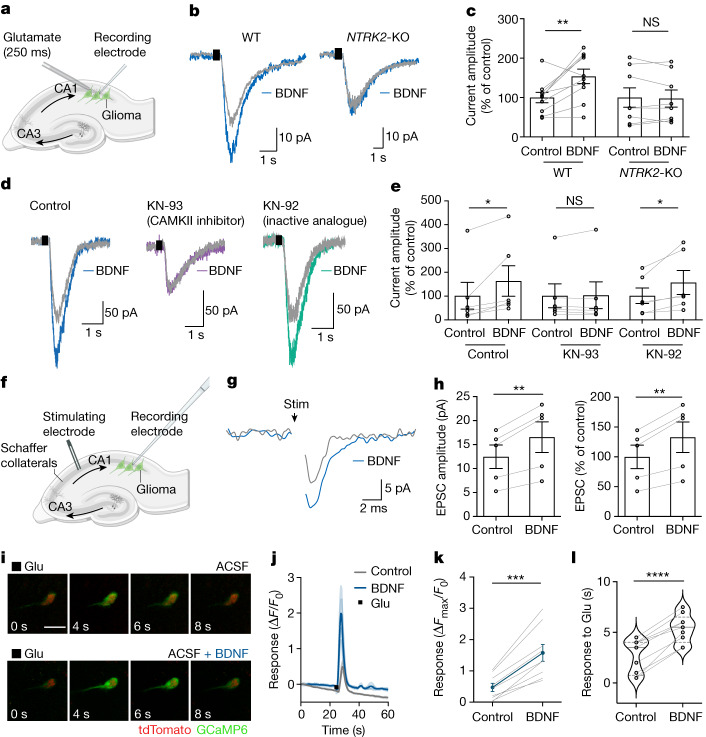
Fig. 2. BDNF–TrkB signalling increases the amplitude of glutamatergic currents in glioma cells.
a, Electrophysiological model; GFP+ glioma xenografted in hippocampal CA1; local glutamate puff. b, Representative traces of glutamate-evoked (black rectangle) inward currents in xenografted SU-DIPG-VI glioma before (grey) and after (blue) 30 min of BDNF perfusion in wild-type and NTRK2-KO glioma. c, Quantification of current amplitude in b (n = 10 cells, 6 mice (wild type) and 8 cells, 6 mice (NTRK2-KO)). d, Representative traces of xenografted SU-DIPG-VI in response to glutamate puff (black rectangle) before (grey traces) and after (blue, purple, and green traces) 30 min of BDNF perfusion. Left, control trace. Middle, with 2-h incubation with the CAMKII inhibitor KN-93. Right, with 2-h incubation with KN-92, an inactive analogue of KN-93. e, Quantification of current amplitude in d (n = 6 cells per group from 5 mice (control), 3 mice (KN-93-treated) and 3 mice (KN-92-treated)). f, Electrophysiological model as in a, with Schaffer collateral afferent stimulation. g, Representative averaged voltage-clamp traces of evoked glioma excitatory postsynaptic current (EPSC) in response to axonal stimulation (black arrow) before (grey) and after (blue) BDNF application. h, Quantification of EPSC amplitude in g (n = 5 out of 43 glioma cells exhibiting EPSCs from 4 mice). i, Representative two-photon in situ imaging (8-s time series) of glioma cell calcium transients evoked by local glutamate puff before (top) and after (bottom) perfusion with BDNF (100 ng ml−1, 30 min). Green denotes glioma GCaMP6s fluorescence and red denotes tdTomato nuclear tag. Scale bar, 10 µm. j, GCaMP6s intensity traces of SU-DIPG-XIII-FL glioma cells response to glutamate puff with or without BDNF. n = 4 individual cells per group. Light grey shows traces for individual vehicle-treated cells and dark grey shows the average; light blue shows traces for individual BDNF-treated cells and dark blue shows the average. k, Responses of SU-DIPG-XIII-FL GCaMP6s cells to glutamate puff with or without BDNF (n = 9 cells, 3 mice). l, Duration of calcium transient in response to glutamate puff in SU-DIPG-XIII-FL GCaMP6s cells before and after BDNF exposure (n = 9 cells, 3 mice). Data are mean ± s.e.m. Two-tailed paired Student’s t-test (c,e,h,k,l).

