Abstract
Bioconversion of coal to methane occurs in the coalbed aquifer environment. To investigate the evidence of coal biodegradation from coalbed-produced water, we collected six field water samples from the Dafosi gas field and prepared one laboratory-simulated water sample and one indoor anaerobic microbial degradation sample with the highest compound concentration as the two reference standards. Gas chromatography–mass spectrometry was used to detect the organic compound type, concentration, and differences in the biomarker compound sensitivity. Results indicate that extracted organic matter from coalbed-produced water samples can be evidence of biodegradation. Variations in range compounds (such as n-alkanes, tri- and pentacyclic terpenes, and steranes) and their sensitivity confirmed active microbial degradation in the studied area. A positive correlation between the n-alkanes content in the coalbed-produced water and the stable carbon isotope value of methane further verifies that the n-alkanes are primary substrates for maintaining microbial activity. Therefore, evidence including n-alkanes, tri- and pentacyclic terpenes, steranes, unresolved complex mixtures, and stable carbon isotope composition of methane contribute to biogenic methane generation in situ. Our limited data suggest that managing soluble organic matter in the coalbed-produced water may provide a viable route for coal biodegradation since most microorganisms survive within the coal seam water.
1. Introduction
The exploitation of coalbed gas or methane (CBM) as an unconventional natural gas resource contributes to the adjustment of the global energy structure, presenting itself as a green, clean, and environmentally friendly option.1 As of 2020, the global CBM resources reached 260 × 1012 m3, with China being the world’s third-largest reserve country for CBM, boasting proven resources up to 36.81 × 10¹² m3 in the shallow strata (buried depth <2000 m).2 Secondary biogenic gas (SBG) is a significant genetic type within CBM. Since its discovery in the San Juan Basin in the United States in 1994, exploration and research on it have been without interruption.3−6 SBG is generated through complex biodegradation processes involving microorganisms that undergo acetic fermentation or CO2 reduction to produce CH4 and CO.7−9 However, recent culture-independent studies suggest that the archaeon "Candidatus Methanoliparum" alone can combine long-chain alkane degradation with methanogenesis.10 Lloyd et al. demonstrated that methoxy is fundamental for SBG generation.11 The role of microorganisms during the O-demethylation in coal and SBG formation remains undefined; therefore, it is crucial to investigate the generation mechanism of SBG from the perspective of biodegradation of organic matter (OM) found within coal measures.
Various factors, including temperature, coal rank, physicochemical structures, and groundwater conditions, influence the conversion of coal to methane by microorganisms.12,13 As water is essential for microbial activity; it supplies necessary nutrients such as nitrogen, potassium, phosphorus, and trace elements (iron, manganese, cobalt, nickel, and zinc) to the process of oil biodegradation that occurs in a limited range near the oil–water interface under anaerobic conditions.14,15 Therefore, access to an aquifer likely facilitates coal biodegradation. The coal seam aquifer reduces the dissolution of OM in water and enhances microbial activity, serving as a reservoir for microbial metabolites during this process.16,17 Thus, the groundwater of the coal seam is the main battlefield of microbial degradation reaction, and the change of compound composition in water is directly related to the biogas generation and the strength of biodegradation, which is a crucial process to revealing the accumulation of biogenic CBM. Orem et al. found that coal seams and shale-produced water contain substantial amounts of polycyclic aromatic hydrocarbons (PAHs) and potentially toxic OM, which pose risks to the environment and human health.18 Therefore, a systematic record of organic geochemistry is necessary to elucidate the potential bioconversion of various organic contaminants to biogenic methane.
Biomarkers, including pristane (Pr), phytane (Ph), Pr/Ph, carbon preference index (CPI), odd/even predominance (OEP), ∑nC21–/ ∑nC21+, etc., are widely available and have the depositional environment, maturity level, and microbial degradation characteristics of crude oil.19−22 Different biomarkers exhibit varying resistances to degradation. Generally speaking, aliphatic components in coal undergo a higher degree and rate of biodegradation than aromatic compounds.3 Some scholars have suggested that the degradation rate of aromatic hydrocarbons in coal is faster than that of aliphatic hydrocarbons based on gas chromatography–mass spectrometry (GC/MS) traces retained in coal extracts.23,24 However, no concentration data have been compared. Furmann et al. found that both n-alkanes and aromatic hydrocarbons are degraded simultaneously during the biodegradation process of coal, with n-alkanes degrading faster than aromatic hydrocarbons.4 While biodegradation typically occurs after removing n-alkanes in oil reservoirs for aromatic compounds,25,26 progressive biodegradation appears to result in simultaneous removal of compound classes on quite different rate trajectories rather than genuinely sequential removal.15
Our study aims to investigate the in situ organic composition content distribution in coalbed-produced water in the study area, monitor the variation of organic compound concentrations under the condition of biodegradation, and explore the difference in microbial sensitivity of biomarker compounds and the possibility of continuous biogenic methanogenesis. Therefore, we systematically collected six water samples across the area from the Dafosi biogenic gas field. Additionally, one coal was soaked in ultrapure water for 3 days to obtain a reference benchmark (LS), and one anaerobic microbial degradation was conducted on the water sample with the highest content of biomarker compounds. The soluble OMs extracted are analyzed using GC/MS. Furthermore, we integrated stable carbon isotope values of methane from sampling wells into our present study. The findings provide robust evidence for elucidating coal biodegradation from a geochemical perspective.
2. Geological Background of the Study Area
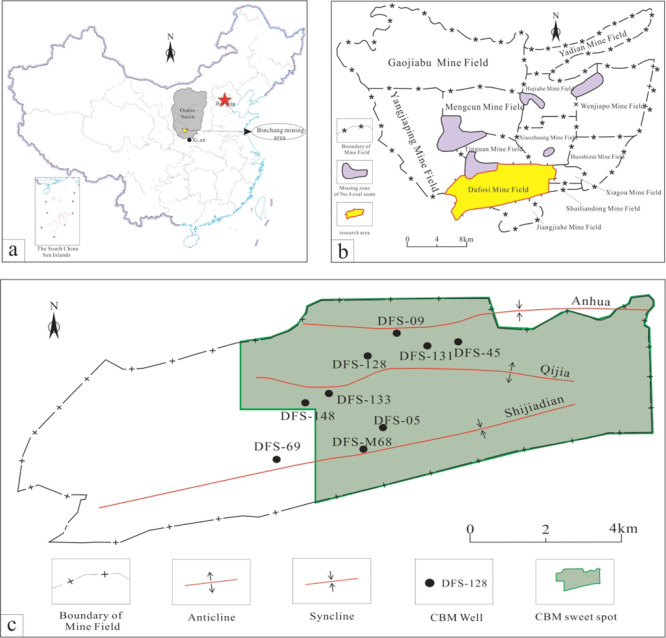
The Ordos Basin, located in central China, is a craton basin rich in oil and gas resources, with an area of about 25 × 104 km2.27,28 The Binchang mining area, located on the southwestern margin of the basin (Figure 1a), is a typical biogenic CBM accumulation area with low-rank coals in China. The Dafosi gas field is positioned in the southern part of the Binchang mining area (Figure 1b). It exhibits a well-developed characteristic monoclinic structure. From north to south, there are the Anhua syncline, Qijia anticline, and Shijiadian syncline with mainly NE-trending folds (Figure 1c). The Dafosi gas field is rich in coal and CBM resources. The main coal seams are nos. 4 and 4 upper coal seams, and biogenic CBM accounts for a relatively large proportion (>68.9%) of the production gas.5 The coal rank of the nos. 4 and 4 upper coal seams is mainly subbituminous coal with partial high volatile C bituminous coal. The sampling sites are situated within the area of the Dafosi gas field (Figure 1c) and have been exclusively collected from active CBM production drainage wells.
Figure 1.
(a) Location map of the Ordos Basin. (b) Distribution map of the Binchang mining area. (c) Structure outline and sampling locations of the Dafosi gas field.6
3. Samples and Methods
3.1. Sample Preparation
A total of six samples of water produced from coalbeds, one sample of ultrapure water as a blank, one indoor simulation sample, and one sample of degraded water produced from coalbeds were prepared for this study. The six water samples and the ultrapure water blank sample were collected into 5 L amber glass bottles that had been washed three times with dichloromethane (DCM) prior to use. Before the samples were collected, bottles were rinsed three times with the target water and immediately filled. One bottle containing 5 L of ultrapure water was opened and then sealed at the same time as the coalbed-produced water samples. All collected water samples and on-site blank samples were placed in a low-temperature refrigerated sampling box (Midea, model MC-4L416) and promptly transported back to the laboratory. The period between field sampling and laboratory filtration was kept short to minimize any alteration in the samples. Subsequently, the collected waters were filtered using a precleaned glass fiber filter device with a 0.22 μm pore size membrane to remove impurities and purify them before being subpackaged into three 250 mL amber glass bottles with an equivoluminal mixture of filtered water and n-hexane. Each produced water sample’s remaining filtered water samples should be put into sterilized amber bottles and refrigerated for later use. The 250 mL amber glass bottle and the glass filter device used in the separation process were washed with ultrapure water and rinsed with DCM three times early. Finally, they were preserved at four °C in the refrigerator, waiting for a subsequent laboratory process. Six water samples and one on-site blank sample were numbered in the order of DFS-45, DFS-69, DFS-128, DFS-131, DFS-148, DFS-M68, and KB.
To explore the characteristics of dissolved organic compounds in water from raw coal, a coal sample was collected directly from the underground mining face at the site of the water-produced coal seam. The collected sample was immediately placed in a light-tight sealed bag filled with nitrogen to prevent oxidation. Upon arrival at the laboratory, the sample was stored at a low temperature and protected from light until further use for subsequent soaking experiments. The soaking experimental procedure involved grinding and crushing the coal sample to particle size of 60–80 meshes, followed by UV lamp treatment for 30 min to eliminate microbial activity in the coal powder; it was dried in an oven for 24 h before adding 150 mL of ultrapure water and 5 g of pulverized coal into a precleaned amber glass bottle rinsed three times with DCM. To ensure rapid dissolution and obtain high concentrations of soluble organic matter within a short period, the glass bottle containing ultrapure water and powdered coal was placed inside a constant temperature oscillation chamber set at 60 °C with shaking intensity maintained at 150 rpm for 72 h.16 The resulting dissolved water sample obtained in the laboratory is LS.
To further verified the degradability of organic compounds in coalbed-produced water samples and investigated potential variations in biological sensitivity. The preferred methane-producing microbial communities are employed in laboratory settings. The produced water sample exhibiting the highest abundance of biomarker compounds is selected as the degradation substrate. A period of degradation is carried out under anaerobic conditions. After some time, organic compound extraction and quantitative testing are completed using the same processing steps as those for the original coalbed-produced water samples. All inoculation experiments are conducted in a sterile anaerobic glovebox, with the inoculum concentrated through low-temperature centrifugation to ensure negligible OM content. The degraded water sample is denoted as DFS-X.
3.2. Extraction of Organic Compounds from the Water Samples
The organic substances in the coalbed-produced water, KB, LS, and DFS-X are separately extracted using the liquid/liquid extraction method.29 Analytical grade n-hexane (50 mL) is added at the sampling site to facilitate extraction. To enhance solvent extraction efficiency, the ultrasonic vibration is used for 10 min at the latter three liquid/liquid extractions in the laboratory. The vibrational frequency is 70% × 40 kHz each time. After that, the mixed extract (∼200 mL) is concentrated by rotary evaporation to less than 10 mL and then further concentrated to 1 mL in another bottle. A reasonable proportion of squalene (internal standard) is added to a 1 mL sample to quantify the concentration of organic compounds in the water samples. After this operation, a syringe takes 1 μL for GC/MS analysis. To prevent the loss of volatile organic components during extraction, a gentle stream of nitrogen gas should be over the liquid to create an inert atmosphere. The blanks testing for GC/MS include the following:
-
1.
A KB sample collected from the field is extracted by 50 mL analytical grade n-hexane four times the same as coalbed-produced water samples.
-
2.
The empty bottle is scrubbed by pure analytical grade n-hexane according to the same operational program in the laboratory.
-
3.
Analytical grade n-hexane is directly injected into GC/MS for analysis.
3.3. Gas Chromatography–Mass Spectrometry (GC/MS) Analysis
The organic compounds are detected using an Agilent 7890A-5977B instrument equipped with a DB-1MS chromatographic column (60 m × 0.25 mm × 0.25 μm). The experimental conditions are set as the initial column oven temperature of 40 °C (held for 5 min), followed by a gradual increase to approximately 325 °C at a rate of 5 °C/min. Subsequently, the temperature is maintained constant for 15 min. The column flow rate is 1 mL/min without splitting, and helium gas served as the carrier gas. Auxiliary heating AUX-1 is set to maintain a temperature of 250 °C, while the ion source and quadrupole temperatures are kept at 230 and 150 °C, respectively. The mass spectrometer was operated in the electron impact ionization mode of 70 eV, scanning from 60–300 Da with a threshold 150. The solvent delay is set to 9 min. The data are acquired in full scan mode. Compound types are identified by comparing them with the peak retention time of standard compounds, mass spectrometry analysis, and literature data. Compounds were identified by a comparison of their mass spectra and retention times with those of published compounds and by interpreting mass fragmentation patterns. The peak area obtained in manual integration mode was applied for concentration calculation with squalane as the internal standard. The main recognized compounds are n-alkanes (m/z = 85), acyclic isoprenoids (m/z = 183), tri- and pentacyclic terpenes (m/z = 191), and steranes (m/z = 217, 218). No response factor calibration has been performed.
4. Results
4.1. Type and Abundance of OMs in the Water Samples
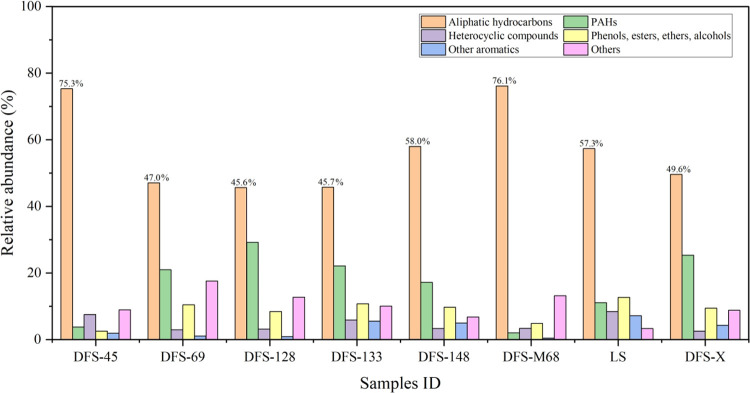
All water samples are rich in organic components, including aliphatic hydrocarbons, PAHs, heterocyclic compounds, phenols, esters, ethers, alcohols, and other aromatic compounds (Figure 2). These compounds are not detected in three blank samples; therefore, the testing results of the blank samples are not presented in the paper. The aliphatic hydrocarbons are the dominant compound classes from 45.6 to 76.1%. The proportion of aliphatic hydrocarbons decreased from 76.1 (well DFS-M68) to 49.6% (well DFS-X). As aliphatic hydrocarbons are the primary substrate to support the life of microbe,4 therefore, according to the quantitative test results of organic compounds content, the produced water sample of well DFS-M68 with the highest absolute content of compounds is selected as the target water sample for anaerobic biodegradation in the laboratory.
Figure 2.
Type and abundance of OMs of all water samples.
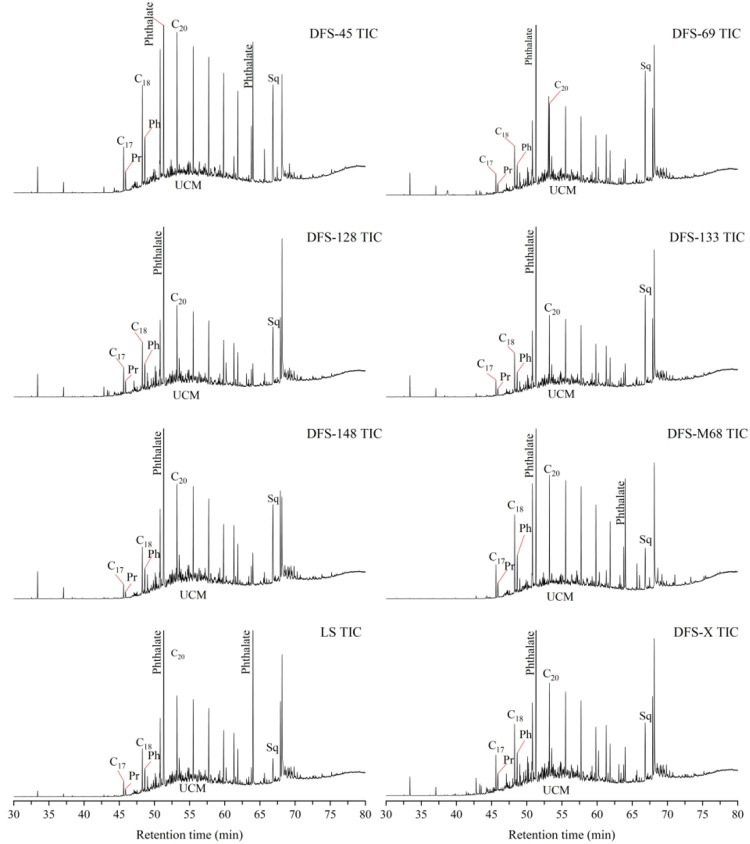
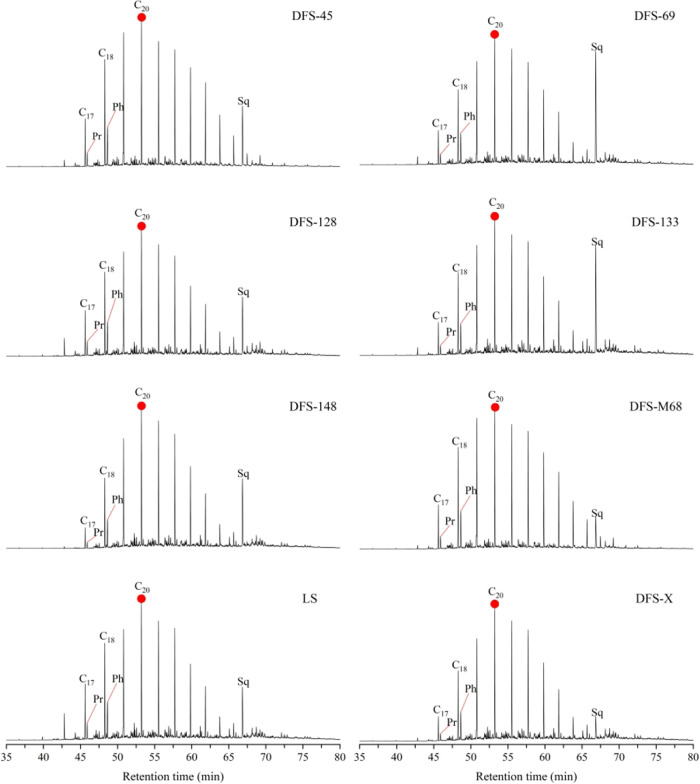
Figure 3 shows the total ion chromatogram (TIC) of extractable compounds from all water samples, indicating many unresolved complex mixtures (UCMs). Compared with the DFS-M68 sample, the UCMs in the TIC of the DFS-X water sample are more pronounced. Meanwhile, the peaks of n-alkanes in the TIC of all samples are pronounced, indicating that the n-alkanes are the main aliphatic hydrocarbon organic compounds in all the collected water samples. Therefore, the variation of n-alkanes content in the water samples can represent the groundwater’s change pattern and evolution feature in the coal seam. It is worth noting that there are one or two apparent peaks (phthalates substance) in the TIC spectrum of all collected water samples. Phthalate (m/z = 149) is a common plasticizer pollutant in nature, which may be brought into the coal seam during fracturing or contaminated in the sampling process. Therefore, phthalates are regarded as foreign pollutants and did not subsequently participate in the organic evolution process analysis.
Figure 3.
Total ion chromatograms of extractable compounds from all water samples.
4.2. n-Alkanes and Isoprenoid Compounds (m/z = 85)
Figure 4 represents the eight m/z = 85 mass chromatograms showing n-alkanes and isoprenoids in all water samples. The carbon numbers of n-alkanes are mainly in the range of C16 to C30, with the C20 compound as the main carbon. The carbon distributions show a monopeak model and bias to light molecular end with a relatively low proportion of higher carbon number alkanes. In six produced water samples, the absolute content of n-alkanes and isoprenoids (Pr and Ph) (Table 1) illustrated that the DFS-M68 sample has the highest concentration with total n-alkanes and isoprenoids of 220.6 and 13.9 ng/L, respectively. Sample DFS-45 is the second richest, containing 130.7 and 8.0 ng/L, respectively. The lowest content of 64.2 ng/L total n-alkanes occurs in the MFS-148 sample. The LS sample’s absolute content of n-alkanes and isoprenoids is 103.0 and 5.9 ng/L, respectively. Compared with the DFS-M68 sample, the complete contents of n-alkanes and isoprene in the DFS-X sample decreased significantly, 85.8 and 6.3 ng/L, respectively. The spatial variation in the n-alkanes content is governed by the degree of biodegradation that water has experienced and is closely related to microbial activity (see more details in the discussion section).
Figure 4.
Mass chromatograms of m/z = 85 showing the distribution of n-alkanes and isoprenoids from all water samples.
Table 1. Component Concentrations of n-Alkanes and Isoprenoids (ng/L).
| compound | abbreviation | m/z | DFS-45 | DFS-69 | DFS-128 | DFS-133 | DFS-148 | DFS-M68 | DFS-X | LS |
|---|---|---|---|---|---|---|---|---|---|---|
| n-alkane C15 | C15 | 85 | 0.1 | 0.3 | ||||||
| n-alkane C16 | C16 | 85 | 0.7 | 0.6 | 1.5 | 0.5 | 0.1 | 0.7 | 2.1 | 0.4 |
| n-alkane C17 | C17 | 85 | 5.2 | 2.7 | 4.3 | 2.2 | 1.4 | 8.5 | 4.68 | 2.8 |
| Pristane | Pr | 85 | 2.0 | 1.08 | 1.7 | 0.8 | 0.5 | 3.2 | 1.8 | 1.1 |
| n-alkane C18 | C18 | 85 | 11.4 | 5.8 | 7.8 | 5.6 | 4.7 | 20.5 | 7.9 | 8.4 |
| Phytane | Ph | 85 | 6.0 | 3.3 | 4.4 | 3.0 | 2.6 | 10.7 | 4.5 | 4.8 |
| n-alkane C19 | C19 | 85 | 15.5 | 8.4 | 10.4 | 8.0 | 7.6 | 27.8 | 10.2 | 13.3 |
| n-alkane C20 | C20 | 85 | 16.2 | 10.2 | 11.8 | 9.9 | 9.5 | 29.1 | 11.5 | 16.4 |
| n-alkane C21 | C21 | 85 | 14.2 | 9.1 | 10.4 | 8.56 | 8.5 | 25.5 | 10.1 | 14.6 |
| n-alkane C22 | C22 | 85 | 13.5 | 8.1 | 9.4 | 7.9 | 7.8 | 24.1 | 9.2 | 13.6 |
| n-alkane C23 | C23 | 85 | 11.4 | 5.8 | 6.8 | 5.7 | 5.7 | 20.0 | 6.6 | 9.6 |
| n-alkane C24 | C24 | 85 | 9.2 | 3.9 | 4.7 | 3.9 | 3.7 | 16.4 | 4.5 | 6.3 |
| n-alkane C25 | C25 | 85 | 5.7 | 1.8 | 2.4 | 1.8 | 1.7 | 10.3 | 2.1 | 3.0 |
| n-alkane C26 | C26 | 85 | 3.4 | 1.1 | 1.8 | 1.0 | 1.0 | 6.1 | 1.3 | 1.8 |
| Squalane | SQ | 85 | 12.2 | 16.1 | 9.7 | 13.5 | 8.4 | 11.6 | 7.7 | 4.8 |
| n-alkane C27 | C27 | 85 | 1.5 | 0.3 | 0.8 | 0.3 | 0.3 | 2.7 | 0.3 | 0.4 |
| n-alkane C28 | C28 | 85 | 1.3 | 0.6 | 1.2 | 0. 6 | 0.6 | 2.2 | 0.7 | 1.0 |
| n-alkane C29 | C29 | 85 | 0.4 | 0.2 | 0.6 | 0.6 | 0.2 | 0.2 | ||
| n-alkane C30 | C30 | 85 | 0.4 | 0.3 | 0.5 | 0.2 | 0.2 | 0.3 | 0.3 | 0.4 |
| n-alkane C31 | C31 | 85 | ||||||||
| n-alkane C32 | C32 | 85 | 0.3 | 0.2 | 0.2 | 0.2 | 0.2 | |||
| n-alkane C33 | C33 | 85 | 0.3 | 0.3 | 0.3 | |||||
| n-alkane C34 | C34 | 85 | 2.1 | |||||||
| n-alkane C35 | C35 | 85 | 4.6 | |||||||
| total | Cn | 85 | 130.7 | 79.4 | 90.3 | 73.4 | 64.2 | 220.6 | 85.8 | 103.0 |
4.3. Tri- and Pentacyclic Terpenes (m/z = 191)
Table 2 demonstrates the absolute contents of tri- and pentacyclic terpanes (m/z = 191), including 15 tricyclic terpanes: C19 tricyclic terpane (19TT), 20TT, 21TT, 22TT, 23TT, 24TT, 25TT, 26TTa, 26TTb, 28TTa, 28TTb, 29TTa, 29TTb, 30TTa, and 30TTb in all water samples. Except for the DFS-45 and DFS-M68 samples, the most abundant tricyclic terpene is 19TT, which accounts for more than 25% of tricyclic terpenes. There is a high content of 20TT–24TT and a low content of 19TT in DFS-45 and DFS-M68 wells. Compared with the DFS-M68 water sample, the content of 19TT in DFS-X increased and the content of 20TT–24TT decreased. The pentacyclic terpanes are dominated by hopane series, which include 12 substances: 18α(H)-22, 29, 30-trisnorneohopane (Ts), 17α(H)-22, 29, 30-trisnorhopane (Tm), C28 bisnohopane (28BH), C29 17α(H), 21β(H) hopane (29H), 18α(H)-30-norneohopane (29Ts), 30H, C30 17β(H), 21α(H) hopane (30M), C31 17α(H), 21β(H), 22S homohopane (31HS), C31 17α(H), 21β(H), 22R homohopane (31HR), 32HS, 32HR, and 33HS in the samples. Most samples, except DFS-M68 and LS, lack 32HR and 33HS hopanes in the coalbed-produced water samples
Table 2. Component Concentrations of Tri- and Pentacyclic Terpanes (ng/L).
| compound | abbreviation | m/z | DFS-45 | DFS-69 | DFS-128 | DFS-133 | DFS-148 | DFS-M68 | DFS-X | LS |
|---|---|---|---|---|---|---|---|---|---|---|
| C19 tricyclic terpane | 19TT | 191 | 0.3 | 0.6 | 0.8 | 0.5 | 0.5 | 0.4 | 0.8 | 0.8 |
| C20 tricyclic terpane | 20TT | 191 | 0.3 | 0.1 | 0.1 | 0.1 | 0.1 | 0.6 | 0.1 | 0.1 |
| C21 tricyclic terpane | 21TT | 191 | 0.2 | 0.2 | 0.2 | 0.2 | 0.1 | 0.3 | 0.2 | 0.3 |
| C22 tricyclic terpane | 22TT | 191 | 0.1 | 0.1 | 0.1 | 0.2 | 0.3 | 0.1 | ||
| C23 tricyclic terpane | 23TT | 191 | 0.2 | 0.2 | 0.2 | 0.2 | 0.2 | 0.3 | 0.2 | 0.3 |
| C24 tricyclic terpane | 24TT | 191 | 0.2 | 0.1 | 0.2 | 0.2 | 0.2 | 0.4 | 0.2 | 0.3 |
| C25 tricyclic terpane | 25TT | 191 | 0.1 | 0.1 | 0.1 | 0.1 | 0.1 | 0.1 | 0.1 | 0.2 |
| C26 tricyclic terpane | 26TTa | 191 | 0.1 | 0.1 | 0.1 | 0.1 | 0.1 | 0.2 | 0.1 | 0.2 |
| C26 tricyclic terpane | 26TTb | 191 | 0.1 | 0.1 | 0.1 | 0.1 | 0.1 | 0.2 | 0.1 | 0.1 |
| C28 tricyclic terpane | 28TTa | 191 | 0.04 | 0.1 | 0.2 | 0.1 | 0.1 | 0.3 | 0.2 | 0.2 |
| C28 tricyclic terpane | 28TTb | 191 | 0.1 | 0.1 | 0.1 | 0.1 | 0.1 | 0.2 | 0.2 | |
| C29 tricyclic terpane | 29TTa | 191 | 0.1 | 0.1 | 0.2 | 0.1 | 0.2 | 0.2 | 0.2 | |
| C29 tricyclic terpane | 29TTb | 191 | 0.1 | 0.1 | 0.1 | 0.2 | 0.2 | |||
| C30 tricyclic terpane | 30TTa | 191 | 0.1 | 0.1 | 0.1 | 0.2 | ||||
| C30 tricyclic terpane | 30TTb | 191 | 0.1 | |||||||
| tricyclic terpane total | 1.6 | 2.0 | 2.2 | 1.9 | 2.1 | 3.5 | 2.7 | 3.2 | ||
| 18a(H)-22,29,30-trisnorneohopane | Ts | 191 | 0.2 | 0.2 | 0.2 | 0.2 | 0.2 | 0.4 | 0.2 | 0.3 |
| 17a(H)-22,29,30-trisnorneohopane | Tm | 191 | 0.2 | 0.1 | 0.1 | 0.1 | 0.2 | 0.4 | ||
| C28 bisnorneohopane | 28BH | 191 | 0.1 | 0.2 | 0.1 | 0.1 | 0.1 | 0.2 | ||
| C29 17α(H),21β(H) hopane | 29H | 191 | 0.3 | 0.4 | 0.5 | 0.4 | 0.4 | 0.5 | 0.5 | 0.8 |
| 18-α(H)-30-norneohopane | 29Ts | 191 | 0.1 | 0.3 | 0.1 | |||||
| C30 17α(H),21β(H) hopane | 30H | 191 | 0.7 | 0. 6 | 0.7 | 0.6 | 0.6 | 1.4 | 0.6 | 1.0 |
| C30 17β(H),21α(H) hopane | 30M | 191 | 0.3 | 0.1 | ||||||
| C31 17α(H),21β(H) 22S homohopane | 31HS | 191 | 0.2 | 0.3 | 0.2 | 0.2 | 0.3 | 0.3 | 0.4 | |
| C31 17α(H),21β(H) 22R homohopane | 31HR | 191 | 0.2 | 0.2 | 0.4 | 0.2 | 0.3 | |||
| C32 17α(H),21β(H) 22S homohopane | 32HS | 191 | 0.1 | 0.2 | 0.3 | 0.1 | ||||
| C32 17α(H),21β(H) 22R homohopane | 32HR | 191 | 0.4 | 0.1 | ||||||
| C33 17α(H),21β(H) 22S homohopane | 33HS | 191 | 0.1 | |||||||
| hopane total | 1.5 | 2.0 | 1.7 | 1.5 | 1.9 | 4.4 | 2.6 | 3.4 |
4.4. Steranes (m/z = 217, 218)
Regular steranes (m/z = 217, 218) are also essential biomarker compounds, and 12 steranes, including C27 5α(H), 14β(H), 17β(H), 20R (αββ20R), C27 5α(H), 14β(H), 17β(H), the 20S (αββ20S), C28αββ20R, C28αββ20S, C29αββ20R, C29αββ20S, C27 5α(H), 14α(H), 17α(H), 20R (ααα20R), C28ααα20R, C29ααα20R, C27ααα20S, C28ααα20S, and C29ααα20S are detected in all water samples. The absolute content values of these compounds are demonstrated in Table 3. The contents of sterane in all samples range from 0.46 to 0.92 ng/L, significantly lower than the content of n-alkanes and tri- and pentacyclic terpenes. The absolute content of steranes in sample DFS-X is lower than that in the in situ coalbed-produced water sample DFS-M68.
Table 3. Component Concentrations of Steranes (ng/L).
| compound | abbreviation | m/z | DFS-45 | DFS-69 | DFS-128 | DFS-133 | DFS-148 | DFS-M68 | DFS-X | LS |
|---|---|---|---|---|---|---|---|---|---|---|
| C27 5α(H),14β(H),17β(H)20R sterane | C27αββ20R | 218 | 0.05 | 0.07 | 0.08 | 0.07 | 0.07 | 0.12 | 0.09 | 0.10 |
| C27 5α(H),14β(H),17β(H) 20S sterane | C27αββ20S | 218 | 0.04 | 0.05 | 0.07 | 0.05 | 0.05 | 0.08 | 0.06 | 0.09 |
| C28 5α(H),14β(H),17β(H) 20R sterane | C28αββ20R | 218 | 0.03 | 0.04 | 0.05 | 0.05 | 0.04 | 0.06 | 0.04 | 0.07 |
| C28 5α(H),14β(H),17β(H) 20S sterane | C28αββ20S | 218 | 0.04 | 0.04 | 0.06 | 0.04 | 0.05 | 0.06 | 0.04 | 0.07 |
| C29 5α(H),14β(H),17β(H) 20R sterane | C29αββ20R | 218 | 0.05 | 0.04 | 0.06 | 0.04 | 0.04 | 0.08 | 0.04 | 0.06 |
| C29 5α(H),14β(H),17β(H) 20S sterane | C29αββ20S | 218 | 0.04 | 0.04 | 0.05 | 0.04 | 0.04 | 0.08 | 0.04 | 0.07 |
| C27 5α(H),14α(H),17α(H) 20R sterane | C27ααα20R | 217 | 0.06 | 0.08 | 0.09 | 0.06 | 0.05 | 0.08 | 0.07 | 0.08 |
| C28 5α(H),14α(H),17α(H) 20R sterane | C28ααα20R | 217 | 0.03 | 0.05 | 0.06 | 0.04 | 0.05 | 0.08 | 0.05 | 0.08 |
| C29 5α(H),14α(H),17α(H) 20R sterane | C29ααα20R | 217 | 0.03 | 0.05 | 0.04 | 0.05 | 0.05 | 0.07 | 0.04 | 0.06 |
| C27 5α(H),14α(H),17α(H) 20S sterane | C27ααα20S | 217 | 0.05 | 0.06 | 0.08 | 0.06 | 0.06 | 0.08 | 0.07 | 0.11 |
| C28 5α(H),14α(H),17α(H) 20S sterane | C28ααα20S | 217 | 0.03 | 0.04 | 0.05 | 0.04 | 0.03 | 0.04 | 0.03 | 0.07 |
| C29 5α(H),14α(H),17α(H) 20S sterane | C29ααα20S | 217 | 0.02 | 0.05 | 0.04 | 0.03 | 0.03 | 0.07 | 0.04 | 0.06 |
| total | 0.46 | 0.62 | 0.71 | 0.58 | 0.54 | 0.89 | 0.61 | 0.92 |
4.5. Stable Isotopic Composition of Methane
The distribution characteristic of the stable carbon isotopic compositions of methane (δ13C1) in the Dafosi gas field ranges from −87.2 to −68.9‰ (detailed information see the literature5). δ13C1 values are lower than −55.0‰, indicating that the methane in the study area is typical biogenic gas.30 Meanwhile, there is historical evidence of coal being biodegradaded in this area. The fractional values of α(CO2–CH4) and α(CH4–H2O) vary from 1.06 to 1.07 and 1.21 to 1.22, respectively, determining that the CO2 reduction pathway produced the microbial methane.5
5. Discussion
5.1. OM Sources of Coalbed-Produced Water
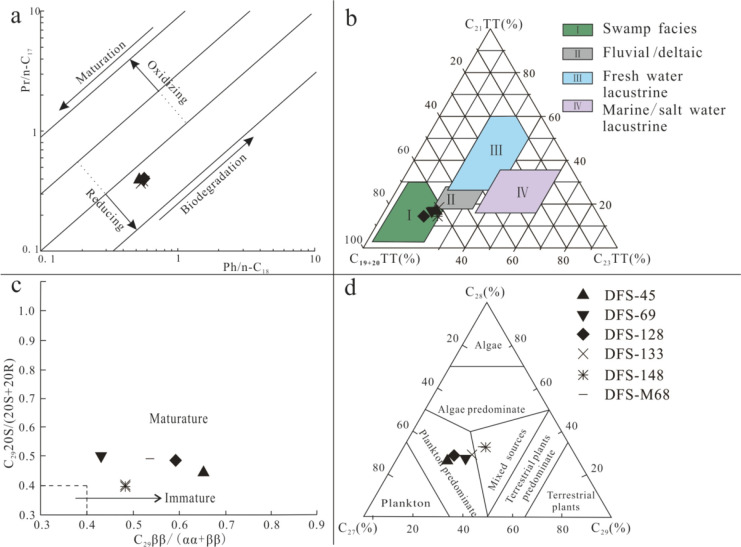
The OM sources of coalbed-produced water samples in the Dafosi gas field are determined according to various biomarker parameters (Pr/Ph, Ph/n-C17, Ph/n-C18, steranes, terpenes, etc.) (Table 4). The distribution characteristics of n-alkanes effectively reflect the information regarding the sedimentary environment, parent material source, and OM maturity.31,32 The Pr/Ph ratio is often used to judge the changes in the sedimentary environment by comparing oil and the source.32 According to the redox index of Pr/Ph proposed by Brooks and Smith,33 the inputted OM of water samples in the Dafosi gas field is produced under reducing conditions. The correlation between Pr/n-C17 and Ph/n-C18 (Figure 5a) can also reflect the reduction environment of coalbed-produced water samples. The CPI and OPE values of water samples are about 1, indicating that the OM is dominated by marine input and entered the mature stage.32,34 The ∑nC21–/ ∑nC21+ values of water samples in the Dafosi gas field range from 1.3 to 1.65, indicating that the parent material is mainly from aquatic organisms, such as plankton or algae.22 The sedimentary facies identify that the input OM of coalbed-produced water samples in the Dafosi gas field is formed in swamp facies (Figure 5b). The correlation of sterane isomerization parameters presents input OM from produced water samples all in the mature stage (Figure 5c), and the source rocks have entered the oil generation window.35−37 According to the triangle diagram of sterane (C27, C28, C29) content (Figure 5d), it can be inferred that DFS-45, DFS-69, DFS-128, and DFS-133 mainly derive their parent material inputs from plankton, whereas DFS-148 and DFS-M68 exhibit mixed sources.
Table 4. Geochemical Parameters of All Water Samplesa.
| sample ID | Pr/Ph | Pr/C17 | Ph/C18 | main carbon | CPI | OEP | ∑nC21–/∑nC22+ | C2920S/(20S+20R) | C29ββ/(ββ+αα) | C27/% | C28/% | C29/% | C19+20 TT/% | C21 TT/% | C23 TT/% |
|---|---|---|---|---|---|---|---|---|---|---|---|---|---|---|---|
| DFS-45 | 0.33 | 0.38 | 0.52 | C20 | 0.95 | 0.97 | 1.34 | 0.32 | 0.45 | 53.11 | 26.18 | 20.71 | 62.92 | 16.85 | 20.22 |
| DFS-69 | 0.31 | 0.39 | 0.57 | C20 | 0.78 | 0.93 | 1.63 | 0.54 | 0.47 | 45.17 | 27.28 | 27.56 | 64.88 | 16.58 | 18.53 |
| DFS-128 | 0.38 | 0.39 | 0.57 | C20 | 0.74 | 0.95 | 1.63 | 0.44 | 0.65 | 49.13 | 28.67 | 22.20 | 69.25 | 14.25 | 16.50 |
| DFS-133 | 0.27 | 0.36 | 0.54 | C20 | 0.74 | 0.91 | 1.62 | 0.50 | 0.43 | 41.68 | 28.99 | 29.32 | 61.06 | 18.39 | 20.55 |
| DFS-148 | 0.19 | 0.38 | 0.56 | C20 | 0.73 | 0.93 | 1.51 | 0.49 | 0.59 | 34.40 | 32.51 | 33.09 | 63.73 | 14.29 | 21.98 |
| DFS-M68 | 0.30 | 0.38 | 0.52 | C20 | 1.09 | 0.97 | 1.35 | 0.45 | 0.42 | 35.74 | 32.72 | 31.54 | 63.69 | 18.45 | 17.86 |
∑nC21–/∑nC22+indicates (Cmin + ··· + C21)/(C21 + ··· + Cmax), CPI = {(C25 + C27 + C29 + C31 + C33)[1/(C24 + C26 + C28 + C30 + C32) + 1/(C26 + C28 + C30 + C32 + C34)/2}, OEP = [(Ci + 6Ci+2 + Ci+4)/4(Ci+1 + Ci+3)]mi+1C2920S/(20S+20R) = C29ααα20S/(C29ααα20R + C29ααα20S). C29ββ/(ββ+αα) = C29αββ20R/(C29αββ20R + C29ααα20R). C27% = C27/(C27 + C28 + C29), C28% = C28/(C27 + C28 + C29), C29% = C29/(C27 + C28 + C29), C19+20TT% = C19+20TT/(C19+20TT + C21TT + C23TT), C21TT% = C21TT/(C19+20TT + C21TT + C23TT), C23TT% = C23TT/(C19+20TT + C21TT + C23TT).
Figure 5.
(a) Relationship between Pr/n-C17 and Ph/n-C18.34 (b) C19–20TT, C21TT, and C23TT triangle plot.37 (c) Correlation of sterane isomerization parameters.38 (d) C27–C28-C29 regular sterane triangle plot.39
5.2. Biodegradation Evidence and Sensitivity of Biomarkers Compound in Coalbed-Produced Water Samples
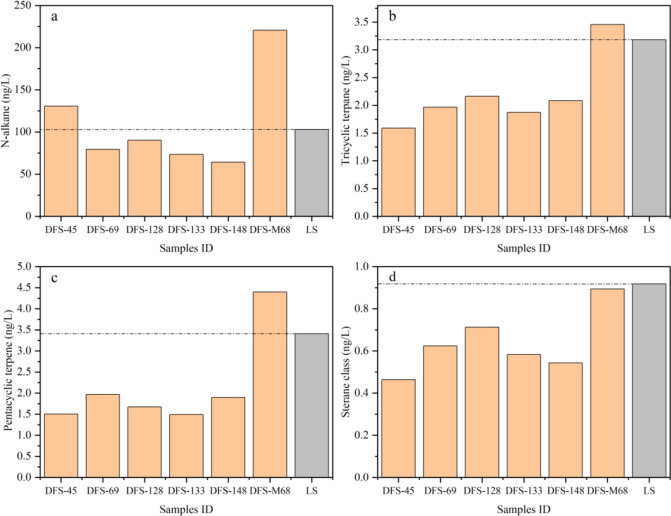
The water produced from the coal seam undergoes a long-term water-rock (coal) interaction, including biodegradation. To explore whether the microbial degradation of coal organic matter has occurred in coalbed aquifers, we compared the variation features of n-alkanes, tri- and pentacyclic terpenes, and steranes extracted from water and LS samples. The content difference of organic compounds between LS and the Dafosi coalbed-produced water samples reflects the geologic evolution process of coalbed water experienced in history. Except for the DFS-45 and DFS-M68 samples in n-alkanes (Figure 6a) and DFS-M68 sample in tri- and pentacyclic terpenes (Figures 6b,c), most of these compounds in the coalbed-produced water samples are lower than that of LS sample (Figure 6a–d), reflecting that the underground waters in the coal seam have been affected by a particular factor. Because the water–coal interaction has been experienced in the Dafosi gas field for a long history,6 the content of organic compounds in the natural samples should be much more than that of the indoor simulation sample (LS). Combining with the data of gas drying coefficient (C1/C2+), methane and carbon dioxide stable isotopic composition, and the evolutionary histories of tectonic-burial, thermal, and hydrocarbon generation of the no. 4 coal seam in the study area,5 biogenic gas accounts for a large proportion of the CBM resources in the Dafosi gas field, reflecting that the biodegradation has been occurring in the coal seam underground. While coal biodegradation and biogenic gas generation have occurred mainly since Paleogene to date,5 and biogenic methane is more depleted in 13C than thermogenic methane,40 the occurrence of isotopically 13C-depleted methane in the Dafosi gas field likely suggests that fresh methane has been released from the ongoing biodegradation and methanogenesis. In addition, the depletion of the aliphatic hydrocarbons in wells DFS-M68 and DFS-X and the appearance of UCMs in all samples also prove the occurrence of biodegradation.23,24,26 Therefore, microbial degradation is the main controlling factor for the variation of the compound content in the Dafosi coalbed-produced water samples.
Figure 6.
Distribution of extracted compounds content in the Dafosi coalbed-produced water and LS samples ((a) n-alkanes; (b) tricyclic terpenes; (c) pentacyclic terpenes; (d) sterane class).
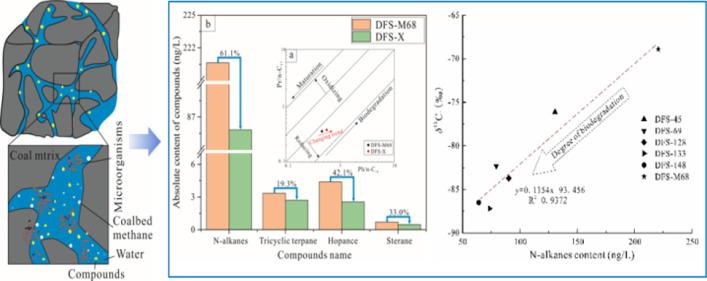
Biological sensitivity refers to the inherent characteristics of substances determining the sequence of biodegradation. The biodegradation degree will amplify the difference in the substance content with a time increase. The DFS-X sample is obtained by indoor anaerobic biodegradation of the produced water sample—DFS-M68, which has the highest range of biomarker compounds in all coalbed-produced water samples. The correlation between Pr/n-C17 and Ph/n-C18 (Figure 7a) shows that OM is biodegraded from DFS-M68 produced water sample to the DFS-X sample. The contents of n-alkanes, tri- and pentacyclic terpenes, and steranes decrease obviously from DFS-M68 to DFS-M68X samples after indoor anaerobic biodegradation, demonstrating that the OM in the coalbed-produced water is degraded again by microorganisms during the period of anaerobic culture. The differential depletion rate among the aliphatic hydrocarbon homologues provides evidence of possible biodegradation in this region and reveals the different biological sensitivities among aliphatic hydrocarbon homologues. The most significant decline is 61.1% in n-alkanes, followed by 42.1% in hopanes, 33.0% in steranes, and 19.3% in tricyclic terpenes (Figure 7b), indicating that the n-alkanes and hopanes are the most sensitive compounds during the process of biodegradation, higher than the steranes and tricyclic terpenes in the coalbed-produced water samples. The biodegradation order of hydrocarbons in coal is similar to that of crude oil.41−43 Coal seam water is one of the critical potential environments for coal biodegradation, and the variation of biosensitive compound content in the coalbed-produced waters unquestionably provides access for identifying the biodegradation process.
Figure 7.
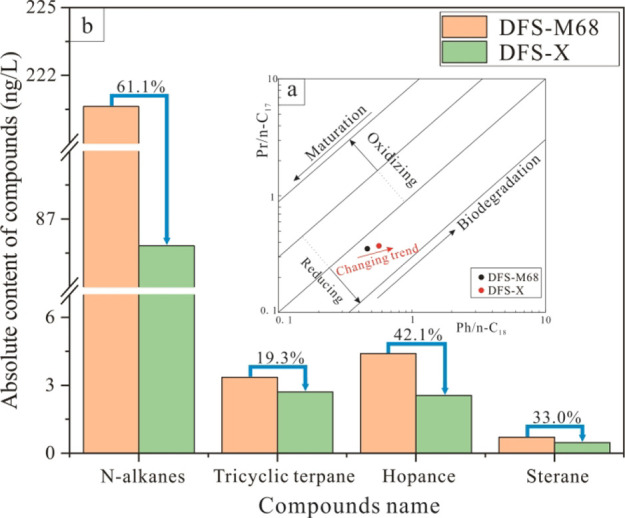
Variation of biosensitivity compounds extracted from coalbed-produced waters before and after microbial degradation (a) Relationship between Pr/n-C17 and Ph/n-C18.36 (b) Substance content of n-alkane, tricyclic terpane, hopance, and sterane.
5.3. Correlation between the n-Alkane Content and Methane Carbon Isotope
The isotopic index of δ13C1 has been widely used for identifying the gas genetic type, gas source, and methane generation pathway.5,44,45 Methane isotopic composition in natural gas is governed by the OM source and thermal maturity. Generally, methane generated from type III kerogen and coal has a much heavier carbon isotopic value than that from type I & II kerogens, while various sourced methane tends to be isotopically heavier with increasing maturity. Biogenic CBM has a light value of δ13C1 with less than −60 or −55‰, while thermogenic CBM has much heavier δ13C1 values.46,47 As most producible CBM likely has a mixture origin from both thermogenic and biogenic, the δ13C1 values are rarely lighter than −60‰. Unusually isotopically depleted methane most likely indicates ongoing biodegradation and biogenic methane generation without extensive mixing of pre-existing gas.46 As n-alkanes, representative aliphatic hydrocarbon homologues, are preferential substrates for biodegradation,3 they are also the most sensitive compounds for biodegradation in coalbed-produced water samples. Therefore, the correlation between the n-alkanes content and the δ13C1 value of CBM may provide supportive evidence of microbial activity. Our data illustrated a positive relationship with a correlation coefficient (R2=0.94) (Figure 8). The more consumption of n-alkanes, the more depleted 13C in methane. DFS-148 and DFS-133 wells have the lowest δ13C1 value below −85‰, where the n-alkane concentration in the coalbed-produced water is lower than other wells (Figure 6a). The content of n-alkanes in well DFS-M68 is the highest among the studied samples, where not only the biogenic CBM has the lowest range6 but also methane has the heaviest isotopic value (−68.9‰). The mutual confirmation of n-alkane concentration and the δ13C1 value provides a new perspective from the variation of n-alkane content in coalbed-produced water for identifying the degree of biodegradation.
Figure 8.
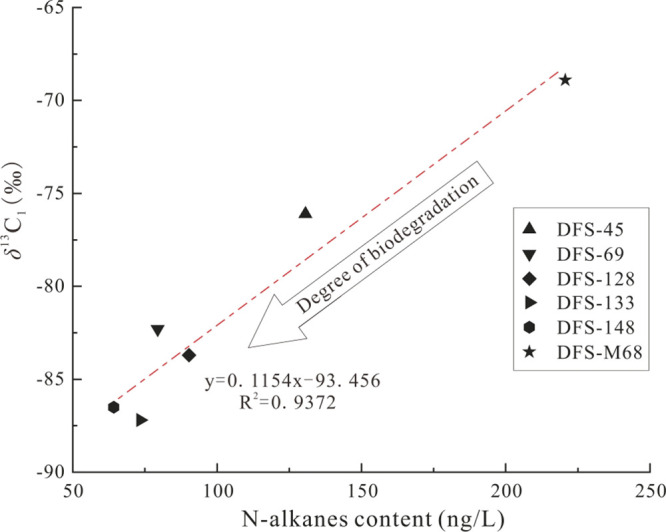
Correlation between the n-alkane content and the δ13C1 value in the Dafosi gas field.
6. Conclusions
A coal seam aquifer plays a crucial role in providing essential nutrients and electron donors, possibly oxidants for microbial activity. Various types of organic matter (OM), including aliphatic hydrocarbons, polycyclic aromatic hydrocarbons, heterocyclic phenols, esters, ethers, alcohols, other aromatic compounds, and others, have been identified in the extraction from the coalbed-produced water. These organic components serve as markers for identifying the source and sedimentary environment and act as carbon substrates (especially n-alkanes and isoprenoids compounds) for biodegradation leading to biogenic methane generation. Among these compounds, n-alkanes constitute the majority, with concentrations ranging from 64.2 to 220.6 ng/L followed by hopane derivatives, tricyclic terpanes, and steranes. Generally speaking, the content of these compounds in field-collected waters is lower than that of the LS sample indicating ongoing biodegradation within the coal seams. After comparing changes in OM between DFS-M68 and DFS-X samples during biodegradation processes, varying degrees of decrease were observed in n-alkanes content along with hopanes, steranes, and tricyclic terpanes. Among these compounds, n-alkanes exhibited the highest sensitivity to biological degradation and can therefore be considered an indirect indicator of the extent of biodegradation experienced in the coal seams.
Acknowledgments
This work is supported by the National Natural Science Foundation of China (grant numbers: 42172200; 41972183; 41873049) and the Geological Research Institute for Coal Green Mining of Xi’an University of Science and Technology (grant number: MTy2019-12).
The authors declare no competing financial interest.
References
- Li Y.; Pan S.; Ning S.; Shao L.; Jing Z.; Wang Z. Coal measure metallogeny: Metallogenic system and implication for resource and environment. Science China Earth Sciences 2022, 65 (7), 1211–1228. 10.1007/s11430-021-9920-4. [DOI] [Google Scholar]
- Xu F.; Wang B.; Zhao X.; Yun J.; Zhang S.; Wang H.; Yang Y. Thoughts and suggestions on promoting high quality development of China’s CBM business under the goal of “double carbon. China Petroleum Exploration 2021, 26 (3), 9–18. [Google Scholar]
- Scott A. R.; Kaiser W. R. Thermogenic and secondary biogenic gases, San Juan basin, Colorado and New Mexico-Implications for coalbed gas producibility. AAPG Bull. 1994, 78, 1186–1209. 10.1306/A25FEAA9-171B-11D7-8645000102C1865D. [DOI] [Google Scholar]
- Furmann A.; Schimmelmann A.; Brassell S. C.; Mastalerz M.; Picardal F. Chemical compound classes supporting microbial methanogenesis in coal. Chem. Geol. 2013, 339, 226–241. 10.1016/j.chemgeo.2012.08.010. [DOI] [Google Scholar]
- Bao Y.; Wang W.; Ma D.; Shi Q.; Ali A.; Lv D.; Zhang C. Gas Origin and Constraint of δ13C(CH4) Distribution in the Dafosi Mine Field in the Southern Margin of the Ordos Basin. China. Energy & Fuels 2020, 34 (11), 14065–14073. 10.1021/acs.energyfuels.0c02926. [DOI] [Google Scholar]
- Bao Y.; An C.; Wang C.; Guo C.; Wang W. Hydrogeochemical Characteristics and Water-Rock Interactions of Coalbed-Produced Water Derived from the Dafosi Biogenic Gas Field in the Southern Margin of Ordos Basin. China. Geofluids 2021, 2021, 1–13. 10.1155/2021/5972497. [DOI] [Google Scholar]
- Orem W. H.; Voytek M. A.; Jones E. J.; Lerch H. E.; Bates A. L.; Corum M. D.; Warwick R. D.; Clark A. C. Organic intermediates in the anaerobic biodegradation of coal to methane under laboratory conditions. Org. Geochem. 2010, 41 (9), 997–1000. 10.1016/j.orggeochem.2010.03.005. [DOI] [Google Scholar]
- Sabar M. A.; Ali M. I.; Fatima N.; Malik A. Y.; Jamal A.; Farman M.; Huang Z.; Urynowicz M. Degradation of low rank coal by Rhizopus oryzae isolated from a Pakistani coal mine and its enhanced releases of organic substances. Fuel 2019, 253, 257–265. 10.1016/j.fuel.2019.04.101. [DOI] [Google Scholar]
- Strąpoć D.; Mastalerz M.; Dawson K.; Macalady J.; Callaghan A. V.; Wawrik B.; Turich C.; Ashby M. Biogeochemistry of Microbial Coal-Bed Methane. Annual Review of Earth & Planetary Sciences 2011, 39 (1), 617–656. 10.1146/annurev-earth-040610-133343. [DOI] [Google Scholar]
- Zhou Z.; Zhang C. J.; Liu P. F.; Fu L.; Laso-Pérez R.; Yang L.; Bai L.; Li J.; Yang M.; Lin J.; Wang W.; Wegener G.; Li M.; Cheng L. Non-syntrophic methanogenic hydrocarbon degradation by an archaeal species. Nature 2022, 601 (7892), 257–262. 10.1038/s41586-021-04235-2. [DOI] [PubMed] [Google Scholar]
- Lloyd M. K.; Trembath-Reichert E.; Dawson K. S.; Feakins S. J.; Mastalerz M.; Orphan V. J.; Sessions L.; Eiler J. M. Methoxyl stable isotopic constraints on the origins and limits of coal-bed methane. Science 2021, 374 (6569), 894–897. 10.1126/science.abg0241. [DOI] [PubMed] [Google Scholar]
- Bao Y.; Huang H.; He D.; Ju Y.; Qi Y. Microbial enhancing coal-bed methane generation potential, constraints and mechanism - A mini-review. Journal of Natural Gas Science & Engineering 2016, 35, 68–78. 10.1016/j.jngse.2016.08.035. [DOI] [Google Scholar]
- Li D.; Bao Y.; Wang Y.; An C.; Chang J. Multiple-experimental investigation on the physicochemical structures alternation during coal biogasification. Fuel 2023, 339, 127433–1274. 10.1016/j.fuel.2023.127433. [DOI] [Google Scholar]
- Huang H.; Larter S. R.; Bowler B. F. J.; Oldenburg T. B. P. A dynamic biodegradation model suggested by petroleum compositional gradients within reservoir columns from the Liaohe basin, NE China. Org. Geochem. 2004, 35 (3), 299–316. 10.1016/j.orggeochem.2003.11.003. [DOI] [Google Scholar]
- Larter S.; Huang H.; Adams J.; Bennett B.; Jokanola O.; Oldenburg T.; Jones M.; Head I.; Riediger C.; Fowler M. The controls on the composition of biodegraded oils in the deep subsurface: Part II-Geological controls on subsurface biodegradation fluxes and constraints on reservoir-fluid property prediction. AAPG Bulletin 2006, 90 (6), 921–938. 10.1306/01270605130. [DOI] [Google Scholar]
- Maharaj S. V.; Orem W. H.; Tatu C. A.; Lerch H. E.; Szilagyi D. N. Organic compounds in water extracts of coal: links to Balkan endemic nephropathy. Environmental Geochemistry Health 2014, 36 (1), 1–17. 10.1007/s10653-013-9515-1. [DOI] [PMC free article] [PubMed] [Google Scholar]
- Akob D. M.; Cozzarelli I. M.; Dunlap D. S.; Rowan E. L.; Lorah M. M. Organic and inorganic composition and microbiology of produced waters from Pennsylvania shale gas wells. Appl. Geochem. 2015, 60, 116–125. 10.1016/j.apgeochem.2015.04.011. [DOI] [Google Scholar]
- Orem W.; Tatu C.; Varonka M.; Lerch H.; Bates A.; Engle M.; Crosby L.; McIntosh J. Organic substances in produced and formation water from unconventional natural gas extraction in coal and shale. Int. J. Coal Geol. 2014, 126, 20–31. 10.1016/j.coal.2014.01.003. [DOI] [Google Scholar]
- Burazer N.; Šajnović A.; Vasić N.; Kašanin-Grubin M.; Životić D.; Mendonça Filho J. G.; Vulić P.; Jovančićević B. Influence of paleoenvironmental conditions on distribution and relative abundance of saturated and aromatic hydrocarbons in sediments from the NW part of the Toplica basin, Serbia. Mar. Pet. Geol. 2020, 115, 104252–1052. 10.1016/j.marpetgeo.2020.104252. [DOI] [Google Scholar]
- Farhaduzzaman M.; Abdullah W. H.; Islam M. A. Petrographic characteristics and palaeoenvironment of the Permian coal resources of the Barapukuria and Dighipara Basins, Bangladesh. J. Asian Earth Sci. 2013, 64, 272–287. 10.1016/j.jseaes.2012.12.017. [DOI] [Google Scholar]
- Hakimi M. H.; Abdullah W. H.; Areeq N. M. A. Organic geochemical characteristics and depositional environments of the Upper Cretaceous coals in the Jiza-Qamar Basin of eastern Yemen. Fuel 2014, 118, 335–347. 10.1016/j.fuel.2013.11.007. [DOI] [Google Scholar]
- Yi L.; Liu Z.; Chen Z.; Li M. Thermal maturity, source characteristics, and migration directions for the Ordovician oil in the Central Tabei Uplift, Tarim Basin: Insight from biomarker geochemistry. J. Pet. Sci. Eng. 2020, 189, 106975–1075. 10.1016/j.petrol.2020.106975. [DOI] [Google Scholar]
- Ahmed M.; Smith J. W.; George S. C. Effects of biodegradation on Australian Permian coals. Org. Geochem. 1999, 30 (10), 1311–1322. 10.1016/S0146-6380(99)00104-7. [DOI] [Google Scholar]
- Ahmed M.; Smith J. W. Biogenic methane generation in the degradation of eastern Australian Permian coals. Org. Geochem. 2001, 32 (6), 809–816. 10.1016/S0146-6380(01)00033-X. [DOI] [Google Scholar]
- Head I. M.; Jones D. M.; Larter S. R. Biological activity in the deep subsurface and the origin of heavy oil. Nature 2003, 426 (6964), 344–352. 10.1038/nature02134. [DOI] [PubMed] [Google Scholar]
- Peters K. E.; Walters C. C.; Moldowan J. M.. Biomarkers and Isotopes in Petroleum Exploration and Earth History. Cambridge University Press: UK: 2005. [Google Scholar]
- Li Y.; Yang J.; Pan Z.; Meng S.; Wang K.; Niu X. Unconventional natural gas accumulations in stacked deposits: a discussion of upper paleozoic coal-bearing strata in the east margin of the Ordos basin, China. Acta Geologica Sinica-English Edition 2019, 93 (1), 111–129. 10.1111/1755-6724.13767. [DOI] [Google Scholar]
- Li Y.; Wang Z.; Pan Z.; Niu X.; Yu Y.; Meng S. Pore structure and its fractal dimensions of transitional shale: A cross-section from east margin of the Ordos Basin. China. Fuel 2019, 241, 417–431. 10.1016/j.fuel.2018.12.066. [DOI] [Google Scholar]
- Orem W. H.; Tatu C. A.; Lerch H. E.; Rice C. A.; Bartos T. T.; Bates A. L.; Tewalt S.; Corum M. D. Organic compounds in produced waters from coalbed natural gas wells in the Powder River Basin, Wyoming, USA. Appl. Geochem. 2007, 22 (10), 2240–2256. 10.1016/j.apgeochem.2007.04.010. [DOI] [Google Scholar]
- Whiticar M. J. Carbon and hydrogen isotope systematics of bacterial formation and oxidation of methane - ScienceDirect. Chem. Geol. 1999, 161 (1–3), 291–314. 10.1016/S0009-2541(99)00092-3. [DOI] [Google Scholar]
- Volkman J. K.; Farrington J. W.; Gagosian R. B.; Wakeham S. G. Lipid composition of coastal marine sediments from the Peru Upwelling Region. Adv. Org. Geochem. 1981, 1983, 228–240. [Google Scholar]
- Zhang M.; Liu C.; Tian J.; Lu Z.; Pang H.; Zeng X.; Kong H.; Yang S. Geochemical characteristics of crude oil and oil-source correlation in the western Qaidam Basin. China. Journal of Natural Gas Geoscience 2020, 5 (4), 227–238. 10.1016/j.jnggs.2020.06.001. [DOI] [Google Scholar]
- Brooks J. D.; Smith J. W. The diagenesis of plant lipids during the formation of coal, petroleum and natural gas—II. Coalification and the formation of oil and gas in the Gippsland Basin. Geochim. Cosmochim. Acta 1969, 33 (10), 1183–1194. 10.1016/0016-7037(69)90040-4. [DOI] [Google Scholar]
- Fu J.; Zhang Z.; Chen C.; Wang T. G.; Li M.; Ali S.; Lu X.; Dai J. Geochemistry and origins of petroleum in the Neogene reservoirs of the Baiyun Sag, Pearl River Mouth Basin. Marine and Petroleum Geology 2019, 107, 127–141. 10.1016/j.marpetgeo.2019.05.015. [DOI] [Google Scholar]
- Xu M.; Hou D.; Lin X.; Liu J.; Ding W.; Xie R. Organic geochemical signatures of source rocks and oil-source correlation in the Papuan Basin, Papua New Guinea. J. Pet. Sci. Eng. 2022, 210, 109972–099. 10.1016/j.petrol.2021.109972. [DOI] [Google Scholar]
- Bao Y.; Hu Y.; Wang W.; Guo C.; Wang G. Accumulation model and geochemistry characteristics of oil occurring from Jurassic coal measures in the Huangling mining area of the Ordos Basin, China[J]. Frontiers of Earth Science 2023, 17 (1), 158–169. 10.1007/s11707-022-1038-6. [DOI] [Google Scholar]
- Huang W. Y.; Meinschein W. G. Sterols as ecological indicators. Geochim. Cosmochim. Acta 1979, 43 (5), 739–745. 10.1016/0016-7037(79)90257-6. [DOI] [Google Scholar]
- Safaei-Farouji M.; Kamali M. R.; Rahimpour-Bonab H.; Gentzis T.; Liu B.; Ostadhassan M. Organic geochemistry, oil-source rock, and oil-oil correlation study in a major oilfield in the Middle East. J. Pet. Sci. Eng. 2021, 207, 109074–1090. 10.1016/j.petrol.2021.109074. [DOI] [Google Scholar]
- Xiao H.; Wang T. G.; Li M.; Fu J.; Tang Y.; Shi S.; Yang Z.; Lu X. Occurrence and distribution of unusual tricyclic and tetracyclic terpanes and their geochemical significance in some Paleogene oils from China. Energy Fuels 2018, 32 (7), 7393–7403. 10.1021/acs.energyfuels.8b01025. [DOI] [Google Scholar]
- Schaefer H.; Fletcher S. E. M.; Veidt C.; Lassey K. R.; Brailsford G. W.; Bromley T. M.; Dlugokencky E. J.; Michel S. E.; Miller J. B.; Levin I.; Lowe D. C.; Martin R. J.; Vaughn B. H.; White J. W. C. A 21st-century shift from fossil-fuel to biogenic methane emissions indicated by 13CH4. Science 2016, 352 (6281), 80–84. 10.1126/science.aad2705. [DOI] [PubMed] [Google Scholar]
- Larter S.; Wilhelms A.; Head I.; Koopmans M.; Aplin A.; Di Primio R.; Zwach C.; Erdmann M.; Telnaes N. The controls on the composition of biodegraded oils in the deep subsurface-part 1: biodegradation rates in petroleum reservoirs. Org. Geochem. 2003, 34 (4), 601–613. 10.1016/S0146-6380(02)00240-1. [DOI] [Google Scholar]
- Peters K. E.; Moldowan J. M.. The Biomarker Guide: Interpreting Molecular Fossils in Petroleum and Ancient Sediments. Englewood Cliffs Nj Prentice Hall; 1993. [Google Scholar]
- Sun Y.; Chen Z.; Xu S.; Cai P. Stable carbon and hydrogen isotopic fractionation of individual n-alkanes accompanying biodegradation: evidence from a group of progressively biodegraded oils. Org. Geochem. 2005, 36 (2), 225–238. 10.1016/j.orggeochem.2004.09.002. [DOI] [Google Scholar]
- Bao Y.; Li D.; Ju Y. Constraints of biomethane generation yield and carbon isotope fractionation effect in the pathway of acetotrophic with different coal-rank coals. Fuel 2021, 305, 121493–1293. 10.1016/j.fuel.2021.121493. [DOI] [Google Scholar]
- Conrad R. Quantification of methanogenic pathways using stable carbon isotopic signatures: a review and a proposal. Org. Geochem. 2005, 36 (5), 739–752. 10.1016/j.orggeochem.2004.09.006. [DOI] [Google Scholar]
- Beckmann S.; Luk A.; Gutierrez-Zamora M. L.; Chong N. H. H.; Thomas T.; Lee M.; Manefield M. Long-term succession in a coal seam microbiome during in situ biostimulation of coalbed-methane generation. ISME Journal 2019, 13 (3), 632–650. 10.1038/s41396-018-0296-5. [DOI] [PMC free article] [PubMed] [Google Scholar]
- Rice D. D.; Law B. E.; Rice D. D. Composition and origins of coalbed gas. Hydrocarbon from Coal AAPG Studies in Geology 1993, 38 (1), 159–184. 10.1306/St38577C7. [DOI] [Google Scholar]


