Abstract
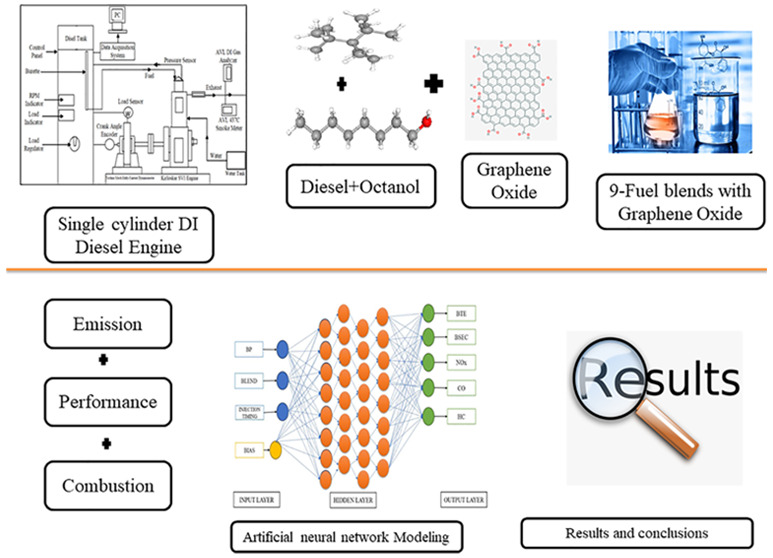
The use of alternative fuels in diesel engines has become more widespread due to a number of factors, including dwindling petroleum supplies, increasing prices for conventional fossil fuels, and environmental worries about pollutants and greenhouse gas emissions from internal combustion engines. Efficiency and emissions need to be appropriately balanced. Alcohols act as oxygenated fuels similar to octanol, offering a number of benefits over traditional fuels and can boost efficiency, enhance combustion, and reduce air pollution. Therefore, the research aimed to enhance the performance and combustion characteristics of a diesel and octanol blend using graphene oxide (GO) nanoparticles as a fuel additive in a single-cylinder diesel engine while reducing emissions. Research findings will contribute significantly to improving the physical and chemical properties of diesel and octanol blends, thereby mitigating the challenges of limited petroleum reserves and environmental concerns. A range of different blends of diesel and octanol were prepared on a volume/volume basis in proportions of D70OCT30, D60OCT40, and D50OCT50, and then GO was added as a fuel additive to the abovementioned blends in varied proportions (40, 60, and 80 ppm) resulting in nine blends. These blends were analyzed in terms of various performance, combustion, and emission characteristics, and the obtained results helped to shed light on the impact of GO as a fuel additive. The results indicated that the fuel blend D70OCT30GO0.006 yielded the highest values. Furthermore, it is highly imperative that we develop a model that can be used to predict engine behavior and its stability without having to run an engine. For this, a data-driven artificial neural network (ANN) model was developed to predict the optimized injection timing for better combustion and reduced emission. The efficiency and prediction capabilities of the model were compared to the experimental data, which indicated that the ANN model had a better prediction score. The injection timing of the engine was optimized from 21 °CA to 21.5 °CA, which increased the efficiency by 1%. The research findings showed significantly improved physical and chemical properties of the blends, thereby mitigating the challenges of limited petroleum reserves and environmental concerns.
1. Introduction
Owing to their great efficiency, power output, and economy, diesel engines continue to be the major source of power in numerous industries, including ship buildings, engineering machines, and power production. The World Energy Council survey reveals that transport energy relies heavily on heavier fuels, such as diesel. The consumption of these fuels is expected to increase significantly by 2040, from 1.5 to 3.8 EJ, indicating the continued importance of diesel engines in powering the world’s transportation systems.1 The growing usage of internal combustion IC engines has led to an energy crisis and severe environmental pollution, despite the fact that they are essential to our civilization and daily lives.2 The engine cylinder’s overconcentration zones and high-temperature flame zones during diffusion combustion are responsible for significant emissions of nitrogen oxide (NOx) and particulate matter (PM) in the diesel exhaust, which pollute the atmosphere3 and can adversely affect human health and increase cardiovascular and lung cancer mortality rates.4 According to the 2003 report by World Health Organization, urban particulate matter (PM10) results in 800 000 deaths every year worldwide. Additionally, the 2002 report by WHO and Ebrary, as well as the study conducted by Löndahl et al. in the same year, indicates that Europe experienced 100 K deaths. There have been suggestions that fine and ultrafine particles, particularly those emanating from combustion sources, are more strongly linked to negative health consequences than larger particles.5 The environmental impact of the emissions from diesel engines extends beyond NOX and PM, as they contribute to acid rain, photochemical smog, ozone depletion, and overall environmental pollution. Therefore, it is crucial for researchers to develop alternative fuels that can effectively reduce both the NOX and PM emissions. Improving air quality has become a major concern in public health, giving its direct correlation with positive health outcomes.6,7
Numerous alternative fuels have been researched, such as natural gas, alcohol, and hydrogen. Research suggests that adding a small amount of hydrogen, which is roughly 1% of the hydrogen-to-ammonia ratio by mass and almost 10% by volume, to ammonia can enhance the performance of ammonia IC engines and achieve a satisfactory combustion speed. Hydrogen has been found to be an effective combustion promoter in these types of engines.8 Owing to its lower exhaust emissions and cost-effectiveness, natural gas is a popular fuel choice globally. Its high octane number makes it a more suitable option for compression ignition (CI) engines that typically operate at high compression ratios. As a gaseous fuel for IC engines, natural gas is considered to be the most promising option. Hence, the idea of combining natural gas and diesel to create a dual-fuel combustion process has gained substantial interest among engine manufacturers and researchers.9 Because it includes oxygen, lowers PM emissions, and is renewable, alcohol is regarded as a superior diesel addition. Biofuels such as alcohols can be derived from biomass resources, which are renewable and offer a potentially limitless supply of feedstock.10 Over the past 10 years, multiple investigations have focused on methanol and ethanol, with particular attention paid to their spraying. Alcohol spray injection works similarly to gasoline injection, producing vortices that spin in opposite directions. Under high ambient back pressure, these vortexes are likely to occur at the middle front of the spray. They occur near the back of the spray, where there is little ambient pressure. The penetration curves of ethanol, methanol, and petrol tend to overlap when the back pressure is low.11 Under equivalent operating conditions, the in-cylinder pressure patterns of biodiesel and biodiesel–ethanol blends are related to those of Euro V diesel fuel, as revealed by combustion tests. The maximum in-cylinder pressure increases along with the increase in the engine load, but its timing shifts away from the top dead center (TDC).12 When it comes to performance, blends show a marginal increase in brake thermal efficiency (BTE) at high loads for all speeds and injection timings compared to diesel fuel. This can be accredited to the swift premixed combustion observed in ethanol blends, facilitated by improved mixing during oxygen enrichment and ignition delay. These circumstances result in “leaner” combustion, greater “constant volume” combustion, and less heat losses.13 Upon analysis of the emission patterns, it is evident that the inclusion of methanol exerts a favorable impact on emissions reduction, mainly in the context of carbon monoxide (CO) and hydrocarbon (HC) emissions. This impact is most noticeable when the proportion of methanol in the fuel blend is below 60%.14 To improve PM emissions, studies have been conducted on methanol and ethanol blending. However, at low temperatures, phase separation occurs, necessitating the addition of an additive to ensure adequate fuel mixing. Alcohols can be classified into two types: short-chain alcohols, such as ethanol, which display blending instability, causing an antisynergistic impact in the midconcentration zone. Higher-chain alcohols like propanol, butanol, and pentanol do not exhibit any antisynergistic effect or have only a minimal effect in the case of propanol.15 As the usage of ethanol blends becomes more prevalent, engine power will inevitably decrease, primarily as a result of the decrease in heating value that is allied with fuel blends, leading to issues with normal combustion in diesel engines when forming a methanol/ethanol-rich bottom phase.16 Researchers have investigated different alcohols17 and pentanol18 and found that they do not exhibit a phase separation issue at low temperatures when deprived of surfactants,19 making them potential blending components for diesel fuels. However, these fuels have longer ignition delays that decrease power performance20 while posing challenges for stable combustion control,21 mostly owing to their low cetane number.22
Studies in the recent past have suggested that n-octanol, which is an eight-carbon straight-chain alcohol, has the potential to be a viable substitute fuel due to its properties, which are alike to diesel fuel, because of its long carbon chain length and absence of branched chains.23 Furthermore, n-octanol has superior cold flow properties compared to biodiesel, making it a probable alternative fuel that can be easily used under cold weather conditions.24 Unlike lower carbon counterparts, n-octanol does not exhibit phase separation issues without surfactants at low temperatures (e.g., alcohol’s pour point is 13.5 °C in contrast to 9 °C for other fuels), and engine modification is not needed. From the production point of view, n-octanol can be obtained from nonfood biomasses such as lignocellulosic biomasses. Its viability for use in CI engines has also been greatly improved by the development of biosynthesis technology.25 Compared with other oxygenated fuels, such as methylal and dimethyl carbonate, octanol has been found to improve the heat release rate and thermal efficiency. In terms of emissions, octanol shows a better NOx and soot emission performance compared with the other oxygenated fuels.26 Gupta and colleagues used different proportions of octanol with diesel in water-cooled CI engines. The results indicated that NOx emissions were reduced by 13.34 and 26.68% for blends D90OCT10 and D60OCT40, respectively. The D60OCT40 blend was found to produce lower CO and smoke emissions.27 According to the research conducted by Rajesh Kumar et al., n-octanol was found to prolong the ignition delay, leading to a higher heat release rate and peak pressure during premixed combustion. The study also revealed that an increase in octanol proportions led to a higher BTE and a decrease in brake-specific fuel consumption (BSFC).28 Wang and colleagues discovered that the diesel–octanol blends exhibited the best BTE and lowest BSFC when the injection pressure was 120 MPa.29 Regarding emissions, the lowest particle number was observed at an injection pressure of 100 MPa. The optimal balances of combustion and emission outcomes were attained at an injection pressure of 100–120 MPa.
To enrich the performance and reduced emission parameters in a diesel engine, Shaafi et al.30 reviewed various techniques for dispersing nanoadditives. Their research revealed that adding carbon nanotubes (CNTs) to a water/diesel emulsion fuel caused lower combustion temperatures, which in turn lowered NOX emissions. Also, compared to water–diesel emulsion fuels without CNTs, catalytic qualities and enhanced combustion characteristics of the CNTs resulted in fewer HC emissions, which in turn led to lower fuel usage. In a study, Atelge et al.31 investigated the influence of a hybrid nanoadditive-containing graphene nanoplate and metal oxide TiO2 on conventional diesel (D) and oxygenated fuels. In comparison to regular diesel and oxygenated fuels, the modified fuels showed enhanced combustion parameters such as the peak in-cylinder pressure, combustion duration, and ignition delay. Furthermore, it was observed that the BTE of modified fuels was 5.5% higher than that of conventional diesel, even when tested under identical conditions. These findings suggest that the use of hybrid nanoadditives could potentially improve the performance of both diesel and oxygenated fuels, thus offering promising prospects for the future of fuel technology. In their research, Ghamari and Rantner32 embarked on a thorough exploration of the impact of carbon-based nanoparticles and particle aggregate morphology on engine combustion. Some of the reports examined during the study are listed in Table 1 (based on alcohol blends) and Table 2 (based on nanoadditives for engines). Through experimental examination, the study revealed that the exceptional optical and thermal properties of carbon nanomaterials, including GO, play a substantial role in significant acceleration of the combustion rate within the engine. This discovery not only sheds light on the intricate mechanisms that govern the combustion process but also highlights the immense potential of carbon nanomaterials for enhancing the engine performance. By delving deeper into the unique properties of these materials, we can unlock new possibilities for innovation and progress in the field of engine design and development.
Table 1. Previous Studies Based on Different Types of Alcohol Fuels.
| author | alcohol fuels | BTE | BSFC | HC | CO | NOX | smoke | ref |
|---|---|---|---|---|---|---|---|---|
| Deshmukh et al. | n-butanol (10–40%) | less compared to diesel but increased with further addition of alcohol, possibly due to improved combustion characteristics attained by the presence of excess oxygen | increased BSFC due to lower heating values | HC increased due to higher latent heat of vaporization | less due to leaning effect of alcohols | less due to lean composition and lower energy content | (33) | |
| n-octanol (10–40%) | similar to diesel at lower and medium loads due to relatively closer heating values | increased BSFC due to lower heating values | HC decreased due to increasing oxygen content | less due to leaning effect of alcohols | less due to lean composition and lower energy content | |||
| Ashok et al. | n-octanol with biodiesel (biodiesel + 10–50% oct) | increased due to higher oxygen content | increases in higher concentrations due to overleaning of alcohol | less due to higher oxygen content | increased at higher concentrations as rich O2 content supersedes the cooling effect of octanol | less due to the presence of excess oxygen molecules | (34) | |
| Mourad et al. | ethanol (10–50%) | increased possibly due to increased oxygen content at higher blend ratios | increased due to heating values | increased in blends of high alcohol content due to lesser heating values | increased in blends of high alcohol content due to lesser heating values | increased with increasing alcohol ratio due to excess oxygen content | (35) | |
| Agarwal et al. | methanol (10–20%) | increased due to higher flame speed of methanol blends | decreased due to the presence of oxygen content in their molecules | increased due to lower in-cylinder temperature at lower speeds but may inverse at higher speeds | decreased at lower loads due to superior mixing of fuel and air, also decreased at higher loads due to combustion at higher temperatures | decreases due to lower in-cylinder temperature | decreased due to high oxygen content and less carbon content | (36) |
| Yaman et al. | pentanol (5–20%) | increased due to appropriate atomization characteristics and acceleration in the mixing process | decreased due to improved combustion reaction, resulting from excess oxygen content | lesser due to fewer carbon atoms present in the blend | decreases with increase of alcohol concentration due to high latent heat of vaporization and low adiabatic flame temperature, which decreases the in-cylinder temperature | (37) | ||
| Nour et al. | hexanol (10–50%) | increases due to high oxygen concentration, which increases ignition delay | increased due to lower energy content compared to diesel | decreased due to the reduction of flame temperature due to the high enthalpy of vaporization of n-hexanol | decreases with increase in hexanol proportion as the excess oxygen content accelerates the soot oxidation process | (38) |
Table 2. Previous Studies Based on Different Ratios of Graphene Oxide Nanoadditives.
| alcohol | GO-mixed blends | BTE | BSFC | HC | CO | NOX | smoke | ref |
|---|---|---|---|---|---|---|---|---|
| Soudagar et al.; dairy scum oil with biodiesel and GO as additive | (biodiesel and biodiesel + GO) 20, 40, and 60 ppm | biodiesel BTE is less compared to diesel but increased when GO is added, which reduces ignition delay and improves thermal exchange process | reduced compared to biodiesel when GO is added as GO acts as a fuel catalyst | decreased when GO is added, due to better atomization of fuel | decreased due to higher oxygen concentration | similar to diesel but found highest for GO 60 ppm, due to high viscosity and flame temperature | reduced when GO is added up to 40 ppm, due to larger surface-area-to-volume ratio of GO | (39) |
| Hoseini et al.; biodiesel with GO additive | (3-biodiesel + 3- GO) 30, 60, and 90 ppm | increases due to GO catalytic activity, which reduces ignition delay | decreased due to increase of cetane number | decreased due to high oxygen content and cetane number that reduced ignition delay | decreased due to high oxygen content when GO concentration is increased | less compared to biodiesel with the addition of GO | (40) | |
| Khan et al.; biodiesel emulsion with GO additive | (biodiesel + 4GO) 30, 60, 90, and 120 ppm | increases with increase in GO concentration as GO acts as an oxygen buffer | decreased due to GO’s high catalytic activity and reactive surface area | decreased due to high catalytic activity of GO, which accelerates combustion | decreased as GO enhances oxidation, combustion rate, and calorific value | increased due to excess oxygen content in biodiesel and oxygen buffering additive | reduced due to high thermal conductivity of GO | (41) |
| Razzaq et al.; palm biodiesel with GO additive | (biodiesel + 3 GO) 40, 80, and 120 ppm | increases as GO improves ignition delay | decreased as GO improves the combustion mechanism due to high thermal conductivity | decreases with increase in GO concentration due to its large reactive surface | decreased due to excess oxygen content with increase in GO concentration | reduced due to the improved ignition delay with the addition of GO | (42) | |
| Hoseini et al.; biodiesel with GO additive | (biodiesel + 3 GO) 30, 60, and 90 ppm | increased due to decrease in combustion duration and increased heat of evaporation of fuel | decreased due to higher latent heat of vaporization | decreases due to extra oxygen content as it improves the combustion process | decreased due to high cetane number of biodiesel and large surface area for reaction of GO | increased due to excess oxygen content and high in-cylinder temperature | (43) | |
| El-Seesy et al.; higher alcohol blends with GO as additive | (3 alcohols + 2 GO) 25 and 50 ppm | increased due to enhanced cylinder pressure and improved combustion rate | decreased due to improved carbon oxidation rate | decreased due to high oxygen content and shorter combustion duration | decreased due to enhanced combustion efficiency and advanced combustion phasing | increased as the improved combustion process increases the in-cylinder temperature | reduced due to GO large surface area of reaction | (44) |
1.1. Objective
Introducing GO as a fuel additive in diesel–octanol blends holds immense promise for achieving high-performance combustion and reducing emissions. By combining diesel and 1-octanol on a volume basis, we can leverage the advantages of both components to enhance the overall efficiency and environmental impact of diesel engines. 1-Octanol, a renewable and oxygenated fuel, exhibits improved combustion characteristics, including better ignition quality and reduced soot formation, leading to enhanced engine performance and reduced PM emissions. Additionally, the inclusion of GO as a nanoadditive offers several benefits. Graphene oxide’s exceptional thermal conductivity and surface area promote more efficient fuel combustion, resulting in increased power output and reduced fuel consumption. Moreover, its ability to act as a nanocatalyst facilitates better fuel–air mixing, leading to cleaner and more complete combustion and thus minimizing harmful emissions. Overall, the combined use of octanol and GO in diesel–octanol blends has the potential to revolutionize diesel engine technology by optimizing performance, combustion efficiency, and environmental sustainability.
1.2. Motivation
Although electric vehicles have gained significant attention as a sustainable transportation solution, they also have certain disadvantages. Limited driving range, long charging times, and a lack of widespread charging infrastructure pose challenges for widespread adoption. Additionally, the production and disposal of electric vehicle batteries have environmental implications.
In light of these drawbacks, exploring alternative fuel options becomes crucial. One such option is the use of octanol in diesel engines as a blend with conventional diesel fuel. Table 1 illustrates the effect of diesel engine parameters by various alcohol fuels blended with neat diesel. Octanol, which is derived from renewable sources, offers several benefits. First, it exhibits superior lubricity, which helps reduce engine wear and prolong engine life. Second, its higher cetane number enhances the ignition quality, resulting in smoother combustion and reduced emissions. Furthermore, its oxygen content improves the combustion efficiency, leading to increased power output and reduced fuel consumption.
Moreover, incorporating GO as a nanoadditive in the diesel–octanol blend enhances its advantages. GO, with its high thermal conductivity and large surface area, acts as a catalyst, facilitating better fuel–air mixing and promoting more complete combustion. This not only enhances engine performance but also minimizes harmful emissions, such as PM and NOX. Table 2 describes the effect of GO nanoadditives mixed blends as an alternative for diesel fuel in a diesel engine. Additionally, the presence of GO reduces soot formation and improves the stability and compatibility of the fuel blend, ensuring an optimal engine operation.
By using octanol in diesel engines and enhancing its properties with the addition of GO, we can harness the benefits of a renewable fuel source while optimizing the combustion efficiency and reducing the environmental impact.
This approach offers a viable alternative to conventional fuels, which are finite resources and contribute to greenhouse gas emissions. Ultimately, blending octanol with diesel and incorporating GO represents a significant step toward achieving sustainable and efficient transportation.
2. Materials and Methods
2.1. n-Octanol
Octanol is a promising chemical that belongs to the group of fatty alcohols and can be obtained from a variety of plants such as lavender, mint, hops, cannabis, tea, ginger, and oats. Interestingly, octanol exists in three common isomers, namely, 1-octanol, 2-octanol, and 3-octanol, each with distinct chemical properties and structures. One of the remarkable characteristic of octanol is its strong aroma, which makes it a popular ingredient in perfumes that offer a sweet, woody, herbal, or earthy scent.
Fatty alcohols are a family of organic compounds that contain a long chain of hydrocarbons with an alcohol group at one end. This unique structure results in a polar end and a nonpolar end, just like those of fatty acids. As a result, fatty alcohols are amphiphilic in nature and exhibit unique properties, such as emulsifying and surfactant activities. Octanol, as a fatty alcohol, displays these same properties, which make it useful in a variety of industrial and household applications.
Moreover, n-octanol, which is also known as caprylic alcohol or n-octanol, has a remarkable similarity to the fatty acids found in the human body, which makes it an essential model chemical for studying the solubility of various chemical compounds in the human body. In this regard, n-octanol is often used to determine the partition coefficient, which is a measure of the ability of a compound to dissolve in the human body. The partition coefficient is an important parameter in pharmacology and toxicology as it helps to predict the absorption, distribution, and elimination of drugs and other chemicals in the body.
2.1.1. Preparation of n-Octanol
To synthesize n-octanol, Zeigler process was used. The Ziegler process involves several steps. First, a catalyst is prepared by mixing a metal compound, such as titanium tetrachloride, with a reducing agent, such as triethyl aluminum. In a reaction vessel, this catalyst is introduced to a solvent along with the n-butene, which is then added to the mixture while the temperature and pressure are kept constant. The reaction is allowed to continue for a few hours until the desired amount of n-butene is converted to n-octanol. Once the reaction has completed, the resulting mixture is cooled and the organic and aqueous layers are separated. The organic layer is then washed with water to eliminate any residual byproducts or catalysts. The unrefined n-octanol is then distilled under reduced pressure to eliminate the remaining solvents, unreacted n-butene, and other contaminants. Ultimately, pure n-octanol is collected in a receiving flask, and additional refining procedures may be carried out if needed. The properties of n-octanol are shown in Table 3.
Table 3. Properties of n-Octanol.
| properties | n-octanol |
|---|---|
| molecular formula | C8H18O |
| molecular weight (g/mol) | 131.23 |
| C (%) | 73.72 |
| H (%) | 13.82 |
| O (%) | 12.29 |
| stoichiometric A/F ratio | 12.71 |
| boiling point (°C) | 195–197 |
| melting point (°C) | –16.6 °C |
| density (g/L) | 0.83 |
| cetane number | 39 |
| fire point (°C) | 62 |
| flash point (°C) | 49 |
| calorific value (kJ/kg) | 39 600 |
| solubility | soluble in water, alcohol, ether, and chloroform |
2.1.2. Other Ways of Producing n-Octanol
One alternative method for synthesizing n-octanol is through hydroformylation of 1-octene. This process involves the reaction of 1-octene with carbon monoxide and hydrogen in the presence of a rhodium catalyst to form aldehydes, which are then hydrogenated to form n-octanol. This method has the advantage of producing a high yield of pure n-octanol, but it also requires a complex catalyst system and can be more expensive than the Ziegler process. The selection of an appropriate method for the synthesis of n-octanol is determined by several factors. First, the availability and cost of raw materials are crucial factors to consider. The desired purity level of the final product also has an important role in the selection of the method. Furthermore, the cost of production is another important factor to consider, as some methods may be more cost-effective than others. Therefore, careful consideration of these factors is required before selecting the most appropriate method for the synthesis of n-octanol.
2.1.3. Comparison of Diesel and n-Octanol
Diesel and n-octanol may be classified as hydrocarbons, but they exhibit diverse chemical structures and properties. Diesel fuel is a complex mixture of hydrocarbons that is derived from crude oil, whereas n-octanol is a simple fatty alcohol that consists of eight carbon atoms with a methyl group (−CH3) at one end and a hydroxyl (−OH) group at the other. Despite their dissimilarities, n-octanol and diesel have a few common characteristics. They are both relatively nonpolar and have a low water solubility, making them suitable as solvents for oils and fats. Additionally, both have high boiling and flash points, which make them suitable as fuels.
The low water solubilities of n-octanol and diesel can be attributed to their nonpolar nature. They do not dissolve readily in water, but they can dissolve in other nonpolar solvents such as oil. This characteristic makes them useful as solvents in the manufacturing of products, such as paints, coatings, and cleaning agents.
Moreover, the high boiling and flash points of n-octanol and diesel make them ideal as fuels. Their high boiling point means that they can be vaporized and burned to produce energy, whereas their high flash point makes them less likely to ignite accidentally. This makes them suitable for use in IC engines and other applications that require a source of energy.
Overall, although n-octanol and diesel differ significantly in their chemical structures and properties, they share some similarities that make them useful in various industrial applications.
2.1.4. Similarity of Diesel and n-Octanol
To elaborate, n-octanol and diesel share some common characteristics when it comes to their utilization in diesel engines. In terms of ignition, both fuels experience compression ignition in a diesel engine, which means that they ignite due to the high pressure created by the engine’s compression stroke. As for their energy content, both fuels have similar energy content per unit volume, implying that they produce an equivalent amount of energy when combusted. When it comes to combustion, the combustion process of both fuels in the engine involves similar steps including fuel vaporization, mixing with air, and ignition via compression. About injection of fuel, both require comparable fuel injection systems in a diesel engine to deliver the fuel to the combustion chamber. Finally, both fuels have lubricating properties, which help protect the engine’s moving parts from wear and tear.
2.1.5. Advantages of Using the Diesel–n-Octanol Blend over Diesel
The combination of n-octanol and diesel fuel in a CI engine can lead to several benefits that make it a promising alternative fuel. One of the primary advantages is improved engine performance. This is achieved by increasing the fuel’s cetane number through blending, resulting in better combustion and energy conversion as well as reduced engine noise and vibration levels. Another significant advantage of using n-octanol in diesel engines is the reduction of harmful emissions. Compared to diesel, n-octanol is a cleaner burning fuel that emits fewer pollutants, such as PM and NOx, which makes it a more environmentally friendly option.
Furthermore, n-octanol can be prepared from renewable biomass sources, making it a sustainable fuel choice with a lower carbon footprint than diesel. Although the production costs of n-octanol may be higher than those of diesel, the long-term benefits, such as reduced maintenance expenses and compliance with environmental regulations, can offset these costs.
However, more research and development are required to optimize the use of n-octanol and ensure its compatibility with existing diesel engines. Despite this, the increased oxygen content of n-octanol enables complete combustion, resulting in a higher combustion efficiency and an improvement in BTE. This indicates that the use of n-octanol in diesel engines can lead to both economic and environmental benefits.
2.2. Graphene Oxide
Derived from graphene, GO is highly dispersible in water due to the presence of oxygen-containing functional groups (−OH and −COOH) attached to its graphene layers. These functional groups account for 50–60% GO, imparting a hydrophilic nature to it. The remaining fraction (40%) consists of carbon atoms bonded to oxygen in different forms. GO’s unique atomic arrangement allows for easy modification, functionalization, dispersion, deposition, and transportation compared with native graphene. GO has diverse applications, such as in transparent films, capacitors, transistors, displays, fuel cells, solar cells, drug carriers, antibacterial materials, and reinforcement in composites. Graphite oxide, a form of GO, is used in CO2 storage and capturing toxic metals. In summary, GO’s hydrophilicity and functional groups make it versatile, whereas its thermal and mechanical properties make it a valuable reinforcing agent.45–48
2.2.1. Synthesis of Graphene Oxide
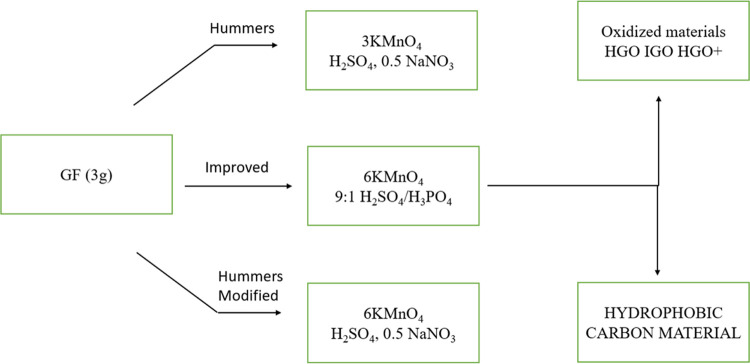
In this work, GO was synthesized using Hummer’s method. This involves using materials, such as graphite flakes, sulfuric acid, hydrogen peroxide, orthophosphoric acid, potassium permanganate, and potassium nitrate. Graphite powder undergoes oxidation with strong chemical agents, leading to material exfoliation in water by using mechanical energy. A modified Hummer’s method enables the production of uniform GO nanosheets with varying lateral sizes. GO can be reduced back to graphene sheets through chemical agents or thermal annealing, resulting in reduced graphene oxide. A refined approach starts by gradually adding graphite powder to concentrated sulfuric acid in a cooled flask, followed by the introduction of specific chemicals at different temperatures.
The system is transferred to a water bath and stirred at 35 °C for 2 h, forming a thick paste. Deionized water is slowly added, and the suspension is heated to 98 °C for 30 min. After dilution and reduction with 30% H2O2, the resulting brown slurry was sonicated for 1 h. Centrifugation removes unexfoliated GO layers, and solid GO powders (G2) are obtained by drying the sample in a vacuum oven at 60 °C for 24 h. The process of synthesizing GO is shown in Figure 1.
Figure 1.
Process of graphene oxide synthesis.
2.2.2. FTIR Image of Graphene Oxide
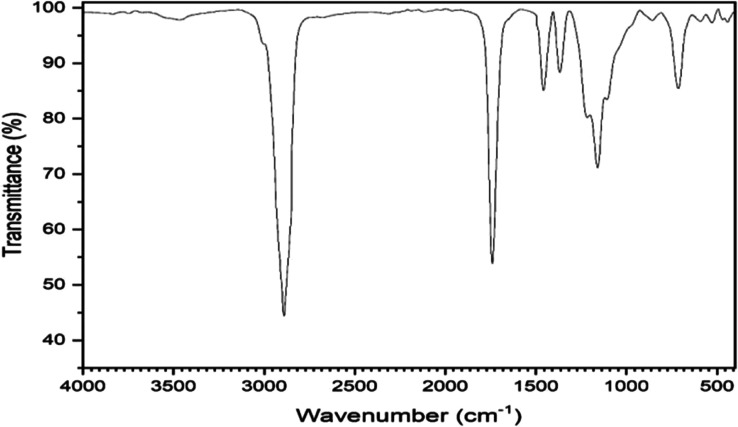
The Fourier transform infrared FTIR image of graphene oxide, shown in Figure 2, offers important details about its molecular makeup and the presence of functional groups. The chemical composition of materials is frequently determined by using FTIR spectroscopy, which examines the absorption of infrared light. The FTIR image aids in identifying and comprehending the oxygen-containing functional groups added during oxidation of GO, which is a form of graphene that has undergone oxidation.
Figure 2.
FTIR image of graphene oxide.
The properties and uses of GO are significantly influenced by these functional groups. The graphene lattice gains functional groups during oxidation, including hydroxyl (−OH), carbonyl (C=O), and carboxyl (−COOH). These functional groups can be found and examined by using FTIR spectroscopy. They are indicated by distinct absorption peaks in the FTIR image. These peak locations, intensities, and shapes reveal details about the kinds and numbers of functional groups. For instance, hydroxyl groups (−OH) usually exhibit a broad absorption peak between 3200 and 3600 cm–1. The absorption peaks of carboxyl groups (−COOH) are in the 1700–1800 cm–1 range, whereas those of carbonyl groups (C=O) are in the 1600–1800 cm–1 range. Researchers can quantify the abundance of different functional groups and determine the degree of oxidation in GO samples by analyzing the FTIR image. This information is essential for comprehending the chemical alterations that take place during the synthesis of GO and for customizing its properties. The FTIR image can also reveal information about other characteristics of GO, such as the presence of contaminants and lingering solvents.
2.2.3. SEM Analysis of Graphene Oxide
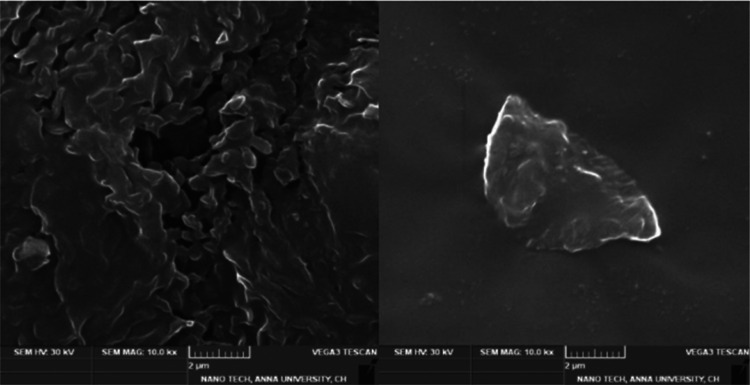
The shape and surface properties of GO can be better understood by a scanning electron microscopy (SEM) image, as shown in Figure 3. SEM is a popular imaging method that makes use of electron beams to closely inspect the topography and chemical makeup of objects. It can show structural changes that occur when graphene is oxidized to become GO. Owing to the addition of functional groups containing oxygen, GO generally shows a sheet-like structure with creases, folds, and a rough surface. The size, distribution, and aggregation patterns of individual GO sheets or flakes are visible in SEM images of GO. Details concerning the shape, thickness, and surface roughness of the GO layers are revealed in the enlarged photos. Additionally, SEM examination enables researchers to check for flaws in the GO structure such as holes, fractures, or voids.
Figure 3.
SEM image of graphene oxide.
The characteristics and behavior of GO in diverse applications may be affected by these flaws. Additionally, energy-dispersive X-ray spectroscopy (EDS) and SEM may be used to examine the elemental makeup of GO. EDS makes it possible to identify and map the elements found in the GO sample, giving information about the distribution and concentration of various elements.
2.3. Preparation of the Diesel–n-Octanol Blend with Graphene Oxide as the Additive
In this work, nine diesel–octanol blends with different proportions of GO were prepared. These are as follows:
-
1.
D70OCT30GO0.004: 70% diesel, 30% octanol (v/v), and 40 ppm GO
-
2.
D70OCT30GO0.006: 70% diesel, 30% octanol (v/v), and 60 ppm GO
-
3.
D70OCT30GO0.008: 70% diesel, 30% octanol (v/v), and 80 ppm GO
-
4.
D60OCT40GO0.004: 60% diesel, 40% octanol (v/v), and 40 ppm GO
-
5.
D60OCT40GO0.006: 60% diesel, 40% octanol (v/v), and 60 ppm GO
-
6.
D60OCT40GO0.008: 60% diesel, 40% octanol (v/v), and 80 ppm GO
-
7.
D50OCT50GO0.004: 50% diesel, 50% octanol (v/v), and 40 ppm GO
-
8.
D50OCT50GO0.006: 50% diesel, 50% octanol (v/v), and 60 ppm GO
-
9.
D50OCT50GO0.008: 50% diesel, 50% octanol (v/v), and 80 ppm GO
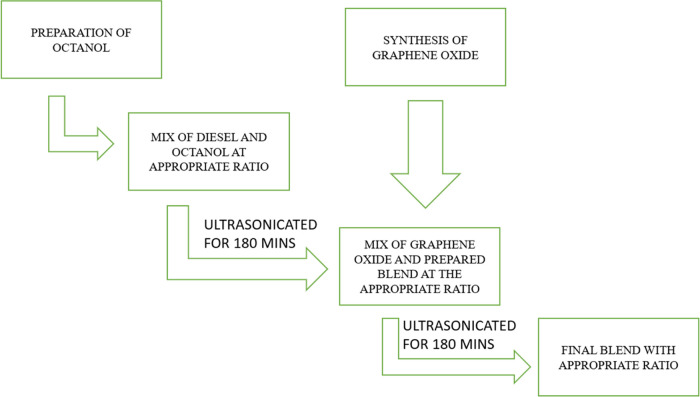
To help readers understand, we will provide the steps to prepare a diesel–octanol blend with a 70:30 ratio. To start, take a clean and dry container with a capacity of at least 1 L and measure out 700 mL of diesel fuel. Transfer the diesel fuel to the container. Then, measure and slowly add 300 mL of n-octanol to the container with the diesel fuel, being careful not to splash. Close the container securely and gently agitate the mixture for a few minutes to ensure that the diesel and octanol are thoroughly mixed. Simultaneously, weigh the required amount of GO after the conversion of parts per million to milligrams (mg). Now add the measured GO to the resulting diesel–octanol blend. The process of blend preparation is shown in Figure 4.
Figure 4.
Blend preparation process.
3. Experimental Setup
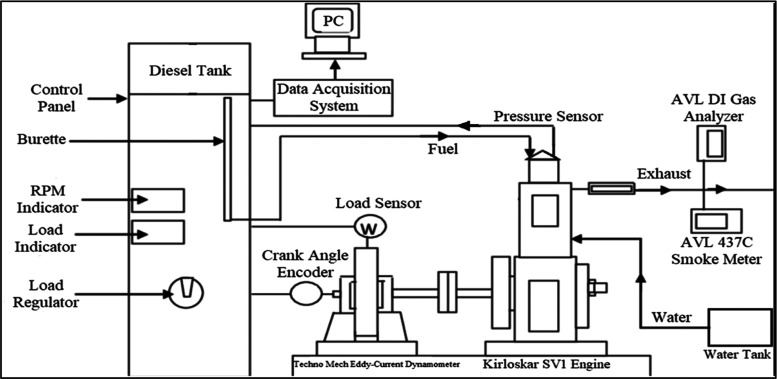
To assess the performance and emissions of the SV1 engine, a number of tools and measurement instruments were used and the engine was affixed to a dynamometer using eddy currents, which provided load and measured power. This type of dynamometer is highly versatile and can be used with Prime Movers ranging from 10 to 100 bhp and between 1500 and 5000 rpm, making it an ideal tool for engine testing in production, research and development (R&D), and quality assurance. The durable construction and efficient power absorption mechanism of the dynamometer also ensure its longevity.
To determine smoke emission levels, AVL 437C smoke meters were used. These meters use the light opacity method, which involves transmitting light through an exhaust sample and measuring the opacity by using a photovoltaic cell. The measured opacity directly correlates with the level of smoke emissions. The need for high-quality measurement instruments that meet multiple requirements, such as durability testing, high precision, low detection limits, and cost-effectiveness, has been driven by stringent engine emission regulations. To meet these demands, an AVL Smoke Meter was developed.
Additionally, an AVL-DI gas analyzer was used to evaluate the emissions and engine performance. This analyzer uses a nondispersive infrared ray method to measure HC, CO, CO2, NOx, and O2 emissions in diesel engine exhaust. Before usage, the analyzer requires several hours of warming, a leak check, and an HC residue test. To eliminate moisture, carbon deposits, and blockages, compressed air is provided to the exhaust probe before connecting to the analyzer.
A setup was prepared for testing the engine’s performance, which consisted of a fuel tank, a fuel control unit, and a pressure sensor connected to the inlet valve. An optical sensor was positioned close to the flywheel to measure the engine speed. The start of injection was detected using a Hall-effect sensor, and an electronic fuel injector was used to initiate injection at the beginning of the intake process. The blend was delivered into the combustion chamber as the valve opened after being blended with the entering air. Measurements of exhaust emissions, including HC, smoke, CO, and NOX, were made using an exhaust gas analyzer and a smoke meter. These instruments enabled comprehensive evaluation of the SV1 engine’s emissions and performance, which could be utilized to enhance the design of the engine and minimize its environmental impact. The engine’s setup is illustrated in Figure 5 and specification is shown in Table 4. Table 5 shows the instruments used for measuring emission values in the experimentation.
Figure 5.
Diagram of experimental engine configuration.
Table 4. Engine’s Specification.
| make and model | Kirloskar SV1 |
|---|---|
| type | direct injection, water-cooled, four-stroke, inline, one-cylinder engine |
| compression ratio | 18:1 |
| bore/stroke | 87 mm/110 mm |
| engine power | 4.4 kW@1500 rpm |
| engine torque | 27 N m |
| injection timing | 21°bTDC |
| injection pressure | 200 bar |
| Specification of Dynamometer | |
| power absorption capacity (maximum) | 150 kW@(2900–8000 rpm) |
| torque capacity (maximum) | 1800–2900 rpm@50 N m |
Table 5. Specifications for the AVL-DI GAS 444 Gas Analyzer and AVL 437 Smoke Meter.
| gas analyzer AVL-DI GAS 444 | |||
|---|---|---|---|
| emissions | measurement principle | resolutions | ranges |
| CO | NDIR | 0.01 vol % | >10 vol % |
| HC | NDIR | >10 ppm | >20 000 ppm |
| NOX | electrochemical | 1 ppm | >5000 ppm |
| AVL 437C Smoke Meter Measuring Principle: Smoke Opacity Technique | |||
| range (for measuring) | 0–100 (HSU) | ||
| temperature (smoke) | 2500 °C (maximum at entering) | ||
| temperature (ambient) | >50 °C | ||
| humidity | 90% at 50 °C (nonconditioning) | ||
| power supply | 11.5–36 V DC | ||
Before commencing the study, the research team adopted Holman’s approach to calculate the potential sources of error connected with different measurements and estimations of performance parameters. To aid in this endeavor, Table 6 was utilized to view the uncertainties of the measuring instruments. To further refine the calculations, the root-mean-square method was implemented to determine the percentages of uncertainty in different parameters. After all relevant data had been collected and analyzed, the whole uncertainty of the experimental data was found to be ±2.369%, signifying the level of confidence in the results obtained. More specifically, the emission parameters had an uncertainty of 1.364%, whereas the performance parameters had an uncertainty of 1.005%. These precise figures reflect the meticulous attention to detail and rigorous methodology used by the research team throughout the course of the study.
Table 6. Measurement of the Degree of Uncertainty for Both the Emission and Performance Parameters.
| engine parameters | uncertainty (%) |
|---|---|
| brake thermal efficiency | 0.76 |
| brake-specific fuel consumption | 0.611 |
| speed | 0.123 |
| hydrocarbon | 0.498 |
| carbon monoxide | 0.39 |
| oxides of nitrogen | 1.3 |
| smoke | 0.106 |
4. Results and Discussion
4.1. Brake Thermal Efficiency
To measure an engine’s capability to transform heat energy from fuel to useful mechanical work, the BTE is used. Several crucial factors, including calorific value (CV), oxygen content (O2), cetane number (CN), and kinematic viscosity of the fuel, can influence BTE. As depicted in Figure 6, the D70OCT30GO0.006 fuel blend demonstrates superior BTE compared to other fuels, exhibiting a noteworthy 10% increase over diesel and a 5% increase over the same fuel without a GO blend.
Figure 6.
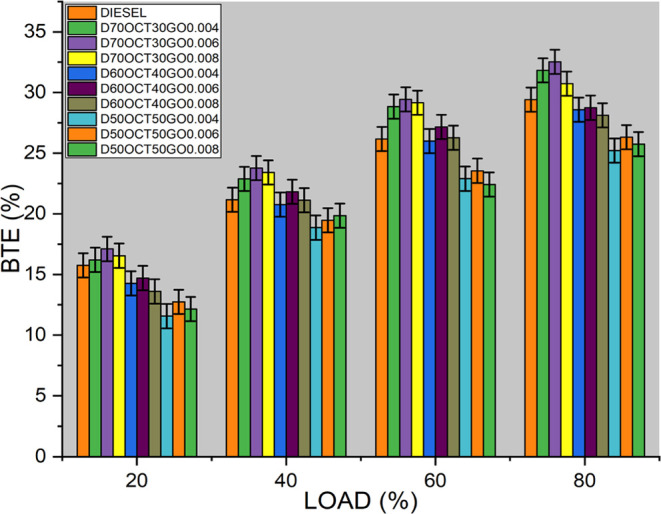
Brake thermal efficiency of three blends.
The increased surface area of the GO, which improves fuel and air mixing in the combustion chamber, is responsible for this enhancement. This leads to more complete combustion and a higher BTE. Additionally, the enhanced thermal conductivity of GO allows for efficient heat dissipation and helps prevent engine overheating. However, it is crucial to note that a high concentration of GO in fuel blends can increase the fuel density, leading to poor fuel atomization and incomplete combustion. In such cases, fuel blends containing 80 ppm additive concentration may experience reduced BTE.
4.2. Brake-Specific Energy Consumption
BSEC, which stands for brake-specific energy consumption, is a measure of the energy required by an engine to produce 1 kW power over the course of 1 h. It takes into account both the energy content of the fuel and fuel consumption and is typically expressed in units of energy per unit of energy output, such as megajoules per kilowatt-hour or BTUs per horsepower-hour. To convert BSFC to BSEC, it is necessary to know the energy content of the fuel being used, usually provided in units of energy per unit of mass or volume. The BSFC can then be multiplied by the energy content of the fuel to obtain the BSEC, but it is important to ensure that the units of the fuel consumption rate and energy content are compatible and consistent for accurate results.
As seen in Figure 7, there is a 7.5% decrease in BSEC compared to diesel. GO nanoparticles have been found to possess high catalytic activity and promote the microexplosion phenomenon, leading to reduced BSFC at maximum load when used as a fuel additive. However, it is worth noting that GO can also react with the engine oil and form deposits on engine components, such as fuel injectors, valves, and piston rings. These deposits can hinder the flow of fuel and air, potentially leading to increased BSFC and reduced engine efficiency.
Figure 7.
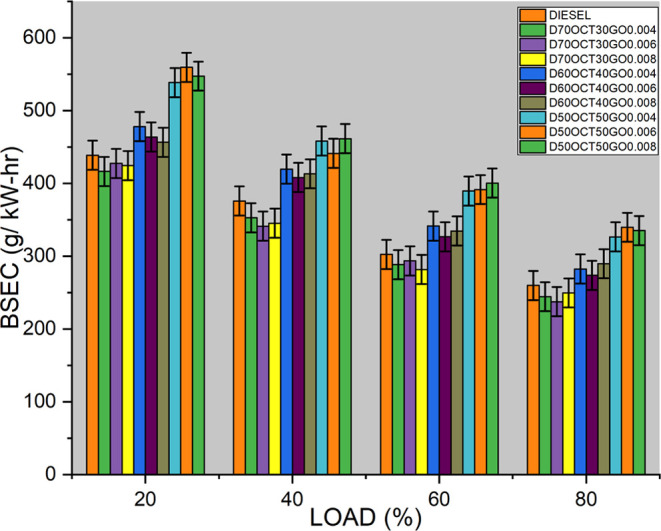
BSEC of three blends.
4.3. Hydrocarbon Emission
The amount of hydrocarbon (HC) emissions in the tailpipe exhaust is influenced by various factors, including fuel properties, injection conditions, engine operating conditions, spray conditions, and the air/fuel ratio in the engine. According to Figure 8, when using the D70OCT30GO6 fuel, the HC emissions are measured at 53 ppm, which represents a significant 32% decrease compared to diesel fuel emissions at 73 ppm. This indicates that the D70OCT30GO6 fuel results in more complete combustion, leading to fewer unburned hydrocarbons being released into the environment. The surface tension and viscous properties of the fuel also play crucial roles in the mixing and atomization process. As the blended fuel has viscous properties similar to diesel, it accelerates the formation of fine droplets, rapid evaporation, and increased availability of oxygen, leading to complete combustion of the fuel inside the cylinder and effectively reducing HC emissions.
Figure 8.
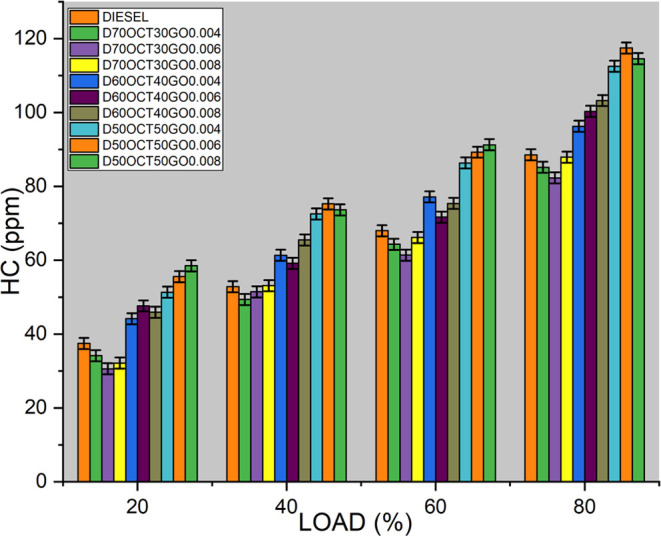
HC emissions of three blends.
4.4. NOX Emission
In diesel engines, fuel distribution is typically nonuniform, resulting in high in-cylinder temperatures. The formation of NOX occurs primarily at elevated temperatures. When the temperature is at peak in the combustion chamber, NOX is produced through the reaction between oxygen and nitrogen. The rate of NOX formation increases in regions close to the stoichiometric operating condition, where the fuel/air ratio is optimal. In a diesel engine, air is compressed to high pressure and temperature before ignition, leading to even higher combustion temperatures. This results in a higher concentration of nitrogen and oxygen molecules in the engine, leading to increased NOX formation.
As evident from Figure 9, the fuel blend D7OOCTGO0.006 emits 1301 ppm of NOx, which represents a 9.6% increase compared to diesel fuel. Higher adiabatic flame temperatures, which occur during combustion, play a significant role in NOx formation. The NOx emissions from the blend increase with higher engine load due to rapid combustion, heat energy from the previous cycle, and increased availability of oxygen. Conversely, the NOx emissions of the B20 blend are reduced as a result of its lower heating value when compared to other blends. The increase in NOX emissions with the D7OOCTGO0.006 fuel blend is due to higher adiabatic flame temperatures and increased availability of oxygen, especially at higher engine loads. Careful engine tuning and controlling of the operating conditions can help mitigate NOX formation.
Figure 9.
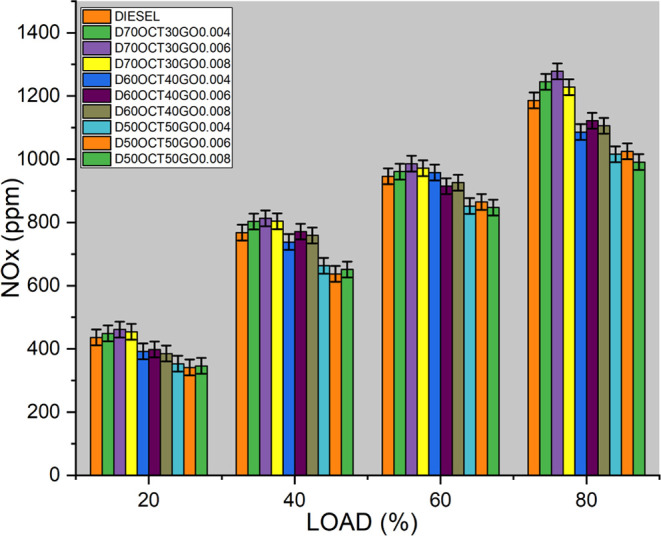
NOX emissions of three blends.
4.5. CO Emissions
CO, a poisonous gas, can be released from diesel engines as a result of incomplete combustion. During combustion in a diesel engine, fuel reacts with oxygen to release energy. However, when the combustion process is not complete, then CO can form. There are various factors that contribute to CO formation, including the fuel/air ratio. If the ratio is not optimal owing to insufficient air or excessive fuel, then incomplete combustion can occur, leading to higher CO emissions, especially during low load conditions or at low temperatures. CO from diesel engines is regulated by emissions standards in many countries to mitigate air pollution and protect human health. Proper engine tuning, fuel quality, and combustion chamber design are crucial to minimizing CO emissions. Regular maintenance, such as cleaning and replacing fuel injectors, can also optimize combustion and reduce CO emissions. As per Figure 10, the fuel D70OCT30GO0.006 shows a significant decrease in HC emissions compared to diesel fuel. GO, present in D70OCT30GO0.006, is found to possess catalytic activity, which promotes the oxidation of CO to carbon dioxide (CO2) in the presence of oxygen. This process, known as CO oxidation, occurs on the surface of GO particles, further reducing the level of CO emissions in the exhaust gases. However, the excessive addition of GO as a fuel additive in a diesel engine may have the opposite effect, increasing CO emissions instead of decreasing them. This is because excess GO can potentially interfere with the combustion process, causing incomplete combustion of the diesel fuel and resulting in higher production of unburned hydrocarbons and CO. Careful consideration of the amount of GO used as a fuel additive is essential to avoid unintended consequences of CO emissions.
Figure 10.
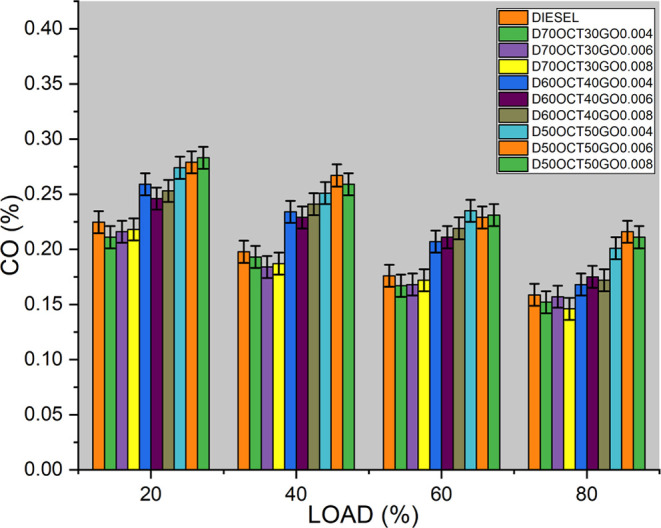
CO emissions of the three blends.
4.6. Pressure–Crank Angle Curve
The P–θ curve, which represents pressure changes in the combustion chamber for the duration of a combustion cycle, offers valuable insights into the combustion process and its impact on the engine performance. It can reveal important information about the engine’s behavior during combustion, including the maximum pressure achieved and the corresponding crankshaft angle. For instance, based on Figure 11, it shows that when using the D70OCT30GO0.006 fuel, the maximum pressure achieved is 48.2 bar at 10CA, which is a 12% increase compared to diesel fuel at 43.2 bar, indicating a potential improvement in engine performance. The addition of GO to diesel fuel can have beneficial effects on the engine operation. GO can form a thin film on moving parts of the engine, reducing friction and improving lubrication, resulting in smoother engine operation and potentially higher pressures in the combustion chamber. However, it is worth noting that an excessive GO concentration may result in a decrease in pressure. This could be attributed to the thermal conductivity properties of highly concentrated GO, which can dissipate heat from the engine, lowering the temperature in the combustion chamber and potentially reducing the engine pressure. The performance of an engine during combustion can be evaluated using the P–θ curve, which illustrates changes in the pressure and crank angle. When GO is added to diesel fuel, it can influence the engine pressure positively or negatively, depending on the concentration and other factors. Therefore, it is crucial to optimize the GO concentration in fuel blends to ensure that engine performance and efficiency are improved.45−47
Figure 11.
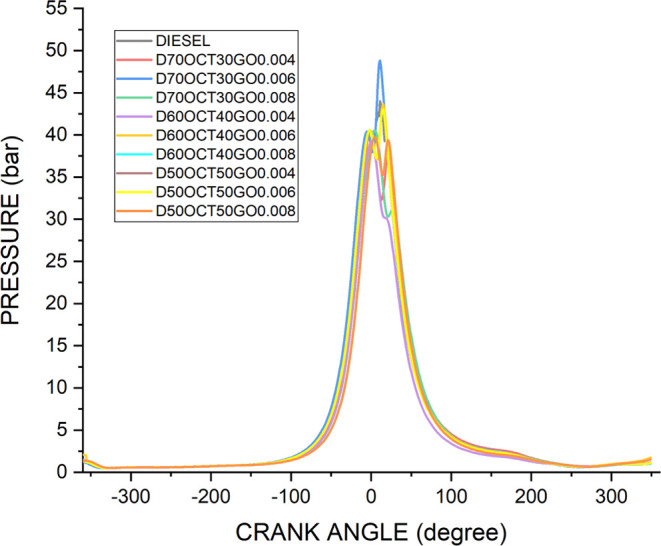
Pressure-angle diagram of three blends.
5. Optimization
5.1. ANN Model for Engine Prediction
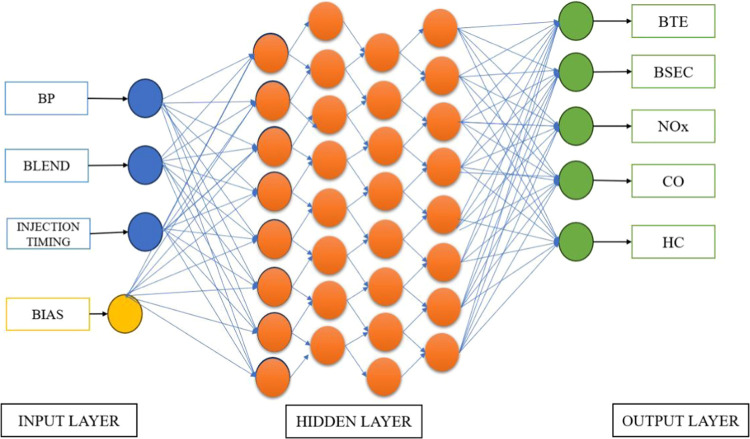
An ANN optimization model was used to increase the performance parameter and reduce the emission parameter of a diesel engine by determining the optimal operating parameters. The initial efficiency of the engine was improved from 29.85 to 31.2% by incorporating a fuel blend consisting of diesel–octanol and GO. Knocking combustion was exhibited by the engine, which prompted the determination of the optimum injection timing. An ANN-based model was used instead of relying on costly and time-consuming experimental methods. Input features such as blends, injection timing, and brake power; output features such as BTE, BSEC; and emissions like NOx, CO, and HC were required for the model. The data set was separated into 80% for training and 20% for testing the model. Activation functions such as Sigmoid, Tanh, and ReLU, as well as training algorithms or optimizers such as the Stochastic Gradient Descent, Adam Optimizer, and RMSprop were used to minimize the error between predicted and actual outputs. Figure 12 indicates the processing of optimization parameters.
Figure 12.
Processing of optimization parameters.
5.2. Initial ANN Model
To optimize the injection timing, ANN models were developed by varying the number of hidden neurons ranging from 5, 7, 9, to 11 and all three activation functions and optimizers were used. Thus, according to Table 7, 36 models were developed. However, due to the availability of less data for training and the unoptimized learning rate, the model prediction accuracy ranged from 52 to 55%. The initial modeling ANN is explained in Table 7.
Table 7. Initial ANN Model.
| model | hidden layer | activation function | training algorithm | accuracy | MAPE | R-squared |
|---|---|---|---|---|---|---|
| MODEL_5_RELU_SGD | 5 | rectified linear unit | stochastic gradient descent | 53.23 | 1.1153 × 10¹⁴ | 0.9245 |
| MODEL_7_RELU_SGD | 7 | rectified linear unit | stochastic gradient descent | 53.66 | 1.28855 × 10¹⁴ | 0.9231 |
| MODEL_9_RELU_SGD | 9 | rectified linear unit | stochastic gradient descent | 53.02 | 9.97446 × 10¹³ | 0.9239 |
| MODEL_11_RELU_SGD | 11 | rectified linear unit | stochastic gradient descent | 52.8 | 1.02458 × 10¹⁴ | 0.9117 |
| MODEL_5_RELU_ADAM | 5 | rectified linear unit | Adam | 52.8 | 6.96513 × 10¹³ | 0.9191 |
| MODEL_7_RELU_ADAM | 7 | rectified linear unit | Adam | 53.23 | 7.31115 × 10¹³ | 0.939 |
| MODEL_9_RELU_ADAM | 9 | rectified linear unit | Adam | 53.23 | 6.97803 × 10¹³ | 0.9386 |
| MODEL_11_RELU_ADAM | 11 | rectified linear unit | Adam | 53.02 | 8.01304 × 10¹³ | 0.9124 |
| MODEL_5_RELU_RMSPROP | 5 | rectified linear unit | RMSprop | 53.23 | 6.11124 × 10¹³ | 0.95 |
| MODEL_7_RELU_RMSPROP | 7 | rectified linear unit | RMSprop | 52.59 | 5.42407 × 10¹³ | 0.9094 |
| MODEL_9_RELU_RMSPROP | 9 | rectified linear unit | RMSprop | 53.02 | 5.01291 × 10¹³ | 0.9375 |
| MODEL_11_RELU_RMSPROP | 11 | rectified linear unit | RMSprop | 52.8 | 6.84404 × 10¹³ | 0.901 |
| MODEL_5_SIGMOID_SGD | 5 | sigmoid | stochastic gradient descent | 53.66 | 3.26599 × 10¹⁴ | 0.8545 |
| MODEL_7_SIGMOID_SGD | 7 | sigmoid | stochastic gradient descent | 53.02 | 2.40028 × 10¹⁴ | 0.8896 |
| MODEL_9_SIGMOID_SGD | 9 | sigmoid | stochastic gradient descent | 53.23 | 2.64108 × 10¹⁴ | 0.8765 |
| MODEL_11_SIGMOID_SGD | 11 | sigmoid | stochastic gradient descent | 53.66 | 3.67715 × 10¹⁴ | 0.8318 |
| MODEL_5_SIGMOID_ADAM | 5 | sigmoid | Adam | 53.23 | 2.05152 × 10¹⁴ | 0.9223 |
| MODEL_7_SIGMOID_ADAM | 7 | sigmoid | Adam | 53.23 | 1.05645 × 10¹⁴ | 0.9359 |
| MODEL_9_SIGMOID_ADAM | 9 | sigmoid | Adam | 53.23 | 9.49081 × 10¹³ | 0.9336 |
| MODEL_11_SIGMOID_ADAM | 11 | sigmoid | Adam | 53.23 | 9.15691 × 10¹³ | 0.9411 |
| MODEL_5_SIGMOID_RMSPROP | 5 | sigmoid | RMSprop | 53.02 | 1.00003 × 10¹⁴ | 0.939 |
| MODEL_7_SIGMOID_RMSPROP | 7 | sigmoid | RMSprop | 53.23 | 7.54171 × 10¹³ | 0.9399 |
| MODEL_9_SIGMOID_RMSPROP | 9 | sigmoid | RMSprop | 53.23 | 6.71535 × 10¹³ | 0.9426 |
| MODEL_11_SIGMOID_RMSPROP | 11 | sigmoid | RMSprop | 53.02 | 6.63556 × 10¹³ | 0.9385 |
| MODEL_5_TANH_SGD | 5 | tanH | stochastic gradient descent | 53.23 | 1.19568 × 10¹⁴ | 0.9201 |
| MODEL_7_TANH_SGD | 7 | tanH | stochastic gradient descent | 53.02 | 1.19444 × 10¹⁴ | 0.9059 |
| MODEL_9_TANH_SGD | 9 | tanH | stochastic gradient descent | 52.37 | 9.90017 × 10¹³ | 0.9278 |
| MODEL_11_TANH_SGD | 11 | tanH | stochastic gradient descent | 53.02 | 1.06792 × 10¹⁴ | 0.9271 |
| MODEL_5_TANH_ADAM | 5 | tanH | Adam | 53.02 | 7.31876 × 10¹³ | 0.9389 |
| MODEL_7_TANH_ADAM | 7 | tanH | Adam | 53.02 | 7.22532 × 10¹³ | 0.9385 |
| MODEL_9_TANH_ADAM | 9 | tanH | Adam | 53.02 | 6.62239 × 10¹³ | 0.9314 |
| MODEL_11_TANH_ADAM | 11 | tanH | Adam | 53.02 | 6.71126 × 10¹³ | 0.9329 |
| MODEL_5_TANH_RMSPRO | 5 | tanH | RMSprop | 53.02 | 6.07054 × 10¹³ | 0.9399 |
| MODEL_7_TANH_RMSPROP | 7 | tanH | RMSprop | 53.02 | 7.29403 × 10¹³ | 0.9313 |
| MODEL_9_TANH_RMSPROP | 9 | tanH | RMSprop | 53.02 | 5.83226 × 10¹³ | 0.9338 |
| MODEL_11_TANH_RMSPROP | 11 | tanH | RMSprop | 53.02 | 5.80706 × 10¹³ | 0.9322 |
5.3. Final ANN Model
When an ANN is trained, the learning rate hyperparameter controls the size of the steps taken by the optimizer to adjust the weights of the model during training. The learning rate is a crucial parameter that must be optimized to ensure efficient training of the model. If the learning rate is set too low, then the training process can be slow and may converge to a suboptimal solution. On the other hand, if the learning rate is set too high, the training process may overshoot the minimum of the loss function, leading to unstable or divergent learning. Therefore, selecting an appropriate learning rate is essential to achieving optimal performance of the ANN model. Common optimizers such as Stochastic Gradient Descent (SGD), Adam Optimizer, and RMSprop have a default learning rate. However, it is often necessary to tune the learning rate to achieve optimal performance in a specific problem. Thus, the initial ANN model with the Adams optimizer, which performed well compared to other models, was chosen in which the learning rate of the optimizer was varied. In addition to that, as the sample data are very low, the hidden neuron was increased and varied from 16, 32 to 64. Upon training and testing, it was found that a model with 64 hidden neurons, Adams optimizer, and sigmoid activation function performed best, achieving a prediction accuracy of 99.2%; see Table 8.
Table 8. Final ANN Model.
| model | hidden layer | activation function | learning rate | accuracy | R-squared | MAPE |
|---|---|---|---|---|---|---|
| MODEL_16_RELU_001 | 16 | rectified linear unit | 0.001 | 97.37 | 0.9295 | 5.17889 × 10¹⁵ |
| MODEL_32_RELU_001 | 32 | rectified linear unit | 0.001 | 96.49 | 0.8652 | 4.44169 × 10¹⁵ |
| MODEL_64_RELU_001 | 64 | rectified linear unit | 0.001 | 96.49 | 0.8881 | 6.39251 × 10¹⁵ |
| MODEL_16_RELU_01 | 16 | rectified linear unit | 0.01 | 98.25 | 0.9221 | 4.00522 × 10¹⁵ |
| MODEL_32_RELU_01 | 32 | rectified linear unit | 0.01 | 97.37 | 0.8933 | 3.95053 × 10¹⁵ |
| MODEL_64_RELU_01 | 64 | rectified linear unit | 0.01 | 96.49 | 0.8468 | 5.2234 × 10¹⁵ |
| MODEL_16_RELU_1 | 16 | rectified linear unit | 0.1 | 98.25 | 0.9253 | 3.83913 × 10¹⁵ |
| MODEL_32_RELU_1 | 32 | rectified linear unit | 0.1 | 99.12 | 0.9472 | 3.95053 × 10¹⁵ |
| MODEL_64_RELU_1 | 64 | rectified linear unit | 0.1 | 98.25 | 0.9204 | 7.64719 × 10¹⁵ |
| MODEL_16_SIGMOID_001 | 16 | sigmoid | 0.001 | 98.25 | 0.9395 | 5.10587 × 10¹⁵ |
| MODEL_32_SIGMOID_001 | 32 | sigmoid | 0.001 | 98.25 | 0.9389 | 4.68787 × 10¹⁵ |
| MODEL_64_SIGMOID_001 | 64 | sigmoid | 0.001 | 98.25 | 0.9429 | 5.88396 × 10¹⁵ |
| MODEL_16_SIGMOID_01 | 16 | sigmoid | 0.01 | 98.25 | 0.9186 | 4.25863 × 10¹⁵ |
| MODEL_32_SIGMOID_01 | 32 | sigmoid | 0.01 | 97.37 | 0.8958 | 4.45458 × 10¹⁵ |
| MODEL_64_SIGMOID_01 | 64 | sigmoid | 0.01 | 95.61 | 0.8614 | 3.95082 × 10¹⁵ |
| MODEL_16_SIGMOID_1 | 16 | sigmoid | 0.1 | 96.49 | 0.8941 | 6.76908 × 10¹⁵ |
| MODEL_32_SIGMOID_1 | 32 | sigmoid | 0.1 | 95.61 | 0.9012 | 7.49245 × 10¹⁵ |
| MODEL_64_SIGMOID_1 | 64 | sigmoid | 0.1 | 62.28 | –0.0221 | 1.18047 × 10¹⁷ |
| MODEL_16_TANH_001 | 16 | tanH | 0.001 | 98.25 | 0.9269 | 4.37625 × 10¹⁵ |
| MODEL_32_TANH_001 | 32 | tanH | 0.001 | 98.25 | 0.9223 | 4.7321 × 10¹⁵ |
| MODEL_64_TANH_001 | 64 | tanH | 0.001 | 97.37 | 0.9181 | 4.43677 × 10¹⁵ |
| MODEL_16_TANH_01 | 16 | tanH | 0.01 | 98.25 | 0.9151 | 3.96107 × 10¹⁵ |
| MODEL_32_TANH_01 | 32 | tanH | 0.01 | 97.37 | 0.888 | 3.9965 × 10¹⁵ |
| MODEL_64_TANH_01 | 64 | tanH | 0.01 | 97.37 | 0.9058 | 3.95055 × 10¹⁵ |
| MODEL_16_TANH_1 | 16 | tanH | 0.1 | 97.37 | 0.9047 | 3.98674 × 10¹⁵ |
| MODEL_32_TANH_1 | 32 | tanH | 0.1 | 97.37 | 0.9143 | 6.5536 × 10¹⁵ |
| MODEL_64_TANH_1 | 64 | tanH | 0.1 | 97.37 | 0.9148 | 9.68735 × 10¹⁵ |
As the work focused on engine optimization, the implementation of an ANN model to optimize the injection timing of the engine at 80% engine load, with the best blend and a crank angle of 21.5°, presents a targeted approach to investigate the effectiveness of the model under specific operating conditions. By focusing on the 80% engine load, the study aimed to capture a critical range of engine operation that represented a significant portion of the real-world driving scenarios.
Using the ANN model at this particular load offers several advantages. First, it allows for a more in-depth analysis of the optimization process within a specific operational range. By narrowing the scope, researchers can gain valuable insights into the intricate relationship among injection timing, fuel blend, and crank angle at this specific load point. This focused examination helps to uncover fine-grained details that might be missed when studying the performance of the engine across a wide range of loads.
Additionally, by concentrating on a single load condition, computational resources and training efforts can be optimized to enhance the accuracy and efficiency of the ANN model. The model can be fine-tuned and optimized specifically for 80% load, leading to improved prediction accuracy and more reliable results.
Although it is important to acknowledge that any corresponding graphs obtained at 80% load do not represent the entire engine operating range, the focused analysis at this load condition provides valuable insights into the potential of the ANN model for injection timing optimization. These insights can serve as a foundation for future research, allowing researchers to expand their investigations and explore the model’s performance under various load conditions, thereby obtaining a more comprehensive understanding of its capabilities.
Overall, the use of the ANN model at 80% engine load, coupled with the best blend and a crank angle of 21.5°, offers a targeted approach that enables researchers to delve deeper into the optimization process, optimize computational resources, and gain valuable insights into the model’s effectiveness. These findings can serve as a basis for further exploration and refinement of the ANN model for engine optimization over a broader range of load conditions.
5.4. Optimizing Injection Timing
The optimal injection timing of 21.5 CA was determined using this model, resulting in a performance enhancement of up to 32.9%, which was 1% better than the initial conditions. It can be interpreted that when the fuel is injected earlier, it has more time to mix with air and vaporize, resulting in a more homogeneous mixture in the combustion chamber. This leads to a faster and more complete combustion process, resulting in higher engine power and lower emissions. However, if the injection timing is too early, it can result in knocking combustion, damaging the engine. By using an ANN model to determine the optimal injection timing, combustion was efficient without causing knocking, resulting in the best performance.
6. Conclusions
Five n-octanol–diesel blends were used in a four-stroke diesel engine, and the performance, combustion, and emission characteristics were studied. To improve the performance, GO nanoparticles were added and nine blends with 40, 60, and 80 ppm GO were prepared and used in the same engine. Below are the main findings.
(1) Among the octanol–diesel blends, D80OCT20 produced better BTE, which was 7.67% higher than diesel. Also, the BSFC was found to decrease by 5% compared with diesel. From emissions point of view, D80OCT20 had reduced HC and CO emissions, whereas NOx emissions were found to have increased.
(2) Adding GO to the diesel–octanol blends, D70OCT30GO0.006 has 10% increased BTE compared with diesel and 5% over the same blend without GO. The BSEC was found to be decreased by 7.5% compared with diesel. From the perspective of emissions, HC emissions decreased by 32% with diesel. However, the NOx value showed a 9.6% increase compared with that of diesel fuel.
(3) ANN is an excellent tool in terms of optimization. As manual optimization techniques are costly and time-consuming, ANN can be very helpful in improving the optimization process.
(4) The ANN model predicts that on changing the injection timing from 21 °CA to 21.5 °CA, there will be increased performance and reduced emissions.
Acknowledgments
The authors extend their appreciation to the Deanship of Scientific Research at King Khalid University for funding this work through large group Research Project under grant number: RGP2/568/44. The authors gratefully acknowledge the Anna Centenary Research Fellowship (ACRF) for providing funding to carry out this research work. A.N. also extends his gratitude to ACRF for granting fellowship. The researchers also express their sincere gratitude to all of the staff members of the Department of Automobile Engineering at the Madras Institute of Technology (MIT) Campus of Anna University in Chromepet, Chennai, Tamil Nadu, India.
Glossary
Abbreviations
- DI
direct injection
- BTE
brake thermal efficiency
- OCT
octanol
- BSEC
brake-specific energy consumption
- BP
brake power
- HC
hydrocarbon
- CO
carbon monoxide
- CO2
carbon dioxide
- NOX
oxides of nitrogen
- ID
ignition delay
- CA
crank angle
- ASTM
American Society for Testing and Materials
- TFC
total fuel consumption
- HRR
heat release rate
- H2O
water
- O2
oxygen
- HSU
Hartridge smoke units
- PPM
parts per million
- FTIR
Fourier transform infrared spectroscopy
- GO
graphene oxide
- ANN
artificial neural network
The authors declare no competing financial interest.
References
- Kalghatgi G. T. The outlook for fuels for internal combustion engines. Int. J. Engine Res. 2014, 15 (4), 383–398. 10.1177/1468087414526189. [DOI] [Google Scholar]
- Baumgarten C.. Mixture Formation in Internal Combustion Engines. Springer Science & Business Media, 2006. [Google Scholar]
- Zhang W.; Chen Z.; Li W.; Shu G.; Xu B.; Shen Y. Influence of EGR and oxygen-enriched air on diesel engine NO–Smoke emission and combustion characteristic. Appl. Energy 2013, 107, 304–314. 10.1016/j.apenergy.2013.02.024. [DOI] [Google Scholar]
- Laden F.; Schwartz J.; Speizer F. E.; Dockery D. W. Reduction in fine particulate air pollution and mortality: extended follow-up of the Harvard Six Cities study. Am. J. Respir. Crit. Care Med. 2006, 173 (6), 667–672. 10.1164/rccm.200503-443OC. [DOI] [PMC free article] [PubMed] [Google Scholar]
- Löndahl J.; Pagels J.; Swietlicki E.; Zhou J.; Ketzel M.; Massling A.; Bohgard M. A set-up for field studies of respiratory tract deposition of fine and ultrafine particles in humans. J. Aerosol Sci. 2006, 37 (9), 1152–1163. 10.1016/j.jaerosci.2005.11.004. [DOI] [Google Scholar]
- Kampa M.; Castanas E. Human health effects of air pollution. Environ. Pollut. 2008, 151 (2), 362–367. 10.1016/j.envpol.2007.06.012. [DOI] [PubMed] [Google Scholar]
- Peel J. L.; Haeuber R.; Garcia V.; Russell A. G.; Neas L. Impact of nitrogen and climate change interactions on ambient air pollution and human health. Biogeochemistry 2013, 114, 121–134. 10.1007/s10533-012-9782-4. [DOI] [Google Scholar]
- Ezzat M. F.; Dincer I. Development and assessment of a new hybrid vehicle with ammonia and hydrogen. Appl. Energy 2018, 219, 226–239. 10.1016/j.apenergy.2018.03.012. [DOI] [Google Scholar]
- Yang B.; Xi C.; Wei X.; Zeng K.; Lai M.-C. Parametric investigation of natural gas port injection and diesel pilot injection on the combustion and emissions of a turbocharged common rail dual-fuel engine at low load. Appl. Energy 2015, 143, 130–137. 10.1016/j.apenergy.2015.01.037. [DOI] [Google Scholar]
- Zhang J.; Huang Z.; Han D. Exergy losses in auto-ignition processes of DME and alcohol blends. Fuel 2018, 229, 116–125. 10.1016/j.fuel.2018.04.162. [DOI] [Google Scholar]
- Wang X.; Gao J.; Jiang D.; Huang Z.; Chen W. Spray characteristics of high-pressure swirl injector analyse with methanol and ethanol. Energy Fuels 2005, 19 (6), 2394–2401. 10.1021/ef050135w. [DOI] [Google Scholar]
- Zhu L.; Cheung C.; Zhang W. G.; Huang Z. Combustion, performance and emission characteristics of a DI diesel engine analyse with ethanol–biodiesel blends. Fuel 2011, 90 (5), 1743–1750. 10.1016/j.fuel.2011.01.024. [DOI] [Google Scholar]
- Hulwan D. B.; Joshi S. V. Performance, emission and combustion characteristic of a multicylinder DI diesel engine running on diesel–ethanol–biodiesel blends of high ethanol content. Appl. Energy 2011, 88 (12), 5042–5055. 10.1016/j.apenergy.2011.07.008. [DOI] [Google Scholar]
- Li Y.; Jia M.; Liu Y.; Xie M. Numerical study on the combustion and emission characteristics of a methanol/diesel reactivity controlled compression ignition (RCCI) engine. Appl. Energy 2013, 106, 184–197. 10.1016/j.apenergy.2013.01.058. [DOI] [Google Scholar]
- Lapuerta M.; García-Contreras R.; Campos-Fernández J.; Dorado M. P. Stability, lubricity, viscosity, and cold-flow properties of alcohol– diesel blends. Energy Fuels 2010, 24 (8), 4497–4502. 10.1021/ef100498u. [DOI] [Google Scholar]
- Kumar S.; Cho J. H.; Park J.; Moon I. Advances in diesel–alcohol blends and their effects on the performance and emissions of diesel engines. Renewable Sustainable Energy Rev. 2013, 22, 46–72. 10.1016/j.rser.2013.01.017. [DOI] [Google Scholar]
- Chen G.; Di L.; Zhang Q.; Zheng Z.; Zhang W. Effects of 2, 5-dimethylfuran fuel properties coupling with EGR (exhaust gas recirculation) on combustion and emission characteristics in common-rail diesel engines. Energy 2015, 93, 284–293. 10.1016/j.energy.2015.09.066. [DOI] [Google Scholar]
- Ma Y.; Huang S.; Huang R.; Zhang Y.; Xu S. Ignition and combustion characteristics of n-pentanol–diesel blends in a constant volume chamber. Appl. Energy 2017, 185, 519–530. 10.1016/j.apenergy.2016.11.002. [DOI] [Google Scholar]
- Atmanli A.; Yilmaz N. A comparative analysis of n-butanol/diesel and 1-pentanol/diesel blends in a compression ignition engine. Fuel 2018, 234, 161–169. 10.1016/j.fuel.2018.07.015. [DOI] [Google Scholar]
- Damodharan D.; Sathiyagnanam A.; Kumar B.; Ganesh K. Cleaner emissions from a DI diesel engine analyse with waste plastic oil derived from municipal solid waste under the influence of n-pentanol addition, cold EGR, and injection timing. Environ. Sci. Pollut. Res. 2018, 25, 13611–13625. 10.1007/s11356-018-1558-5. [DOI] [PubMed] [Google Scholar]
- Huang H.; Lv D.; Zhu J.; Chen Y.; Zhu Z.; Pan M.; Huang R.; Jia C. Development and validation of a new reduced diesel/n-pentanol mechanism for diesel engine applications. Energy Fuels 2018, 32 (9), 9934–9948. 10.1021/acs.energyfuels.8b02083. [DOI] [Google Scholar]
- Chen Z.; Wu Z.; Liu J.; Lee C. Combustion and emissions characteristics of high n-butanol/diesel ratio blend in a heavy-duty diesel engine and EGR impact. Energy Convers. Manage. 2014, 78, 787–795. 10.1016/j.enconman.2013.11.037. [DOI] [Google Scholar]
- Campos-Fernandez J.; Juan M. A.; Gomez J.; Lacalle N.; Dorado M. P. Performance tests of a diesel engine analyse with pentanol/diesel fuel blends. Fuel 2013, 107, 866–872. 10.1016/j.fuel.2013.01.066. [DOI] [Google Scholar]
- Akhtar M. K.; Dandapani H.; Thiel K.; Jones P. R. Microbial production of 1-octanol: a naturally excreted biofuel with diesel-like properties. Metab. Eng. Commun. 2015, 2, 1–5. 10.1016/j.meteno.2014.11.001. [DOI] [PMC free article] [PubMed] [Google Scholar]
- Jin C.; Yao M.; Liu H.; Chia-fon F. L.; Ji J. Progress in the production and application of n-butanol as a biofuel. Renewable Sustainable Energy Rev. 2011, 15 (8), 4080–4106. 10.1016/j.rser.2011.06.001. [DOI] [Google Scholar]
- Wang Q.; Ni J.; Huang R. The potential of oxygenated fuels (n-octanol, methylal, and dimethyl carbonate) as an alternative fuel for compression ignition engines with different load conditions. Fuel 2022, 309, 122129 10.1016/j.fuel.2021.122129. [DOI] [Google Scholar]
- Deep A.; Kumar N.; Karnwal A.; Gupta D.; Vibhanshu V.; Sharma A.; Patel J. S.. Assessment of the Performance and Emission Characteristics of 1-Octanol/Diesel Fuel Blends in a Water Cooled Compression Ignition Engine. No. 2014-01-2830, SAE Technical Paper, 2014.
- Rajesh Kumar B.; Saravanan S.; Rana D.; Anish V.; Nagendran A. Effect of a sustainable biofuel–n-octanol–on the combustion, performance and emissions of a DI diesel engine under naturally aspirated and exhaust gas recirculation (EGR) modes. Energy Convers. Manage. 2016, 118, 275–286. 10.1016/j.enconman.2016.04.001. [DOI] [Google Scholar]
- Wang Q.; Huang R.; Ni J.; Chen Q. Potential improvement in PM-NOX trade-off in a compression ignition engine by n-octanol addition and injection pressure. Processes 2021, 9 (2), 310. 10.3390/pr9020310. [DOI] [Google Scholar]
- Shaafi T.; Sairam K.; Gopinath A.; Kumaresan G.; Velraj R. Effect of dispersion of various nanoadditives on the performance and emission characteristics of a CI engine fuelled with diesel, biodiesel and blends—a review. Renewable Sustainable Energy Rev. 2015, 49, 563–573. 10.1016/j.rser.2015.04.086. [DOI] [Google Scholar]
- Atelge M. R.; Arslan E.; Kahraman N.; Ünalan S. Evaluation of hybrid nanoparticles to oxygenated fuel with ethanol and n-butanol on combustion analyser. Fuel 2023, 344, 128048 10.1016/j.fuel.2023.128048. [DOI] [Google Scholar]
- Ghamari M.; Ratner A. Combustion characteristics of colloidal droplets of jet fuel and carbon based nanoparticles. Fuel 2017, 188, 182–189. 10.1016/j.fuel.2016.10.040. [DOI] [Google Scholar]
- Deshmukh S.; Sai Ram G.; Abhishek G. Effects of using alcohols on the performance and emissions of a diesel engine. J. Phys.: Conf. Ser. 2019, 1276, 012061 10.1088/1742-6596/1276/1/012061. [DOI] [Google Scholar]
- Ashok B.; Nanthagopal K.; Anand V.; Aravind K. M.; Jeevanantham A. K.; Balusamy S. Effects of n-octanol as a fuel blend with biodiesel on diesel engine characteristics. Fuel 2019, 235, 363–373. 10.1016/j.fuel.2018.07.126. [DOI] [Google Scholar]
- Mourad M.; Mahmoud K. Investigation into SI engine performance characteristics and emissions fuelled with ethanol/butanol-gasoline blends. Renewable Energy 2019, 143, 762–771. 10.1016/j.renene.2019.05.064. [DOI] [Google Scholar]
- Agarwal A. K.; Karare H.; Dhar A. Combustion, performance, emissions and particulate characterization of a methanol–gasoline blend (gasohol) fuelled medium duty spark ignition transportation engine. Fuel Process. Technol. 2014, 121, 16–24. 10.1016/j.fuproc.2013.12.014. [DOI] [Google Scholar]
- Yaman H.; Yesilyurt M. The influence of n-pentanol blending with gasoline on performance, combustion, and emission behaviors of an SI engine. Eng. Sci. Technol. 2021, 24 (6), 1329–1346. 10.1016/j.jestch.2021.03.009. [DOI] [Google Scholar]
- Nour M.; Sun Z.; El-Seesy A. I.; Li X. Experimental evaluation of the performance and emissions of a direct-injection compression-ignition engine analyse with n-hexanol–diesel blends. Fuel 2021, 302, 121144 10.1016/j.fuel.2021.12114. [DOI] [Google Scholar]
- Soudagar M. E. M.; Nik-Ghazali N.; Kalam M. A.; Anjum Badruddin I.; Banapurmath N.; Yunus Khan T. M.; Nasir Bashir M.; Akram N.; Farade R.; Afzal A. The effects of graphene oxide nanoparticle additive stably dispersed in dairy scum oil biodiesel-diesel fuel blend on CI engine: performance, emission and combustion characteristics. Fuel 2019, 257, 116015 10.1016/j.fuel.2019.116015. [DOI] [Google Scholar]
- Hoseini S. S.; Najafi G.; Ghobadian B.; Mamat R.; Ebadi M. T.; Yusaf Talal. Novel environmentally friendly fuel: The effects of nanographene oxide additives on the performance and emission characteristics of diesel engines fuelled with Ailanthus altissima biodiesel. Renewable Energy 2018, 125, 283–294. 10.1016/j.renene.2018.02.104. [DOI] [Google Scholar]
- Khan H.; Manzoore Elahi M. S.; Kumar R.; Safaei M.; Farooq M.; Khidmatgar A.; Banapurmath N. R.; et al. Effect of nano-graphene oxide and n-butanol fuel additives blended with diesel—Nigella sativa biodiesel fuel emulsion on diesel engine characteristics. Symmetry 2020, 12 (6), 961. 10.3390/sym12060961. [DOI] [Google Scholar]
- Razzaq L.; Mujtaba M. A.; Soudagar M. M.; Ahmed W.; Fayaz H.; Bashir S.; Rizwanul Fattah I. M.; et al. Engine performance and emission characteristics of palm biodiesel blends with graphene oxide nanoplatelets and dimethyl carbonate additives. J. Environ. Manage. 2021, 282, 111917 10.1016/j.jenvman.2020.111917. [DOI] [PubMed] [Google Scholar]
- Hoseini S. S.; Najafi G.; Ghobadian B.; Ebadi M. T.; Mamat R.; Yusaf T. J. R. E. Performance and emission characteristics of a CI engine using graphene oxide (GO) nano-particles additives in biodiesel-diesel blends. Renewable Energy 2020, 145, 458–465. 10.1016/j.renene.2019.06.006. [DOI] [Google Scholar]
- El-Seesy A. I.; Nour M.; Attia A. M. A.; He Z.; Hassan H. Investigation the effect of adding graphene oxide into diesel/higher alcohols blends on a diesel engine performance. Int. J. Green Energy 2020, 17 (3), 233–253. 10.1080/15435075.2020.1722132. [DOI] [Google Scholar]
- Elumalai P. V.; Parthasarathy M.; Murugan M.; Saravanan A.; Sivakandhan C. Effect of Cerium Oxide Nanoparticles to Improve the Combustion Characteristics of Palm Oil Nano Water Emulsion Using Low Heat Rejection Engine. Int. J. Green Energy 2021, 18, 1482–1496. . [DOI] [Google Scholar]
- Elumalai P. V.; Balasubramanian D.; Parthasarathy M.; Pradeepkumar A. R.; Mohamed Iqbal S.; Jayakar J.; Nambiraj M. An Experimental Study on Harmful Pollution Reduction Technique in Low Heat Rejection Engine Fuelled with Blends of Pre-Heated Linseed Oil and Nano Additive. J. Cleaner Prod. 2021, 283, 124617 10.1016/j.jclepro.2020.124617. [DOI] [Google Scholar]
- Elumalai P. V.; Annamalai K.; Dhinesh B. Effects of Thermal Barrier Coating on the Performance, Combustion and Emission of DI Diesel Engine Powered by Biofuel Oil–Water Emulsion. J. Therm. Anal. Calorim. 2019, 137, 593–605. 10.1007/s10973-018-7948-6. [DOI] [Google Scholar]


