

Abstract
Many neurons exhibit regular firing that is limited to the duration and intensity of depolarizing stimuli. However, some neurons exhibit all-or-nothing plateau potentials that, once elicited, can lead to prolonged activity that is independent of stimulus intensity or duration. To better understand this diversity of information processing, we compared the voltage-gated and Ca2+-gated currents of three identified neurons from hermaphroditic Aplysia californica. Two of these neurons, B51 and B64, generated plateau potentials and a third neuron, B8, exhibited regular firing and was incapable of generating a plateau potential. With the exception of the Ca2+-gated potassium current (IKCa), all three neuron types expressed a similar array of outward and inward currents, but with distinct voltage-dependent properties for each neuron type. Inhibiting voltage-gated Ca2+ channels with Ni+ prolonged the plateau potential, indicating IKCa is important for plateau potential termination. In contrast, inhibiting persistent Na+ (INaP) blocked plateau potentials, empirically and in simulations. Surprisingly, the properties and level of expression of INaP were similar in all three neurons, indicating that the presence of INaP does not distinguish between regular-firing neurons and neurons capable of generating plateau potentials. Rather, the key distinguishing factor is the relationship between INaP and outward currents such as the delayed outward current (ID), and IKCa. We then demonstrated a technique for predicting complex physiological properties such as plateau duration, plateau amplitude, and action potential duration as a function of parameter values, by fitting a curve in parameter space and projecting the curve beyond the tested values.
SIGNIFICANCE STATEMENT Plateau potentials are intrinsic properties of neurons that are important for information processing in a wide variety of nervous systems. We examined three identified neurons in Aplysia californica with different propensities to generate a plateau potential. No single conductance was found to distinguish plateau generating neurons. Instead, plateau generation depended on the ratio between persistent Na+ current (INaP), which favored plateaus, and outward currents such as IKCa, which facilitated plateau termination. Computational models revealed a relationship between the individual currents that predicted the features of simulated plateau potentials. These results provide a more solid understanding of the conductances that mediate plateau generation.
Keywords: Aplysia, KCa, persistent sodium, plateau potential, SNNAP
Introduction
Plateau potentials are intrinsic properties, expressed in a wide variety of neurons that convert graded synaptic input into an all-or-nothing burst of activity. Plateau potentials are important for integrating temporal and spatially synchronized synaptic input (Plotkin et al., 2011). This nonlinearity allows input to reach spike threshold when simple summation of voltage response would be insufficient. At the network level, plateau potentials provide an “up state” that helps synchronize neuronal activity into distinct temporal phases. For example, plateau potentials are important for effective transmission at the cortico-striatal synapse (Plotkin et al., 2011), rhythmic pattern generation in mammalian pre-Bötzinger neurons (Del Negro et al., 2002) and synaptic integration of cortical pyramidal neurons (Milojkovic et al., 2004). Plateau potentials are also important for learning mechanisms, including inducing long-term potentiation to establish hippocampal place fields (Takahashi and Magee, 2009; Bittner et al., 2017). In invertebrates, plateau potentials are important for determining the phasing of motor patterns (Plummer and Kirk, 1990; Bal et al., 1994; Zhang et al., 1995; Nargeot et al., 1999a,b; Erazo-Toscano et al., 2023) and changes in plateau properties are important for reward learning in the feeding system (Nargeot et al., 1999a,b; Brembs et al., 2002; Mozzachiodi et al., 2008; Sieling et al., 2014).
Several membrane currents have been implicated in determining the characteristics of plateau potentials. For example, the persistent Na+ current (INaP) is thought to mediate plateau potentials in many neurons (Carrillo-Reid et al., 2009) and dysregulation of this current has been implicated in sustained neuronal activity such as occurs in epilepsy (Stafstrom, 2007; Wengert and Patel, 2021). In subthalamic neurons, the bursting phenotype is explained at least in part by the ratio between INaP and Ileak (Del Negro et al., 2002). Similarly, the L-type voltage-gated Ca2+ current (ICaL) is also thought to mediate plateau potentials in some neurons (for review, see Binder et al., 2020). However, the extent to which INaP is necessary or sufficient, remains an open question. What prevents plateau potentials from being generated in regular firing neurons? Moreover, in what ways do the outward currents Ca2+-activated K+ (IKCa), delayed K+ (ID), or A-type K+ (IA) regulate the shape and duration of plateau potentials?
To address these questions, we performed a comparative analysis of three identified neurons from the Aplysia feeding circuit, each of which has unique firing patterns. Two of these neurons, B51 and B64, generate plateau potentials in response to brief depolarizing stimuli (Hurwitz and Susswein, 1996; Plummer and Kirk, 1990). A third neuron, B8, exhibits regular firing at a rate that is a graded function of depolarizing stimuli, and is incapable of generating a plateau potential (Morton and Chiel, 1993). Here, we combined computational and experimental approaches to determine the major membrane currents that mediate the characteristic patterns of spike activity of B8, B51, and B64.
Materials and Methods
Animals
Aplysia californica (100–120 g) were obtained from the National Resource for Aplysia (University of Miami, FL). Aplysia are hermaphroditic. Animals were housed in perforated plastic cages in aerated seawater tanks at a temperature of 15°C and were fed ∼1 g of dried seaweed three times per week.
Cell culture
Culturing procedures followed those described in Brembs et al. (2002) and Lorenzetti et al. (2008). Briefly, ganglia from adult Aplysia were treated with Dispase II (9.4 units/ml; neutral protease, grade II; Roche) at 35°C for ∼3 h and was then desheathed. Fine-tipped glass microelectrodes were used to remove individual cells from the ganglia. Each cell was isolated and plated on poly-L-lysine (0.75 mg/ml)-coated Petri dishes with culture medium containing 50% hemolymph, 50% isotonic L15 (Invitrogen). L15 was made of 350 mm NaCl, 29 mm MgCl2, 25 mm MgSO4, 11.4 mm CaCl2, 10 mm KCl, 2 mm HCO3, streptomycin sulfate (0.10 mg/ml), penicillin-G (0.10 mg/ml), dextrose (6 mg/ml), and 15 mm HEPES. The pH of the culture medium was adjusted to 7.5. Cells were maintained for 5–6 d. Before recording, the culture medium was exchanged for isotonic ASW solution containing 425 mm NaCl, 12.5 mm MgSO4, 11.2 mm CaCl2, 42 mm MgCl2, 10 mm KCl, and 12.5 mm HEPES (pH 7.6 titrated with NaOH). In cases where voltage or Ca2+-gated K+-currents were examined N-methyl-D-glucamine (NMDG) substituted Na+ (425 mm). The NMDG substituted ASW (Na+-free ASW) was titrated with HCl.
Intracellular recordings and pharmacology
Intracellular recordings were performed at room temperature (20–22°C) using two fine-tipped glass microelectrodes filled with 3 m potassium acetate (resistance 7–15 MΩ). One electrode was used for monitoring membrane potential and a second for injecting current. Signals were amplified using an Axoclamp-2B (Molecular Devices), and for membrane current an LPF-202A DC amplifier (Warner Instruments, Inc). Current and voltage data were acquired at 5–10 kHz with pClamp software (version 11, Molecular Devices) and filtered with a lowpass filter using MATLAB with the cutoff between 300 and 700 Hz. Whole-cell two-electrode voltage-clamp and pharmacological techniques were used to examine the properties of voltage-gated ion currents. The voltage-clamp protocol was modified to best isolate each conductance. The pharmacological agents were dissolved in 15 ml (∼5× bath volume) and perfused at a rate of 2 ml/min.
Imaging neurons
Images of cultured neurons were taken with a charged-coupled device (CCD) camera (Microcast HD, HDXS 3CCD-1080P) with a Pro-Lite 1080p 2MP frame grabber and stored on drive using the MediCap USB300. The images were captured on the inverted Axiovert S100 (Lieca) with a 20× objective, the same microscope used for electrophysiological recordings. Multiple images were taken to cover the entire neuron and were stitched together using a built-in image registering tool in Adobe Photoshop (Fig. 1D).
Figure 1.

Physiologic properties of plateau-generating and regular-spiking neurons. A, Diagram of rostral surface of right buccal ganglion. Neurons were identified by size and position. B, Neurons were isolated and recordings were made after 5–6 d in culture. C, Firing properties of B8, B51, and B64. Activity was elicited by 1-s duration intracellular current injection in B51 and B64 with increments of 0.1 nA. The first current pulse failed to elicit activity in B51, but a plateau potential and high-frequency spike activity were produced when the current was increased by 0.1 nA. The plateau potential self-terminated after about 25 s. Similar dynamics were exhibited by B64, but the plateau potential in B64 persisted until it was terminated artificially by injecting a hyperpolarizing current. B8 was activated by 5-s duration current injection at 0.5-nA increments to illustrate regular firing that increased in frequency in response to the intensity of the stimuli. D, Images of cultured B8, B51, and B64 neurons.
Pharmacological isolation of currents
I A
The membrane potential was held at −40 mV, stepped to −110 mV for 250 ms to de-inactivate IA, then immediately stepped to potentials ranging from −50 to 20 mV for 500 ms. The interval between each voltage-clamp stimulus (interpulse interval) was set to 4 s. This protocol was conducted in two conditions: 200 μm 4-aminopyridine (4-AP) a concentration that does not block IA and in 10 mm 4-AP, a concentration that inhibits IA. Both cases Na+-free ASW containing 10 mm Ni2+ and 100 μm Cd2+ to block voltage-gated Ca2+ currents and IKCa. The current responses during the two pharmacological conditions were subtracted to isolate IA.
I D
The membrane potential was held at −80 mV, stepped to −40 mV for 300 ms to inactivate IA, then immediately stepped to potentials ranging from −30 to 20 mV for 1 s. The ISI was set to 60 s. ID was measured in Na+-free ASW containing 2 mm tetraethylammonium (TEA) and 10 mm Ni2+ and 100 μm Cd2+ to block IKCa and voltage-gated Ca2+ currents.
IKCa and IKTEA
The membrane potential was held at −80 mV, stepped to −30 mV for 300 ms to inactivate IA, then immediately stepped to potentials ranging from −30 to 20 mV for 500 ms. The ISI was set to 3 s. This protocol was conducted in Na+-free ASW in control saline and in saline containing 4 mm TEA (Baxter and Byrne, 1989; Walsh and Byrne, 1989). The current responses during these two pharmacological conditions were subtracted. This resulted in a current trace with a fast Ca2+-independent component (IKTEA) and slow Ca2+-dependent component (IKCa). To isolate the Ca2+-independent component, the protocol was repeated in Ni2+ and Cd2+, which blocks voltage-gated Ca2+ currents. A second group of neurons was needed because both IKCa and IKTEA are blocked by low concentrations of TEA. The current responses were averaged (B51 n = 5, B64 n = 5, B8 n = 5) and the ratio of IKTEA to IKCa was calculated for each neuron (e.g., B51, B64, and B8). This average response was scaled according to ratio for each recording to isolate the IKCa component of the 4 mm TEA subtraction.
I CaL
The membrane potential was held at −80 mV and stepped to potentials ranging from −40 to 20 mV for 250 ms. The ISI was 30 s. This protocol was repeated in control saline and saline containing the ICaL inhibitor nifedipine (10 μm). The current responses during the two conditions were subtracted to isolate ICaL. Both conditions were in Na+-free ASW containing 10 mm 4-AP and 50 mm TEA to block IA, ID, and IKCa.
I CaR
The membrane potential was held at −80 mV and stepped to potentials ranging from −40 to 20 mV for 250 ms. The ISI was set to 30 s. This protocol was repeated with a 300-ms prepulse to −10 mV to inactivate ICaR. Both protocols were done in the presence of Na+-free ASW containing 10 μm nifedipine, 10 mm 4-AP and 50 mm TEA to block ICaL, IA, ID, and IKCa. The current responses elicited by the protocol without the prepulse were subtracted from the current responses with the prepulse to isolate ICaR.
I NaP
The membrane potential was held at −100 mV, stepped to −40 mV for 20 ms to inactivate the fast INa current, then immediately stepped to potentials ranging from −60 to −20 mV for 1 s. The ISI was set to 30 s. This protocol was repeated in ASW containing the voltage-gated Na+ inhibitor tetrodotoxin (10 μm TTX). The current responses during the two pharmacological conditions were subtracted to isolate INaP.
Fitting equations to current responses
The built-in MATLAB function lsqcurvefit with the default “trust-region-reflective” or the Levenberg-Marquardt least squares algorithms was used for all automated curve fitting of current responses and steady-state activation and inactivation curves (discussed in the following section). Biologically plausible limits on the fitting parameters are indicated in parentheses.
IA current traces were fit with the following single-exponential equation:
| (1) |
where A is a positive value representing the amplitude of the current, s is the time constant of inactivation and b is a baseline offset. This curve was fitted to a 200-ms region starting 25 ms after the start of the pulse for each command potential. The curve was extrapolated backwards 25 ms to obtain the initial current at the start of the pulse.
ID current traces were fit with a double-exponential equation to estimate the activation time constant, as follows:
| (2) |
where the parameter A (1 ≥ A ≥ 1.5 times peak current) is a measure of the steady-state current during maximum activation without inactivation, the first exponential is activation with a time constant of 0.01 s, and the second exponential is inactivation. To reduce the number of fitting parameters, the activation time constant was fixed at 0.01 s, a value which provided the best fit for the data. The parameter s (s ≤ 0.16 s) is the time constant of inactivation. B is the amount of inactivation and was determined by a voltage step to 30 mV following a 1-s step to various potentials (Fig. 2K; Extended Data Fig. 2-1B). The second term of Equation 2–4 is equal to B∞ in Equation 15 when time is conducted to infinity. The current response measured at 18.7 ms after the start of the 30-mV pulse was normalized to the current measured with the prepulse that resulted in no inactivation (−30 mV). As for IA, ICaL, and ICaR, the inactivation data were fit with Equation 5. The values returned from the fitted equation are inserted for B in Equation 2.
Figure 2.
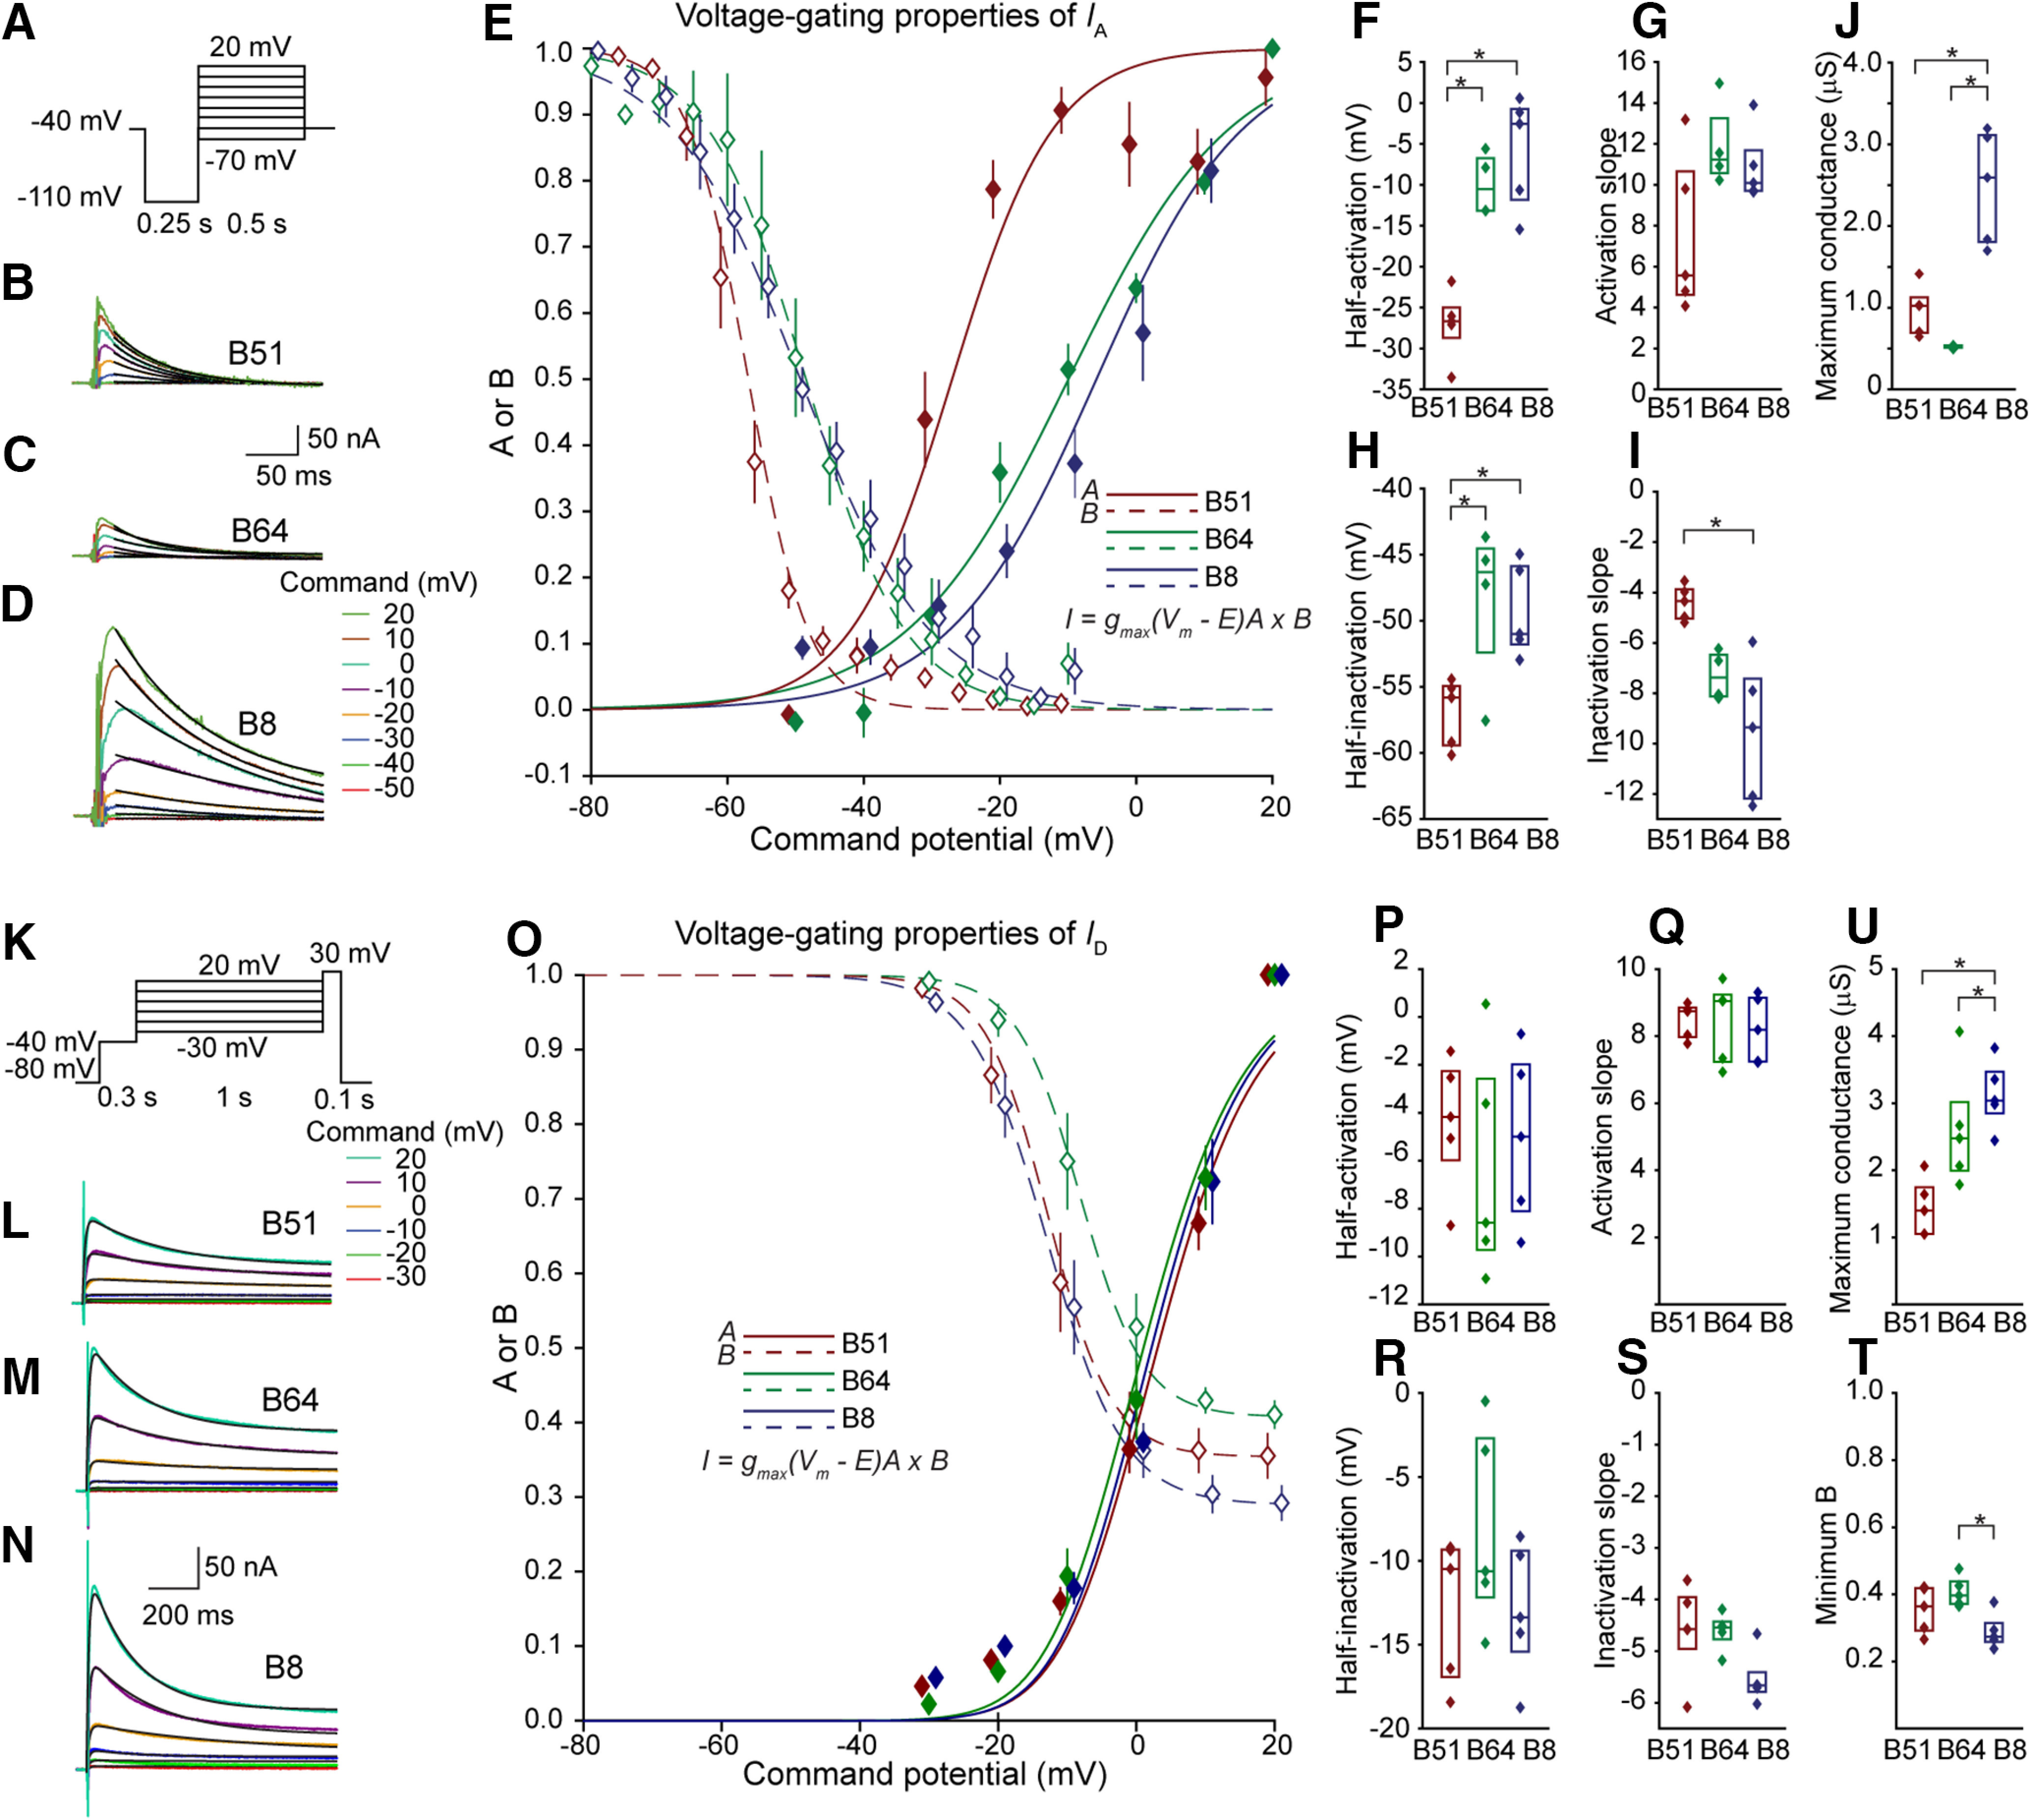
The conductances of IA and ID were increased in the regular firing neuron B8 compared with the plateau generating neuron B51 and B64. A, Voltage-clamp protocol to measure IA. A 250-ms duration hyperpolarizing prepulse was used to de-inactivate IA. 4-AP was used to block IA (Materials and Methods). Inactivation of IA was measured by a separate voltage-clamp protocol (Extended Data Fig. 2-1). B–D, 4-AP subtracted current response indicating IA for B51 (B), B64 (C), and B8 (D) for each command potential. A single exponential equation (Eq. 1; Materials and Methods) was fitted to a 200-ms region beginning 25 ms after start of the command pulse (black line). E, Summary data for the inactivation (dashed line, open diamonds) and activation curves (solid line, solid diamonds). The data were fit with Boltzmann equations (Eqs. 12 and 15) with minimum A and B (minimum activation and maximum inactivation) set to 0. Data are represented as mean and standard error. F–I, Summary data for the maximum conductance (Eq. 7) half-activation, activation slope parameter, half inactivation, and inactivation slope parameter of the Boltzmann equations (Eqs. 12 and 15). Data are represented by a box-plot, median is a horizontal line and the interquartile range is represented by a rectangle. J, Maximum conductance of IA was estimated by extrapolating the fitted exponential curve to the beginning of the pulse and calculating conductance using Ohm's law. K, Voltage-clamp protocol to measure ID. A 300-ms duration prepulse at −40 mV was given to inactivate and reduce contamination by IA, making use of the lower threshold of inactivation of IA. The current responses were measured in 2 mm TEA to block IKCa. The final 100-ms pulse to 30 mV measured the amount of inactivation. L–N, Current response indicating ID for B51 (L), B64 (M), and B8 (N) for each command potential. The product of two exponential equations (Eq. 2) was fitted to a 1-s region beginning at the start of the command pulse (black line). O, Summary data for the inactivation (dashed line, open diamonds) and activation curves (solid line, solid diamond) and fitted Boltzmann equations (Eqs. 12 and 15). Data represented as mean and standard error. P–T, Summary data for the parameters of the Boltzmann equations. U, Maximum conductance calculated using Ohm's law. Sample sizes are: B8, n = 5; B51, n = 5; B64, n = 4 for IA; and B8, n = 5; B51, n = 4; B64, n = 5 for ID. For all box-plots here and subsequently, statistical significance (p < 0.05) is indicated by a star and the lack of a star indicates that the comparison did not reach statistical significance. The inactivation traces for IA and ID are illustrated in Extended Data Figure 2-1A,B and the time constant analyses for IA and ID are illustrated in Extended Data Figure 2-2A,B. The parameter values of the Boltzmann equations of all currents are provided in Extended Data Table 2-1.
IKTEA current traces were fit with the following single exponential equation:
| (3) |
where A (A ≥ 0) is the maximum current. B (0 ≥ B ≥ 1) is the steady-state inactivation. For Equation 3, B was not directly measured using a separate voltage-clamp protocol. The parameter s (0.05 ≥ s ≥ 2) is the inactivation time constant.
ICaL and ICaR current traces were fit with the following double-exponential equation:
| (4) |
where A (−100 ≥ A ≥ 0 nA) is the maximum current. s1 (ICaL: 0.002 ≥ s1 ≥ 0.05, ICaR: 0.001 ≥ s1 ≥ 0.05) is the activation time constant, and s2 (ICaL: 0.02 ≥ s1 ≥ 0.5, ICaR: 0.025 ≥ s1 ≥ 0.5) is the inactivation time constant. B is the amount of inactivation and was measured by a separate voltage-clamp protocol. A 1-s prepulse that ranged from −70 to −10 mV was followed by a 200-ms pulse to 0 mV to measure the amount of inactivation. To determine the time constant of inactivation (s2), the current response to 0 mV was fit with a single exponential (Eq. 1) and extrapolated back to the start of the pulse. B was equal to 1 minus the extrapolated current divided by the current following a −30-mV prepulse.
INaP current traces were fit with the following double-exponential equation:
| (5) |
where A is the maximum activation and limited to between 0 and −30 nA. The value 0.001 is the activation time constant. Initial fittings indicated that the amount of inactivation was ∼0.5 for all three neurons in the range of potentials used to measure INaP, so we fixed the value to 0.5 for simplification and to reduce the degrees of freedom of the fitting algorithm. s (0.2 ≥ s ≥ 5) is the inactivation time constant.
Model equations
Conductance-based models for B51, B64, and B8 were generated and simulations conducted with simulator for neural networks and action potentials (SNNAP; version 8.1; Baxter and Byrne, 2007). The three neurons were modeled as isolated compartments with no synaptic (electrical or chemical) connections between them. The membrane potential was determined by the following differential equation:
| (6) |
where Cmi is the membrane capacitance, IStim is the extrinsic stimulus current, Ivdij denotes voltage dependent current. Each current was determined by the following equation:
| (7) |
where gvdij is the maximum conductance, Aij represents the voltage-dependent and time-dependent activation, Bij the voltage-dependent and time-dependent inactivation, Vi the membrane potential. Eij is the equilibrium potential and was −63 mV for Ileak; −70 mV for ID, IA, IKCa, and IKTEA; 60 mV for INaP, ICaR, and ICaL, and −40 mV for IHCN. The parameter p was three for INa and 1 for all other channels. f(BR) is included for IKCa and denotes regulation by a Ca2+ ion pool. For Ileak, Aij, Bij and f(BR) are fixed at 1. For IKCa, f(BR) is determined by the following equations:
| (8) |
| (9) |
where τ is the time constant and was 20 s for B51 and B64 and 0.7 s for B8. The concentration of Ca2+ is determined by the following equation. BR is the amount of regulation of the conductance.
| (10) |
K1 was set to 80 for B8 and 8 for B51 and B64. K2 was set to 1 for all three neurons.
The activation Aij is determined by the following Boltzmann-type equations:
| (11) |
| (12) |
where A is the level of activation, h is the voltage of the inflection point (half-activation), V is the voltage, and s is the slope parameter. We used a MATLAB curve fitting algorithm to estimate the parameters for this equation. The maximum current (A in Eqs. 1–5) was converted to conductance using Ohm's law. To obtain the activation level, the conductance values at each potential were normalized to the maximum conductance of all membrane potentials measured for that cell. The activation data for each cell were fit with Equation 12 (Figs. 2E,O, 3G, 4E,O, 5G, solid diamonds, solid lines). For the voltage-gated Ca2+ currents, h was limited to between −50 and 10 mV and s was limited to between 0 and 20.
Figure 3.

IKCa facilitates the termination of plateau potentials. A, Application of Ni2+ increased the duration of the plateau potential of B51. Activity elicited by 1-s duration suprathreshold stimulation. B, Summary data of effects of Ni2+ on the B51 plateau potential. The duration was measured as the amount of time after the stimulus above −70 mV. Data are represented as a boxplot, median is a horizontal line and the interquartile range is represented as a rectangle. Sample size, n = 8. C, Voltage-clamp protocol to measure IKCa. D, The current responses to a voltage step to 20 mV. Responses in control were subtracted from responses in 4 mM TEA (teal). This procedure was repeated in a second set of B51 neurons in the presence of Ni2+ + Cd2+ to measure the calcium-insensitive outward component, which was averaged (see Extended Data Fig. 3-1). This average calcium-insensitive current response was normalized to the current response in the absence of Ni2+ + Cd2+ (gray). E, IKCa for B51. The averaged calcium-insensitive outward current at each command potential was subtracted from responses without Ni2+ + Cd2+ to isolate IKCa. F, TEA-subtracted current responses to a 20-mV step in B64 in the absence of Ni2+ + Cd2+ (teal) and the average TEA-subtracted current responses in a second set of B64 neurons. G, There was no apparent IKCa for B64 when the averaged calcium-insensitive outward current was subtracted from responses without Ni2+ + Cd2+. H, TEA-subtracted current responses to a 20-mV step in B8 in the absence of Ni2+ + Cd2+ (teal) and the average TEA-subtracted current responses in a second set of B8 neurons. I, IKCa for B8. The averaged calcium-insensitive outward current was subtracted from responses without Ni2+ + Cd2+ to isolate IKCa. J, Current response of IKCa. Mean current of last 50 ms of −10-mV voltage step. Sample sizes: B8, n = 6; B51, n = 5; B64, n = 5.
Figure 4.

The conductances of ICaL and ICaR were increased in B8 compared with B51. A, Voltage-clamp protocol to measure ICaL. The current responses in control were subtracted from responses in 10 µm nifedipine to isolate ICaL. Inactivation for ICaL was measured by a separate voltage-clamp protocol (Extended Data Fig. 2-2). B–D, Subtracted current responses indicating ICaL for B51 (B), B64 (C), and B8 (D) for each command potential. A double exponential equation (Eq. 4) was fitted to a 100-ms region beginning 2 ms after start of the command pulse (black line). E, Summary data for the inactivation (dashed line, open diamonds) and activation curves (solid line, solid diamonds). The data were fit with Boltzmann equations (Eqs. 12 and 15) with minimum A and B (minimum activation and maximum inactivation) set to 0. Data are represented as mean and standard error. F–I, Summary data for the parameters of the Boltzmann equations. Data are represented by a boxplot, median is a horizontal line and the interquartile range is represented by a rectangle. J, Maximum conductance of ICaL was calculated using Ohm's law. K, Voltage-clamp protocol to measure ICaR. A 300-ms prepulse to −10 mV was given to inactivate ICaR. Protocols were administered in the presence of nifedipine to block ICaL. The current responses without prepulse were subtracted from responses with the prepulse to isolate ICaR. Inactivation for ICaR was measured by a separate voltage-clamp protocol (Extended Data Fig. 2-2). L–N, Subtracted current response indicating ICaR for B51 (A), B64 (B), and B8 (C) for each command potential. A double exponential equation (Eq. 4) was fitted to a 120-ms region beginning 8 ms after the start of the command pulse (black line). O, Summary data for the inactivation (dashed line, open diamonds) and activation curves (solid line, solid diamond) and fitted Boltzmann equations (lines; Eqs. 12 and 15). Data represented as mean and standard error. P–T, Summary data for the parameters of the Boltzmann equations. U, Maximum conductance calculated using Ohm's law. Sample sizes: ICaL B8, n = 5; B51, n = 5, and B64, n = 5; for ICaR: B8, n = 5; B51, n = 5; B64, n = 5. The inactivation traces for ICaL and ICaR are illustrated in Extended Data Figure 2-1C,D, and the time constant analyses for ICaL and ICaR are illustrated in Extended Data Figure 2-2C–F.
For the activation time constant:
| (13) |
where V is the voltage, h1,2 determine the voltage of the inflection points, s1,2 are slope parameters, τmax is the maximum time constant, and τmin is the minimum time constant. For simplification and to aid in curve fitting of the current traces, the activation time constants of ID, IKTEA, INaP were fixed to 0.01 s and IKCa time constant was fixed to 0.009 s. For voltage-gated Ca2+ currents, the activation time constants depended on the voltage-clamp potential. To incorporate this voltage dependence into the model, the voltage dependencies of the activation time constants were fit by hand with Equation 13 (Extended Data Fig. 2-2). For IA, the parameters for voltage dependence of the activation time constant were set to: B51, τmax = 0.03 s, τmin = 0.001 s, h1 = −30 mV, s1 = −5.7; B64, τmax = 0.02 s, τmin = 0.002 s, h1 = −20 mV, s1 = 5.7; B8, τmax = 0.025 s, τmin = 0.007 s, h1 = −20 mV, s1 = 6. For all three neurons, the second term in the denominator was not included. The voltage dependence of the activation time constants in the model and the corresponding empirical data are provided in Extended Data Figure 2-2.
The inactivation, Bij (Eq. 7), was defined by the following equations:
| (14) |
| (15) |
| (16) |
where V is the voltage, h1,2 determine the voltage of the inflection points, s1,2 are slope parameters, τmax is the maximum time constant, τmin is the minimum time constant. The level of inactivation (Extended Data Fig. 2-1) for each measured potential was fit with Equation 15. For IA and voltage-gated Ca2+ currents, Bmin was fixed at 0. For voltage-gated Ca2+ currents, h was limited to negative voltages. The inactivation time constants were estimated as s in the exponential decay terms in Equations 1–5. There did not appear to be any voltage dependence in inactivation time constants for IA and ICaL so the means of the inactivation time constants for all potentials were compared among the neurons (Extended Data Fig. 2-2A,D). There did appear to be voltage-dependence in the inactivation time constants for ID, ICaR, INaP. For ID and ICaR, the voltage dependence of the inactivation time constant seemed to be best fit by a sigmoidal equation and so the second term in the denominator of Equation 16 was not included. The voltage dependence of inactivation time constants of INaP was fit using Equation 16. The voltage dependence of inactivation time constants for ID was fit manually or by a MATLAB curve fitting algorithm. The voltage dependence of the inactivation time constants in the model and the corresponding empirical data are provided in Extended Data Figure 2-2.
This study did not characterize Na+-fast (INa), so the model for this current was guided by data of its characterization in Aplysia pedal neurons (Gilly et al., 1997) and was identical for all three neuron models. Parameter values were as follows. In Equation 7, = 50 µS, p = 3, E = 60 mV. In Equation 12, h = −16.6 mV, s = 6.66. In Equation 13, τmax = 0.035 s, τmin = 0.00024 s, h1 = −30 mV, s1 = 5.382, h2 = −17, s2 = −9.9. In Equation 15, h = −24 mV, s = 3.807; and in Equation 16, τmax = 0.042 s, τmin = 0.001 s, h1 = −32 mV, s1 = 14.47. The second term in the denominator of Equation 16 was not included for INa.
The medians and interquartile ranges of the parameters governing steady-state voltage dependencies of all currents, estimated by the curve fitting routines, are provided in Extended Data Table 2-1 and the parameters defining the time constants are provided in the legend of Extended Data Figure 2-2. As a first step, we attempted to simulate the current responses using the median values of these parameters. The simulated current response using the median parameter values did not match the current responses of the neurons nor did the firing patterns of the model match the simulated firing pattern. This finding is unsurprising given that the measurements of parameters were performed in cells isolated from different animals. Therefore, the parameter values were adjusted by trial and error to obtain better fits of the current responses (Extended Data Fig. 6-1) and the firing patterns of the neurons (Fig. 6E) while staying as close as possible to the median parameter values. In most cases this procedure resulted in parameter values that lie within the interquartile ranges of the empirical data.
Figure 6.

Simulations indicated that outward currents IKCa, IA, and ID terminated plateau potentials and could suppress the initiation of plateau potentials. A, Diagram of the conductance-based model for the three neurons. Each neuron was modeled as a single compartment containing ID, IA, IKTEA, IKCa, INaP, INa, ICaR, ICaL, and IHCN for B8. IKTEA is described in Extended Data Figure 3-1. Comparison of the current response to voltage commands between the model and empirical data is provided in Extended Data Figure 6-1. B–D, Plots showing the dominant steady-state current for each membrane potential. Ileak and IHCN dominate near the holding potential (−80 mV), INaP dominates between −60 and −30 mV, INa dominates between −30 mV and −10 mV, ID and IKCa dominate above −10 mV. E, Voltage and current responses during activity triggered by a simulated 1-s, 3-nA current injection. B8 has a pronounced sag potential (Díaz-Ríos and Miller, 2006) and rebound excitation (Kabotyanski et al., 2000); thus, we confirmed the presence of IHCN (see Extended Data Fig. 6-2) and substituted this current for ILeak in B8. the horizontal lines on the panels for Ileak and IHCN indicate 0 current. Passive properties could not explain the differences in firing properties (Extended Data Fig. 6-3). The parameter values of Equations 7, 12, and 15 for all currents in the model are provided in Extended Data Table 2-1.
Data and code availability
Raw data and annotated spreadsheets are deposited on Google Drive. A link will be provided on request. The code for mathematical simulation is provided on ModelDB. The analysis routines were written in MATLAB and are provided on GitHub at https://github.com/Byrne-Lab/Neveu_2023. Any additional information for reanalyzing the data are available from the Lead Contact on request.
Statistical analyses
MATLAB was used for all statistical analyses. For all comparisons p values < 0.05 were considered significant. A Lilliefors goodness-of-fit test was used to test for normality of the distribution. Nonparametric tests were used when normality could not be assumed. The Student's t test was used for comparing two groups. ANOVA or Kruskal–Wallis with the Tukey–Kramer post hoc test was used for comparing multiple groups. The confidence intervals were calculated by a built-in MATLAB function with an α value of 0.05.
Results
Neurons B51, B64, and B8 differ in their ability to generate plateau potentials
To investigate mechanisms of plateau generation, B51, B64, and B8 were isolated from Aplysia buccal ganglia (Fig. 1A) and maintained in cell culture (Fig. 1B). In culture, 36% of B51 neurons generated a plateau potential. Once elicited the plateau in B51 always self-terminated and lasted 5.89 ± 1.62 s (n = 36) after the end of the stimulus (Fig. 1C). B64 generated a plateau potential in 85% of the cases (n = 26) and the plateau did not self-terminate in the majority of the cases (91%). In one example, the B64 plateau lasted ∼80 s before being terminated by a negative current injection (Fig. 1C). B8 exhibited tonic regular spiking activity limited to the duration of the stimulus, which increased in frequency as a function of the intensity of stimulation. Importantly, B8 failed to generate a plateau potential regardless of the amount of current injected in any of the B8 neurons examined (Fig. 1C). The activity of these neurons recapitulated their activity in the intact circuit (Plummer and Kirk, 1990; Hurwitz and Susswein, 1996; Lorenzetti et al., 2008; Mozzachiodi et al., 2008) with the exception that in situ the B64 plateau potential is eventually terminated by feedback from an inhibitory neuron (Nargeot et al., 2002).
Inactivation measurements. A, Inactivation measurements for IA. Currents measured at −10 mV elicited by a 1-s prepulse at the indicated potentials. Current was measured by taking the mean of a 4-ms segment 45 ms after start of pulse (arrow). The inactivation at each potential is obtained by normalizing the measurements to the measured value with a −80-mV prepulse. B, Inactivation measurements for ID. Currents measured at 30 mV elicited by a 1-s prepulse at the indicated potentials. Current was measured 18.7 ms after the start of the pulse (arrow). The inactivation at each potential is obtained by normalizing the measurements to the measured value with a −30-mV prepulse. C, Inactivation measurements for ICaL. Currents measured at 0 mV elicited by a 1.5-s prepulse at the indicated potentials. A single exponential was fitted to a 150-ms segment of data during the decay phase (starting 35 ms after the start of the pulse). The curve was then extrapolated back to 0 ms. The inactivation at each potential is obtained by normalizing the measurements to the measured value with a −70-mV prepulse. D, Inactivation measurements for ICaR. The same methods were used as in Panel C. For B51, a different set of cells were used than for Figure 4K–S. Download Figure 2-1, TIF file (8.5MB, tif) .
Voltage-dependence of activation and inactivation time constants. A, The inactivation time constants for IA were averaged across all measured voltages. Inactivation time constant was greater in B8 IA compared to B51 and B64 (B51 = 0.054(0.051, 0.063) MΩ, B64 = 0.048(0.040, 0.055) MΩ, B8 = 0.18(0.17,0.20) MΩ; F(2,13) = 117.4, p = 3.8 × 10⁻⁸; post hoc B51 vs B64, p = 0.61; B51 vs B8, p = 1.4 × 10⁻⁷; B64 vs B8, p = 1.19 × 10⁻⁷). Plus signs indicate the values used for the models and were 0.035 s for B51 and B64 and 0.14 s for B8. B, The inactivation time constants for ID. Equation 16 without the second term in the denominator was used to fit these data. Solid lines indicate the time constants for the modeled current. Parameters were: B51, τmax = 3 s, τmin = 0.26 s, h = −14 mV, s = 7; B64, τmax = 5.8 s, τmin = 0.18 s, h = −60 mV, s = 15; B8, τmax = 2 s, τmin = 0.15 s, h = −14 mV, s = 8. C, The activation time constants for ICaL. Equation 16 was used to fit these data. Solid lines indicate the time constants for the modeled current. Parameters were: B51, τmax = 0.06 s, τmin = 0.002 s, h1 = −15 mV, s1 = −13, h2 = 5, s2 = 13; B64, τmax = 0.0088 s, τmin = 0.002 s, h1 = 0 mV, s1 = −4, h2 = 35, s2 = 4; B8, τmax = 0.08 s, τmin = 0.002 s, h1 = −20.5 mV, s1 = −13, h2 = 15, s2 = 13. D, The inactivation time constants for ICaL were averaged across all measured voltages. Inactivation time constant was greater in B51 ICaL compared to B8 and there was a trend toward being greater than B64 (B51 = 0.22(0.17, 0.27) MΩ, B64 = 0.12(0.11, 0.22) MΩ, B8 = 0.049(0.039,0.06) MΩ; F(2,14) = 9.75, p = 0.003; post hoc B51 vs B64, p = 0.22; B51 vs B8, p = 0.0024; B64 vs B8, p = 0.054). Plus signs indicate the values used for the models and were 0.035 for B8, 0.12 for B51, and 0.14 for B64. E, The activation time constants for ICaR. Equation 16 was used to fit these data. Solid lines indicate the time constants for the modeled current. Parameters were: B51, τmax = 0.03 s, τmin = 0.001 s, h1 = −10 mV, s1 = −5.3, h2 = 14, s2 = 5.6; B64, τmax = 0.02 s, τmin = 0.001 s, h1 = 13 mV, s1 = −12.7, h2 = 25, s2 = 13; B8, τmax = 0.076 s, τmin = 0.001 s, h1 = −1 mV, s1 = −7.2, h2 = 23, s2 = 7.2. F, The inactivation time constants for ICaR. Equation 16 without the second term in the denominator was used to fit these data. Solid lines indicate the time constants for the modeled current. Parameters were: B51, τmax = 0.08 s, τmin = 0.038 s, h = 0 mV, s = 5; B64, τmax = 0.036 s, τmin = 0.025 s, h = 0 mV, s = 0.46; B8, τmax = 0.043 s, τmin = 0.025 s, h = 1 mV, s = 6. G, The inactivation time constants for INaP. Equation 16 was used to fit these data. Solid lines indicate the time constants for the modeled current. Parameters for B51, B64, and B8 were: τmax = 2.5 s, τmin = 0.25 s, h1 = −55 mV, s1 = −1.5, h2 = −45, s2 = 1.5. Download Figure 2-2, TIF file (8.1MB, tif) .
Table of all of the steady state parameters of the voltage gated ion currents. The parameter name is listed in the left column ḡ (ḡvdij in Eq. 7), hact (h in Eq. 12), sact (s in Eq. 12), hina (h in Eq. 12), bina (s in Eq. 15), Bmin (Bmin in Eq. 15). For each neuron, the parameter value used in the model is under the column labeled Model, and the summary data of the measured value is in the column labeled Empirical. The empirical values are represented as medians with the 25th and 75th percentiles in parentheses. The statistical results and P values comparing the empirical data of the three neurons are provided in the columns labeled Statistics and P value, respectively. P values from post hoc comparisons are provided in the right three columns. The summary data are also represented in boxplots in Extended Data Figures 2-5. * The parameters for IKCa were estimated by manually adjusting the parameters in the model and comparing the response to simulated voltage commands to responses in the empirical data set. Model parameter values that are outside the interquartile range are in bold. # The inactivation slope for IKTEA was fixed at −5 (see Materials and Methods). ǂ The inactivation for INaP was fixed at these values. Ileak was set to 0.046 nS in B51 and 0.065 nS in B64 and 0 nS in B8. Download Table 2-1, DOCX file (23.6KB, docx) .
IKTEA is increased in B8. A, Voltage-clamp protocol to measure IKTEA. 10 mM 4-AP was used to block IA and 10 mM Ni2+ and 100 µM Cd2+ was used to block voltage-gated calcium channels and IKCa. B–D, 4 mM TEA subtracted current response indicating an unidentified outward current for B51 (B), B64 (C), and B8 (D) that we label here IKTEA. A single exponential equation (Eq. 1) was fitted to a 500-ms region beginning 25 ms after start of the command pulse. E, Summary data for the activation curves (solid line, solid diamond). These data were fit with Boltzmann equations (Eq. 12) with minimum A (minimum activation) set to 0. Data are represented as mean and standard error. F, Summary data for the inactivation curves (solid line, solid diamond). These data were fit with Boltzmann equations (Eq. 15). Data are represented as mean and standard error. G–J, Summary data for the parameters of the Boltzmann equations (Eqs. 15 and 15). Data are represented by a boxplot, median is a horizontal line and the interquartile range is represented by a rectangle. K, Maximum conductance of IKTEA was estimated by extrapolating the fitted exponential curve to the beginning of the pulse and calculating conductance using Ohm's law. L, Mean current responses of IKTEA for B51, B64, and B8 compared to simulation results. The time constant parameters were: B51, τmax = 0.8 s, τmin = 0.08 s, h1 = 18 mV, s1 = −2, h2 = 20 mV, s2 = 2; B64, τmax = 1.1 s, τmin = 0.2 s, h1 = −13 mV, s1 = −2, h2 = −6 mV, s2 = 2; B8, τmax = 1.4 s, τmin = 0.2 s, h1 = −2 mV, s1 = −1.5, h2 = 3.5 mV, s2 = 1.5. Download Figure 3-1, TIF file (10.6MB, tif) .
Using two-electrode voltage-clamp and pharmacological techniques, we characterized the ionic currents mediating the plateau potentials in B51 and B64, and investigated whether these currents are more similar in B51 and B64 compared with the regular firing neuron B8.
Outward currents of bursting and regular firing neurons
We characterized the fast activating/inactivating IA, the relatively slower activating/inactivating ID, and the Ca2+ activated IKCa, which are known to regulate action potential repolarization in mammals as well as Aplysia (Byrne, 1980; Baxter and Byrne, 1989).
I A
IA was isolated using the selective antagonist 4-aminopyridine (4-AP; see Materials and Methods). The protocol, sample traces and analysis are illustrated in Figure 2A–J. The inactivation traces are illustrated in Extended Data Figure 2-1A and the time constant analyses are illustrated in Extended Data Figure 2-2A. The maximum conductance of IA (A) was larger in B8 compared with B51 and B64 (Fig. 2J; F(2,13) = 23.7, p = 0.0001; post hoc, B51 vs B64, p = 0.36; B51 vs B8, p = 7.2 × 10⁻⁴; B64 vs B8, p = 1.4 × 10⁻⁴), suggesting a role of IA in suppressing plateau potential initiation. The half-activation of IA in B51 is shifted to more hyperpolarized potentials compared with B64 and B8 (Fig. 2F; F(2,13) = 22.5, p = 0.0001; post hoc, B51 vs B64, p = 0.0014; B51 vs B8, p = 0.00,014; B64 vs B8, p = 0.50) and the half-inactivation of IA was likewise leftward shifted in B51 compared with B64 and B8 (Fig. 2H; F(2,13) = 5.94, p = 0.018; post hoc, B51 vs B64, p = 0.029; B51 vs B8, p = 0.036; B64 vs B8, p = 0.95). The inactivation slope parameter was reduced (corresponding to a steeper curve) in B51 compared with B8 (Fig. 2I; F(2,13) = 10.4, p = 0.0029; post hoc, B51 vs B64, p = 0.082; B51 vs B8, p = 0.002; B64 vs B8, p = 0.19). The activation slope parameter in B51 appeared to be reduced compared with B64 and B8 (Eq. 12) but the trend was not significant (Fig. 2G; F(2,13) = 3.18, p = 0.081). For B51, the leftward shift and steeper slope in the inactivation curve would reduce IA activation and facilitate the generation of a plateau potential in B51. For B8, the greater A in B8 could help prevent any plateau (see below).
I D
ID was isolated using tetraethylammonium (TEA) subtraction (see Materials and Methods). The protocol, sample traces and analyses are illustrated in Figure 2K–U. The inactivation traces are illustrated in Extended Data Figure 2-1B and the time constant analyses are illustrated in Extended Data Figure 2-2B. The maximum conductance (D) was increased in B8 compared with B51, and B64 tended to have an increased D compared with B51 (Fig. 2U; F(2,14) = 9.19, p = 0.0038; post hoc, B51 vs B64, p = 0.033; B51 vs B8, p = 0.0034; B64 vs B8, p = 0.43). The half-activation was not different among the three neurons (Fig. 2P; F(2,14) = 0.36, p = 0.70), nor was the activation slope parameter (Fig. 2Q; F(2,14) = 0.10, p = 0.90). ID did not completely inactivate for all tested command potentials. The maximum level of inactivation (i.e., minimum B) was compared among neurons and found to be significantly greater (lower levels of B in Eq. 15) for B8 compared with B51 and B64 (Fig. 2T; F(2,14) = 5.43, p = 0.021; post hoc, B51 vs B64, p = 0.33; B51 vs B8, p = 0.21; B64 vs B8, p = 0.016). No significant difference was observed in the half-inactivation (Fig. 2R; F(2,14) = 1.57, p = 0.25) or inactivation slope parameter (Fig. 2S; H(2) = 5.42, p = 0.067). These data indicate that ID would be activated by the sustained depolarization of the plateau; and thus, ID could affect plateau duration. In addition, the larger D in B8 could prevent the initiation of plateau potentials by repolarizing the membrane potential following each action potential.
I KCa
IKCa was investigated by blocking voltage-gated Ca2+ channels and thereby preventing the activation of IKCa (Fig. 3A,B). The voltage-gated Ca2+ current blocker Ni2+ increased the duration of the plateau potential in B51 (paired t test, t(7) = 2.80, p = 0.027), indicating that a Ca2+-activated K+ current contributed to the termination of the plateau. Plateaus lasting longer than 80 s were terminated by negative current injection. In some cases, B51 neurons, which did not express a plateau potential in control saline, exhibited a strong plateau in the presence of Ni2+ (Fig. 3B), which blocks ICaR. These data suggest that IKCa provides an inhibitory constraint on plateau potentials and that IKCa is activated, at least in part, by the calcium influx of ICaR. We characterized IKCa and compared its properties among the three neurons. IKCa was isolated using a 4 mm TEA subtraction. This protocol was repeated in a second group of cells in the presence of Ni2+ + Cd2+ to estimate the Ca2+-independent component (IKTEA; Fig. 3D,F,H; Extended Data Fig. 3-1; see Materials and Methods). The protocol, sample traces and analyses are illustrated in Figure 3C–I. IKCa was expressed in B51 and B8, but not in B64 (Fig. 3D–I). IKCa was increased in B8 compared with B51 and was approximately zero in B64 when measured at −10 mV (B51 = 5.07 nA, B64 = −1.48 nA, B8 = 12.59 nA; ANOVA, F(2,18) = 17.94, p = 8 × 10⁻⁵; post hoc, B51 vs B64, p = 0.033; B51 vs B8, p = 0.018; B64 vs B8, p = 5.3 × 10⁻⁵; Fig. 3J) and more positive potentials. Surprisingly, the rates of activation and deactivation were much faster in B8 compared with B51 (compare Fig. 3I and E), which could be a result of the kinetics of the Ca2+ pool that activates IKCa. The lack of IKCa in B64 could be because of the lack of expression of the channel itself or a reduced expression of voltage-gated calcium currents. Thus, we next sought to characterize the voltage-gated Ca2+ currents.
Voltage-gated Ca2+ currents
Two Ca2+ currents, ICaL and ICaR (for review, see Kits and Mansvelder, 1996), were characterized because these currents are known to be important modulators of plateau potentials (Pierson et al., 2005; Binder et al., 2020) and IKCa (Kim and Trussell, 2007; Duncan and Shipston, 2016).
I CaL
ICaL was isolated using a 10 μm nifedipine subtraction (see Materials and Methods). The protocol, sample traces and analyses are illustrated in Figure 4A–J. The inactivation traces are illustrated in Extended Data Figure 2-1C and the time constant analyses are illustrated in Extended Data Figure 2-2C,D. Similar to IA and ID, the maximum conductance of ICaL was greater in B8 compared with B51 and B64 (Fig. 4J; H(2) = 10.26, p = 0.0059; post hoc, B51 vs B64, p = 0.41; B51 vs B8, p = 0.14; B64 vs B8, p = 0.004). The greater conductance could lead to greater influx of Ca2+ and greater activation of IKCa, which could contribute to suppressing a plateau potential in B8. The inactivation curve of B8 was shifted to the left compared with that of B51 (Fig. 4H; H(2) = 11.1, p = 0.0040; post hoc, B51 vs B64, p = 0.18; B51 vs B8, p = 0.0026; B64 vs B8, p = 0.27). The difference in inactivation curves would tend to enhance the influx of Ca2+ in B8. No differences were found in the half-activation (Fig. 4F; F(2,14) = 0.96, p = 0.41), or the slope parameters of the activation curves (Fig. 4G; F(2,14) = 1.71, p = 0.22), or inactivation curves (Fig. 4I; H(2) = 4.5, p = 0.105).
I CaR
ICaR was isolated by recording in the presence of 10 μm nifedipine to block ICaL and subtracting a response that received a 300-ms duration prepulse to −10 mV (to block ICaR) from a control current response (see Materials and Methods). The protocol, sample traces and analyses are illustrated in Figure 4K–S. The inactivation traces are illustrated in Extended Data Figure 2-1D and the time constant analyses are illustrated in Extended Data Figure 2-2E,F. Similar to IA, ID, and ICaL, the maximum conductance of ICaR was greater in B8 compared with B51 and B64 (Fig. 4T; F(2,14) = 31.0, p = 1.12 × 10⁻⁵; post hoc, B51 vs B64, p = 0.74; B51 vs B8, p = 1.61 × 10⁻⁵; B64 vs B8, p = 7.61 × 10⁻⁵), which could contribute to suppression of the plateau in B8. There was also a rightward shift of the inactivation curve of B51 compared with B64 and B8 (Fig. 4R; H(2) = 9.38, p = 0.0092; post hoc, B51 vs B64, p = 0.024; B51 vs B8, p = 0.020; B64 vs B8, p = 0.997) and a steeper slope of the inactivation curve in B51 compared with B64 and B8 (Fig. 4S; F(2,14) = 25.5, p = 4.77 × 10⁻⁵; post hoc, B51 vs B64, p = 8.5 × 10⁻⁵; B51 vs B8, p = 0.0002; B64 vs B8, p = 0.82). The rightward shift and steeper inactivation slope in B51 would lead to increased inactivation and could delay the Ca2+ influx and IKCa activation, allowing for the plateau potential. No significant difference was observed in the half-activation (Fig. 4P; H(2) = 0.04, p = 0.98) or slope of the activation curves among the three neurons (Fig. 4Q; F(2,15) = 1.67, p = 0.226). The similar expression of ICaL and ICaR suggests that the lack of IKCa in B64 is not because of a reduced expression of voltage-gated Ca2+ channels.
Persistent Na+ current
We hypothesized that INaP is more pronounced in B51 and B64 compared with B8, because of the established role of INaP in maintaining sustained depolarizations (Carrillo-Reid et al., 2009). As a first step, we sought to identify a pharmacologic agent that could block INaP without blocking the faster INa. Dose-effect curves were constructed for TTX, an agent that has been used by others to block INaP (Hsu et al., 2018). For these experiments the duration of the plateau potential and the amplitude of the action potential were used as rough estimates for the magnitude of INaP and INa respectively (Fig. 5A,B). The dose–response curve indicated that 10 μm was a reasonable concentration of TTX, because this concentration reduced the plateau duration by 91.2 ± 1.3%, but only blocked 20.6 ± 0.7% of the action potential amplitude. Therefore, 10 μm TTX was selected to characterize INaP.
Figure 5.
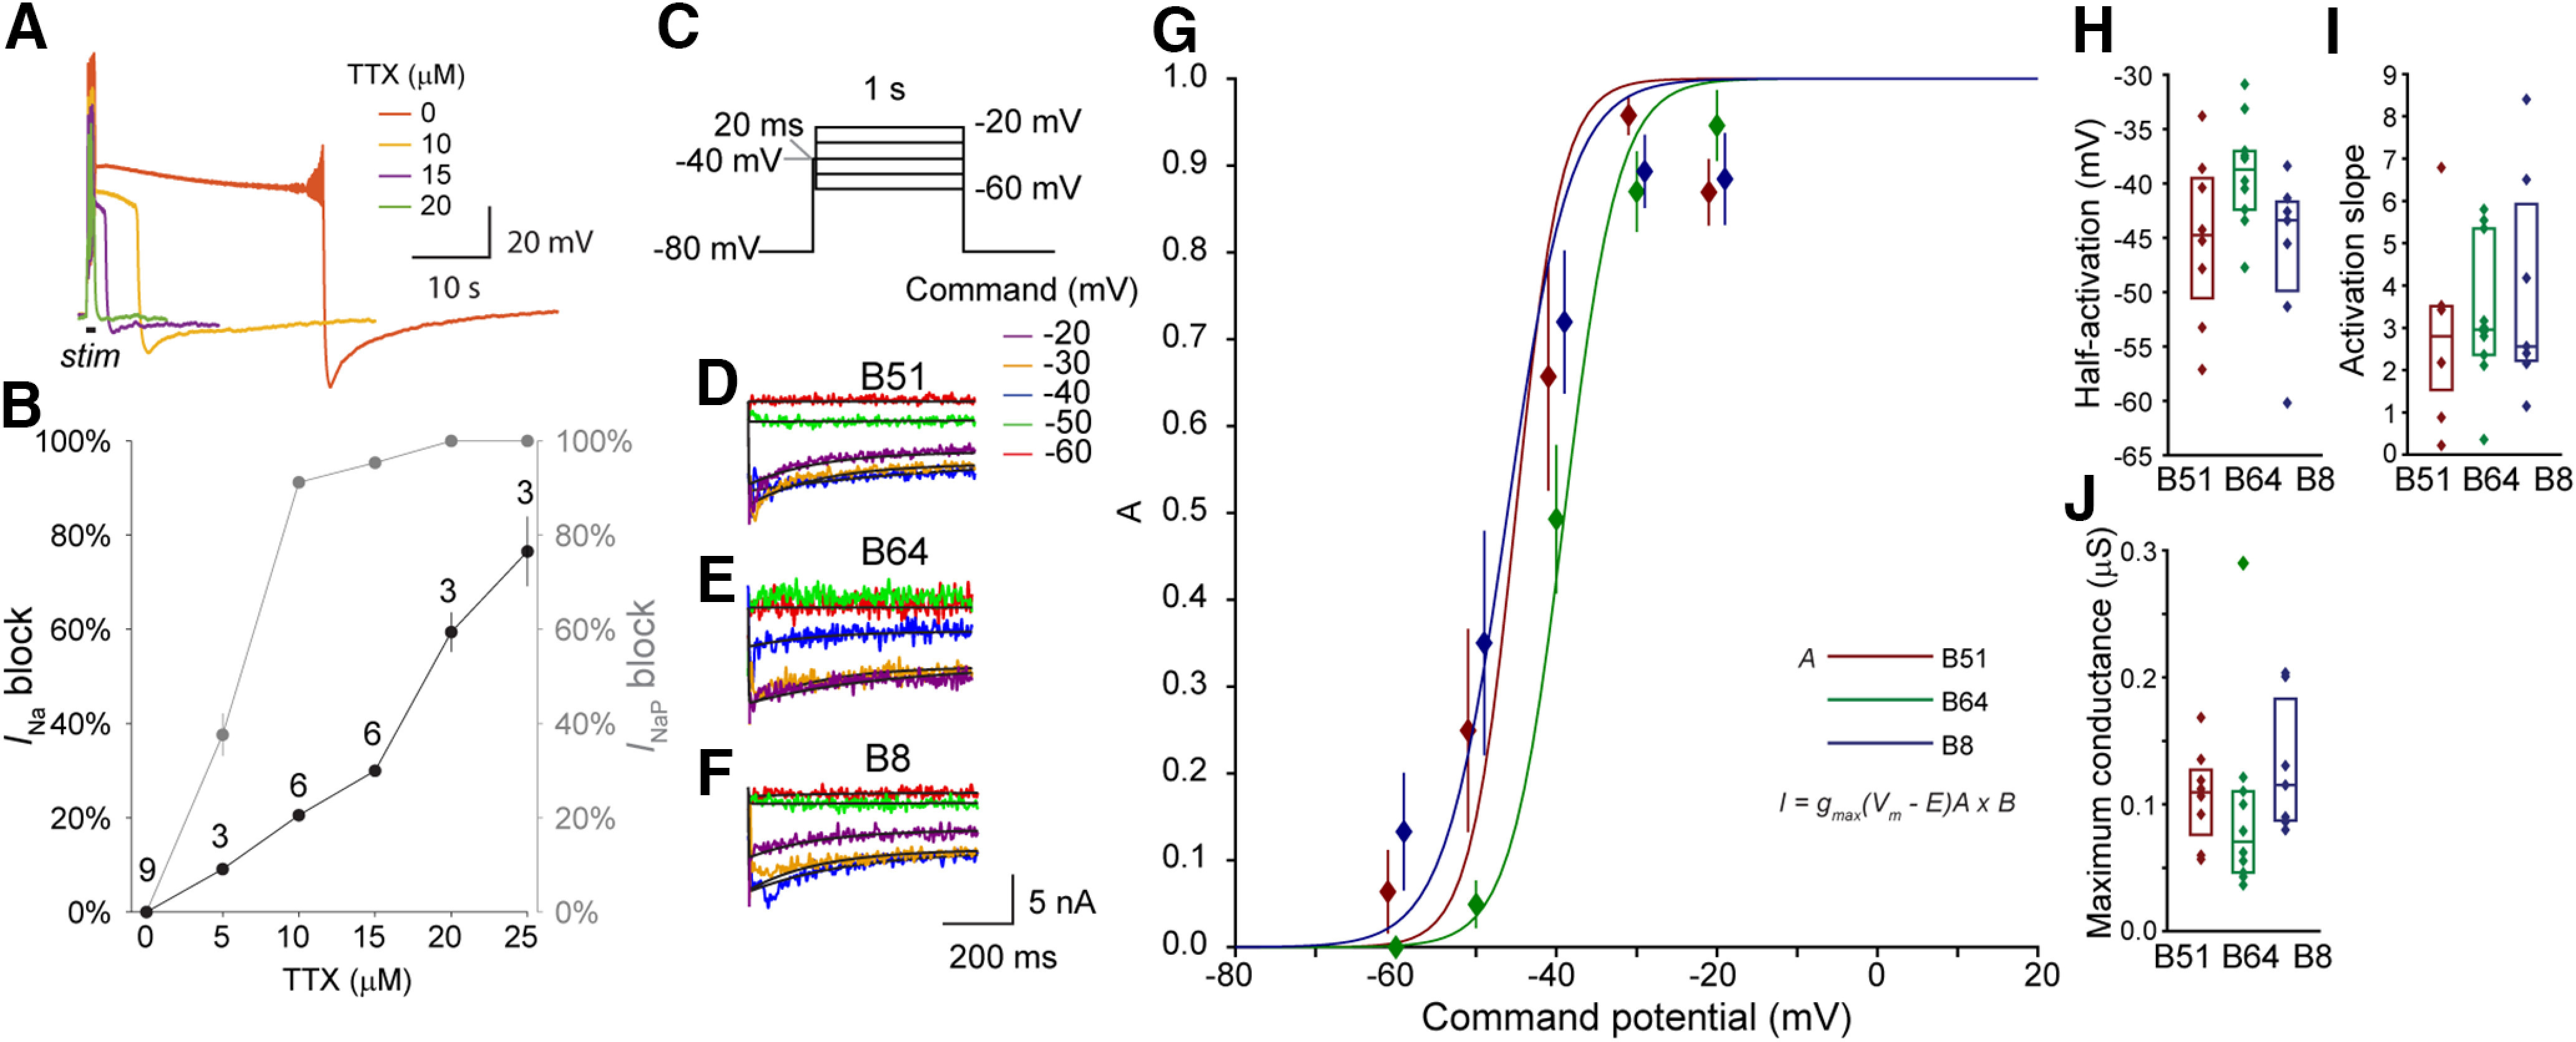
INaP has similar properties in both the plateau-generating neurons B51 and B64 and the regular-spiking neuron B8. A, Example neuron showing the reduction in plateau duration by varying concentrations of TTX. B, Dose-effect curve of TTX. The decrease in action potential amplitude was used as an indicator block of INa, whereas the percent decrease in the amount of time above −70 mV after the end of the stimulus was used as an indicator of the block of INap. C, Voltage-clamp protocol to measure INaP. A 20-ms duration step to −40 mV was used to reduce contamination by INa. To isolate INaP, the current responses in control were subtracted from responses in 10 µm TTX. D–F, TTX subtracted current response indicating INaP for B51 (D), B64 (E), and B8 (F) for each command potential. A double exponential equation (Eq. 5) was fitted for a 640-ms region beginning 9 ms after the start of the command pulse (black line). G, Summary data for the activation curves (solid line, solid diamonds) and fitted Boltzmann equations (lines, Eq. 12). Data represented as mean and standard error. H, I, Summary data for the parameters of the Boltzmann equations. J, Maximum conductance calculated using Ohm's law. Sample sizes: B8, n = 7; B51, n = 8; B64, n = 8. The time constant analysis for INaP is illustrated in Extended Data Figure 2-2G.
Comparison of voltage-clamp simulations and empirical data. A, Mean current responses (solid line) from experiments measuring IA (Fig. 2A–I) for B51, B64, and B8 compared to simulations (dashed lines) of the same voltage-clamp protocol in the model neurons. B, Mean current responses of ID (Fig. 2K–T) for B51, B64, and B8 compared to simulation results. C, Mean current responses of ICaL (Fig. 4A–J) for B51, B64, and B8 compared to simulation results. D, Mean current responses of ICaR (Fig. 4K–S) for B51, B64, and B8 compared to simulations results. E, Mean current responses of IKCa (Fig. 3C–J) for B51, B64, and B8 compared to simulation results. F, Mean current responses of INaP (Fig. 5C–J) for B51, B64, and B8 compared to simulation results. G, Mean current responses of IHCN for B51, B64, and B8 compared to simulation results. Download Figure 6-1, TIF file (15.7MB, tif) .
Characterization of IHCN of B8. A, Example sag potential and rebound excitation in B8. B, Example ZD7288 block of IHCN in B8. 10 µM ZD7288 completely blocked IHCN (n = 6). C, Voltage-clamp protocol. Neuron was held at −40 mV and stepped to potentials ranging from −40 to −110 mV for 10 s (prepulse) to activate IHCN then stepped to −140 mV. The amplitude of the tail current indicated the amount of IHCN activated during the prepulse. D, Example current response. A single exponential equation (Eq. 1) was fitted to a 3-s region beginning 70 ms after start of the command pulse (black line). E, Example tail currents during the step to −140 mV. Traces are colored according to prepulse command potential. A single exponential equation (Eq. 1) was fitted to a 330-ms region beginning 70 ms after start of the −140-mV command pulse (black line). The curve was extrapolated back to the start of the pulse to estimate the amount of activation. The activation at each potential is obtained by subtracting each measurement by the measurement with a −30-mV prepulse then normalizing to the measurement with a −110-mV prepulse. F, Steady-state activation curve. The tail current was used to measure the steady-state activation. The parameters of the activation curve are provided in Extended Data Table 2-1. G, Voltage-dependence of the activation time constant determined by the time constant of the exponential equation fit to the prepulse current responses in D. Parameters were: τmax = 14 s, τmin = 0.9 s, h1 = −73 mV, s1 = −9, h2 = −75, s2 = 9. Download Figure 6-2, TIF file (5MB, tif) .
Differences in Rin and capacitance cannot explain propensity to generate plateau potentials. A, Input resistance measurements of B51, B64, and B8. Input resistance and time constant were measured by injecting a −1-nA current pulse. An exponential function was fitted to the first 1 s of the voltage trace during this current injection. Neuron B51 had a greater input resistance compared to B64 and B8 (B51 = 30.2(20.3, 35.8) MΩ, B64 = 11.3(9.2, 13.8) MΩ, B8 = 14.4(12.1,16.4) MΩ; H(2) = 50.7, p = 9.8 × 10⁻¹²; post hoc B51 vs B64, p = 9.9 × 10⁻¹⁰; B51 vs B8, p = 1.4 × 10⁻⁵; B64 vs B8, p = 0.22). B, Capacitance measurements of B51, B64, and B8. Calculated by dividing the time constant by the input resistance. Neuron B8 had a greater capacitance compared to B51 and B64 (B51 = 0.0023(0.0021, 0.0027) µF, B64 = 0.0022(0.0020, 0.0027) µF, B8 = 0.0098(0.007, 0.013) µF; H(2) = 47.9, p = 4.0 × 10⁻¹¹; post hoc B51 vs B64, p = 0.51; B51 vs B8, p = 1.3 × 10⁻⁸; B64 vs B8, p = 1.3 × 10⁻⁹). C, Time constant measurements of B51, B64, and B8. B8 had a greater membrane time constant compared to B51 and B64 (B51 = 0.073(0.045, 0.090) s, B64 = 0.024(0.021, 0.028) s, B8 = 0.15(0.098, 0.19) s; H(2) = 62.1, p = 3.3 × 10⁻¹⁴; post hoc B51 vs B64, p = 2.0 × 10⁻⁶; B51 vs B8, p = 6.0 × 10⁻⁴; B64 vs B8, p = 9.6 × 10⁻¹⁰). D, The capacitance was varied from 2 nF (red, B51 empirical value) to 10 nF (blue, B8 empirical value). The models for B51 or B64 did not exhibit regular firing upon increasing their capacitance. The model for B8 did not exhibit a plateau upon decreasing its capacitance. Download Figure 6-3, TIF file (4.2MB, tif) .
The protocol, sample traces and analyses of the voltage-gating properties of INaP are illustrated in Figure 5C–I. The time constant analysis is illustrated in Extended Data Figure 2-2G. In contrast to the other currents, INaP was measured by voltage-clamp recordings in the axon to better clamp the action potential. Surprisingly, there was no noticeable difference of INaP among the three neurons. No statistical differences were found in half-activation (Fig. 5H; F(2,24) = 2.76, p = 0.085), slope parameter of the activation curve (Fig. 5I; F(2,24) = 0.39, p = 0.68), or NaP (Fig. 5J; F(2,24) = 0.87, p = 0.43). These data indicate that although the plateau can be mediated by INaP (Fig. 5A,B), the different propensities to generate plateau potentials among B51, B64, and B8 are not because of differences in INaP, but depend on either the outward currents or the voltage-gated Ca2+ current. One possibility is that the larger conductances of the outward currents IA, ID, and IKCa in B8 suppress plateau generation. To gain further insight into these relationships, we used computational models to examine the ways in which these conductances could contribute to the plateau potential.
Computational models recapitulate dynamics of B51, B64, and B8
To investigate the ways in which these currents interact to mediate plateau potentials, a conductance-based model of each neuron was built with the simulator for neural networks and action potentials (SNNAP; Ziv et al., 1994; Baxter and Byrne, 2007). Each neuron was modeled as a single compartment (Fig. 6A). Equations describing each current were constructed in agreement with the empirically measured voltage dependence of steady-state activation and inactivation (Extended Data Table 2-1) and estimations of the voltage dependence of the time constants (Extended Data Figs. 2-2, 6-1). The IHCN current was also characterized and included in the B8 model because of this neuron's pronounced sag potential and ability to produce rebound excitation (Extended Data Fig. 6-2; Kabotyanski et al., 2000). A leakage conductance, Ileak, was added to B51 and B64 so that input resistance of these models could be matched to empirical data (Extended Data Fig. 6-3A). The adjustment of Ileak was made after all other currents were included in the model and held constant for all simulation experiments. IHCN served as the leakage conductance for B8. Empirically, the passive neuronal properties were examined using a hyperpolarizing current pulse. B51 had a significantly greater input resistance than B64 and B8, but B8 had a greater capacitance and membrane time constant than B51 and B64 (Extended Data Fig. 6-3A–C). These differences were not able to explain the different propensities to generate a plateau potential among the neurons (Extended Data Fig. 6-3D). To further examine whether passive properties influence the propensity to generate plateau potentials, we compared the input resistance, capacitance, and membrane time constant between B51 neurons that exhibited a plateau potential and B51 neurons that did not. No significant differences were observed between these two groups (resistance t(34) = 0.798, p = 0.43; capacitance t(34) = 1.28, p = 0.21; tau t(34) = 1.31, p = 0.20). Insufficient sample size prevented a statistical comparison of the individual currents between plateaugenic and nonplateaugenic B51 neurons.
Model equations are given in the Materials and Methods. Extended Data Table 2-1 gives the steady-state parameters of each current, their model values, and their measured empirical values. Values for the parameters describing the time dependence of activation and inactivation are given in Materials and Methods and Extended Data Figure 2-2. The models reproduced the salient voltage dynamics for each neuron. The B51 model expressed a plateau potential that self-terminated, the B64 model expressed a plateau potential that did not self-terminate, and the B8 model did not express a plateau potential for any of the stimuli tested (Fig. 6E).
The models were used to examine the window currents by calculating the steady-state values for each individual current over a range of membrane potentials (Eqs. 7, 12, and 15). Each window current was normalized to the sum of all of the currents to display the dominant sustained current at each membrane potential (Fig. 6B–D). IHCN or the leakage current Ileak was dominant at potentials more negative than −75 mV for all three neurons. INaP was the dominant sustained current just below spike threshold (about −40 mV), suggesting that INaP mediates sustained depolarization during a plateau potential. However, the large number of window currents near the resting potential (between −75 and −60 mV) indicated that even a seemingly simple phenomenon such as resting potential is affected by the sustained current of many voltage-gated ion channels. Near the resting potential, INaP seemed to dominate in B51 and B8, whereas ICaL dominated in B64. Outward currents ID and IKCa dominated the sustained current at potentials more positive than approximately −5 mV, further supporting their role in repolarizing the membrane after an action potential.
In addition, we examined the activation of each conductance following a simulated depolarizing current injection at an intensity that elicits activity in all three neurons (Fig. 6E). Ileak and IHCN provided a strong current mainly during the action potentials and a baseline current indicating it may counteract plateau generation. IKTEA response was greater in B8 compared with B51 and B64, suggesting it may play a role in preventing plateau potential generation. Despite the INa parameters being identical in the three neurons, the peak current response was greater in B8 compared with B51 and B64. The peak INa gradually increased near the end of the B51 plateau, likely because of greater IKCa activation resulting in de-inactivation of INa. The peak INaP was fairly similar among the three neuron models, however the peak currents of IA, ID, IKCa, ICaL, and ICaR were substantially greater in B8, suppressing the plateau potential either directly (i.e., IA, ID, IKCa) or indirectly by ICaL and ICaR activation of IKCa. IKCa had a substantial gradual increase near the end of the plateau in B51, making it the most likely candidate to terminate the plateau potential in physiological conditions. The most pronounced outward currents for all three neurons seemed to be ID and IKCa.
Simulations indicated that the timing of ID, IKCa, and INa mediates maintenance and termination of plateau potentials
To better examine how the dynamics of ID and IKCa affect the plateau potential, we plotted the time course of the simulation in 3-D voltage plots for each neuron, and colored each plot according to the magnitude of either ID (Fig. 7A–C), IKCa (Fig. 7D–F), or INa (Fig. 7G–I). These plots revealed the intricate timing of ID, IKCa, and INa. For example, in B51, ID was reduced from 57 nA in the beginning of the plateau to 33 nA near the end, during the downstroke of the action potential. This decrease is noticeable as a transition from a lighter blue (bottom, front of spiral) to a darker blue (top, front of spiral; Fig. 7A). An apparent gradual increase in IKCa from 0 to 80 nA occurred during the downstroke of the action potential as the plateau progressed. This increase is noticeable as a transition from dark blue at the beginning (bottom, front of spiral) to light green at the end of the plateau (top, front of spiral; Fig. 7D) that were both confined to the downstroke of the action potential and juxtaposed to the increase of INa occurring during the upstroke (Fig. 7G).
Figure 7.

INa, IKCa, and ID play key roles in maintaining and terminating plateau potentials. A–C, 3-D voltage plots of ID in B51, B64, and B8. Activity was elicited by a 1-s duration, 3-nA depolarizing current injection. The 3-D line is colored according to ID activation. Projections of the 3-D plot onto the xz-plane and xy-plane are colored in gray. Arrows indicate the direction of time. D–F, 3-D voltage plots of IKCa in B51, B64, and B8. G–I, 3-D voltage plots of INa in B51, B64, and B8. J, Voltage responses to 1-s duration, 3-nA current injection in control simulations (black), when either IKCa (green) or INa (red) was absent, or when both IKCa and INa were absent (purple). A voltage-clamp step to 60 mV was given to mimic the occurrence of an action potential.
In contrast, ID was more consistently activated in B64 and B8. In the case of B8, ID had a greater intensity that helped to repolarize the membrane potential to resting levels. IKCa was activated more rapidly in B8 (Fig. 7F, bright yellow in downstroke), reaching its peak intensity by the end of the 1-s stimulation, thereby ensuring B8 quickly repolarizes to the resting potential following stimulation.
A series of B51 simulations were performed to examine the relationship between the action potential, IKCa activation, and the maintenance of the plateau potential. A 1-s duration, 3-nA current injection to B51 activated a plateau potential that self-terminated (Fig. 7J). However, when IKCa was removed by setting its maximum conductance () to zero, this current injection elicited a plateau that did not self-terminate. Removing INa while keeping IKCa at control levels blocked the occurrence of action potentials; however, the plateau did not self-terminate, which indicates that action potentials are not necessary to sustain the plateau and instead may indirectly facilitate its termination. A voltage-clamp step that mimics an action potential (6 ms, 60 mV) effectively terminated the plateau. However, the voltage-step did not terminate the plateau when both IKCa and INa were removed. These results indicate that action potentials regulate the duration of plateau potentials by activating IKCa.
Simulations suggested that interactions among INaP and other membrane currents determined the unique firing patterns in the three models
One of the surprising results from the study was that voltage-clamp experiments indicated all three neurons had similar INaP (Fig. 5), but varied greatly in their propensity to generate plateau potentials. To further examine, via modeling, the interaction of INaP with the other major membrane currents, we constructed heatmaps of plateau duration by varying the maximal conductance NaP (Eq. 7; Fig. 8A–E, horizontal axes), while also varying A, D, KCa, CaL, or CaR (Fig. 8A–E, vertical axes). Conductances that were not being manipulated were kept at their control values. The were chosen because these parameters modify current amplitudes without affecting voltage dependencies. The propensity to generate a plateau potential was measured by the duration of the plateau potential after the end of a sufficiently strong stimulus (5-nA, 1-s simulated current injection).
Figure 8.

Effect of ion currents on plateau potential duration and prediction of biophysical properties outside the tested parameter space. A, Heat maps of the plateau duration for varying the maximum conductance () of ID, IA, IKCa, ICaL, and ICaR versus varying the maximum conductance of INaP (NaP). The of the outward currents and Ca2+ currents were each varied from 0 to 6 µS, whereas NaP was varied independently from 0 to 0.5 µS. The remaining model parameters were set according to experimental data presented in Extended Data Figures 2-1, 2-2, 3-1, 6-1, 6-2, and 6-3. A guide to interpreting the maps is provided on the right. A holding current was applied to set the membrane potential to −80 mV, similar to the empirical studies. Activity was then elicited by a 1-s duration, 5-nA simulated positive current injection. The filled circles indicate the physiological values of (red = B51, green = B64, cyan = B8). Yellow indicates neurons with nonterminating plateau potentials. The + indicates when spike activity outlasted the duration of the stimulus. Heatmaps for IKTEA are provided in Extended Data Figure 8-2. B–E, Voltage trace of simulations (top) for the parameter values indicated (bottom). The locations in the parameter space for B–E are indicated in A. F, The KCa versus NaP parameter space represented as a colored surface. For F–H, red diamonds indicate KCa and NaP parameter combinations within the tested parameter space having a plateau duration of 6–8 s. A second-degree polynomial was fit (red curve) to the red data points to estimate the KCa and NaP parameter combinations for the blue data points. In the polynomial equation, the plateau duration (PD) of the line was set to the mean of the red data points (6.99 s). Blue data points are parameter combinations predicted to have a plateau duration near 6.99 s. The plateau duration is indicated below each data point. G, Action potential duration (AD; see Extended Data Fig. 8-1J) along the fitted curve in F. The red line is a linear fit of the red data points and predicts the action potential duration of the blue data points in F. The light red regions surrounding the line in G and the fitted curve in H delineate the confidence intervals of the fits, with respect to the dependent variables (AD in G, PA in H; Materials and Methods). H, Plateau potential amplitude (PA; see Extended Data Fig. 8-1A) along the fitted curve in F. The red curve is a second-degree polynomial fit of the red data points and predicts the plateau potential amplitude of the blue data points in F.
Heat maps of the parameter space indicate that ion channels differentially affect the depolarization of the plateau and action potential duration. A, Heat maps of the effect of the ḡ parameter space for the ID, IA, IKCa, ICaL, and ICaR on the amount of depolarization of the plateau. The ḡ of each channel was varied from 0 to 6 µS while ḡNaP was varied independently from 0 to 0.75 µS. The remaining model parameters were determined by experimental data presented in Extended Data Figures 2-2, 6-2, and 6-3 and Extended Data Table 2-1. The model was held to −80 mV, similar to experiments, and activity was elicited by a 1-s, 5-nA simulated current injection. The dots indicate the default values of ḡ in the model (red = B51, green = B64, cyan = B8). Examples of the voltage traces are provided in B–E and the locations are indicated on the heatmap. A guide to interpreting the maps is provided on the right. Data from the same simulations as Figure 8. Note the similarity with Figure 8. B–E, Voltage trace of simulations (top) for the parameter values indicated (bottom). The locations in the parameter space for B–E are indicated in A. F–I, Histograms of the voltages for the simulations in B–E, respectively. The amplitude of the plateau is calculated as the location of the peak of this histogram in mV subtracted by the holding potential of the model neuron (−80 mV). J, Heat maps of the effect of the ḡ parameter space for the ID, IA, IKCa, ICaL, and ICaR on action potential duration. The dots indicate the default values of ḡ in the model (red = B51, green = B64, cyan = B8). Examples of the voltage traces are provided in B–E and the locations are indicated on the heatmap. A guide to interpreting the maps is provided on the right. Action potential duration was calculated as the average time above 0 mV for each action potential. Download Figure 8-1, TIF file (22.1MB, tif) .
Plateau duration, amplitude, and action potential duration heat maps of the parameter space of IKTEA. Heat maps of the effect of the ḡ parameter space for the IKTEA on action potential duration. The ḡ of each channel was varied from 0 to 6 µS while ḡNaP was varied independently from 0 to 0.5 µS. The remaining model parameters were determined by experimental data presented in Extended Data Figures 2-1, 2-2, 3-1, 6-1, 6-2, and 6-3. The model was held to −80 mV, similar to experiments, and activity was elicited by a 1-s, 5-nA simulated current injection. The dots indicate the default values of ḡ in the model (red = B51, green = B64, cyan = B8). Data from the same simulations as Figure 7. Download Figure 8-2, TIF file (5.6MB, tif) .
In many cases, the same values for a given combination of currents resulted in widely different firing properties in the three models. For example, a 0.175 µS NaP and 2.842 µS D resulted in a self-terminating plateau in the model of B51, while those same values resulted in a nonterminating plateau in the model of B64, and a regular firing phenotype in the model B8 (Fig. 8B–D). Increasing the NaP to 0.375 µS in B8 converted its dynamics to a nonterminating plateau (Fig. 8A,E). Increasing the of currents that strongly suppress plateau potentials would require a commensurate increase in NaP to maintain the propensity to generate a plateau potential. Conversely, currents that have little effect on plateau potentials would not require additional increases in NaP. These simulations further illustrated that in the model of B51, ID, IKCa, and ICaR strongly suppressed the plateau potential whereas IA had no effect. The ICaL effect on the plateau duration was unique in that when the CaL is above 1.3 µS, B51 and B64 became almost exclusively plateau generating except for very small values of NaP. The facilitation of plateau potentials by ICaL is consistent with observations in spinal motor neurons where ICaL is important for mediating the plateau potential (Binder et al., 2020). In contrast, in B64, ID and IA both suppressed the plateau potential. The B64 neuron did not express IKca. Therefore, to determine what effect this current would have on this neuron, we inserted the IKca parameter values used in B8 and then varied its values as was done for the other currents. IKca strongly suppressed the plateau potential in the model of B64, such that it self-terminated. The ability of IKCa to suppress plateau potentials in a neuron that does not express this current indicates that such suppression may be a common property of this current. For B64, the KCa was set to zero when testing the effects of currents other than IKCa. Increasing CaR and CaL did not suppress, but rather enhanced, the plateau potential in B64 because of the lack of IKCa. The majority of the B8 model parameter space exhibited regular spiking and produced plateau potentials with large values of NaP, and in all of these cases the plateau potentials were not self-terminating. The heatmap of B8 for the IKCa, INaP combinations was similar when Ileak was substituted for IHCN, indicating that the voltage-dependent properties of IHCN did not contribute to the propensity of B8 to generate a plateau potential.
Taken together, these results indicated that ID and IKCa strongly suppressed plateau potentials regardless of cell type; however, IA and ICaR only suppressed plateau potentials in particular neurons. Interestingly, by manipulating one parameter of a single current, a model neuron could be converted from one that generates plateau potentials into a regular-spiking neuron that is incapable of generating plateau potentials. A neuron that is regular spiking can similarly be converted into a plateau-generating neuron by manipulating a single parameter.
In addition to plateau duration, we examined the amplitude of the plateau potential (measured at the troughs between action potentials) and found that plateau potential voltage heatmaps were visibly similar to plateau duration heatmaps in that increases in NaP and/or decreases in outward currents corresponded to an increased amplitude in the plateau potential (Extended Data Fig. 8-1A–I). Interestingly, a heatmap of the action potential duration (Extended Data Fig. 8-1J) had a more complex patterning highlighting the complex relationship among the ionic currents and shape of the action potential. We did notice a general trend that decreasing NaP and/or increasing the outward currents increased the action potential duration, because of the reduced plateau potential amplitude presumably by removing the inactivation of INa between action potentials. We also examined similar heatmaps for the unidentified 4 mm TEA-sensitive, Ca2+-insensitive potassium current denoted IKTEA (Extended Data Fig. 8-2) mentioned in Figure 3D,F,H. These heatmaps illustrate a general trend in which increased IKTEA reduces the plateau duration and amplitude.
Finally, we examined whether the heatmaps within the tested parameter space could be used to predict voltage dynamics for parameter values that lie outside the tested space. To test this possibility, we examined the heatmap for IKCa. We considered the B51 IKCa plateau-duration heatmap in Figure 8A as a 3-D surface while maintaining its coloring (Fig. 8F). The surface is relatively smooth in regions where the plateau duration is <40 s, suggesting that this surface could be used to predict the plateau duration of parameter combinations outside the range of values examined. We therefore selected points in the simulated data set with a 6- to 8-s plateau duration (Fig. 8F, red diamonds) and projected these data points onto the NaP/KCa axis plane. The remaining model parameters were set according to experimental data presented in Figures 1–5 and Extended Data Figures 2-1, 2-2, 3-1, 6-1, 6-2, and 6–3. When projected on the NaP/KCa axis plane, these data points could be fit with a second-degree polynomial. This second-degree polynomial is plotted in Figure 8F. The portion of Figure 8F with the colored surface corresponds to the tested parameter space, and the red curve corresponds to the polynomial. The plateau duration on this curve is the mean of the selected data points (6.99 s). We predicted that points along this polynomial curve when extrapolated beyond the surface would provide parameter combinations that would yield plateau durations near 6.99 s. Simulations indicated plateau durations that were close to, although not equal to, the predicted duration of 6.99 s (Fig. 8F, points marked with blue diamonds). For a NaP value corresponding to one of the extrapolated points, we additionally examined what KCa value would result in a plateau duration equal to 6.99 s. Simulations indicated that, for NaP = 0.45 µS, a KCa of 8.56 µS yielded a plateau of 6.996 s, and was within the 95% confidence interval of [8.45, 9.82] µS KCa calculated for the extrapolated polynomial at 0.45 µS NaP (see Materials and Methods for confidence interval calculation). Therefore, the polynomial reasonably predicted the correct KCa.
We further examined whether this polynomial fit could also predict other complex physiological processes such as action potential duration and plateau amplitude. The data points from Figure 8F were projected onto the AP duration/NaP axis plane. When projected onto this plane, these data points had a linear relationship (Fig. 8G). A linear equation fitted to the red data points predicted the action potential duration for parameter combinations along the extrapolated line (blue data points). The data points from Figure 8F were then projected onto the plateau amplitude/NaP axis plane. When projected onto this plane, the red points could be fit with a second-degree polynomial (Fig. 8H). The fit predicted the plateau amplitude for parameter combinations along the extrapolated curve. Thus, the heatmaps of the parameter space provided a framework to predict complex phenotypes.
Discussion
This study examined three identified neurons that varied in their ability to produce all-or-nothing plateau potentials, a phenomenon shared by various neurons in many different species (Nargeot et al., 1999a,b; Carrillo-Reid et al., 2009; Plotkin et al., 2011; Bittner et al., 2017). These data indicated that regular-spiking neurons like B8 can be more complex than what might be expected, containing many of the same currents as plateau-generating neurons. Interestingly, INaP was similar in all three neurons. The main difference among these neurons was greater outward currents and voltage-gated Ca2+ currents in B8. The similarity in the repertoire of membrane currents suggests that additional currents are not needed to enable a plateau potential, but rather a release of inhibitory constraints mediated by currents such as ID and IKCa. The role of ID, IKCa, and INaP in plateau potentials was further supported by simulations with biologically realistic conductance-based models. Model neurons with similar INaP exhibited different propensities to generate plateau potentials. Because of the similarity of voltage-gated currents in Aplysia to those in other systems, we predict that in other systems outward K+ currents are major distinguishing factors between plateau generating and regular firing neurons.
The mechanism of plateau generation is still under intense investigation. In some neurons, plateau potentials result from the coactivation of multiple synaptic connections that converge on a small dendritic region, releasing the Mg2+ block of NMDA receptors and activating various voltage-dependent currents (Milojkovic et al., 2004; Plotkin et al., 2011). In other neurons, plateau potentials are a result of intrinsic voltage-dependent currents that can be activated even when isolated from the circuit (Lorenzetti et al., 2008; Tryba et al., 2011). For example, cortical pyramidal neurons from excised tissue of patients with intractable seizures generated rhythmic bursts even in the presence of excitatory synaptic blockers, but were blocked by rilizule, a INaP blocker (Tryba et al., 2011).
Voltage-gated Ca2+ channels are involved in sustaining the plateau potential neurons of other systems (Zhang et al., 1995; Beurrier et al., 1999; Vergara et al., 2003). However, a blocker for voltage-gated calcium channels, Ni2+, enhances the plateau potential in B51 (Fig. 3). Simulations indicated that lowering ICaR increased plateau potential generation by reducing IKCa activation (Fig. 8). Thus, IKCa produces feedback inhibition of plateau generating mechanisms, because of its activation by Ca2+ influx. Lengthening of the plateau potential by zero Ca2+ or by TEA was also observed in B63 (Bédécarrats et al., 2023) suggesting that IKCa could be a common mechanism of plateau termination. However, in some neurons, Ni2+ can block plateau potentials (Aplysia bag neurons; Tam et al., 2009) and bursting (hippocampal neurons; Metz et al., 2005). In part, the different roles of voltage-gated Ca2+ currents may be explained by their proximity to outward current channels (Shah et al., 2021). Our simulations also indicated that ICaR enhances plateaus in neurons without IKCa such as B64, and that ICaL enhances plateau potentials in B51 and B64, supporting a direct role of voltage-gated Ca2+ in plateau generation. Similarly, ICaL contributes to plateau potentials in mammalian barrelette cells (Lo and Erzurumlu, 2002).
We used TEA (a blocker for BK) to block IKCa and characterize its properties, suggesting that BK channels in other systems may also suppress the plateau potential. The Ca2+-gating makes IKCa an ideal timing mechanism for limiting the duration of plateau potentials. As the plateau potential progresses, the Ca2+ buildup leads to activation of IKCa that eventually terminates the plateau. On the other hand, ID and IA reach their peak activation near the beginning of the plateau. Therefore, in the absence of IKCa, if ID or IA are insufficient to terminate the plateau soon after initiation, then the plateau will persist indefinitely as is the case for B64.
In all three neurons, we isolated a rapidly activating and rapidly inactivating voltage-dependent outward current that persisted in 4AP, was insensitive to Cd2+ and Ni2+ and inhibited by low concentrations of TEA, therefore we designated the current as IKTEA. This current was capable of modulating the duration of the plateau potential (Extended Data Fig. 8-2). The activation curve was shifted to the right compared with IA and ID indicating that this current can only be activated during an action potential where it helps mediate the after-hyperpolarization (AHP; Fig. 6). One possibility is that IKTEA is the Ca2+-unbound form of IKCa. Several lines of evidence indicate that Ca2+ binding shifts the activation curve to a more negative potential (Cui et al., 1997; Cox, 2014).
Inhibiting INaP blocked plateau potentials, empirically and in simulations. Surprisingly, the properties and level of expression of INaP were similar in all three neurons, indicating that the presence of INaP is not a distinguishing factor between regular-firing neurons and neurons capable of generating plateau potentials. Rather, it is the ratio between INaP and outward currents such as ID and IKCa. Investigations in leech found that a major counteracting current to INaP was current generated by the Na+/K+ pump (Erazo-Toscano et al., 2023). We predict that Na+/K+ pump could also play an important role in regulating B51 and B64 plateau potentials. What role does INaP have in regular-spiking neurons? One possibility is that INaP serves to increase the nonlinearity of the spike frequency response. INaP is not the only inward current that could underly the plateau potential. The Aplysia B63 neuron and in rat substantia nigra GABAergic neuron plateau potentials are mediated, at least in part, by the calcium-activated nonspecific cation channel (ICaN) and INaP (Lee and Tepper, 2007; Bédécarrats et al., 2023).
The present study characterized two major voltage-gated Ca2+ currents, ICaR and ICaL, because of their importance to IKCa regulation and plateau potentials (Pierson et al., 2005; Kim and Trussell, 2007; Duncan and Shipston, 2016; Binder et al., 2020). However, other voltage-gated Ca2+ currents such as ICaT, IP/Q, IN could potentially play a role in regulating IKCa and plateau potentials in B51 and B64.
In the models, regular-spiking neurons can be converted to neurons that generate plateau potentials relatively simply, by manipulating relatively few parameters (for example, compare Fig. 8B and E). Similarly, changes of a few parameters of a model of Aplysia neuron R15 could switch spiking into bursting (Canavier et al., 1991, 1993, 1994). These results indicate that plateau generating neurons and regular-spiking neurons can be highly similar in their ion channel composition, yet generate drastically different firing properties. This similarity may help explain why in some cases, neurons can be bistable and alternate between bursting and regular firing, as in subthalamic nucleus (Beurrier et al., 1999) and R15 in Aplysia (Lechner et al., 1996).
The relationship between individual parameters and complex physiological processes is often complex and nonlinear. We have demonstrated one technique for predicting complex physiological properties such as plateau duration, plateau amplitude, and action potential duration as a function of parameter values, by fitting a curve in parameter space and projecting the curve beyond the tested values (Fig. 8G,H). We predict, with sufficient sampling, a similar approach could be used to predict neuronal dynamics when three or more parameters are altered. Thus, complex physiological properties can be predicted by following and projecting a trajectory described by features of the tested parameter space.
Footnotes
This work was supported by the National Institutes of Health Grant R01 NS101356. We thank Hsin-Mei Chin for performing the B8 hyperpolarization-activated cyclic nucleotide-gated current (IHCN) experiments and E. Kartikaningrum for preparing cultures.
The authors declare no competing financial interests.
References
- Bal T, Nagy F, Moulins M (1994) Muscarinic modulation of a pattern-generating network: control of neuronal properties. J Neurosci 14:3019–3035. 10.1523/JNEUROSCI.14-05-03019.1994 [DOI] [PMC free article] [PubMed] [Google Scholar]
- Baxter DA, Byrne JH (1989) Serotonergic modulation of two potassium currents in the pleural sensory neurons of Aplysia. J Neurophysiol 62:665–679. 10.1152/jn.1989.62.3.665 [DOI] [PubMed] [Google Scholar]
- Baxter DA, Byrne JH (2007) Simulator for neural networks and action potentials. Methods Mol Biol 401:127–154. 10.1007/978-1-59745-520-6_8 [DOI] [PubMed] [Google Scholar]
- Bédécarrats A, Simmers J, Nargeot R (2023) Sodium-mediated plateau potentials in an identified decisional neuron contribute to feeding-related motor pattern genesis in Aplysia. Front Neural Circuits 17:1200902. [DOI] [PMC free article] [PubMed] [Google Scholar]
- Beurrier C, Congar P, Bioulac B, Hammond C (1999) Subthalamic nucleus neurons switch from single-spike activity to burst-firing mode. J Neurosci 19:599–609. 10.1523/JNEUROSCI.19-02-00599.1999 [DOI] [PMC free article] [PubMed] [Google Scholar]
- Binder MD, Powers RK, Heckman CJ (2020) Nonlinear input-output functions of motoneurons. Physiology (Bethesda) 35:31–39. 10.1152/physiol.00026.2019 [DOI] [PMC free article] [PubMed] [Google Scholar]
- Bittner KC, Milstein AD, Grienberger C, Romani S, Magee JC (2017) Behavioral time scale synaptic plasticity underlies CA1 place fields. Science 357:1033–1036. 10.1126/science.aan3846 [DOI] [PMC free article] [PubMed] [Google Scholar]
- Brembs B, Lorenzetti FD, Reyes FD, Baxter DA, Byrne JH (2002) Operant reward learning in Aplysia: neuronal correlates and mechanisms. Science 296:1706–1709. 10.1126/science.1069434 [DOI] [PubMed] [Google Scholar]
- Byrne JH (1980) Analysis of ionic conductance mechanisms in motor cells mediating inking behavior in Aplysia californica. J Neurophysiol 43:630–650. 10.1152/jn.1980.43.3.630 [DOI] [PubMed] [Google Scholar]
- Canavier CC, Clark JW, Byrne JH (1991) Simulation of the bursting activity of neuron R15 in Aplysia: role of ionic currents, calcium balance, and modulatory transmitters. J Neurophysiol 66:2107–2124. 10.1152/jn.1991.66.6.2107 [DOI] [PubMed] [Google Scholar]
- Canavier CC, Baxter DA, Clark JW, Byrne JH (1993) Nonlinear dynamics in a model neuron provide a novel mechanism for transient synaptic inputs to produce long-term alterations of postsynaptic activity. J Neurophysiol 69:2252–2257. 10.1152/jn.1993.69.6.2252 [DOI] [PubMed] [Google Scholar]
- Canavier CC, Baxter DA, Clark JW, Byrne JH (1994) Multiple modes of activity in a model neuron suggest a novel mechanism for the effects of neuromodulators. J Neurophysiol 72:872–882. 10.1152/jn.1994.72.2.872 [DOI] [PubMed] [Google Scholar]
- Carrillo-Reid L, Tecuapetla F, Vautrelle N, Hernández A, Vergara R, Galarraga E, Bargas J (2009) Muscarinic enhancement of persistent sodium current synchronizes striatal medium spiny neurons. J Neurophysiol 102:682–690. 10.1152/jn.00134.2009 [DOI] [PubMed] [Google Scholar]
- Cui J, Cox DH, Aldrich RW (1997) Intrinsic voltage dependence and Ca2+ regulation of mslo large conductance Ca-activated K+ channels. J Gen Physiol 109:647–673. 10.1085/jgp.109.5.647 [DOI] [PMC free article] [PubMed] [Google Scholar]
- Cox DH (2014) Modeling a Ca2+ channel/BKCa channel complex at the single-complex level. Biophys J 107:2797–2814. 10.1016/j.bpj.2014.10.069 [DOI] [PMC free article] [PubMed] [Google Scholar]
- Del Negro CA, Koshiya N, Butera RJ, Smith JC (2002) Persistent sodium current, membrane properties and bursting behavior of pre-Bötzinger complex inspiratory neurons in vitro. J Neurophysiol 88:2242–2250. 10.1152/jn.00081.2002 [DOI] [PubMed] [Google Scholar]
- Díaz-Ríos M, Miller MW (2006) Target-specific regulation of synaptic efficacy in the feeding central pattern generator of Aplysia: potential substrates for behavioral plasticity? Biol Bull 210:215–229. 10.2307/4134559 [DOI] [PubMed] [Google Scholar]
- Duncan PJ, Shipston MJ (2016) BK channels and the control of the pituitary. Int Rev Neurobiol 128:343–368. 10.1016/bs.irn.2016.03.004 [DOI] [PubMed] [Google Scholar]
- Erazo-Toscano R, Fomenko M, Core S, Calabrese RL, Cymbalyuk G (2023) Bursting dynamics based on the interaction of persistent Na and Na/K pump currents: a dynamic clamp approach. eNeuro 10:ENEURO.0331-22.2023. 10.1523/ENEURO.0331-22.2023 [DOI] [PMC free article] [PubMed] [Google Scholar]
- Gilly WF, Gillette R, McFarlane M (1997) Fast and slow activation kinetics of voltage-gated sodium channels in molluscan neurons. J Neurophysiol 77:2373–2384. 10.1152/jn.1997.77.5.2373 [DOI] [PubMed] [Google Scholar]
- Hsu CL, Zhao X, Milstein AD, Spruston N (2018) Persistent sodium current mediates the steep voltage dependence of spatial coding in hippocampal pyramidal neurons. Neuron 99:147–162.e8. 10.1016/j.neuron.2018.05.025 [DOI] [PMC free article] [PubMed] [Google Scholar]
- Hurwitz I, Susswein AJ (1996) B64, a newly identified central pattern generator element producing phase switch protraction to retraction in buccal motor programs of Aplysia californica. J Neurophysiol 75:1327–1344. 10.1152/jn.1996.75.4.1327 [DOI] [PubMed] [Google Scholar]
- Kabotyanski EA, Baxter DA, Cushman SJ, Byrne JH (2000) Modulation of fictive feeding by dopamine and serotonin in Aplysia. J Neurophysiol 83:374–392. 10.1152/jn.2000.83.1.374 [DOI] [PubMed] [Google Scholar]
- Kim Y, Trussell LO (2007) Ion channels generating complex spikes in cartwheel cells of the dorsal cochlear nucleus. J Neurophysiol 97:1705–1725. 10.1152/jn.00536.2006 [DOI] [PubMed] [Google Scholar]
- Kits KS, Mansvelder HD (1996) Voltage-gated calcium channels in molluscs: classification, Ca2+ dependent inactivation, modulation and functional roles. Invert Neurosci 2:9–34. 10.1007/BF02336657 [DOI] [PubMed] [Google Scholar]
- Lechner HA, Baxter DA, Clark JW, Byrne JH (1996) Bistability and its regulation by serotonin in the endogenously bursting neuron R15 in Aplysia. J Neurophysiol 75:957–962. 10.1152/jn.1996.75.2.957 [DOI] [PubMed] [Google Scholar]
- Lee CR, Tepper JM (2007) A calcium-activated nonselective cation conductance underlies the plateau potential in rat substantia nigra GABAergic neurons. J Neurosci 27:6531–6541. 10.1523/JNEUROSCI.1678-07.2007 [DOI] [PMC free article] [PubMed] [Google Scholar]
- Lo FS, Erzurumlu RS (2002) L-type calcium channel-mediated plateau potentials in barrelette cells during structural plasticity. J Neurophysiol 88:794–801. 10.1152/jn.2002.88.2.794 [DOI] [PMC free article] [PubMed] [Google Scholar]
- Lorenzetti FD, Baxter DA, Byrne JH (2008) Molecular mechanisms underlying a cellular analog of operant reward learning. Neuron 59:815–828. 10.1016/j.neuron.2008.07.019 [DOI] [PMC free article] [PubMed] [Google Scholar]
- Metz AE, Jarsky T, Martina M, Spruston N (2005) R-type calcium channels contribute to afterdepolarization and bursting in hippocampal CA1 pyramidal neurons. J Neurosci 25:5763–5773. 10.1523/JNEUROSCI.0624-05.2005 [DOI] [PMC free article] [PubMed] [Google Scholar]
- Milojkovic BA, Radojicic MS, Goldman-Rakic PS, Antic SD (2004) Burst generation in rat pyramidal neurones by regenerative potentials elicited in a restricted part of the basilar dendritic tree. J Physiol 558:193–211. 10.1113/jphysiol.2004.061416 [DOI] [PMC free article] [PubMed] [Google Scholar]
- Morton DW, Chiel HJ (1993) The timing of activity in motor neurons that produce radula movements distinguishes ingestion from rejection in Aplysia. J Comp Physiol A Neuroethol Sens Neural Behav Physiol 173:519–536. 10.1007/BF00197761 [DOI] [PubMed] [Google Scholar]
- Mozzachiodi R, Lorenzetti FD, Baxter DA, Byrne JH (2008) Changes in neuronal excitability serve as a mechanism of long-term memory for operant conditioning. Nat Neurosci 11:1146–1148. 10.1038/nn.2184 [DOI] [PMC free article] [PubMed] [Google Scholar]
- Nargeot R, Baxter DA, Byrne JH (1999a) In vitro analog of operant conditioning in Aplysia. I. Contingent reinforcement modifies the functional dynamics of an identified neuron. J Neurosci 19:2247–2260. 10.1523/JNEUROSCI.19-06-02247.1999 [DOI] [PMC free article] [PubMed] [Google Scholar]
- Nargeot R, Baxter DA, Byrne JH (1999b) In vitro analog of operant conditioning in Aplysia. II. Modifications of the functional dynamics of an identified neuron contribute to motor pattern selection. J Neurosci 19:2261–2272. 10.1523/JNEUROSCI.19-06-02261.1999 [DOI] [PMC free article] [PubMed] [Google Scholar]
- Nargeot R, Baxter DA, Byrne JH (2002) Correlation between activity in neuron B52 and two features of fictive feeding in Aplysia. Neurosci Lett 328:85–88. 10.1016/s0304-3940(02)00468-8 [DOI] [PubMed] [Google Scholar]
- Pierson PM, Liu Xinhuai, Raggenbass M (2005) Suppression of potassium channels elicits calcium-dependent plateau potentials in suprachiasmatic neurons of the rat. Brain Res 1036:50–59. 10.1016/j.brainres.2004.12.020 [DOI] [PubMed] [Google Scholar]
- Plotkin JL, Day M, Surmeier DJ (2011) Synaptically driven state transitions in distal dendrites of striatal spiny neurons. Nat Neurosci 14:881–888. 10.1038/nn.2848 [DOI] [PMC free article] [PubMed] [Google Scholar]
- Plummer MR, Kirk MD (1990) Premotor neurons B51 and B52 in the buccal ganglia of Aplysia californica: synaptic connections, effects on ongoing motor rhythms, and peptide modulation. J Neurophysiol 63:539–558. 10.1152/jn.1990.63.3.539 [DOI] [PubMed] [Google Scholar]
- Shah KR, Guan X, Jiusheng Y (2021) Structural and functional coupling of calcium-activated BK channels and calcium-permeable channels within nanodomain signaling complexes. Front Physiol 12:796540. 10.3389/fphys.2021.796540 [DOI] [PMC free article] [PubMed] [Google Scholar]
- Sieling F, Bédécarrats A, Simmers J, Prinz AA, Nargeot R (2014) Differential roles of nonsynaptic and synaptic plasticity in operant reward learning-induced compulsive behavior. Curr Biol 24:941–950. 10.1016/j.cub.2014.03.004 [DOI] [PubMed] [Google Scholar]
- Stafstrom CE (2007) Persistent sodium current and its role in epilepsy. Epilepsy Curr 7:15–22. 10.1111/j.1535-7511.2007.00156.x [DOI] [PMC free article] [PubMed] [Google Scholar]
- Takahashi H, Magee JC (2009) Pathway interactions and synaptic plasticity in the dendritic tuft regions of CA1 pyramidal neurons. Neuron 62:102–111. 10.1016/j.neuron.2009.03.007 [DOI] [PubMed] [Google Scholar]
- Tam AK, Geiger JE, Hung AY, Groten CJ, Magoski NS (2009) Persistent Ca2+ current contributes to a prolonged depolarization in Aplysia bag cell neurons. J Neurophysiol 102:3753–3765. 10.1152/jn.00669.2009 [DOI] [PubMed] [Google Scholar]
- Tryba AK, Kaczorowski CC, Ben-Mabrouk F, Elsen FP, Lew SM, Marcuccilli CJ (2011) Rhythmic intrinsic bursting neurons in human neocortex obtained from pediatric patients with epilepsy. Eur J Neurosci 34:31–44. 10.1111/j.1460-9568.2011.07746.x [DOI] [PubMed] [Google Scholar]
- Vergara R, Rick C, Hernández-López S, Laville JA, Guzman JN, Galarraga E, Surmeier DJ, Bargas J (2003) Spontaneous voltage oscillations in striatal projection neurons in a rat corticostratal slice. J Physiol 553:169–182. 10.1113/jphysiol.2003.050799 [DOI] [PMC free article] [PubMed] [Google Scholar]
- Walsh JP, Byrne JH (1989) Modulation of a steady-state Ca2+-activated, K+ current in tail sensory neurons of Aplysia: role of serotonin and cAMP. J Neurophysiol 61:32–44. 10.1152/jn.1989.61.1.32 [DOI] [PubMed] [Google Scholar]
- Wengert ER, Patel MK (2021) The role of the persistent sodium current in epilepsy. Epilepsy Curr 21:40–47. 10.1177/1535759720973978 [DOI] [PMC free article] [PubMed] [Google Scholar]
- Zhang B, Wootton JF, Harris-Warrick RM (1995) Calcium-dependent plateau potentials in a crab stomatogastric ganglion motor neuron. II. Calcium-activated slow inward current. J Neurophysiol 74:1938–1946. 10.1152/jn.1995.74.5.1938 [DOI] [PubMed] [Google Scholar]
- Ziv I, Baxter DA, Byrne JH (1994) Simulator for neural networks and action potentials: description and application. J Neurophysiol 71:294–308. 10.1152/jn.1994.71.1.294 [DOI] [PubMed] [Google Scholar]
Associated Data
This section collects any data citations, data availability statements, or supplementary materials included in this article.
Supplementary Materials
Inactivation measurements. A, Inactivation measurements for IA. Currents measured at −10 mV elicited by a 1-s prepulse at the indicated potentials. Current was measured by taking the mean of a 4-ms segment 45 ms after start of pulse (arrow). The inactivation at each potential is obtained by normalizing the measurements to the measured value with a −80-mV prepulse. B, Inactivation measurements for ID. Currents measured at 30 mV elicited by a 1-s prepulse at the indicated potentials. Current was measured 18.7 ms after the start of the pulse (arrow). The inactivation at each potential is obtained by normalizing the measurements to the measured value with a −30-mV prepulse. C, Inactivation measurements for ICaL. Currents measured at 0 mV elicited by a 1.5-s prepulse at the indicated potentials. A single exponential was fitted to a 150-ms segment of data during the decay phase (starting 35 ms after the start of the pulse). The curve was then extrapolated back to 0 ms. The inactivation at each potential is obtained by normalizing the measurements to the measured value with a −70-mV prepulse. D, Inactivation measurements for ICaR. The same methods were used as in Panel C. For B51, a different set of cells were used than for Figure 4K–S. Download Figure 2-1, TIF file (8.5MB, tif) .
Voltage-dependence of activation and inactivation time constants. A, The inactivation time constants for IA were averaged across all measured voltages. Inactivation time constant was greater in B8 IA compared to B51 and B64 (B51 = 0.054(0.051, 0.063) MΩ, B64 = 0.048(0.040, 0.055) MΩ, B8 = 0.18(0.17,0.20) MΩ; F(2,13) = 117.4, p = 3.8 × 10⁻⁸; post hoc B51 vs B64, p = 0.61; B51 vs B8, p = 1.4 × 10⁻⁷; B64 vs B8, p = 1.19 × 10⁻⁷). Plus signs indicate the values used for the models and were 0.035 s for B51 and B64 and 0.14 s for B8. B, The inactivation time constants for ID. Equation 16 without the second term in the denominator was used to fit these data. Solid lines indicate the time constants for the modeled current. Parameters were: B51, τmax = 3 s, τmin = 0.26 s, h = −14 mV, s = 7; B64, τmax = 5.8 s, τmin = 0.18 s, h = −60 mV, s = 15; B8, τmax = 2 s, τmin = 0.15 s, h = −14 mV, s = 8. C, The activation time constants for ICaL. Equation 16 was used to fit these data. Solid lines indicate the time constants for the modeled current. Parameters were: B51, τmax = 0.06 s, τmin = 0.002 s, h1 = −15 mV, s1 = −13, h2 = 5, s2 = 13; B64, τmax = 0.0088 s, τmin = 0.002 s, h1 = 0 mV, s1 = −4, h2 = 35, s2 = 4; B8, τmax = 0.08 s, τmin = 0.002 s, h1 = −20.5 mV, s1 = −13, h2 = 15, s2 = 13. D, The inactivation time constants for ICaL were averaged across all measured voltages. Inactivation time constant was greater in B51 ICaL compared to B8 and there was a trend toward being greater than B64 (B51 = 0.22(0.17, 0.27) MΩ, B64 = 0.12(0.11, 0.22) MΩ, B8 = 0.049(0.039,0.06) MΩ; F(2,14) = 9.75, p = 0.003; post hoc B51 vs B64, p = 0.22; B51 vs B8, p = 0.0024; B64 vs B8, p = 0.054). Plus signs indicate the values used for the models and were 0.035 for B8, 0.12 for B51, and 0.14 for B64. E, The activation time constants for ICaR. Equation 16 was used to fit these data. Solid lines indicate the time constants for the modeled current. Parameters were: B51, τmax = 0.03 s, τmin = 0.001 s, h1 = −10 mV, s1 = −5.3, h2 = 14, s2 = 5.6; B64, τmax = 0.02 s, τmin = 0.001 s, h1 = 13 mV, s1 = −12.7, h2 = 25, s2 = 13; B8, τmax = 0.076 s, τmin = 0.001 s, h1 = −1 mV, s1 = −7.2, h2 = 23, s2 = 7.2. F, The inactivation time constants for ICaR. Equation 16 without the second term in the denominator was used to fit these data. Solid lines indicate the time constants for the modeled current. Parameters were: B51, τmax = 0.08 s, τmin = 0.038 s, h = 0 mV, s = 5; B64, τmax = 0.036 s, τmin = 0.025 s, h = 0 mV, s = 0.46; B8, τmax = 0.043 s, τmin = 0.025 s, h = 1 mV, s = 6. G, The inactivation time constants for INaP. Equation 16 was used to fit these data. Solid lines indicate the time constants for the modeled current. Parameters for B51, B64, and B8 were: τmax = 2.5 s, τmin = 0.25 s, h1 = −55 mV, s1 = −1.5, h2 = −45, s2 = 1.5. Download Figure 2-2, TIF file (8.1MB, tif) .
Table of all of the steady state parameters of the voltage gated ion currents. The parameter name is listed in the left column ḡ (ḡvdij in Eq. 7), hact (h in Eq. 12), sact (s in Eq. 12), hina (h in Eq. 12), bina (s in Eq. 15), Bmin (Bmin in Eq. 15). For each neuron, the parameter value used in the model is under the column labeled Model, and the summary data of the measured value is in the column labeled Empirical. The empirical values are represented as medians with the 25th and 75th percentiles in parentheses. The statistical results and P values comparing the empirical data of the three neurons are provided in the columns labeled Statistics and P value, respectively. P values from post hoc comparisons are provided in the right three columns. The summary data are also represented in boxplots in Extended Data Figures 2-5. * The parameters for IKCa were estimated by manually adjusting the parameters in the model and comparing the response to simulated voltage commands to responses in the empirical data set. Model parameter values that are outside the interquartile range are in bold. # The inactivation slope for IKTEA was fixed at −5 (see Materials and Methods). ǂ The inactivation for INaP was fixed at these values. Ileak was set to 0.046 nS in B51 and 0.065 nS in B64 and 0 nS in B8. Download Table 2-1, DOCX file (23.6KB, docx) .
IKTEA is increased in B8. A, Voltage-clamp protocol to measure IKTEA. 10 mM 4-AP was used to block IA and 10 mM Ni2+ and 100 µM Cd2+ was used to block voltage-gated calcium channels and IKCa. B–D, 4 mM TEA subtracted current response indicating an unidentified outward current for B51 (B), B64 (C), and B8 (D) that we label here IKTEA. A single exponential equation (Eq. 1) was fitted to a 500-ms region beginning 25 ms after start of the command pulse. E, Summary data for the activation curves (solid line, solid diamond). These data were fit with Boltzmann equations (Eq. 12) with minimum A (minimum activation) set to 0. Data are represented as mean and standard error. F, Summary data for the inactivation curves (solid line, solid diamond). These data were fit with Boltzmann equations (Eq. 15). Data are represented as mean and standard error. G–J, Summary data for the parameters of the Boltzmann equations (Eqs. 15 and 15). Data are represented by a boxplot, median is a horizontal line and the interquartile range is represented by a rectangle. K, Maximum conductance of IKTEA was estimated by extrapolating the fitted exponential curve to the beginning of the pulse and calculating conductance using Ohm's law. L, Mean current responses of IKTEA for B51, B64, and B8 compared to simulation results. The time constant parameters were: B51, τmax = 0.8 s, τmin = 0.08 s, h1 = 18 mV, s1 = −2, h2 = 20 mV, s2 = 2; B64, τmax = 1.1 s, τmin = 0.2 s, h1 = −13 mV, s1 = −2, h2 = −6 mV, s2 = 2; B8, τmax = 1.4 s, τmin = 0.2 s, h1 = −2 mV, s1 = −1.5, h2 = 3.5 mV, s2 = 1.5. Download Figure 3-1, TIF file (10.6MB, tif) .
Comparison of voltage-clamp simulations and empirical data. A, Mean current responses (solid line) from experiments measuring IA (Fig. 2A–I) for B51, B64, and B8 compared to simulations (dashed lines) of the same voltage-clamp protocol in the model neurons. B, Mean current responses of ID (Fig. 2K–T) for B51, B64, and B8 compared to simulation results. C, Mean current responses of ICaL (Fig. 4A–J) for B51, B64, and B8 compared to simulation results. D, Mean current responses of ICaR (Fig. 4K–S) for B51, B64, and B8 compared to simulations results. E, Mean current responses of IKCa (Fig. 3C–J) for B51, B64, and B8 compared to simulation results. F, Mean current responses of INaP (Fig. 5C–J) for B51, B64, and B8 compared to simulation results. G, Mean current responses of IHCN for B51, B64, and B8 compared to simulation results. Download Figure 6-1, TIF file (15.7MB, tif) .
Characterization of IHCN of B8. A, Example sag potential and rebound excitation in B8. B, Example ZD7288 block of IHCN in B8. 10 µM ZD7288 completely blocked IHCN (n = 6). C, Voltage-clamp protocol. Neuron was held at −40 mV and stepped to potentials ranging from −40 to −110 mV for 10 s (prepulse) to activate IHCN then stepped to −140 mV. The amplitude of the tail current indicated the amount of IHCN activated during the prepulse. D, Example current response. A single exponential equation (Eq. 1) was fitted to a 3-s region beginning 70 ms after start of the command pulse (black line). E, Example tail currents during the step to −140 mV. Traces are colored according to prepulse command potential. A single exponential equation (Eq. 1) was fitted to a 330-ms region beginning 70 ms after start of the −140-mV command pulse (black line). The curve was extrapolated back to the start of the pulse to estimate the amount of activation. The activation at each potential is obtained by subtracting each measurement by the measurement with a −30-mV prepulse then normalizing to the measurement with a −110-mV prepulse. F, Steady-state activation curve. The tail current was used to measure the steady-state activation. The parameters of the activation curve are provided in Extended Data Table 2-1. G, Voltage-dependence of the activation time constant determined by the time constant of the exponential equation fit to the prepulse current responses in D. Parameters were: τmax = 14 s, τmin = 0.9 s, h1 = −73 mV, s1 = −9, h2 = −75, s2 = 9. Download Figure 6-2, TIF file (5MB, tif) .
Differences in Rin and capacitance cannot explain propensity to generate plateau potentials. A, Input resistance measurements of B51, B64, and B8. Input resistance and time constant were measured by injecting a −1-nA current pulse. An exponential function was fitted to the first 1 s of the voltage trace during this current injection. Neuron B51 had a greater input resistance compared to B64 and B8 (B51 = 30.2(20.3, 35.8) MΩ, B64 = 11.3(9.2, 13.8) MΩ, B8 = 14.4(12.1,16.4) MΩ; H(2) = 50.7, p = 9.8 × 10⁻¹²; post hoc B51 vs B64, p = 9.9 × 10⁻¹⁰; B51 vs B8, p = 1.4 × 10⁻⁵; B64 vs B8, p = 0.22). B, Capacitance measurements of B51, B64, and B8. Calculated by dividing the time constant by the input resistance. Neuron B8 had a greater capacitance compared to B51 and B64 (B51 = 0.0023(0.0021, 0.0027) µF, B64 = 0.0022(0.0020, 0.0027) µF, B8 = 0.0098(0.007, 0.013) µF; H(2) = 47.9, p = 4.0 × 10⁻¹¹; post hoc B51 vs B64, p = 0.51; B51 vs B8, p = 1.3 × 10⁻⁸; B64 vs B8, p = 1.3 × 10⁻⁹). C, Time constant measurements of B51, B64, and B8. B8 had a greater membrane time constant compared to B51 and B64 (B51 = 0.073(0.045, 0.090) s, B64 = 0.024(0.021, 0.028) s, B8 = 0.15(0.098, 0.19) s; H(2) = 62.1, p = 3.3 × 10⁻¹⁴; post hoc B51 vs B64, p = 2.0 × 10⁻⁶; B51 vs B8, p = 6.0 × 10⁻⁴; B64 vs B8, p = 9.6 × 10⁻¹⁰). D, The capacitance was varied from 2 nF (red, B51 empirical value) to 10 nF (blue, B8 empirical value). The models for B51 or B64 did not exhibit regular firing upon increasing their capacitance. The model for B8 did not exhibit a plateau upon decreasing its capacitance. Download Figure 6-3, TIF file (4.2MB, tif) .
Heat maps of the parameter space indicate that ion channels differentially affect the depolarization of the plateau and action potential duration. A, Heat maps of the effect of the ḡ parameter space for the ID, IA, IKCa, ICaL, and ICaR on the amount of depolarization of the plateau. The ḡ of each channel was varied from 0 to 6 µS while ḡNaP was varied independently from 0 to 0.75 µS. The remaining model parameters were determined by experimental data presented in Extended Data Figures 2-2, 6-2, and 6-3 and Extended Data Table 2-1. The model was held to −80 mV, similar to experiments, and activity was elicited by a 1-s, 5-nA simulated current injection. The dots indicate the default values of ḡ in the model (red = B51, green = B64, cyan = B8). Examples of the voltage traces are provided in B–E and the locations are indicated on the heatmap. A guide to interpreting the maps is provided on the right. Data from the same simulations as Figure 8. Note the similarity with Figure 8. B–E, Voltage trace of simulations (top) for the parameter values indicated (bottom). The locations in the parameter space for B–E are indicated in A. F–I, Histograms of the voltages for the simulations in B–E, respectively. The amplitude of the plateau is calculated as the location of the peak of this histogram in mV subtracted by the holding potential of the model neuron (−80 mV). J, Heat maps of the effect of the ḡ parameter space for the ID, IA, IKCa, ICaL, and ICaR on action potential duration. The dots indicate the default values of ḡ in the model (red = B51, green = B64, cyan = B8). Examples of the voltage traces are provided in B–E and the locations are indicated on the heatmap. A guide to interpreting the maps is provided on the right. Action potential duration was calculated as the average time above 0 mV for each action potential. Download Figure 8-1, TIF file (22.1MB, tif) .
Plateau duration, amplitude, and action potential duration heat maps of the parameter space of IKTEA. Heat maps of the effect of the ḡ parameter space for the IKTEA on action potential duration. The ḡ of each channel was varied from 0 to 6 µS while ḡNaP was varied independently from 0 to 0.5 µS. The remaining model parameters were determined by experimental data presented in Extended Data Figures 2-1, 2-2, 3-1, 6-1, 6-2, and 6-3. The model was held to −80 mV, similar to experiments, and activity was elicited by a 1-s, 5-nA simulated current injection. The dots indicate the default values of ḡ in the model (red = B51, green = B64, cyan = B8). Data from the same simulations as Figure 7. Download Figure 8-2, TIF file (5.6MB, tif) .
Data Availability Statement
Raw data and annotated spreadsheets are deposited on Google Drive. A link will be provided on request. The code for mathematical simulation is provided on ModelDB. The analysis routines were written in MATLAB and are provided on GitHub at https://github.com/Byrne-Lab/Neveu_2023. Any additional information for reanalyzing the data are available from the Lead Contact on request.