

Abstract
Background and Objectives
The density of neurologists within a given geographic region varies greatly across the United States. We aimed to measure patient travel distance and travel time to neurologist visits, across neurologic conditions and subspecialties. Our secondary goal was to identify factors associated with long-distance travel for neurologic care.
Methods
We performed a cross-sectional analysis using a 2018 Medicare sample of patients with at least 1 outpatient neurologist visit. Long-distance travel was defined as driving distance ≥50 miles 1-way to the visit. Travel time was measured as driving time in minutes. Multilevel generalized linear mixed models with logistic link function, which accounted for clustering of patients within hospital referral region and allowed modeling of region-specific random effects, were used to determine the association of patient and regional characteristics with long-distance travel.
Results
We identified 563,216 Medicare beneficiaries with a neurologist visit in 2018. Of them, 96,213 (17%) traveled long distance for care. The median driving distance and time were 81.3 (interquartile range [IQR]: 59.9–144.2) miles and 90 (IQR: 69–149) minutes for patients with long-distance travel compared with 13.2 (IQR: 6.5–23) miles and 22 (IQR: 14–33) minutes for patients without long-distance travel. Comparing across neurologic conditions, long-distance travel was most common for nervous system cancer care (39.6%), amyotrophic lateral sclerosis [ALS] (32.1%), and MS (22.8%). Many factors were associated with long-distance travel, most notably low neurologist density (first quintile: OR 3.04 [95% CI 2.41–3.83] vs fifth quintile), rural setting (4.89 [4.79–4.99]), long-distance travel to primary care physician visit (3.6 [3.51–3.69]), and visits for ALS and nervous system cancer care (3.41 [3.14–3.69] and 5.27 [4.72–5.89], respectively). Nearly one-third of patients bypassed the nearest neurologist by 20+ miles, and 7.3% of patients crossed state lines for neurologist care.
Discussion
We found that nearly 1 in 5 Medicare beneficiaries who saw a neurologist traveled ≥50 miles 1-way for care, and travel burden was most common for lower-prevalence neurologic conditions that required coordinated multidisciplinary care. Important potentially addressable predictors of long-distance travel were low neurologist density and rural location, suggesting interventions to improve access to care such as telemedicine or neurologic subspecialist support to local neurologists. Future work should evaluate differences in clinical outcomes between patients with long-distance travel and those without.
Introduction
The distribution of neurologists differs across geographic regions in the United States. In fact, the regional density of neurologists in the United States varies 4-fold from highest to lowest quintile.1 Despite this variation in neurologist availability, most patients (approximately 80% or more) with Parkinson disease and multiple sclerosis (MS) see a neurologist regardless of neurologist density in their home region.1 In fact, the regional density of neurologists does not substantially affect whether most patients with neurologic disease are seen by neurologists; patients with dementia, pain, and stroke are relative exceptions.1 However, the burden experienced by patients to obtain their neurologic care, such as distance traveled by patients to see their neurologists, has not been well characterized.
While travel distance and its consequences have not been well studied in neurologic conditions, these topics have been addressed in other contexts. For example, previous studies demonstrate that rural populations have disproportionate travel burden compared with urban populations. Specifically, rural patients traveled 60 miles more than urban patients to reach similar high-volume health care centers.2 Regarding consequences of travel distance, one study of cancer care showed that long travel distance from a patient's residence to a health care provider could be a barrier to disease diagnosis and treatment.3 In other studies, patient travel ≥50 miles or driving time ≥1 hour were associated with more advanced cancer stage at diagnosis4,5 and decreased likelihood of guideline-recommended treatment.6,7 Travel burden for patients with neurologic conditions may be further involved because patients with certain conditions (e.g., disabling cognitive impairment or seizures) can have restrictions on driving,8,9 which can limit ability to seek care.
Little is known regarding how far patients with neurologic disease travel for neurologist care and how travel burden varies across neurologic conditions and subspecialties. Moreover, the effect of regional density of neurologists on travel distance is unknown. Whether travel distance affects the likelihood of subsequent neurologic care is also unclear. In this study, we aimed to fill these knowledge gaps by measuring travel distance and travel time to neurologist visits across neurologic conditions and subspecialties to identify factors associated with patients traveling long distances for neurologist visits and to identify factors associated with patients returning for subsequent follow-up visits.
Methods
Data Source
We used a 20% national sample of 2018 Medicare Carrier Files (most recent available data during the project) to identify neurologist visits. The 20% sample was quasi-randomly selected based on Medicare beneficiaries' last 2 digits of their Medicare Claim Account Numbers and was not oversampled for beneficiaries with certain characteristics. Medicare claims files include Fee-for-Service claims for persons aged 65 years or older and persons with end-stage renal disease, amyotrophic lateral sclerosis (ALS), or disability regardless of age. Beneficiary characteristics extracted from the Master Beneficiary Summary File (MBSF) included demographics (age, sex, race, and ethnicity), dual eligibility for Medicare and Medicaid, and ZIP codes of residence.
Study Population
We identified Medicare-insured patients who had at least 1 office-based evaluation and management (E/M) visit to a neurologist in 2018 through Current Procedural Terminology codes (CPT: 99201–99205 [new patient], 99211–99215 [established patient]). We excluded patients residing outside of the United States, in Alaska, Hawaii, or US territories, or with missing residence information. Neurologists were identified through provider specialty code (HCFASPCL: 13) in Medicare Carrier files or by NPI numbers identified through the CMS National Plan and Provider Enumeration System (NPPES) files with neurology taxonomy codes (2084N0600X, 2084A2900X, 2084N0400X, 2084N0008X, or 2084V0102X). We excluded office E/M visits with missing provider information or without practice location.
Outcomes
Our primary outcome was long-distance travel for care defined as patients traveling ≥50 miles 1-way for their neurologist visit, which has been used in previous studies.4,5 Travel distance for each office-based E/M visit was measured as driving distance in miles between patient residence and neurologist office 5-digit zip codes. The provider location information available in Medicare carrier files is the zip code of the facility where the Part B service was provided by the physician. Travel time was measured as driving time in minutes. Travel distance and time were measured using SAS URL access to Google Maps. The unit of analysis was the patient.
In addition to travel distance and travel time, we assessed whether patients bypassed the nearest neurologist. We identified the travel distance to the nearest neurologist per subspecialty for each patient through examining driving distance between patient zip code and all relevant subspecialist neurologist office zip codes. We then compared a patient's distance with that of the nearest relevant subspecialist neurologist vs that patient's actual travel distance to determine whether a patient bypassed a nearest neurologist, traveling further to see another neurologist.
Our secondary outcome was completing a follow-up visit. This outcome was counted if after an initial new patient neurologist visit, there was at least 1 established patient visit to the same neurologist for the same neurologic condition. We limited this analysis to those new patient visits occurring during the first 3 quarters of 2018 to ensure a minimum of 3 months of study period in which we could capture a follow-up visit. The unit of analysis was the visit.
Primary Exposure
The primary exposure was the density of neurologists within a region calculated by summing the number of neurologists per 100,000 Medicare beneficiaries in each hospital referral region (HRR) and categorized into density quintiles.1 HRRs, defined by Dartmouth Atlas of Health Care, are 306 geographic areas covering 1 or more ZIP codes where medical resources are distributed and are believed to reflect tertiary referral patterns. The region where a patient resided was determined by their mailing address zip code in the MBSF, which was then assigned to the corresponding HRR. Each neurologist's practice location was determined by “carrier line performing provider ZIP Code” in the Medicare Carrier files and assigned a corresponding HRR.
Covariates
Long-distance travel and travel distance were examined across neurologist subspecialties. The subspecialty of each neurologist was mainly identified through the American Academy of Neurology (AAN) membership dataset, which contains physician members' self-reported subspecialty. Because the AAN membership dataset does not contain physicians' NPIs, we used their name, state, and zip codes to identify them in the NPPES files, obtain their NPIs, and then link back to Medicare claim files. If subspecialty was not reported in the AAN membership dataset, 2 additional datasets were used: (1) 2019 NPPES files, which contain physician specialty in taxonomy codes, and (2) 2015 American Medical Association (AMA) Physicians Masterfile, which contains physician primary and secondary specialties. In total, we grouped subspecialties into 19 categories (Table 1). One fifth (21%) of neurologists had no information available to determine their subspecialty.
Table 1.
Neurologists and Visits Across Subspecialties

| # Physicians | Total claims | New patient claims | Established patient claims | |||||
| Neurology subspecialty | N | % | N | % | N | % | N | % |
| Autonomic disorders/neuromuscular medicine | 933 | 6.5 | 68,198 | 5.6 | 15,140 | 22.2 | 53,058 | 77.8 |
| Endovascular and interventional neurology/vascular neurology and stroke | 1,047 | 7.3 | 44,413 | 3.6 | 9,550 | 21.5 | 34,863 | 78.5 |
| Infectious diseases and neurovirology/neuroimmunology and multiple sclerosis | 544 | 3.8 | 32,129 | 2.6 | 4,549 | 14.2 | 27,580 | 85.8 |
| Neural repair and rehabilitation/sports neurology/traumatic brain injury | 68 | 0.5 | 2,761 | 0.2 | 625 | 22.6 | 2,136 | 77.4 |
| Neurocritical care/neurohospitalist | 284 | 2.0 | 4,564 | 0.4 | 1,527 | 33.5 | 3,037 | 66.5 |
| Other/neuroepidemiology/neurogenetics/neuroimaging/neurologic surgery/palliative neurology | 279 | 1.9 | 20,030 | 1.6 | 4,402 | 22.0 | 15,628 | 78.0 |
| Behavioral neurology and neuropsychiatry | 260 | 1.8 | 17,388 | 1.4 | 3,863 | 22.2 | 13,525 | 77.8 |
| Child neurology | 202 | 1.4 | 4,756 | 0.4 | 820 | 17.2 | 3,936 | 82.8 |
| Clinical neurophysiology | 945 | 6.5 | 81,329 | 6.6 | 17,275 | 21.2 | 64,054 | 78.8 |
| Epilepsy | 1,008 | 7.0 | 57,051 | 4.6 | 9,569 | 16.8 | 47,482 | 83.2 |
| General neurology | 3,548 | 24.6 | 432,900 | 35.3 | 85,279 | 19.7 | 347,621 | 80.3 |
| Geriatric neurology | 77 | 0.5 | 6,100 | 0.5 | 1,123 | 18.4 | 4,977 | 81.6 |
| Headache medicine | 338 | 2.3 | 25,728 | 2.1 | 4,309 | 16.7 | 21,419 | 83.3 |
| Movement disorders | 738 | 5.1 | 71,529 | 5.8 | 11,707 | 16.4 | 59,822 | 83.6 |
| Neuro-oncology | 168 | 1.2 | 9,061 | 0.7 | 1,211 | 13.4 | 7,850 | 86.6 |
| Neuro-ophthalmology | 109 | 0.8 | 7,993 | 0.7 | 2,105 | 26.3 | 5,888 | 73.7 |
| Neuro-otology | 24 | 0.2 | 1,384 | 0.1 | 542 | 39.2 | 842 | 60.8 |
| Pain medicine | 186 | 1.3 | 32,901 | 2.7 | 3,474 | 10.6 | 29,427 | 89.4 |
| Sleep medicine | 606 | 4.2 | 64,246 | 5.2 | 12,069 | 18.8 | 52,177 | 81.2 |
| Unknown | 3,075 | 21.3 | 242,569 | 19.8 | 41,956 | 17.3 | 200,613 | 82.7 |
| Total | 14,439 | 1,227,030 | 100.0 | 231,095 | 18.8 | 995,935 | 81.2 | |
Patient-level covariates included age, sex, race, and ethnicity (categorized as non-Hispanic White, Black, Hispanic, Asian, Native Northern American, others/unknown), Medicare-Medicaid dual eligibility, neurologic condition (identified through international classification of diseases [ICD-10] diagnosis codes and categorized using the Clinical Classifications Software categories of International Classification of Disease with some modification by the authors to reflect disease categories),1 and travel ≥50 miles 1-way for a primary care provider (PCP) visit. PCPs were identified through Medicare provider specialty code (HCFASPCL: 01, 08, 11). Regional-level covariates included census divisions (New England, Middle Atlantic, East North Central, West North Central, South Atlantic, East South Central, West South Central, Mountain, and Pacific) and urban/rural status. Urban and rural were defined through 2010 Rural-Urban Commuting Area (RUCA) Codes based on a patient's residence zip code (RUCA: 1–3 urban; 4–10 rural).
Statistical Analyses
Descriptive statistics were conducted to describe neurologists across subspecialties and patients who visited a neurologist in 2018, including patient demographic characteristics, neurologic conditions, visit type, and subspecialty care by travel pattern. To examine factors associated with long-distance travel, we fit a multilevel generalized linear mixed model with logistic link function, which accounted for clustering of patients within HRR region and allowed modeling of region-specific random effects. The multilevel model included level 1 personal factors (age, sex, race, and ethnicity, Medicare-Medicaid dual eligibility, and neurologic condition), level 2 regional factors (neurologist density, census division, and urban/rural), and a random intercept of HRR to account for correlated observations within HRR region. Our secondary analysis was to determine factors associated with having a follow-up visit. We used a similar approach to estimate the probability of having a follow-up visit after a new patient visit during the first 3 quarters of 2018 using claim-level data instead of patient-level data as was done in the primary analytic model. We examined the intraclass correlation coefficient (ICC) through an unconditional model with a random intercept of HRR to estimate how much of the total variation in the probability of traveling for neurologist care and having a follow-up visit was accounted for by the region (ranged from 0 = no variance between regions, to 1 = all variance was between-region variance), and the area under the receiver operating characteristic curve (AUC) with 95% CI was summarized. To explore the potential interaction between race and ethnicity and rurality in the study, we conducted a secondary analysis including the interaction term of race and ethnicity and urban/rural status in the model. In addition, because there is not a standard way to define long-distance travel, we conducted several sensitivity analyses with different definitions: (1) defining long-distance travel as 60 miles 1-way10 and (2) considering distance and time as continuous measures. All p values were 2-sided, and p < 0.05 was considered statistically significant. Statistical analyses were performed using SAS 9.4 (SAS Institute, Cary, NC). Map files containing HRR shape files were accessed from the Dartmouth Atlas Data. Geographic distribution of neurologists was mapped using ArcGIS Pro software (version 2.4.2; Esri, Redlands, CA).
Standard Protocol Approvals, Registrations, and Patient Consents
This study was determined to be exempt from review, and the requirement for obtaining patient written informed consent was waived by the Michigan Medicine Institutional Review Board.
Data Availability
The full dataset, 20% Medicare claim files, is available through CMS (cms.gov).
Results
Neurologists Across Subspecialties
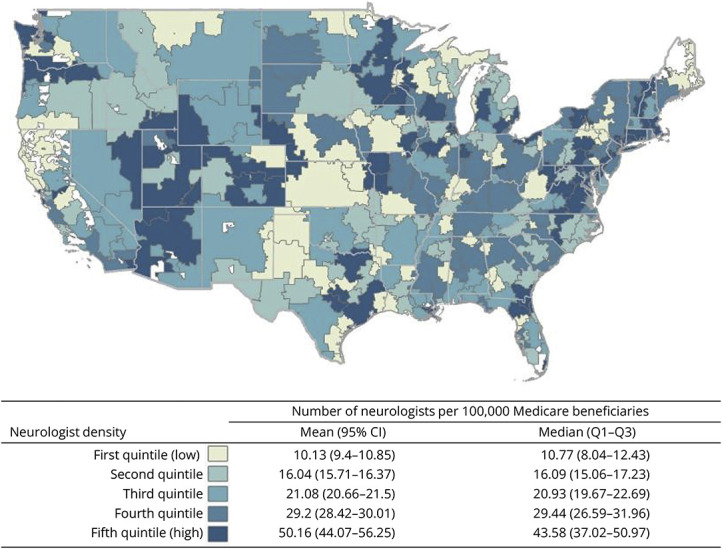
We identified 14,439 neurologists who provided 1,227,030 office-based E/M visits for Medicare-insured adults in 2018. Of note, 2018 predates widespread use of telemedicine, and these visits were presumed to be in-person. Figure shows the geographic distribution of neurologists at the HRR level by neurologist density quintile. The average density of neurologists was 25.3 (95% CI 23.3–27.3) per 100,000 Medicare beneficiaries. The most common subspecialties were general neurology (N = 3,548, 24.6%), endovascular and interventional neurology/vascular neurology and stroke (N = 1,047, 7.3%), epilepsy (N = 1,008, 7%), clinical neurophysiology (N = 945, 6.5%), and autonomic disorders/neuromuscular medicine (N = 933, 6.5%) (Table 1).
Figure. Geographic Distribution of Neurologists.
Patient Characteristics
We identified 563,216 Medicare-insured adult patients with at least 1 neurologist visit in 2018 (Table 2). The mean age was 70.4 years (SD 12.8), 56.7% were female, 81.4% were non-Hispanic White, 22.8% were Medicare-Medicaid dual eligible, 35% resided in the highest quintile neurologist density regions, and 17.7% resided in rural areas. The most common neurologic conditions were dementia (12.3%), peripheral nervous system disorders (11.3%), epilepsy/convulsions (10.5%), chronic pain/abnormality of gait (9.7%), and tremor/restless legs syndrome (9.5%). The most common neurology subspecialties visited were general neurology (38.5%), clinical neurophysiology (7.4%), autonomic disorders/neuromuscular medicine (6.4%), movement disorders (6.4%), sleep medicine (6.4%), and epilepsy (5.5%). Most of the patients (77.2%) visited PCPs at least once in 2018, and 19.7% had a PCP visit with a billed neurologic diagnosis code that matched the billed neurologic diagnosis code for the neurologist visit.
Table 2.
Patient Characteristics and Travel Pattern

| One-way driving distance in miles | One-way driving time in minutes | |||||||
| Total | Travel ≥50 miles | Mean (SD) | Median (Q1–Q3) | Mean (SD) | Median (Q1–Q3) | |||
| Age, y, mean (SD) | 70.4 (12.8) | 46.9 (159.3) | 16.6 (7.8–34.6) | 52.9 (144.6) | 26 (16–45) | |||
| N | % | N | % | |||||
| <65 | 116,891 | 20.8 | 24,269 | 20.8 | 44 (128.1) | 19.2 (8.88–41) | 50.6 (119) | 29 (17–50) |
| 65–74 | 221,754 | 39.4 | 38,971 | 17.6 | 47.3 (157.5) | 17.2 (8.2–35.5) | 53.6 (143.4) | 27 (17–46) |
| 75–84 | 165,066 | 29.3 | 25,739 | 15.6 | 48.8 (173.5) | 15.6 (7.4–32.2) | 54.5 (156) | 25 (16–42.7) |
| ≥85 | 59,505 | 10.6 | 7,234 | 12.2 | 45.6 (179) | 12.8 (6–26.3) | 50.9 (161.2) | 22 (14–37) |
| Sex | ||||||||
| Female | 319,208 | 56.7 | 52,749 | 16.5 | 45.1 (153.8) | 16.2 (7.6–33.8) | 51.3 (139.7) | 26 (16–44) |
| Male | 244,008 | 43.3 | 43,464 | 17.8 | 49.2 (166.4) | 17 (8–35.72) | 55.1 (150.7) | 27 (16–46) |
| Race and ethnicity | ||||||||
| Asian | 12,303 | 2.2 | 896 | 7.3 | 36.7 (180.4) | 10.8 (5.2–20.55) | 43.5 (160.4) | 21 (14–32) |
| Black | 46,786 | 8.3 | 5,514 | 11.8 | 31.8 (116.5) | 12.9 (6.2–25.8) | 38.8 (106.3) | 22 (15–36) |
| Hispanic | 30,469 | 5.4 | 3,959 | 13.0 | 36.9 (127.9) | 12.8 (6–26.4) | 44.3 (118.3) | 23 (14–38) |
| North American Native | 2,158 | 0.4 | 780 | 36.1 | 67.2 (172.2) | 31.4 (11.9–70.6) | 74.2 (165) | 41 (20–82) |
| White | 458,399 | 81.4 | 83,088 | 18.1 | 49.2 (163.6) | 17.5 (8.3–36.5) | 55.1 (148.3) | 27 (16.3–46.7) |
| Other/unknown | 13,101 | 2.3 | 1976 | 15.1 | 47.8 (177.2) | 15 (7.2–30.6) | 54.2 (164.4) | 25 (16–41.8) |
| Dual eligibility | ||||||||
| Not dual-eligible | 434,610 | 77.2 | 74,142 | 17.1 | 18.1 (8.4–41) | 17.9 (8.3–40) | 28 (17–51) | 28 (17–50) |
| Dual-eligible | 128,606 | 22.8 | 22,071 | 17.2 | 17.6 (7.4–43.1) | 17.3 (7.2–42.5) | 27 (16–53) | 27 (16–52) |
| Census division | ||||||||
| New England | 35,315 | 6.3 | 3,903 | 11.1 | 34 (118.3) | 14.9 (6.6–28.2) | 40.8 (106) | 24 (14.2–38) |
| Middle Atlantic | 84,597 | 15.0 | 8,230 | 9.7 | 33.3 (136.4) | 12.7 (5.7–24.1) | 40.9 (121.8) | 23 (15–36) |
| East North Central | 78,647 | 14.0 | 12,756 | 16.2 | 43.1 (145.1) | 17.7 (8.4–34.7) | 48.5 (129) | 27 (16.5–44) |
| West North Central | 35,729 | 6.3 | 10,497 | 29.4 | 64.4 (171) | 24.4 (9.7–57.8) | 66.2 (154.4) | 31 (16–63) |
| South Atlantic | 135,774 | 24.1 | 21,061 | 15.5 | 49.2 (169.8) | 16.1 (8.2–32) | 54.7 (152.2) | 26 (17–43) |
| East South Central | 38,122 | 6.8 | 9,351 | 24.5 | 42.9 (94.9) | 23.8 (11.6–47.4) | 49.4 (85.8) | 33 (19.5–57) |
| West South Central | 56,461 | 10.0 | 11,776 | 20.9 | 46.8 (133) | 19.2 (9.2–41.9) | 51.4 (119.2) | 28 (17–49) |
| Mountain | 31,895 | 5.7 | 8,765 | 27.5 | 80.6 (230.6) | 19.9 (9–56.1) | 87.6 (207.9) | 32 (18–77) |
| Pacific | 66,676 | 11.8 | 9,874 | 14.8 | 47.4 (194) | 14.1 (6.5–30.1) | 55.9 (185.5) | 24 (15–42) |
| Neurologist density | ||||||||
| First quintile (low) | 44,880 | 8.0 | 14,289 | 31.8 | 63.3 (159.4) | 26.7 (11.1–61.4) | 67.9 (143.4) | 36 (19–68) |
| Second quintile | 64,274 | 11.4 | 14,643 | 22.8 | 60.4 (181) | 20.9 (9.3–44.2) | 64.6 (161) | 30 (17–54) |
| Third quintile | 104,831 | 18.6 | 21,674 | 20.7 | 56.9 (183.1) | 18.5 (8.9–40.3) | 62.6 (165.5) | 28 (17–51) |
| Fourth quintile | 151,859 | 27.0 | 24,340 | 16.0 | 40.8 (138.8) | 16.9 (8–33.9) | 47 (126.5) | 26 (16–44) |
| Fifth quintile (high) | 197,372 | 35.0 | 21,267 | 10.8 | 38.1 (152) | 13.4 (6.3–25.8) | 45.1 (139.5) | 23 (15–36) |
| Urban/rural | ||||||||
| Rural | 99,492 | 17.7 | 44,434 | 44.7 | 67.7 (223.3) | 15 (7.3–30.8) | 71.1 (200.1) | 25 (16–41) |
| Urban | 463,724 | 82.3 | 51,779 | 11.2 | 85 (193.4) | 44.5 (22.6–77.6) | 89.5 (178.3) | 53.5 (31–87) |
| Bypassing nearest neurologists | ||||||||
| No bypassing | 221,051 | 39.2 | 12,218 | 5.5 | 15.5 (22.7) | 9.7 (3.5–20.2) | 22.7 (24.8) | 18 (10–30) |
| Bypassing | 342,164 | 60.8 | 83,995 | 24.5 | 67.1 (201) | 22.2 (11.7–46.6) | 72.5 (181.8) | 32 (21–56) |
| Bypassing 10+ miles | 274,220 | 48.7 | 93,484 | 34.1 | 89.9 (228) | 35 (21.5–65) | 94.3 (205.9) | 45 (31–75) |
| Bypassing 20+ miles | 165,461 | 29.4 | 142,851 | 86.3 | 141.2 (296) | 55.8 (34.9–101) | 141.2 (267) | 65.7 (45–110) |
| PCP visit | ||||||||
| Did not see PCP | 128,270 | 22.8 | 29,435 | 22.9 | 51.4 (155.9) | 20.5 (8.9–45.2) | 57.8 (142.5) | 30 (17.4–55) |
| See PCP <50 miles | 364,479 | 64.7 | 37,262 | 10.2 | 28.3 (88.6) | 14.4 (7–27.3) | 35.8 (80.4) | 24 (15–38) |
| See PCP ≥50 miles | 70,467 | 12.5 | 29,516 | 41.9 | 134.9 (329.5) | 32.1 (12–78.9) | 132.8 (297.9) | 42 (21–88) |
| See PCP and neurology both | 85,849 | 15.2 | 15,143 | 17.6 | 51.2 (173.7) | 16.5 (7.8–34.1) | 56.9 (159.9) | 26 (16–44.4) |
| Neurologic condition | N | % | N | % | ||||
| Dementia (653) | 69,257 | 12.3 | 10,206 | 14.7 | 48.6 (174.3) | 15.7 (7.5–32.2) | 54.3 (159.3) | 25 (16–42) |
| Peripheral NS disorders (6.9.1) | 63,645 | 11.3 | 9,788 | 15.4 | 45.7 (156.8) | 16 (7.6–33.1) | 51.8 (142.1) | 26 (16–43) |
| Epilepsy/convulsions (83) | 59,310 | 10.5 | 10,675 | 18.0 | 44.4 (141) | 17.4 (8.1–37.3) | 50.8 (129.9) | 27 (16–47) |
| Chronic pain/abnormality of gait (6.9.3) | 54,631 | 9.7 | 8,101 | 14.8 | 45.8 (158.9) | 16 (7.6–32.9) | 51.8 (141.9) | 26 (16–43) |
| Tremor/RLS (81) | 53,491 | 9.5 | 8,383 | 15.7 | 46.3 (158.7) | 16.4 (7.9–33.6) | 52.4 (143.9) | 26 (16–44) |
| Stroke (109) | 51,447 | 9.1 | 7,574 | 14.7 | 46 (160.3) | 15.5 (7.3–32) | 52 (144.9) | 25 (16–42) |
| Headache/migraine (84) | 48,252 | 8.6 | 7,329 | 15.2 | 42.5 (144.9) | 16.4 (7.7–33.4) | 48.9 (130.8) | 26 (16–43) |
| Back pain (205) | 47,711 | 8.5 | 6,370 | 13.4 | 45.4 (165.7) | 14.8 (6.9–30.7) | 51.4 (150.6) | 25 (15–41) |
| Parkinson disease (79) | 47,199 | 8.4 | 10,045 | 21.3 | 53.2 (164.6) | 19 (8.9–40.9) | 59.1 (152) | 29 (18–50.5) |
| Sleep disorders (260) | 32,879 | 5.8 | 4,960 | 15.1 | 41.8 (139.4) | 16.5 (8.1–33.3) | 48.2 (124.7) | 26 (16–43) |
| MS (80) | 18,812 | 3.3 | 4,285 | 22.8 | 47.7 (126.4) | 21.3 (10.2–44.6) | 54.5 (114.4) | 31 (19–54) |
| Other connective tissue disease (211) | 18,705 | 3.3 | 2,976 | 15.9 | 46.1 (153.8) | 16.5 (7.7–34.7) | 52.1 (137.2) | 26 (16–45) |
| Dizziness/vertigo (93) | 18,188 | 3.2 | 2,310 | 12.7 | 43.6 (159.4) | 14.5 (6.8–28.7) | 49.7 (142.9) | 24 (15–39.7) |
| Other central NS disorders (6.9.2) | 12,864 | 2.3 | 2,167 | 16.8 | 53.2 (175.5) | 16.9 (8.1–35.8) | 58.5 (156.3) | 26.7 (17–46) |
| Syncope (245) | 7,184 | 1.3 | 1,035 | 14.4 | 47.9 (168.9) | 15.5 (7.1–32.5) | 53.4 (151.4) | 25 (15–42) |
| Diabetes with complications (50) | 6,725 | 1.2 | 820 | 12.2 | 36.3 (126.9) | 15.4 (7.3–30.5) | 42.9 (113.2) | 24.5 (15–40) |
| Other circulatory disease (117) | 6,562 | 1.2 | 1,136 | 17.3 | 51.2 (173.2) | 18.2 (8.3–37.3) | 57 (160.8) | 28 (17–47) |
| Blindness and vision defects (89) | 4,889 | 0.9 | 802 | 16.4 | 48.5 (154) | 17.3 (8.4–35.5) | 54.8 (139.7) | 27 (17–45) |
| Mood disorders (657) | 3,846 | 0.7 | 591 | 15.4 | 48.5 (176.1) | 15.8 (7.1–34.4) | 54.7 (182.1) | 25 (15–44) |
| ALS (81.5) | 3,808 | 0.7 | 1,223 | 32.1 | 67.3 (167.7) | 26.1 (12.5–62.8) | 72.4 (149.9) | 36.8 (22–72) |
| Other eye disorders (91) | 2,490 | 0.4 | 500 | 20.1 | 48.6 (142.7) | 19.5 (9.35–39.7) | 55.5 (127.2) | 29 (18.2–50) |
| Cancer of brain and NS (35) | 1797 | 0.3 | 711 | 39.6 | 96.8 (214.7) | 33.7 (15.15–81.4) | 99.5 (191.7) | 44 (25–89) |
| Others | 37,256 | 6.6 | 6,506 | 17.5 | 50.3 (167) | 16.6 (7.6–35.9) | 56 (149.6) | 26 (16–46) |
| Neurologist subspecialty | ||||||||
| Autonomic disorders/neuromuscular medicine | 36,030 | 6.4 | 7,304 | 20.3 | 56.8 (183.8) | 18.4 (8.6–39.9) | 62.5 (163.8) | 28 (17–50.3) |
| Endovascular and interventional neurology/vascular neurology and stroke | 26,637 | 4.7 | 4,931 | 18.5 | 55.1 (175.6) | 16.9 (8.05–37.4) | 60.7 (158.3) | 27 (17–47) |
| Infectious diseases and neurovirology/neuroimmunology and multiple sclerosis | 16,891 | 3.0 | 4,132 | 24.5 | 55.8 (153.3) | 21.5 (10–47.9) | 62.4 (147) | 31.5 (19–58) |
| Neural repair and rehabilitation/sports neurology/traumatic brain injury | 1,360 | 0.2 | 328 | 24.1 | 52.3 (167.4) | 18.5 (8.1–48.6) | 59.1 (158.3) | 30 (18–56) |
| Neurocritical care/neurohospitalist | 2,992 | 0.5 | 529 | 17.7 | 58.2 (200.4) | 18.9 (9.5–38.15) | 63.8 (178.8) | 28 (18–50) |
| Other/neuroepidemiology/neurogenetics/neuroimaging/neurologic surgery/palliative neurology | 10,486 | 1.9 | 1752 | 16.7 | 45.5 (138) | 17.9 (8.1–37) | 51.6 (123.1) | 28 (17–47) |
| Behavioral neurology and neuropsychiatry | 10,005 | 1.8 | 2,253 | 22.5 | 69.4 (213.5) | 18.2 (8.65–42.15) | 73.7 (189.9) | 28.7 (18–52) |
| Child neurology | 2,286 | 0.4 | 494 | 21.6 | 48.4 (149.7) | 16.9 (7.7–43.98) | 54.5 (133.7) | 27 (15–54) |
| Clinical neurophysiology | 41,409 | 7.4 | 5,691 | 13.7 | 44.8 (157.4) | 16.3 (7.75–32.9) | 50.8 (140.6) | 26 (16–43) |
| Epilepsy | 31,100 | 5.5 | 5,514 | 17.7 | 49.1 (158.7) | 17.6 (8.5–36.8) | 55.4 (148.8) | 27 (17–47) |
| General neurology | 216,791 | 38.5 | 30,832 | 14.2 | 43.6 (152.1) | 16 (7.6–32.6) | 49.7 (137.6) | 25 (16–43) |
| Geriatric neurology | 3,330 | 0.6 | 541 | 16.2 | 69.3 (236.2) | 16.9 (8.4–33.4) | 72.8 (208.8) | 26 (17–44) |
| Headache medicine | 12,159 | 2.2 | 2,166 | 17.8 | 53.3 (172) | 17.2 (8.1–36.3) | 58.3 (153) | 27 (17–46) |
| Movement disorders | 35,805 | 6.4 | 8,512 | 23.8 | 61.2 (183.7) | 20.5 (9.8–45.3) | 66.8 (171.1) | 30.25 (19–55) |
| Neuro-oncology | 3,872 | 0.7 | 1,192 | 30.8 | 74.6 (178.5) | 25.4 (11.7–60.4) | 79.3 (159.3) | 36 (22–70) |
| Neuro-ophthalmology | 4,893 | 0.9 | 1,012 | 20.7 | 49.3 (140.9) | 19.4 (9.7–40.7) | 56.1 (125.4) | 30 (19–52) |
| Neuro-otology | 933 | 0.2 | 172 | 18.4 | 64 (198) | 18.3 (8.6–36.2) | 69.6 (176.1) | 29 (19–46) |
| Pain medicine | 9,171 | 1.6 | 1738 | 19.0 | 59.8 (184.7) | 17.5 (7.6–38.5) | 64.2 (165.4) | 28 (16–48) |
| Sleep medicine | 35,850 | 6.4 | 6,254 | 17.4 | 44.6 (144.5) | 17.7 (8.5–37.2) | 50.8 (130.6) | 27 (17–46) |
| Unknown | 113,401 | 20.1 | 17,342 | 15.3 | 45.8 (157.5) | 15.5 (7.2–32.6) | 51.8 (142.4) | 25 (15–43) |
Abbreviations: ALS = amyotrophic lateral sclerosis; MS = multiple sclerosis; NS = nervous system; PCP = primary care physician; RLS = restless legs syndrome.
Long-distance Travel for Neurologist Care
The median 1-way travel distance to visit a neurologist was 16.6 (interquartile range [IQR]: 7.8–34.6) miles, and travel time was 26 (IQR: 16–45) minutes. Overall, 96,213 patients (17.1%) traveled ≥50 miles 1-way (i.e., long-distance travel) to a neurologist at least once in 2018 (Table 2). For patients with long-distance travel, median 1-way driving distance was 81.3 (IQR: 59.9–144.2) miles and time was 90 (IQR: 69–149) minutes, compared with 13.2 (IQR: 6.5–23) miles and 22 (IQR: 14–33) minutes for patients without long-distance travel. The proportion of patients with long-distance travel ranged from 12.2% to 39.6% across neurologic conditions. The top 3 neurologic conditions for which patients had long-distance travel were nervous system cancers (median 1-way distance and time: 33.7 miles and 44 minutes), ALS (26.1 miles and 36.8 minutes), and MS (21.3 miles and 31 minutes), while the shortest travel distance and time was for dizziness/vertigo (14.5 miles and 24 minutes). Comparing between neurologist subspecialties, the proportion of patients with long-distance travel ranged from 13.7% (5,691/41,409) of patients who visited clinical neurophysiologists to 30.8% (1,192/3,872) of patients who visited neuro-oncologists.
Patients who were younger, American Native, and residing in the West North Central and Mountain census divisions were more likely to travel long distance to visit their neurologist (p < 0.05). As expected, patients who resided in regions with lower availability of neurologists were almost 3 times more likely to have long-distance travel (first quintile [low: 10.13 neurologists per 100,000 Medicare beneficiaries]: 31.8%, second quintile: 22.8%, third quintile: 20.7%, fourth quintile: 16%, and fifth quintile [high: 50.16 neurologists per 100,000 Medicare beneficiaries]: 10.8%). Nearly half (44.7%) of rural patients had long-distance travel for care compared with one-tenth (11.2%) of urban patients.
Of all patients who saw a neurologist, 60.8% bypassed the nearest neurologist of the same subspecialty. Of patients who bypassed the nearest neurologist, 24.5% traveled long distance. Of patients who saw their nearest neurologist, 5.5% traveled long distance. Among patients who traveled long distances for neurologist care, 30.7% also traveled ≥50 miles 1-way to visit their PCPs. Of note, 7.3% of all patients ever crossed state lines for neurologist care and 64.7% of those who crossed state lines had long-distance travel.
Neurologist Visit Type and Travel Pattern
More than one-third (17.6%) of patients visited neurologists as new patients in 2018, 63.1% visited neurologists as established patients, and 19.3% visited neurologists as new and established patients. Nearly half of patients with chronic pain/abnormality of gait, dizziness/vertigo, syncope, and blindness/vision defects visited neurologists as new patients. Most patients (>90%) with epilepsy, MS, Parkinson disease, mood disorders, ALS, or nervous system cancer visited neurologists as established patients. Overall, 18.4% of patients who visited neurologists as new patients had long-distance travel compared with 16.1% of established patients.
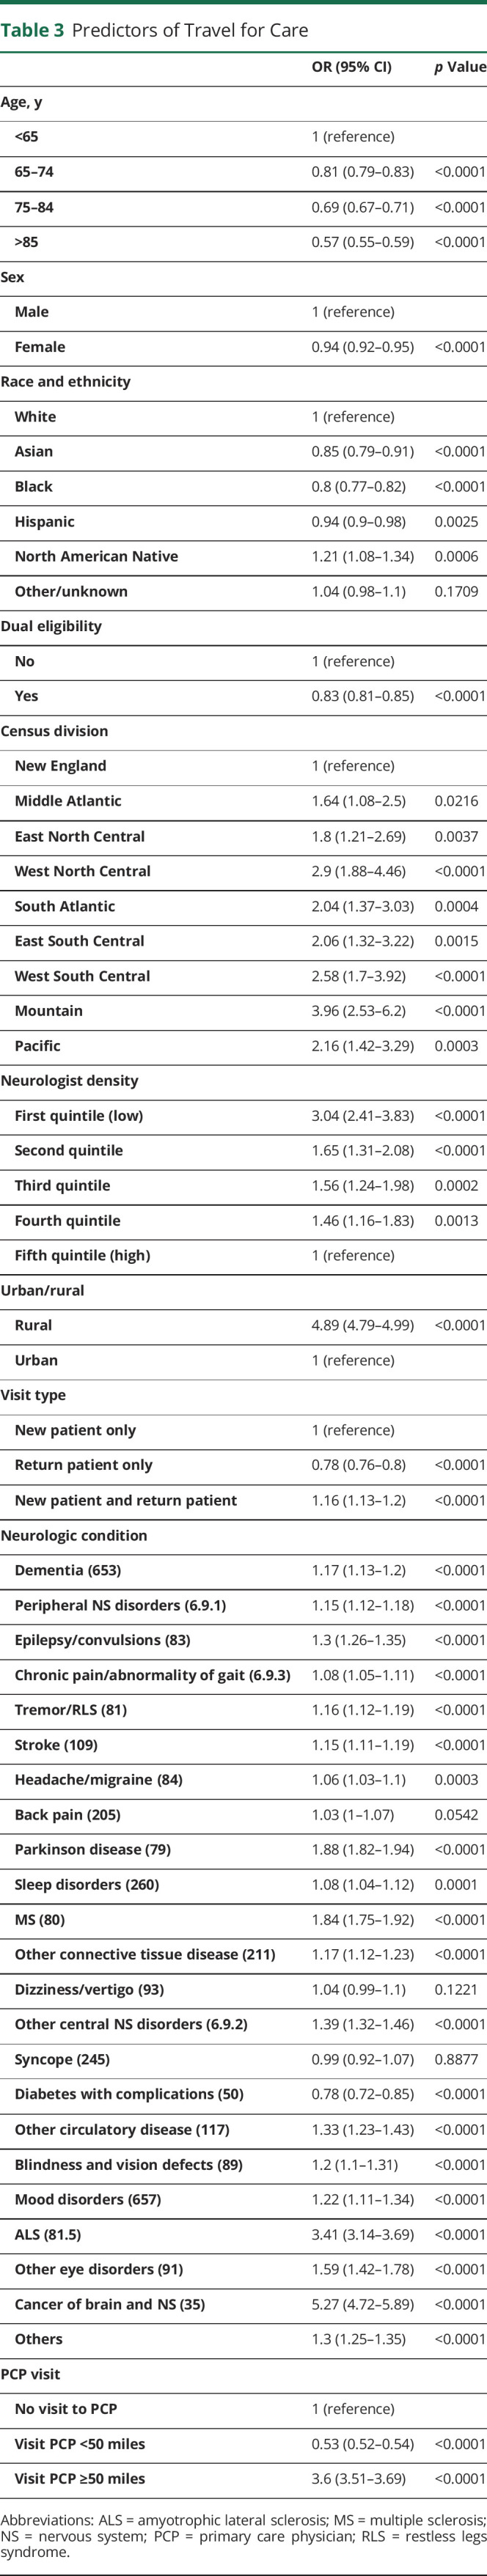
Predictors of Long-distance Travel for Neurologist Visit
Compared with the highest quintile of neurologist density regions, all quintiles of lower neurologist density regions were associated with an increased likelihood of long-distance travel for neurologist care (p < 0.01) (Table 3). As expected, patients who resided in the lowest quintile of neurologist density regions had 3.04 (95% CI 2.41–3.83) greater odds of long-distance travel than those who resided in the highest quintile of neurologist density regions (p < 0.0001). Independent of neurologist density, patients who resided in rural areas were 4.89 (95% CI 4.79–4.99) times more likely to have long-distance travel than those who resided in urban areas (p < 0.0001). When examining the interaction of race and ethnicity and urban/rural location (eTable 1, links.lww.com/WNL/D99), our findings showed that long-distance travel for neurologist care may be exacerbated by rurality for certain minorities. When using a 60-mile threshold for long-distance travel, the result was similar to our primary analysis (eTable 2) and when considering the distance/time outcome as continuous variable (eTable 3).
Table 3.
Predictors of Travel for Care
| OR (95% CI) | p Value | |
| Age, y | ||
| <65 | 1 (reference) | |
| 65–74 | 0.81 (0.79–0.83) | <0.0001 |
| 75–84 | 0.69 (0.67–0.71) | <0.0001 |
| >85 | 0.57 (0.55–0.59) | <0.0001 |
| Sex | ||
| Male | 1 (reference) | |
| Female | 0.94 (0.92–0.95) | <0.0001 |
| Race and ethnicity | ||
| White | 1 (reference) | |
| Asian | 0.85 (0.79–0.91) | <0.0001 |
| Black | 0.8 (0.77–0.82) | <0.0001 |
| Hispanic | 0.94 (0.9–0.98) | 0.0025 |
| North American Native | 1.21 (1.08–1.34) | 0.0006 |
| Other/unknown | 1.04 (0.98–1.1) | 0.1709 |
| Dual eligibility | ||
| No | 1 (reference) | |
| Yes | 0.83 (0.81–0.85) | <0.0001 |
| Census division | ||
| New England | 1 (reference) | |
| Middle Atlantic | 1.64 (1.08–2.5) | 0.0216 |
| East North Central | 1.8 (1.21–2.69) | 0.0037 |
| West North Central | 2.9 (1.88–4.46) | <0.0001 |
| South Atlantic | 2.04 (1.37–3.03) | 0.0004 |
| East South Central | 2.06 (1.32–3.22) | 0.0015 |
| West South Central | 2.58 (1.7–3.92) | <0.0001 |
| Mountain | 3.96 (2.53–6.2) | <0.0001 |
| Pacific | 2.16 (1.42–3.29) | 0.0003 |
| Neurologist density | ||
| First quintile (low) | 3.04 (2.41–3.83) | <0.0001 |
| Second quintile | 1.65 (1.31–2.08) | <0.0001 |
| Third quintile | 1.56 (1.24–1.98) | 0.0002 |
| Fourth quintile | 1.46 (1.16–1.83) | 0.0013 |
| Fifth quintile (high) | 1 (reference) | |
| Urban/rural | ||
| Rural | 4.89 (4.79–4.99) | <0.0001 |
| Urban | 1 (reference) | |
| Visit type | ||
| New patient only | 1 (reference) | |
| Return patient only | 0.78 (0.76–0.8) | <0.0001 |
| New patient and return patient | 1.16 (1.13–1.2) | <0.0001 |
| Neurologic condition | ||
| Dementia (653) | 1.17 (1.13–1.2) | <0.0001 |
| Peripheral NS disorders (6.9.1) | 1.15 (1.12–1.18) | <0.0001 |
| Epilepsy/convulsions (83) | 1.3 (1.26–1.35) | <0.0001 |
| Chronic pain/abnormality of gait (6.9.3) | 1.08 (1.05–1.11) | <0.0001 |
| Tremor/RLS (81) | 1.16 (1.12–1.19) | <0.0001 |
| Stroke (109) | 1.15 (1.11–1.19) | <0.0001 |
| Headache/migraine (84) | 1.06 (1.03–1.1) | 0.0003 |
| Back pain (205) | 1.03 (1–1.07) | 0.0542 |
| Parkinson disease (79) | 1.88 (1.82–1.94) | <0.0001 |
| Sleep disorders (260) | 1.08 (1.04–1.12) | 0.0001 |
| MS (80) | 1.84 (1.75–1.92) | <0.0001 |
| Other connective tissue disease (211) | 1.17 (1.12–1.23) | <0.0001 |
| Dizziness/vertigo (93) | 1.04 (0.99–1.1) | 0.1221 |
| Other central NS disorders (6.9.2) | 1.39 (1.32–1.46) | <0.0001 |
| Syncope (245) | 0.99 (0.92–1.07) | 0.8877 |
| Diabetes with complications (50) | 0.78 (0.72–0.85) | <0.0001 |
| Other circulatory disease (117) | 1.33 (1.23–1.43) | <0.0001 |
| Blindness and vision defects (89) | 1.2 (1.1–1.31) | <0.0001 |
| Mood disorders (657) | 1.22 (1.11–1.34) | <0.0001 |
| ALS (81.5) | 3.41 (3.14–3.69) | <0.0001 |
| Other eye disorders (91) | 1.59 (1.42–1.78) | <0.0001 |
| Cancer of brain and NS (35) | 5.27 (4.72–5.89) | <0.0001 |
| Others | 1.3 (1.25–1.35) | <0.0001 |
| PCP visit | ||
| No visit to PCP | 1 (reference) | |
| Visit PCP <50 miles | 0.53 (0.52–0.54) | <0.0001 |
| Visit PCP ≥50 miles | 3.6 (3.51–3.69) | <0.0001 |
Abbreviations: ALS = amyotrophic lateral sclerosis; MS = multiple sclerosis; NS = nervous system; PCP = primary care physician; RLS = restless legs syndrome.
Other significant predictors of long-distance travel included younger age, male, White or American Native, non–Medicare-Medicaid dual eligible, residing in non-New England census regions (particularly West North Central or Mountain regions), certain neurologic conditions (nervous system cancer, ALS, Parkinson disease, and MS), and travel ≥50 miles 1-way for PCP visits. The ICC for the unconditional model was 0.224, which indicated 22.4% of total variation in the probability of long-distance travel was accounted for by the HRR region. The AUC for prediction of long-distance travel for neurologist care was 0.80 (95% CI 0.80–0.803).
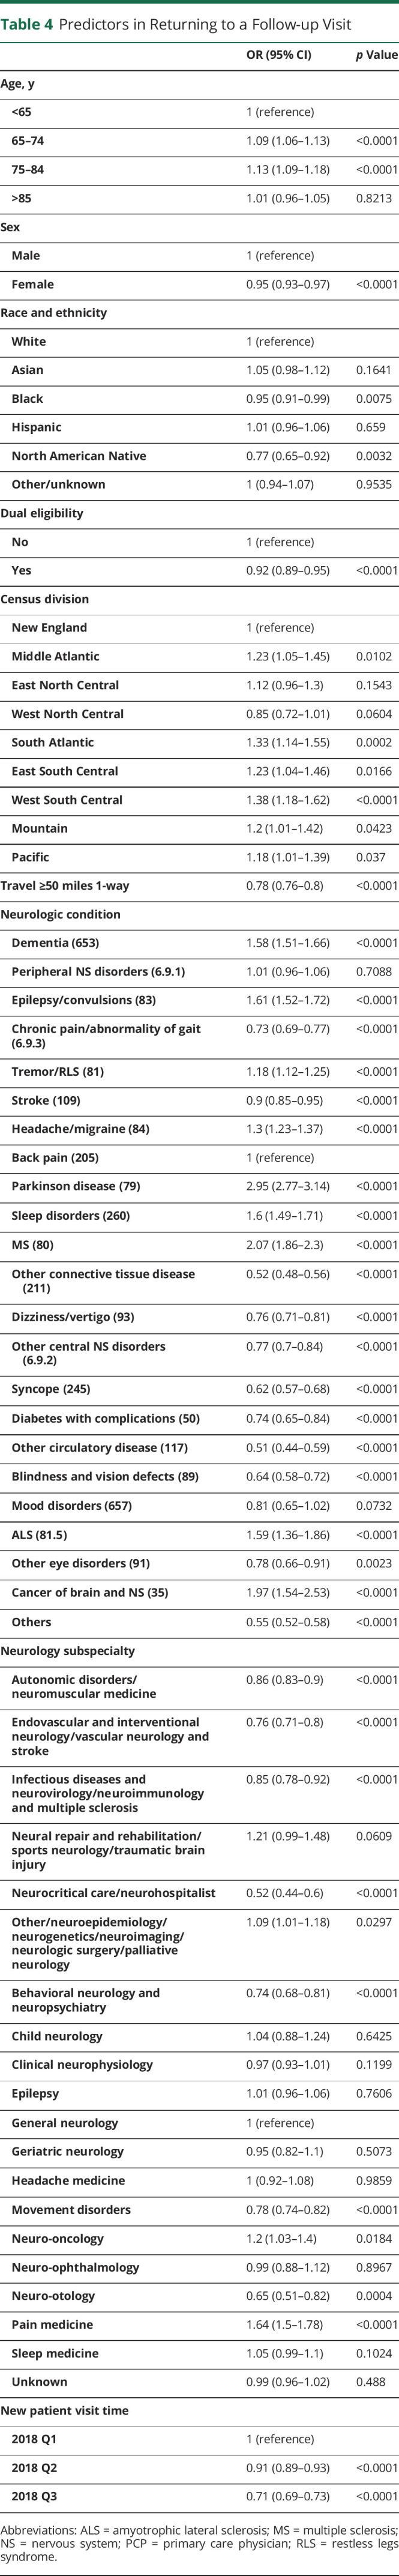
Predictors of Returning for a Follow-up Visit
Among 165,279 new patient neurologist E/M visits during first 3 quarters of 2018, 62,408 (37.8%) had at least 1 follow-up visit with the same neurologist for the same neurologic condition. Long-distance travel was associated with a decreased likelihood of having a follow-up visit (OR 0.78 [95% CI 0.76–0.8], p < 0.0001) (Table 4). Neurologic conditions of dementia, epilepsy, tremor/restless legs syndrome, headache/migraine, Parkinson disease, sleep disorder, MS, ALS, and nervous system cancer were more likely to have a follow-up visit. Compared with general neurology, a new patient visit to subspecialties of pain medicine and neuro-oncology was more likely to have a follow-up visit.
Table 4.
Predictors in Returning to a Follow-up Visit
| OR (95% CI) | p Value | |
| Age, y | ||
| <65 | 1 (reference) | |
| 65–74 | 1.09 (1.06–1.13) | <0.0001 |
| 75–84 | 1.13 (1.09–1.18) | <0.0001 |
| >85 | 1.01 (0.96–1.05) | 0.8213 |
| Sex | ||
| Male | 1 (reference) | |
| Female | 0.95 (0.93–0.97) | <0.0001 |
| Race and ethnicity | ||
| White | 1 (reference) | |
| Asian | 1.05 (0.98–1.12) | 0.1641 |
| Black | 0.95 (0.91–0.99) | 0.0075 |
| Hispanic | 1.01 (0.96–1.06) | 0.659 |
| North American Native | 0.77 (0.65–0.92) | 0.0032 |
| Other/unknown | 1 (0.94–1.07) | 0.9535 |
| Dual eligibility | ||
| No | 1 (reference) | |
| Yes | 0.92 (0.89–0.95) | <0.0001 |
| Census division | ||
| New England | 1 (reference) | |
| Middle Atlantic | 1.23 (1.05–1.45) | 0.0102 |
| East North Central | 1.12 (0.96–1.3) | 0.1543 |
| West North Central | 0.85 (0.72–1.01) | 0.0604 |
| South Atlantic | 1.33 (1.14–1.55) | 0.0002 |
| East South Central | 1.23 (1.04–1.46) | 0.0166 |
| West South Central | 1.38 (1.18–1.62) | <0.0001 |
| Mountain | 1.2 (1.01–1.42) | 0.0423 |
| Pacific | 1.18 (1.01–1.39) | 0.037 |
| Travel ≥50 miles 1-way | 0.78 (0.76–0.8) | <0.0001 |
| Neurologic condition | ||
| Dementia (653) | 1.58 (1.51–1.66) | <0.0001 |
| Peripheral NS disorders (6.9.1) | 1.01 (0.96–1.06) | 0.7088 |
| Epilepsy/convulsions (83) | 1.61 (1.52–1.72) | <0.0001 |
| Chronic pain/abnormality of gait (6.9.3) | 0.73 (0.69–0.77) | <0.0001 |
| Tremor/RLS (81) | 1.18 (1.12–1.25) | <0.0001 |
| Stroke (109) | 0.9 (0.85–0.95) | <0.0001 |
| Headache/migraine (84) | 1.3 (1.23–1.37) | <0.0001 |
| Back pain (205) | 1 (reference) | |
| Parkinson disease (79) | 2.95 (2.77–3.14) | <0.0001 |
| Sleep disorders (260) | 1.6 (1.49–1.71) | <0.0001 |
| MS (80) | 2.07 (1.86–2.3) | <0.0001 |
| Other connective tissue disease (211) | 0.52 (0.48–0.56) | <0.0001 |
| Dizziness/vertigo (93) | 0.76 (0.71–0.81) | <0.0001 |
| Other central NS disorders (6.9.2) | 0.77 (0.7–0.84) | <0.0001 |
| Syncope (245) | 0.62 (0.57–0.68) | <0.0001 |
| Diabetes with complications (50) | 0.74 (0.65–0.84) | <0.0001 |
| Other circulatory disease (117) | 0.51 (0.44–0.59) | <0.0001 |
| Blindness and vision defects (89) | 0.64 (0.58–0.72) | <0.0001 |
| Mood disorders (657) | 0.81 (0.65–1.02) | 0.0732 |
| ALS (81.5) | 1.59 (1.36–1.86) | <0.0001 |
| Other eye disorders (91) | 0.78 (0.66–0.91) | 0.0023 |
| Cancer of brain and NS (35) | 1.97 (1.54–2.53) | <0.0001 |
| Others | 0.55 (0.52–0.58) | <0.0001 |
| Neurology subspecialty | ||
| Autonomic disorders/neuromuscular medicine | 0.86 (0.83–0.9) | <0.0001 |
| Endovascular and interventional neurology/vascular neurology and stroke | 0.76 (0.71–0.8) | <0.0001 |
| Infectious diseases and neurovirology/neuroimmunology and multiple sclerosis | 0.85 (0.78–0.92) | <0.0001 |
| Neural repair and rehabilitation/sports neurology/traumatic brain injury | 1.21 (0.99–1.48) | 0.0609 |
| Neurocritical care/neurohospitalist | 0.52 (0.44–0.6) | <0.0001 |
| Other/neuroepidemiology/neurogenetics/neuroimaging/neurologic surgery/palliative neurology | 1.09 (1.01–1.18) | 0.0297 |
| Behavioral neurology and neuropsychiatry | 0.74 (0.68–0.81) | <0.0001 |
| Child neurology | 1.04 (0.88–1.24) | 0.6425 |
| Clinical neurophysiology | 0.97 (0.93–1.01) | 0.1199 |
| Epilepsy | 1.01 (0.96–1.06) | 0.7606 |
| General neurology | 1 (reference) | |
| Geriatric neurology | 0.95 (0.82–1.1) | 0.5073 |
| Headache medicine | 1 (0.92–1.08) | 0.9859 |
| Movement disorders | 0.78 (0.74–0.82) | <0.0001 |
| Neuro-oncology | 1.2 (1.03–1.4) | 0.0184 |
| Neuro-ophthalmology | 0.99 (0.88–1.12) | 0.8967 |
| Neuro-otology | 0.65 (0.51–0.82) | 0.0004 |
| Pain medicine | 1.64 (1.5–1.78) | <0.0001 |
| Sleep medicine | 1.05 (0.99–1.1) | 0.1024 |
| Unknown | 0.99 (0.96–1.02) | 0.488 |
| New patient visit time | ||
| 2018 Q1 | 1 (reference) | |
| 2018 Q2 | 0.91 (0.89–0.93) | <0.0001 |
| 2018 Q3 | 0.71 (0.69–0.73) | <0.0001 |
Abbreviations: ALS = amyotrophic lateral sclerosis; MS = multiple sclerosis; NS = nervous system; PCP = primary care physician; RLS = restless legs syndrome.
Discussion
This cross-sectional study found almost one-fifth (17.1%) of Medicare beneficiaries traveled ≥50 miles 1-way to neurologist visit in 2018, indicating that substantial travel burden exists for some neurologic patients. Travel burden was particularly common for patients with nervous system cancer (39.6% with long-distance travel) and those with ALS (32.1%). Patients residing in areas with fewer neurologists were more likely to travel long distances for neurologist care. Finally, long distance was associated with a decreased likelihood of returning for a follow-up neurologist visit.
Using 1998 Medicare claims in 5 states, Chan et al. reported that the median 1-way travel distance and time to medical visits were 7.7 miles and 11.7 minutes, respectively.11 In our study, using 2018 Medicare claims in 48 continental states, we found a bit higher median 1-way driving distance of 16.6 miles and travel time of 26 minutes to neurologist visits. Our results are similar to another study that found a mean travel time of 38 minutes for any specialty ambulatory care.12 In addition, we found travel burden varied across diseases. In our study, the top 3 neurologic conditions for which patients experienced long-distance travel were nervous system cancers, ALS, and MS. This is unsurprising because cancer, ALS, and MS are often cared for by neurology subspecialists, of which there are fewer than general neurologists. Patients with ALS usually need to visit multiple health care providers for symptom management, and a coordinated multidisciplinary clinic for ALS is recommended. MS is often treated with infusions, and thus, patients must travel to treatment-capable facilities; however, the travel burden found in this study did not include visits to infusion centers for disease-modifying therapies. Neuro-oncologic treatment also often requires coordinated expert care. Prior studies have shown similarly that cancer patients have disproportionately higher travel burden.6,7,13
Travel burden was significantly higher for patients residing in regions with lower availability of physicians or specialists due to low physician density or rural location. Ward et al. reported that patients with cancer in Iowa who resided in areas with no oncologists had median driving times for treatment over twice as long as those who resided in areas with a local oncologist (58 minutes vs 21 minutes).14 In our study, compared with patients residing in regions with the highest quintile neurologist density, patients residing in regions with the lowest neurologist density traveled twice the distance (median 1-way distance: 26.7 vs 13.4 miles) and traveled for 56% more time (median 1-way time: 36 vs 23 minutes) for neurologist care. Similarly, rural patients traveled 4 times more than urban patients. While we have previously demonstrated that the regional density of neurologists does not substantially affect whether most patients with neurologic disease are seen by neurologists,1 density does affect travel burden. Fewer neurologists leads to higher travel burden and potentially to downstream consequences of decreased access to care and poorer outcomes as demonstrated for other conditions. In our study, those with long-distance travel were 26% less likely to return for a follow-up visit compared with those without long-distance travel. This is in line with several past studies that reported that patients who traveled long distances for non-neurologic conditions were likely to have fewer follow-up visits or worse follow-up adherence than those with shorter distances.15-17 While travel burden may reduce follow-up visits, future studies are needed to define the specific impact of higher travel burden on neurologic outcomes and potential ways to mitigate any adverse outcomes.
With the acknowledgements that not all patients with neurologic diagnoses require neurologist care and not all regions have enough patients or resources to support specialty practices, establishing a neurology referral/consultation network to cover rural community practices may be another way to help improve access to neurology subspecialists for patients with need of subspecialty neurologic care. Traditionally, such a model has been used for acute stroke care, where physicians in specialized stroke centers provide telemedicine assessment to help emergency department physicians at spoke sites determine whether a stroke patient is a candidate for tissue plasminogen activator or endovascular therapy. This approach enables broader coverage of specialized stroke care through the hub-and-spoke network model, reduces patient travel distance,18 improves the use of acute stroke care treatment,19 and reduces in-hospital mortality.20 With expansion of such practice to ambulatory care by establishing a specialist referral network or remote care network, support could be provided to rural or underserved areas through physician-to-physician consultation.21 Consultation could be provided by e-consults, remote second opinions, and phone calls. Georgia Memory Net exemplifies this because it is a statewide multihub model that promotes both education and access to local multidisciplinary services for dementia care.22 Project ECHO collaboratives are another example of how expert consultation can improve rural health care through a virtual community encouraging professionals and practitioners to discuss real cases, network, and share/support best practices.
Other strategies could also be applied to improve travel burden for patients. First, telemedicine has arisen as a promising solution to circumvent travel concerns by allowing patients to be evaluated through video or phone appointment from home. Our data reflect the pre–COVID-19 era when telemedicine was not pervasive. During the COVID-19 pandemic, the Public Health Emergency waivers relaxed requirements and expanded coverage. Based on the report of the US Department of Health and Human Services,23 the number of specialty telemedicine visits increased from 122,400 in 2019 to 16.6 million in 2020 (0.02% of all visits in 2019 to 3% in 2020). Many patients used telemedicine to access health care services for the first time and were satisfied with the convenience.24 Benefits may also extend to neurologists, clinics, and hospitals by allowing physicians to care for patients in remote clinics without traveling between facilities,25 decreasing patient no-show rate,26 and alleviating demand for examination rooms. If the travel distance cannot be eliminated, a system that supports patient travel may improve access to care and discourage patients from forgoing care due to travel inconveniences. One example is the nonemergency medical transport to medical appointments that is available to Medicaid beneficiaries.
Certain patient characteristics have previously been associated with differences in traveling for care. In our study, Black patients traveled shorter distances than White patients to visit neurologists (median [IQR] distance: Black 12.9 [6.2–25.8] miles 1-way vs White 17.5 [8.3–36.5] miles 1-way). Such findings were consistent across other specialties (e.g., cardiology, pulmonary, gastroenterology, and orthopedics).27 It is possible that Black patients are more likely to reside in urban settings that have shorter distances to neurologist care. However, our findings showed that Black patients traveled a shorter distance than White patients in both urban and rural areas (median 1-way distance in urban areas: Black 12.2 miles vs White 15.7 miles; in rural areas: 40.3 miles vs 44.3 miles). American Natives were found to travel the furthest distance to visit neurologists, which may be explained by nearly half (46%) of this group residing in rural areas compared with 18% of all other races and ethnicities. In addition, our data included only a small proportion of American Natives (0.4% in Medicare claims vs 1.5% in US population) and might not represent the full picture of how American Natives access neurologists considering the availability of alternative health care coverage programs. In our dataset, we were unable to measure indicators of socioeconomic status or additional social determinants of health, which may clarify why our data demonstrated differences in traveling for care by race and ethnicity.
It may be that travel is necessitated due to long wait times, poor availability of clinic visits, reliance on clinics readily reached by public transportation, or other factors that do not reflect patient choice but rather patient vulnerability in a complex health care system. Prior studies have suggested approximately one-fifth of patients still preferred to seek care locally,28 and most patients (85%) reported that they may encounter some travel barriers (e.g., inconvenience of 2-hour trip and cost of traveling).29
However, some patients may be amenable to traveling longer distances as a matter of preference for a particular physician. Through a patient survey, a previous study29 reported that the most influential factors for patients when making decisions about where to seek care were associated with the physician (e.g., confidence in physician, doctor recommendation, and doctor reputation). Half of patients were willing to travel >1 hour and nearly one-third (28.8%) were willing to travel >2 hours to receive complex surgery at a high-volume center with better outcomes. In our study, only 39.2% patients visited the neurologists nearest to their residence. Nearly one-third (29.4%) of patients in our cohort bypassed the nearest neurologists and traveled an additional 20+ miles 1-way for neurologist care. However, bypassing the nearest neurologist may also include patients who need to travel farther to reach providers with shorter wait times.30
This study has several limitations. Our study used the most current self-reported subspecialty information through the AAN membership dataset, the AMA Physician Masterfiles, and the NPI dataset; however, still approximately 20% of neurologists identified through Medicare claims were without any subspecialty information. We cannot determine full-time clinical equivalents, which likely resulted in overestimation of the current distribution of neurologists by subspecialty, because our analysis assumed each neurologist was 1 full-time clinical equivalent. Without physician network or practice group information, we cannot determine how neurologists were situated in networks with various physical clinics. In addition, our study was only able to measure travel burden among those who completed neurologist visits; we are unable to fully measure the magnitude of the problem because we cannot quantify patients who were referred and were unable to complete neurologist visits. There are additional aspects of travel burden that were not explored in this study such as travel cost. Our study was limited to Medicare beneficiaries. Thus, our results cannot be extrapolated to other patient populations such as privately insured patients with a variety of coverage for in-network and out-of-network providers depending on their health plans; in addition, for Medicaid recipients, neurology bypass may be more prominent because some practices do not accept Medicaid. Due to lack of data regarding patient preference in selecting providers, our findings could not explain the reason for bypassing the nearest neurologist. It would be interesting in future studies to see how patient travel was affected by the emergence of readily available telemedicine during the COVID pandemic. Last, it is important to acknowledge that not every patient with a neurologic diagnosis requires neurologist care, and future work to better understand which patients require neurologist care is needed.
In summary, approximately one-fifth of patients with a neurologist outpatient visit travel long distances to complete the visit. Neurologic patients with nervous system cancer, ALS, and MS most often have long-distance travel. There is a growing push by patient advocates and clinicians to address patient travel distance as a barrier to care. Our results suggest that policymakers should investigate feasible and affordable ways to improve necessary access to neurologic care, especially in areas with low availability of neurologists and in rural communities. More research is needed to understand which patients actually need to travel for this care and to determine whether there is any difference in patient outcomes among those who traveled for care vs those who were treated closer to home.
Acknowledgment
The study was proposed and executed by the American Academy of Neurology Health Services Research Subcommittee.
Glossary
- ALS
amyotrophic lateral sclerosis
- AUC
area under the curve
- E/M
evaluation and management
- HRR
hospital referral region
- ICC
intraclass correlation coefficient
- IQR
interquartile range
- MBSF
Master Beneficiary Summary File
- MS
multiple sclerosis
- NPPES
National Plan and Provider Enumeration System
- PCP
primary care provider
- RUCA
Rural-Urban Commuting Area
Appendix. Authors
| Name | Location | Contribution |
| Chun Chieh Lin, PhD, MBA | Department of Neurology, University of Michigan, Ann Arbor; Department of Neurology, the Ohio State University, Columbus | Drafting/revision of the article for content, including medical writing for content; major role in the acquisition of data; study concept or design; and analysis or interpretation of data |
| Chloe E. Hill, MD, MS | Department of Neurology, University of Michigan, Ann Arbor | Drafting/revision of the article for content, including medical writing for content; study concept or design; and analysis or interpretation of data |
| Kevin A. Kerber, MD, MS | Department of Neurology, the Ohio State University, Columbus | Drafting/revision of the article for content, including medical writing for content; study concept or design; and analysis or interpretation of data |
| James F. Burke, MD, MS | Department of Neurology, the Ohio State University, Columbus | Drafting/revision of the article for content, including medical writing for content; study concept or design; and analysis or interpretation of data |
| Lesli E. Skolarus, MD, MS | Department of Neurology, Northwestern University, Chicago, IL | Drafting/revision of the article for content, including medical writing for content; analysis or interpretation of data |
| Gregory J. Esper, MD, MBA | Department of Neurology, Emory University, Atlanta, GA | Drafting/revision of the article for content, including medical writing for content |
| Adam de Havenon, MD | Department of Neurology, Yale University, New Haven, CT | Drafting/revision of the article for content, including medical writing for content |
| Lindsey B. De Lott, MD | Department of Neurology, University of Michigan, Ann Arbor | Drafting/revision of the article for content, including medical writing for content |
| Brian C. Callaghan, MD, MS | Department of Neurology, University of Michigan, Ann Arbor | Drafting/revision of the article for content, including medical writing for content; study concept or design; and analysis or interpretation of data |
Footnotes
CME Course: NPub.org/cmelist
Study Funding
The study was funded by the American Academy of Neurology.
Disclosure
C. Lin, C.E. Hill, K.A. Kerber, J.F. Burke, and L.E. Skolarus report no disclosures relevant to the manuscript; G.J. Esper performs medical legal consultations serves as a consultant for NeuroOne, Incorporated, an EEG device company, and is a member of the Board of Directors of AAN and AANI; A. de Havenon has received research funding from the NIH/NINDS and the AAN, has received consultant fees from Integra and Novo Nordisk, has received royalty fees from UpToDate, and has equity in TitinKM and Certus; L. De Lott reports no disclosures relevant to the manuscript; B.C. Callaghan consults for DynaMed, receives research support from the American Academy of Neurology, and performs medical legal consultations including consultations for the Vaccine Injury Compensation Program. Go to Neurology.org/N for full disclosures.
References
- 1.Lin CC, Callaghan BC, Burke JF, et al. Geographic variation in neurologist density and neurologic care in the United States. Neurology. 2021;96(3):e309-e321. doi: 10.1212/wnl.0000000000011276 [DOI] [PMC free article] [PubMed] [Google Scholar]
- 2.Raman V, Adam MA, Turner MC, Moore HG, Mantyh CR, Migaly J. Disparity of colon cancer outcomes in rural America: making the case to travel the extra mile. J Gastrointest Surg. 2019;23(11):2285-2293. doi: 10.1007/s11605-019-04270-5 [DOI] [PubMed] [Google Scholar]
- 3.Ambroggi M, Biasini C, Del Giovane C, Fornari F, Cavanna L. Distance as a barrier to cancer diagnosis and treatment: review of the literature. Oncologist. 2015;20(12):1378-1385. doi: 10.1634/theoncologist.2015-0110 [DOI] [PMC free article] [PubMed] [Google Scholar]
- 4.Massarweh NN, Chiang YJ, Xing Y, et al. Association between travel distance and metastatic disease at diagnosis among patients with colon cancer. J Clin Oncol. 2014;32(9):942-948. doi: 10.1200/jco.2013.52.3845 [DOI] [PMC free article] [PubMed] [Google Scholar]
- 5.Scoggins JF, Fedorenko CR, Donahue SM, Buchwald D, Blough DK, Ramsey SD. Is distance to provider a barrier to care for medicaid patients with breast, colorectal, or lung cancer? J Rural Health. 2012;28(1):54-62. doi: 10.1111/j.1748-0361.2011.00371.x [DOI] [PMC free article] [PubMed] [Google Scholar]
- 6.Lin CC, Bruinooge SS, Kirkwood MK, et al. Association between geographic access to cancer care and receipt of radiation therapy for rectal cancer. Int J Radiat Oncol Biol Phys. 2016;94(4):719-728. doi: 10.1016/j.ijrobp.2015.12.012 [DOI] [PMC free article] [PubMed] [Google Scholar]
- 7.Lin CC, Bruinooge SS, Kirkwood MK, et al. Association between geographic access to cancer care, insurance, and receipt of chemotherapy: geographic distribution of oncologists and travel distance. J Clin Oncol. 2015;33(28):3177-3185. doi: 10.1200/jco.2015.61.1558 [DOI] [PMC free article] [PubMed] [Google Scholar]
- 8.Moon S, Ranchet M, Akinwuntan AE, et al. The impact of advanced age on driving safety in adults with medical conditions. Gerontology. 2018;64(3):291-299. doi: 10.1159/000486511 [DOI] [PubMed] [Google Scholar]
- 9.Moon S, Ranchet M, Tant M, Akinwuntan AE, Devos H. Comparison of unsafe driving across medical conditions. Mayo Clin Proc. 2017;92(9):1341-1350. doi: 10.1016/j.mayocp.2017.06.003 [DOI] [PubMed] [Google Scholar]
- 10.Center for Consumer Information and Insurance Oversight. 2023 Letter to Issuers in the Federally-Facilitiated Exchanges; 2022. Accessed February 18, 2023. https://www.cms.gov/cciio/resources/regulations-and-guidance/downloads/final-2023-letter-to-issuers.pdf. [Google Scholar]
- 11.Chan L, Hart LG, Goodman DC. Geographic access to health care for rural Medicare beneficiaries. J Rural Health. 2006;22(2):140-146. doi: 10.1111/j.1748-0361.2006.00022.x [DOI] [PubMed] [Google Scholar]
- 12.Ray KN, Chari AV, Engberg J, Bertolet M, Mehrotra A. Disparities in time spent seeking medical care in the United States. JAMA Intern Med. 2015;175(12):1983-1986. doi: 10.1001/jamainternmed.2015.4468 [DOI] [PMC free article] [PubMed] [Google Scholar]
- 13.Graboyes EM, Ellis MA, Li H, et al. Racial and ethnic disparities in travel for head and neck cancer treatment and the impact of travel distance on survival. Cancer. 2018;124(15):3181-3191. doi: 10.1002/cncr.31571 [DOI] [PMC free article] [PubMed] [Google Scholar]
- 14.Ward MM, Ullrich F, Matthews K, et al. Access to chemotherapy services by availability of local and visiting oncologists. J Oncol Pract. 2014;10(1):26-31. doi: 10.1200/jop.2013.001217 [DOI] [PMC free article] [PubMed] [Google Scholar]
- 15.Monfared S, Martin A, Selzer D, Butler A. Travel distance reduces follow-up compliance but has no effect on long-term weight loss success in bariatric patients. Surg Endosc. 2021;35(4):1579-1583. doi: 10.1007/s00464-020-07535-2 [DOI] [PubMed] [Google Scholar]
- 16.Lara MD, Baker MT, Larson CJ, Mathiason MA, Lambert PJ, Kothari SN. Travel distance, age, and sex as factors in follow-up visit compliance in the post-gastric bypass population. Surg Obes Relat Dis. 2005;1:17-21. doi: 10.1016/j.soard.2004.11.001 [DOI] [PubMed] [Google Scholar]
- 17.Funk IT, Strelow BA, Klifto MR, et al. The relationship of travel distance to postoperative follow-up care on glaucoma surgery outcomes. J Glaucoma. 2020;29(11):1056-1064. doi: 10.1097/ijg.0000000000001609 [DOI] [PMC free article] [PubMed] [Google Scholar]
- 18.Schoenfelder J, Zarrin M, Griesbaum R, Berlis A. Stroke care networks and the impact on quality of care. Health Care Manag Sci. 2022;25(1):24-41. doi: 10.1007/s10729-021-09582-0 [DOI] [PMC free article] [PubMed] [Google Scholar]
- 19.Moreno A, Schwamm LH, Siddiqui KA, et al. Frequent hub-spoke contact is associated with improved spoke hospital performance: results from the Massachusetts General Hospital Telestroke Network. Telemed J E Health. 2018;24(9):678-683. doi: 10.1089/tmj.2017.0252 [DOI] [PMC free article] [PubMed] [Google Scholar]
- 20.Witrick B, Zhang D, Switzer JA, Hess DC, Shi L. The association between stroke mortality and time of admission and participation in a telestroke network. J Stroke Cerebrovasc Dis. 2020;29(2):104480. doi: 10.1016/j.jstrokecerebrovasdis.2019.104480 [DOI] [PMC free article] [PubMed] [Google Scholar]
- 21.de Havenon A, Sultan-Qurraie A, Hannon P, Tirschwell D. Development of regional stroke programs. Curr Neurol Neurosci Rep. 2015;15(5):544. doi: 10.1007/s11910-015-0544-2 [DOI] [PubMed] [Google Scholar]
- 22.Bender AA, McIntosh RL, Sudduth S, et al. The Georgia Memory Net: implementation of a statewide program to diagnose and treat Alzheimer's disease and related dementias. J Am Geriatr Soc. 2022;70(4):1257-1267. doi: 10.1111/jgs.17690 [DOI] [PMC free article] [PubMed] [Google Scholar]
- 23.Samson LW, Tarazi W, Turrini G, Sheingold S. Medicare Beneficiaries' Use of Telehealth in 2020: Trends by Beneficiary Characteristics and Location; 2021. Office of the Assistant Secretary for Planning and Evaluation. Accessed February 18, 2023. https://aspe.hhs.gov/reports/medicare-beneficiaries-use-telehealth-2020. [Google Scholar]
- 24.Nanda M, Sharma R. A review of patient satisfaction and experience with telemedicine: a virtual solution during and beyond COVID-19 pandemic. Telemed J E Health. 2021;27(12):1325-1331. doi: 10.1089/tmj.2020.0570 [DOI] [PubMed] [Google Scholar]
- 25.Hatcher-Martin JM, Adams JL, Anderson ER, et al. Telemedicine in neurology: telemedicine work group of the American Academy of Neurology update. Neurology. 2020;94(1):30-38. doi: 10.1212/wnl.0000000000008708 [DOI] [PubMed] [Google Scholar]
- 26.Priya L, Carey P, Shafi F. Conversion of no-show patients to telehealth in a primary medicine clinic. Mo Med. 2022;119(1):74-78. [PMC free article] [PubMed] [Google Scholar]
- 27.Landon BE, Onnela J-P, Meneades L, O'Malley AJ, Keating NL. Assessment of racial disparities in primary care physician specialty referrals. JAMA Netw Open. 2021;4(1):e2029238. doi: 10.1001/jamanetworkopen.2020.29238 [DOI] [PMC free article] [PubMed] [Google Scholar]
- 28.Finlayson EV, Birkmeyer JD. Effects of hospital volume on life expectancy after selected cancer operations in older adults: a decision analysis. J Am Coll Surgeons. 2003;196(3):410-417. doi: 10.1016/s1072-7515(02)01753-2 [DOI] [PubMed] [Google Scholar]
- 29.Chou J, Somnay V, Woodwyk A, Munene G. The volume-outcome relationship and traveling for hepatobiliary and pancreatic surgery: a quantitative analysis of patient perspectives. Cureus. 2020;12(10):e11023. doi: 10.7759/cureus.11023 [DOI] [PMC free article] [PubMed] [Google Scholar]
- 30.Sivey P. The effect of waiting time and distance on hospital choice for English cataract patients. Health Econ. 2012;21(4):444-456. doi: 10.1002/hec.1720 [DOI] [PubMed] [Google Scholar]
Associated Data
This section collects any data citations, data availability statements, or supplementary materials included in this article.
Data Availability Statement
The full dataset, 20% Medicare claim files, is available through CMS (cms.gov).