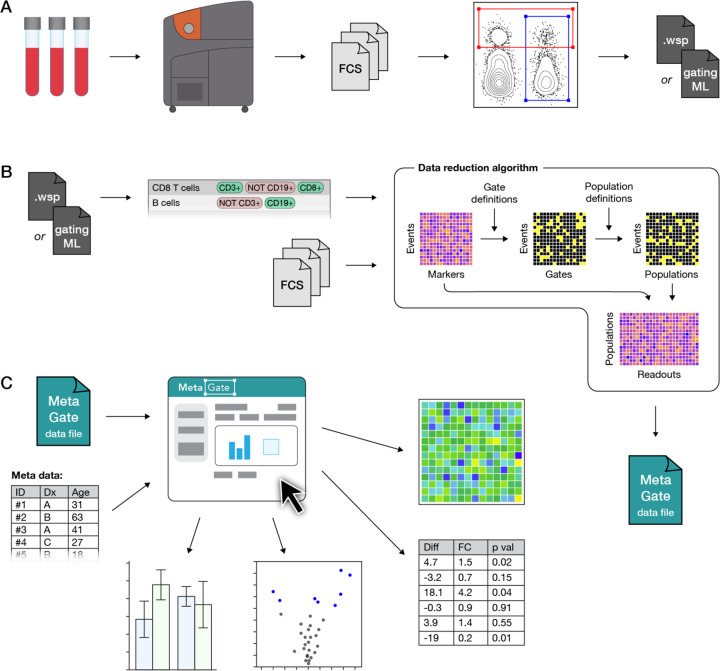
Figure 1. MetaGate data analysis workflow.
(A) A biological sample, such as patient blood, is analyzed using a mass or flow cytometer, which produces FCS data files. Manual gating is performed in FlowJo or Cytobank, creating a data file with specifications of each gate.
(B) Gate data and FCS files are imported into MetaGate, where a graphical user interface allows defining populations based on combinations of gates. Through a data reduction algorithm, a MetaGate data file is created, which contains marker expression and event frequencies of combinations of populations.
(C) The self-containing MetaGate data file is opened in the MetaGate graphical user interface for interactive production of statistics and plots, such as heatmaps, volcano plots and bar plots.

