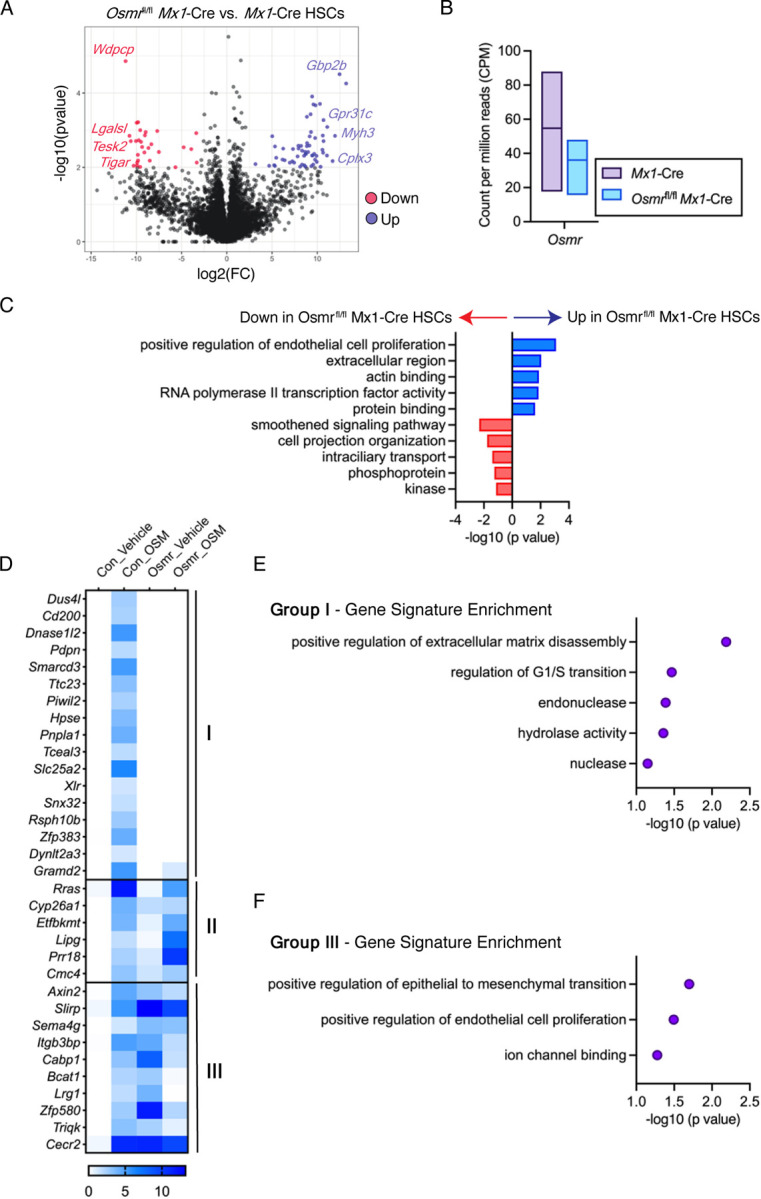
Figure 3. Differential Expression Analysis in Osmrfl/fl Mx1-Cre HSCs.

(A) Volcano plot showing differential gene expression of analysis of Osmrfl/fl Mx1-Cre vs. control Mx1-Cre HSCs (n = 3–6 biological replicates). Select significantly differentially expressed genes (p < 0.01, log2(FC) > 3 or < −3) are shown in red (down) or blue (up) font. (B) Count per million reads of Osmr transcript in control Mx1-Cre and Osmrfl/fl Mx1-Cre HSCs. Bars show low to high values with a line at the mean. (C) Gene signature enrichment within differentially expressed genes between Osmrfl/fl Mx1-Cre and control Mx1-Cre HSCs. (D) Heatmap of 37 genes induced by 60min OSM stimulation in control Mx1-Cre HSCs. Three patterns were observed: Group (I) genes were no longer induced by OSM in Osmrfl/fl Mx1-Cre HSCs, group (II) genes induced by OSM in both control Mx1-Cre and Osmrfl/fl Mx1-Cre HSCs, and group (III) genes induced by OSM in control Mx1-Cre HSCs but repressed by OSM in Osmrfl/fl Mx1-Cre HSCs. (E) Gene signature enrichment within group (I) genes. (F) Gene signature enrichment within group (III) genes.
