

SUMMARY
Liraglutide and other agonists of the glucagon-like peptide 1 receptor (GLP-1RAs) are effective weight loss drugs, but how they suppress appetite remains unclear. GLP-1RAs inhibit hunger-promoting Agouti-related peptide (AgRP) neurons of the arcuate hypothalamus (Arc) but only indirectly, implicating synaptic afferents to AgRP neurons. To investigate, we developed a method combining rabies-based connectomics with single-nuclei transcriptomics. Applying this method to AgRP neurons in mice predicts 21 afferent subtypes in the mediobasal and paraventricular hypothalamus. Among these are Trh+ Arc neurons (TrhArc), which express the Glp1r gene and are activated by the GLP-1RA liraglutide. Activating TrhArc neurons inhibits AgRP neurons and decreases feeding in an AgRP neuron-dependent manner. Silencing TrhArc neurons increases feeding and body weight and reduces liraglutide’s satiating effects. Our results thus demonstrate a widely applicable method for molecular connectomics, reveal the molecular organization of AgRP neuron afferents, and shed light on a neurocircuit through which GLP-1RAs suppress appetite.
Keywords: Agouti-related peptide, Energy balance, Energy homeostasis, Rabies, Melanocortin, Leptin, Single-cell RNA-seq, Single-cell genomics, Victoza, Saxenda
INTRODUCTION
Liraglutide, a clinically-approved agonist of the glucagon-like peptide 1 receptor (GLP-1RA), potently suppresses appetite through its action on unidentified neurons 1–4. GLP-1Rs are abundantly expressed by vagal sensory neurons in the periphery, the dorsal vagal complex of the medulla, and the arcuate nucleus of the hypothalamus (Arc) 5,6. However, GLP-1Rs on vagal sensory neurons and Phox2b-expressing neurons of the dorsal vagal complex are not required for liraglutide to suppress appetite 1,2 (but see also reference 7). On the other hand, antagonizing GLP-1Rs in the Arc blocks the appetite-suppressing effects of liraglutide 2. Fluorescently labeled liraglutide binds to Arc neurons after systemic administration 2, likely due to its transport by tanycytes 8, specialized ependymal cells along the third ventricle which transfer signaling proteins from blood vessels to cerebrospinal fluid. Thus, liraglutide can directly act on Arc neurons to suppress appetite.
Agouti-related peptide (AgRP) neurons are a conserved, molecularly distinct neuronal population that play a critical role in energy balance 3,9,10. Activating AgRP neurons rapidly and robustly drives feeding behavior 11–13. While acute liraglutide injection fails to alter in vivo AgRP neuronal activity over the course of minutes 14, 24 hour pre-treatment strongly blunts the response of AgRP neurons to food 15. Furthermore, liraglutide can indirectly inhibit hunger-promoting AgRP neurons 2,9,15,16, providing a potential anorectic mechanism behind this medication. Electrophysiological recordings demonstrated that liraglutide hyperpolarizes and reduces the firing of AgRP cells by increasing inhibitory tone 2,15. Other studies have identified a local GABAergic input to AgRP neurons 17, though the neurons providing this input, and whether they express GLP-1R, remain unknown. Here, by combining rabies-based connectomics with single-cell transcriptomics, we identified a liraglutide-activated subtype of Arc neuron that inhibits AgRP neurons to suppress hunger. Moreover, we found that the activity of these neurons contributes to both the appetite-suppressing effects of liraglutide and the regulation of body weight and food intake.
RESULTS
RAMPANT Identifies Transcriptionally Distinct Afferents to AgRP Neurons
To identify which neurons synapse on AgRP neurons, we developed a method for molecular connectomics, RAMPANT (Rabies Afferent Mapping by Poly-A Nuclear Transcriptomics), and applied it to AgRP neurons. We targeted rabies infection to AgRP neurons and their presynaptic partners by injecting a “helper” adeno-associated virus (AAV) that Cre-dependently expresses the avian TVA (tumor virus A) receptor and an optimized rabies glycoprotein (oG) into the Arc of Agrp-Cre mice (n = 41 mice, Fig. 1A). The TVA receptor permits cell entry of Envelope A (EnvA)-pseudotyped viruses such as [EnvA]-rabies 18, while the rabies glycoprotein is necessary for the virus to spread trans-synaptically 19,20. We later injected the Arc of the same mice with an EnvA-pseudotyped, glycoprotein-deficient rabies virus expressing a nuclear-localized fluorescent protein, H2b-mCherry, [EnvA]rabies-H2b-mCherry (Fig. 1A). Importantly, injecting the same series of helper AAV and rabies viruses into the hypothalamus of wildtype C57BL6j mice failed to label any cells with either GFP or H2b-mCherry, validating the specificity of these viruses (Fig. S1; n=5 mice).
Figure 1 -. RAMPANT Identifies Transcriptionally Distinct Afferents To AgRP Neurons.

a, Schematic of RAMPANT method. b, UMAP (uniform manifold approximation and projection) plot of 4,428 rabies+ cell nuclei from the arcuate hypothalamus, clustered by expression of high-variance genes and colored according to cluster identity. c, (left) Dendrogram illustrating relatedness of 17 cell clusters; (right) heatmap visualizing expression of genes significantly enriched in each cell cluster. d, UMAP recolored to illustrate expression levels of the AgRP neuron marker genes, Agrp and Npy. e, Violin plots showing expression of the following: quality control metrics (number of genes, nGenes; number of unique molecular identifiers, nUMI; percentage of reads from mitochondrial genes, %mito); neuronal marker genes (Syn1, NeuN/Rbfox3); oligodendrocyte marker gene (Olig1); macrophage marker gene (Aif1); astrocyte marker genes (Gfap, Agt); excitatory neuron marker gene (Slc17a6); and inhibitory neuron marker genes (Slc32a1, Gad1, Gad2).
To molecularly identify rabies-infected cells, we isolated H2b-mCherry+ cell nuclei from the Arc, dorsomedial hypothalamus (DMH) and the paraventricular hypothalamus (PVH), and profiled their genome-wide mRNA content by single-nuclei RNA-sequencing (snRNA-seq; Fig. 1A). We focused on these brain regions since they contain the highest densities of cells labeled by rabies via AgRP neurons 21,22. We chose to profile nuclei instead of whole cells because enzymatic dissociation appears to deplete rabies-infected neurons, potentially due to poor cell viability 23, and because a cell’s nuclear RNA profile is sufficient to identify its molecular type 24–26. For control samples, we similarly profiled AgRP neurons labeled instead with a Cre-dependent AAV expressing H2b-mCherry (AAV-DIO-H2b-mCherry). Our initial dataset (“all rabies”) of rabies-labeled cells from the Arc, DMH, and PVH totaled 5,770 cells and averaged 2,296 +/− 642 genes detected per cell, after filtering for quality control (mean +/− st. dev.; (Fig. S2, S3A). Grouping these cells by expression of high-variance genes yielded 24 cell clusters (Fig. S3B,C), which we annotated according to its brain region of origin (Fig. S3D). Some of the clusters contained cells from multiple brain regions, suggesting that these cells may reside at or across the regional borders approximated during tissue dissection (Fig. S3E). Importantly, among the clusters were two neurons, which likely correspond to known presynaptic partners of AgRP neurons: PVH cells expressing the gene Trh, which encodes thyrotropin-releasing hormone (Fig. S3F) 22, and DMH cells expressing the leptin receptor gene, Lepr (Fig. S3G) 17.
We focused our analysis on the Arc, since it contains many afferents to AgRP neurons 22, potentially including glucagon-like peptide (GLP1)- and leptin-sensing populations which could inhibit AgRP neurons to suppress hunger 2,17. To identify Arc cell subtypes, we subsetted Arc cells and re-clustered them apart from non-Arc cells. Filtering out likely cell doublets and low-quality transcriptomes left 4,428 cells, in which we detected 2,308 +/− 634 genes per cell (mean +/− st. dev.). Grouping these cells based on high-variance transcripts yielded 17 molecularly distinct clusters (Fig. 1B–C). As expected, some of these clusters showed enriched expression of AgRP neuron marker genes (i.e., Agrp, Npy; Fig. 1D). We identified these clusters as neurons based on their content of neuron marker transcripts Syn1 and Rbfox3 and relative lack of glial and stromal cell marker transcripts (Fig 1E). Based on their expression of the neurotransmitter phenotype genes Slc17a6, Gad1, and Gad2, we annotated 4 of the clusters as glutamatergic, 12 as GABAergic, and 1 as molecularly ambiguous (Fig. 1E). Of note, the inhibitory neuron marker gene, Slc32a1, which encodes the vesicular GABA transporter (vGAT), was barely detectable among the Gad1+/Gad2+ clusters (Fig. 1E). This is consistent with previous reports that rabies infection downregulates Slc32a1 expression 27. Together, our findings demonstrate that RAMPANT can identify transcriptionally distinct groups of neurons.
Most Marker Genes of AgRP Neurons Are Not Significantly Affected by Rabies Infection
Rabies infection can alter expression of genes that distinguish molecular cell types, such as Slc32a1, which represents a potential confound to identifying cell types 23,27. For instance, if rabies downregulates genes normally enriched in a cell type (positive markers) or upregulates genes normally found in neighboring cell types (negative markers), this could undermine the accuracy of identifying a rabies-infected cell’s molecular type. To investigate this potential confound in our method, we compared the transcriptomes of individual AgRP neurons labeled with either the helper AAV and [EnvA]rabies-H2b-mCherry then collected five days after rabies infection (AAV+rabies), or just AAV-DIO-H2b-mCherry (AAV-only; n=689 AAV+rabies cells and 2,133 AAV-only cells). These AgRP neurons were identified by mapping AAV+rabies cells and AAV-only cells onto a reference single-cell RNA-seq dataset of uninfected mediobasal hypothalamic neurons 28 (“reference atlas”) using a reference-guided cell annotation method 29 (Fig. 2A). Both populations of cells, AAV+rabies and AAV-only, mapped with similarly high confidence levels to the AgRP neuron subtype and so were annotated as AgRP neurons (Fig. 2B). Comparing the AAV+rabies AgRP neurons to the AAV-only AgRP neurons revealed 328 genes as significantly altered by rabies infection (Fig. 2C). Among these were genes which distinguish AgRP neurons from other Arc neurons in our reference atlas 28. For instance, among positive markers for AgRP neurons, rabies infection upregulated Agrp and downregulated Npy2r, though expression of Npy did not change significantly (Fig. 2D). Importantly, only 82 of the 328 rabies-affected genes (25%) were AgRP neuron marker genes, and these represented 11% of the AgRP neuron marker genes (n=761 positive and negative markers combined; Fig. 2E). Of these 82 rabies-affected marker genes for AgRP neurons, 35 (42.7%) were altered in the same direction as their enrichment in AgRP neurons – e.g., 29 genes enriched in AgRP neurons (i.e., positive markers) were upregulated by rabies in AgRP neurons (Fig. 2F,G). Our results therefore demonstrate that the vast majority of positive and negative marker genes for AgRP neurons are not significantly affected five days after rabies infection. Among those AgRP neuron marker genes altered by rabies, roughly half were altered in the same direction as their enrichment in AgRP neurons and so may be less likely to confound cell-type identification. These results suggest that cells acutely infected with rabies may still be identifiable by their expression of most cell-type marker genes.
Figure 2 -. Most Marker Genes of AgRP Neurons Are Not Significantly Affected by Rabies Infection.

a, Schematic for comparing gene expression between AgRP neurons infected with AAV-only or with AAV and rabies (AAV+rabies). b, Violin plots comparing prediction scores for AAV-only cells vs. AAV+rabies cells mapping to the AgRP neuron cluster from the reference dataset 28. c, Volcano plot of genes differentially expressed to a significant extent between AAV-only AgRP neurons and AAV+Rabies AgRP neurons. d, Violin plots comparing AAV-only AgRP neurons and AAV+Rabies AgRP neurons in terms of their expression of the AgRP neuron marker genes Agrp, Npy, and Npy2r. e, Venn diagram showing overlap of AgRP neuron marker genes (positive and negative) and genes significantly altered by rabies in AgRP neurons. f, For each AgRP neuron marker gene altered by rabies, its enrichment in AgRP neurons and non-AgRP Arc neurons compared to its alteration by rabies infection in AgRP neurons. For instance, the top right quadrant (Q1) contains genes significantly enriched in AgRP neurons which are upregulated by rabies. g, Pie graph of the number of genes per quadrant in Figure 2F as a percentage of the total number of AgRP neuron marker genes significantly affected by rabies.
Label Transfer Predicts Molecular Subtypes of Rabies-Infected Arc Neurons
To assign a neuronal subtype identity to each rabies-infected cell, we projected each rabies-infected transcriptome onto our reference atlas 28 (Fig. 3A,B). We removed rabies-infected cells that mapped with low confidence to the reference atlas (cell-type prediction score <0.5 out of 1), which left 3,593 rabies-infected cells (81%) for further analysis. The rabies-infected cells mapped to 19 of 31 neuron subtypes in our reference dataset, including AgRP neurons as expected (Fig. 3C,D). Of these, 14 cell types originated from the Arc, whereas 4 of these cell types likely came from neighboring regions as an artifact of dissection, such as the ventromedial hypothalamus (VMH) and retrochiasmatic area 28 (Fig. 3C,D). Several of these subtypes were over-represented in our Arc RAMPANT dataset relative to the reference atlas, including n11.Trh/Cxcl12 neurons, n21.Pomc/Glipr1 neurons, n20.Kiss1/Tac2 neurons, and n08.Th/Slc6a3 neurons (Fig. 3D), consistent with non-random sampling of Arc cells. In addition, we identified Arc neuron subtypes which likely correspond to previously identified afferents to AgRP neurons: n20.Kiss1/Tac2 neurons (Kisspeptin, Neurokinin B/Tac2, Dynorphin, or KNDy, neurons)(Nestor et al., 2016); n08.Th/Slc6a3 neurons (tuberoinfundibular, or TIDA, neurons)(Zhang and van den Pol, 2016); and multiple subtypes of Drd1+, Lepr+, and Glp1r+ neurons 2,17,30 (Fig. S4). Thus, our RAMPANT dataset includes all known Arc afferents to AgRP neurons and predicts many additional subtypes of afferents within the Arc.
Figure 3 -. Label Transfer Predicts Molecular Subtypes of Rabies-Infected Arc Neurons.
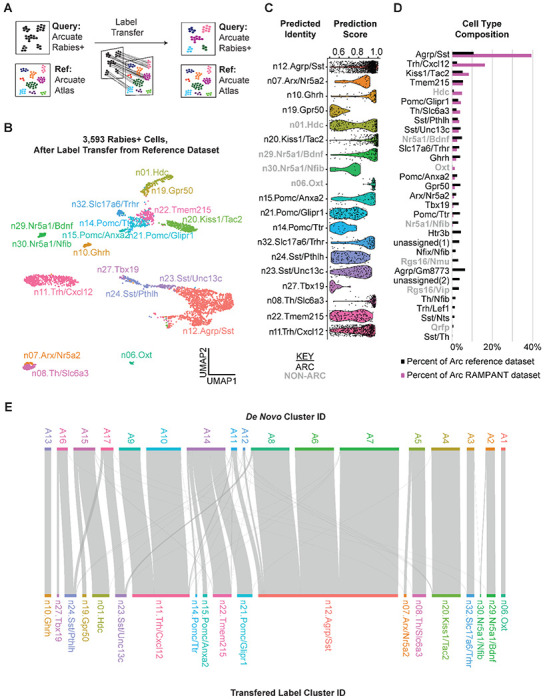
a, Schematic of method for transferring labels from a reference single-cell RNA-seq dataset to rabies+ cells. b, Violin plots of cell type prediction scores from mapping rabies+ cells to the reference atlas dataset 28. c, UMAP plot of 3,593 Arcuate rabies+ cell nuclei clustered by expression of highly variable genes and colored by transferred label. d, Riverplot of relationship between de novo cell clusters and reference-labeled cell clusters.
In some cases, we observed that neurons from the same de novo cluster mapped to different reference clusters. For example, de novo cluster A14 consisted of neurons which mapped to the n21.Pomc/Glipr1, n22.Tmem215, n15.Pomc/Anxa2, and n14.Pomc/Ttr subtypes (Fig. 3E). This observation supports previous reports that reference-guided cell annotation can help separate closely related cell types more efficiently than de novo clustering 29. Together, our results demonstrate that rabies-infected neurons can be identified by comparing them to uninfected neurons, despite the transcriptional artifacts of rabies infection.
RNA Fluorescence In Situ Hybridization Confirms RAMPANT Neuron Subtype Predictions
Our RAMPANT study predicts at least 14 molecular subtypes of Arc neurons labeled by rabies via AgRP neurons. To validate these predictions, we used RNA fluorescence in situ hybridization (RNA FISH) staining in tissue following monosynaptic rabies tracing from AgRP neurons. We selected four Arc neuron subtypes, each marked by its expression of the following marker genes: Slc6a3, Ghrh, Pomc, and Trh (Fig. 4A). We validated these subtypes by co-localizing rabies-H2b-mCherry with fluorescently labeled transcripts of each subtype-specific marker by RNA FISH (Fig. 4D). Quantifying the rate of colocalization for each subtype indicates that, in the Arc, Slc6a3+ neurons, Ghrh+ neurons, Pomc+ neurons, and Trh+ neurons constitute 4.56%, 2.98%, 6.61%, and 16.16% of rabies-labeled afferents to AgRP neurons, respectively (n=3 mice per subtype; Fig. 4B). These estimates correlate with the percentage of corresponding cell types in our RAMPANT dataset: n08.Th/Slc6a3 neurons, n10.Ghrh neurons, Pomc neurons (all subtypes combined), and n11.Trh/Cxcl12 neurons comprise 3.84%, 1.84%, 5.93%, and 16.06% of the cells (Fig. 4B,C). Thus, our results validate RAMPANT’s predictions of these neuronal subtypes, including n10.Ghrh neurons, a rare type of predicted afferent to AgRP neurons.
Figure 4 -. RAMPANT Characterizes the Transcriptional Response To Metabolic Challenges.
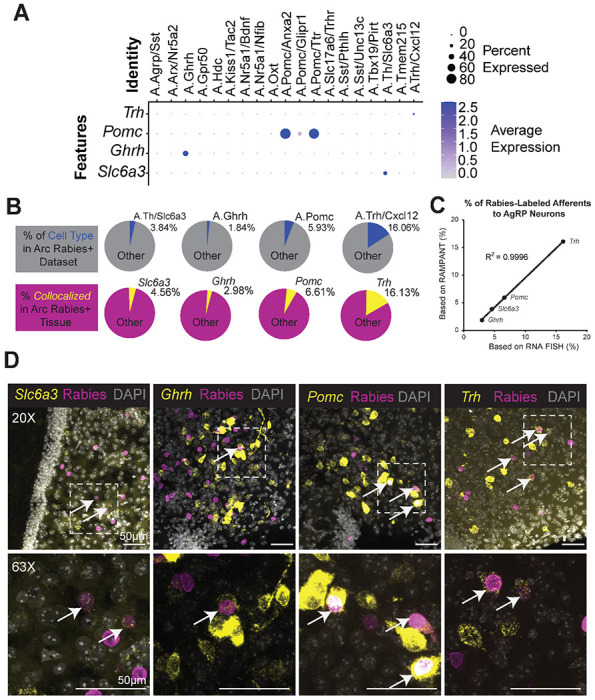
a, Dot plot showing cluster-level expression of Trh, Pomc, Ghrh, and Slc6a3. b, (top) Pie charts of four cell clusters as percentages of the Arc RAMPANT dataset; (bottom) Pie charts of four cell-type markers as a percentage of cells after rabies labeling via AgRP neurons. c, Correlation between the percentages shown in the top and bottom pie charts in Figure 4B. d, Expression of Slc6a3, Ghrh, Pomc, and Trh transcripts (yellow) and rabies H2b-mCherry fluorescence (magenta) in Arc cells (n=3 mice). Top row at 20x magnification, Bottom row imaged at 63x magnification.
RAMPANT Characterizes the Transcriptional Response To Metabolic Challenges
To evaluate if RAMPANT can detect metabolically regulated genes, we repeated our RAMPANT study on mice that had undergone one of three feeding conditions (fed, fasted, or post-fast re-fed) immediately prior to tissue collection (n=9-11 mice per feeding condition, Fig. 5A). The mice lost body weight with fasting and regained it with post-fast re-feeding, as expected (Fig. S5). Comparing gene expression in rabies-infected AgRP neurons between fed and fasted mice revealed 134 fasting-sensitive genes (n=193 and 308 AgRP neurons from fed and fasted mice, respectively; Wilcoxon rank-sum test with Bonferroni correction; Fig. 5B). Of these genes, the majority (56%) were previously detected in a study comparing pooled AgRP neuron samples from fed and fasted mice, including genes upregulated by fasting: e.g., Mast4; Irs2; Npy; Vgf; Lepr; and Erg1 31 (Fig. 5B). Additionally, our analysis revealed downregulation of many other genes with fasting, including Ccdc85a, Rasgrp1, Camk2a, and Synpr (Fig. 5D). These results confirm many genes previously reported to change in AgRP neurons with fasting 28,31.
Figure 5 -. RAMPANT Characterizes the Transcriptional Response To Metabolic Challenges.

a, Timeline of viral injections and metabolic challenges. b, Volcano plot of genes differentially expressed (DE) between fed and fasted rabies+ AgRP neurons (134 DE genes; n=193 AgRP neurons from 8 fed mice vs. 308 AgRP neurons from 8 fasted mice; significance in RAMPANT analysis based on Wilcoxon rank-sum test with Bonferroni correction); inset pie chart shows the number of DE genes in fed vs. fasted AgRP neurons as detected in Henry et al., 2015 and/or our RAMPANT study. c, (top) Pie chart showing distribution of rabies+ AgRP neurons per feeding condition (n=8 fed mice, n=8 fasted mice, n=10 re-fed mice); (bottom) pie chart showing distribution of rabies+ n11.Trh/Cxcl12 neurons per feeding condition. d, (left) Volcano plot of genes differentially expressed between fed and fasted rabies+ AgRP neurons (134 DE genes; Wilcoxon rank-sum test with Bonferroni correction); (right) volcano plot of genes differentially expressed between fasted and re-fed rabies+ AgRP neurons (170 DE genes; Wilcoxon rank-sum, Bonferroni correction). e, (left) Volcano plot of genes differentially expressed between fed and fasted rabies+ n11.Trh/Cxcl12 neurons (19 DE genes; Wilcoxon rank-sum, Bonferroni correction); (right) volcano plot of genes differentially expressed between fasted and re-fed rabies+ n11.Trh/Cxcl12 neurons (38 DE genes; Wilcoxon rank-sum test with Bonferroni correction).
Comparing AgRP gene expression between fasted and re-fed mice revealed 170 feeding-sensitive genes (n=308 and 538 AgRP neurons from fasted and re-fed mice, respectively; Wilcoxon rank-sum, Bonferroni correction; Fig. 5C,D). This analysis showed that refeeding downregulates the expression of many genes upregulated by fasting, such as Mast4, Irs2, Lepr and Erg1 (Fig. 5D). These results complement our fasting results, showing that refeeding reverses the effect of fasting on certain genes. Our results largely validate previous reports of feeding-sensitive genes in AgRP neurons and demonstrate that RAMPANT can detect most of these genes in rabies-infected neurons.
Repeating this analysis on rabies+ n11.Trh/Cxcl12 neurons revealed 19 differentially expressed genes between fed and fasted mice, as well as 38 differentially expressed genes between fasted and re-fed mice (Fig. 5C,E). We identified fewer differentially expressed genes in n11.Trh/Cxcl12 neurons than in AgRP neurons, likely due to the smaller sample size (n=263 n11.Trh/Cxcl12 neurons vs. 1,039 AgRP neurons). Among the fasting-sensitive genes, we found an upregulation of some genes known to regulate body weight, including Lepr, Tmem132d, and Erbb4 32–35 (Fig. 5E). We also detected upregulation of Rab3c in re-fed mice when compared to fasted mice (Fig. 5E). Previous reports show that Rab3c modulates the IL6-STAT3 pathway 36, which is critical for glucose homeostasis in hepatic tissue and skeletal muscle 37. These results, along with their high expression of genes encoding receptors for the satiety hormones GLP-1 and leptin (Glp1r, Lepr) suggest that n11.Trh/Cxcl12 neurons may have a role in energy balance (Fig. S4). We also observed an increase in Setdb2 expression with fasting, as well as a decrease in Setdb2 expression after refeeding (Fig. 5E). While little work has been done studying the role of Setdb2 in the hypothalamus, previous studies conducted in the liver have established Setdb2 as a critical regulator of lipid metabolism through its role in the induction of Insig2a 38. This study also found an increase in Setdb2 mRNA expression in fasted mice when compared to a re-fed state, suggesting it plays a regulatory role during fasting 38. Together, these results demonstrate that RAMPANT can detect metabolically sensitive cells and genes and so can be used to functionally annotate subtypes of afferent neurons. Additionally, our findings suggest that Arc n11.Trh/Cxcl12 neurons may serve as a metabolically sensitive afferent to AgRP neurons.
Trh Arcuate Neurons Synaptically Inhibit AgRP Neurons
AgRP neurons receive GABAergic input from Lepr+ and Glp1r+ Arc neurons (PMID 27643429, 25202980), and our RAMPANT analysis predicts that n11.Trh/Cxcl12 neurons are a source of that input (Fig. S4). To test this prediction, we used channelrhodopsin (ChR2)-assisted circuit mapping (CRACM) to determine whether TrhArc neurons form functional synapses onto AgRP neurons (Petreanu et al., 2007, PMID 17435752; Atasoy & Aponte et al., 2008, PMID 18614669). After targeting ChR2 expression to the caudal Arc of Trh-Cre;Npy-hrGFP mice to selectively transduce TrhArc cells, we recorded post-synaptic currents from Npy-hrGFP Arc cells while photo-stimulating TrhArc axons in acute brain sections (Fig. 6A). Critically, the vast majority of Npy-hrGFP+ cells in the Arc are AgRP neurons (Hahn et al., 1998, PMID 10195157; Van den Pol et al., 2009, PMID 19357287). Upon demonstrating the ability of our approach to drive light-evoked action potentials in TrhArc neurons (Fig. 6B), we recorded from Arc Npy-hrGFP+ neurons and detected light-evoked inhibitory postsynaptic currents (IPSCs) in 50% Npy-hrGFP+ neurons tested (Fig. 6C). Importantly, these currents were blocked by the GABA A receptor antagonist, picrotoxin (data not shown), indicating that TrhArc neurons release GABA onto AgRP neurons, consistent with their GABAergic molecular phenotype (e.g., Slc32a1 expression, PMID: 28166221). Our results thus validate RAMPANT’s prediction that TrhArc neurons synapse on and inhibit at least a subset of AgRP neurons.
Figure 6 -. TrhArc Neurons Inhibit AgRP Neurons and Suppress Feeding in an AgRP Neuron-Dependent Manner.
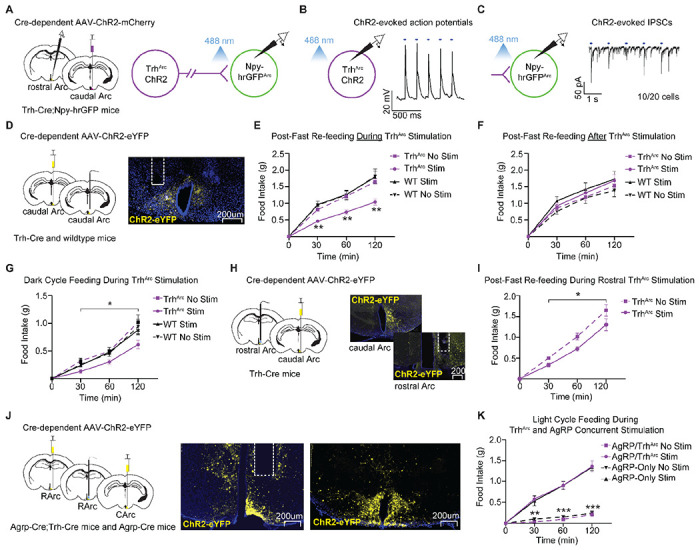
a, Left, brain schematic of unilateral viral delivery of Cre-inducible AAV-ChR2 to caudal TrhArc neurons (TrhArc-ChR2) and electrophysiological recordings of rostral NPY-hrGFP neurons (~AgRP neurons) in Trh-Cre;Npy-hrGFP mice. Right, schematic of channelrhodopsin-assisted circuit mapping (CRACM). b, Representative trace of ChR2 light-evoked action potentials in caudal TrhArc-ChR2 neurons. c, Representative trace of ChR2 light-evoked IPSCs in NPY-hrGFP+ Arc neurons (n=20 cells from a total of 3 mice). d, Left, schematic of unilateral injection of Cre-inducible AAV-ChR2 to caudal TrhArc neurons and optical fiber implant over the caudal Arc in Trh-Cre mice. Right, representative image of TrhArc ChR2-eYFP expression and caudal fiber implant location. e, Average post-fast food intake by mice during unilateral or bilateral caudal TrhArc-ChR2 photostimulation (n=14 for TrhArc, n=8 for wildtype, males and females, repeated-measures two-way ANOVA, time x condition: F (9, 120) = 5.97, P<0.0001, Tukey’s multiple comparisons). f, Average post-fast food intake by mice after unilateral or bilateral caudal TrhArc-ChR2 photostimulation (n=12 for TrhArc-ChR2, n=8 for wildtype, males and females, repeated-measures two-way ANOVA, time x condition: F (9, 108) = 0.67, P=0.74). g, Average dark cycle food intake by mice during unilateral or bilateral caudal TrhArc-ChR2 photostimulation (n=9 for TrhArc-ChR2, n=7 for wildtype, males and females, repeated-measures two-way ANOVA, time x condition: F (9, 84) = 2.09, P=0.04). h, Schematic of unilateral delivery of Cre-inducible AAV-ChR2 to caudal TrhArc neurons and optical fiber implant over the rostral Arc in Trh-Cre mice. i, Within-subject quantification of average food intake by fasted mice during unilateral photostimulation or no stimulation of the rostral Arc in TrhArc-ChR2 mice (n=6, males and females, repeated-measures two-way ANOVA, Condition: F (1, 10) = 7.96, P=0.02). j, Left, Schematic of unilateral delivery of Cre-inducible AAV-ChR2 to Agrp-Cre and Trh-Cre Arc neurons and optical fiber implant over the rostral Arc in Agrp-Cre;Trh-Cre mice. Right, representative images of ChR2 expression in rostral and caudal Arc neurons and fiber implant location in the rostral Arc. k, Average food intake by mice during light-cycle photostimulation of either TrhArc-ChR2 and AgRP-ChR2 neurons together, or AgRP-ChR2 neurons along (n=7, males and females, repeated-measures two-way ANOVA, time x condition: F (9, 72) = 31.59, P<0.0001, Tukey’s multiple comparisons). All error bars of e-g, i, and k represent standard error of the mean (SEM). *P<0.05 **P<0.01 ***P<0.001.
Trh Arcuate Neurons Decrease Feeding in an AgRP Neuron-Dependent Manner
Activation of AgRP neurons promotes hyperphagia in calorically replete mice 11,13, while direct or indirect inhibition significantly reduces food intake 13. Since our CRACM studies demonstrate that TrhArc neurons inhibit AgRP neurons, we hypothesized that activating TrhArc neurons would reduce food intake in an AgRP neuron-dependent manner. To examine the ability of TrhArc neurons to diminish feeding, we targeted ChR2 expression to caudal TrhArc neurons and implanted optic fibers over the caudal Arc where TrhArc neurons predominantly reside (Fig. 6D). For controls, we injected Cre-negative littermate mice with the same Cre-dependent AAV. We then assessed food intake with and without concurrent laser stimulation over a 2-hour period near the beginning of the light cycle following an overnight fast. Unilateral or bilateral TrhArc photoactivation during feeding significantly reduced post-fast food intake compared to the same mice without photostimulation and compared to controls with or without photostimulation (Fig. 6E). Our results demonstrate that TrhArc neuron activity can decrease feeding behavior.
AgRP neurons co-release NPY and AgRP, neuropeptides that induce a robust hyperphagic response when administered into the rodent hypothalamus 39–41. Moreover, activating AgRP neurons causes a sustained hunger drive which depends on NPY release 42–44. Since our RAMPANT data indicates that GABAergic TrhArc neurons contain transcripts for hormones and peptides (e.g., Cartpt, Trh), we investigated whether acutely activating these cells before food presentation causes a prolonged decrease in feeding. Accordingly, we primed TrhArc -ChR2 neurons with photoactivation in overnight fasted mice for one hour prior to food access, then stopped the photoactivation and allowed mice access to food for 2 hours. In contrast to our results with concurrent stimulation, photoactivating TrhArc -ChR2 neurons before food presentation failed to attenuate food intake in fasted mice, as all groups of mice exhibited comparable levels of food consumption (Fig. 6F). This suggests that TrhArc neuron activity can concurrently decrease feeding but does not have a lasting effect on appetite.
While caloric deprivation between meals is typical for most animals, prolonged fasting leads to a number of physiological adaptations in mice including changes in hormone balance, body weight, metabolism, hepatic enzymes, cardiovascular parameters, body temperature, and toxicological responses 45. Mice under no caloric constraint consume the vast majority of their food at night, a significant portion of which occurs at the onset of the dark cycle 46. To examine the sufficiency of TrhArc neurons to reduce food intake in physiologically hungry mice that show circadian rhythmicity, food intake was measured with or without concurrent laser stimulation in ad libitum fed mice for 2 hours after the onset of the dark cycle. Similar to the fast-refeed condition, TrhArc -ChR2 photoactivation reduced food intake during the first 2 hours of the dark cycle compared to the same mice without photostimulation, and to littermate wildtype controls as described above (Fig. 6G).
Since our CRACM studies showed that TrhArc neurons inhibit AgRP neurons through projections to the rostral Arc (see Fig. 6C), we investigated whether selectively activating these rostral Arc projections could also suppress feeding (Fig. 6H). Importantly, the AgRP neurons which innervate hunger-controlling brain regions and can drive feeding behavior are concentrated in the rostral half of the Arc 47. We found that photoactivating the rostral Arc axons of caudal Arc TrhArc -ChR2 neurons significantly reduced food intake after a fast (Fig. 6I), demonstrating the capacity of these projections to decrease feeding in hungry animals.
If TrhArc neurons suppress feeding by inhibiting AgRP neurons in the rostral Arc, then stimulating AgRP neurons and TrhArc neurons together should prevent TrhArc neurons from reducing feeding. To test this prediction, we targeted ChR2 to TrhArc neurons and AgRP neurons in Trh-Cre;Agrp-Cre mice and placed an optical fiber over the rostral Arc (Fig. 6J). Simultaneous activation of AgRP neurons and TrhArc neurons dramatically increased food intake in sated mice, compared to mice without photostimulation. Importantly, this increase was almost identical to the hyperphagia seen in mice with only AgRP neuron photostimulation (Fig. 6K), indicating that AgRP neuron activity can override the satiating effects of sustained TrhArc neuron activity. Together, our results show that activating TrhArc neurons can suppress feeding through projections to the rostral Arc but in an AgRP neuron-dependent manner. Considering our finding that TrhArc neurons directly inhibit AgRP neurons, these results raise the possibility that TrhArc neurons decrease feeding mainly by inhibiting AgRP neurons.
Of note, our injection of ChR2 AAV into Trh-Cre;Agrp-Cre mice unavoidably also transduced a subset of TrhDMH cells with ChR2 (representative example in Fig. 6J). Whether TrhDMH neurons contribute to feeding has not been reported. Nevertheless, our results indicate that activating Trh-ChR2 in the Arc and DMH fails to diminish AgRP neuron-driven feeding.
Trh Arcuate Neurons are Activated by Liraglutide and Signal to Limit Feeding and Weight Gain
TrhArc neurons co-express genes encoding receptors for two hormones whose critical targets in the brain remain unknown, glucagon-like peptide-1 (GLP-1 receptor gene, Glp1r; PMID 3626657; Fig. S4) and leptin (leptin receptor gene, Lepr Campbell et al., 2017; Fig. S4). Liraglutide can diminish the response of AgRP neurons to food in hungry animals 15, potentially by activating inhibitory inputs to AgRP neurons 2,15,16. Since TrhArc neurons express Glp1r and inhibit AgRP neurons, we wondered whether they respond directly to liraglutide. To test this possibility we imaged calcium activity in TrhArc neurons in acute brain sections, using the genetically encoded calcium indicator GCaMP6s (Fig. 7A). For each recording, slices were imaged in the presence of the synaptic blockers picrotoxin (25 uM), AP5 (20 uM) and NBQX (10 uM) for the entire recording session. After a 5 minute baseline period, during which slices were imaged in the presence of artificial cerebrospinal fluid (aCSF), either liraglutide or a saline vehicle was added to the bath for 10 minutes. Liraglutide (100 nM) application led to a steady ramp up of calcium activity over the wash-on phase compared to saline (Fig. 7B–C). Importantly KCl was added to each slice at the conclusion of the recordings as a positive control to demonstrate cell responsivity, even in those that failed to respond to liraglutide (Fig. 7B). To account for differences in cell responsiveness across tissue slices, we also calculated the percentage of responding cells per slice. Liraglutide resulted in significantly more responsive cells per slice than saline (Fig. 7D).
Figure 7 -. TrhArc Neurons Respond to GLP-1R Agonists and Contribute to Their Suppression of Feeding.
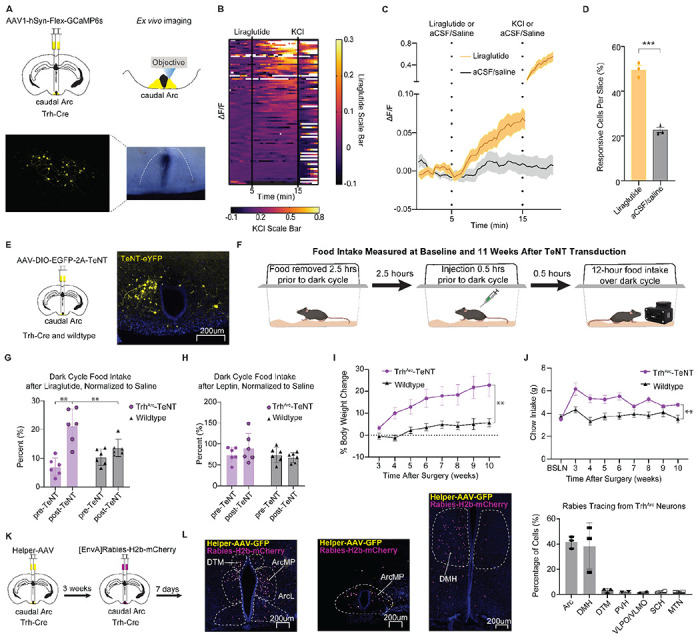
a, Top, brain schematic of bilateral viral delivery of Cre-inducible GCaMP6s to caudal TrhArc neurons in Trh-Cre mice. Bottom, representative image of GCaMP6s expression in caudal TrhArc neurons. b, Heatmap of individual TrhArc neuron ΔF/F responses to liraglutide (100 nM) application and KCl (10 mM). Liraglutide scale bar for minutes 0 to 15, KCl scale bar for minutes 15 to 20 (n=90 cells/3 slices, males and females). c, Averaged individual traces of TrhArc neuron ΔF/F responses to liraglutide followed by KCl vs. saline application (n=90 cells/3 slices for liraglutide, n=64 cells/3 slices for saline). d. Percentage of responsive cells per slice (n=3 for liraglutide, n=3 for saline, unpaired t-test (two-tailed), P=0.0003). e, Left, brain schematic of bilateral viral delivery of Cre-inducible AAV-EGFP-2a-TeNT to caudal Arc neurons in Trh-Cre mice. Right, representative image of AAV-EGFP-2a-TeNT expression in caudal Arc neurons. f, Behavioral schematic for dark cycle feeding responses to saline, liraglutide, or leptin injections performed at baseline and 11 weeks post-surgery of Cre-inducible AAV-EGFP-2a-TeNT. g, Overnight food intake percentage following liraglutide injection, calculated as the percentage of food intake following saline injection at the corresponding time-point (n=6 for TrhArc-TeNT, n=6 for wildtype (WT), males and females, RM two-way ANOVA, Time x Condition: F (1, 10) = 6.98, P=0.02, Tukey’s multiple comparisons). h, Overnight food intake percentage following leptin injection calculated as the percentage of food intake following saline injection at the corresponding time-point (n=6 for TrhArc-TeNT, n=6 for WT, males and females, RM two-way ANOVA, Time x Condition: F (1, 10) = 2.78, P=0.13). i, Average percentage change of body weight over time normalized to baseline body weight in TrhArc-TeNT and wildtype (WT) littermates bilaterally injected with Cre-inducible AAV-EGFP-2a-TeNT (n=6 for TrhArc-TeNT, n=6 for WT, males and females, repeated-measures two-way ANOVA, time x condition: F (7, 70) = 3.00, P<0.0001). h, Average daily chow intake over time in TrhArc-TeNT and wildtype (WT) littermates bilaterally injected with Cre-inducible AAV-EGFP-2a-TeNT (n=6 for TrhArc-TeNT, n=6 for WT, males and females, repeated-measures two-way ANOVA, time x condition: F (8, 80) = 7.73, P<0.0001). k, Left, representative images of TVA helper AAV (yellow) and rabies virus (magenta) in the caudal Arc and rabies virus in the DMH. Right, percentage of total cells expressed in each region per slice (n=3). Arc = Arcuate, DMH = Dorsomedial Hypothalamus, DTM = Dorsal Tuberomammillary, PVH = Paraventricular Hypothalamus, VLPO/VMPO = Ventrolateral / Ventromedial Preoptic Nucleus, SCH = Suprachiasmatic Nucleus, MTN = Midline Group of the Dorsal Thalamus. All error bars and the shaded regions in panel c represent standard error of the mean (SEM). **P<0.01 ***P<0.001.
Since TrhArc neurons also express the gene encoding leptin receptor (Fig. S4), we repeated our calcium imaging studies while administering leptin or its vehicle to the brain slice. However, in contrast to our results with liraglutide, leptin failed to significantly affect calcium activity in TrhArc neurons (data not shown). Of note, our results do not rule out a delayed effect of leptin on these neurons; while leptin can directly alter the activity of some Arc neurons 48,49, it controls appetite largely through transcriptional changes 50, which likely occur on a longer timescale than our ex vivo imaging experiments.
GLP-1R agonists (such as liraglutide) can dramatically reduce body weight and food intake in humans and rodents 51,52. To determine whether TrhArc neurons are necessary for GLP-1R-induced satiety, we genetically targeted expression of tetanus toxin (TeNT) to caudal TrhArc neurons (TrhArc-TeNT mice; Fig. 7E). TeNT irreversibly silences synaptic release by cleaving the vesicle protein synaptobrevin 53; we chose this approach over cell ablation strategies to avoid collateral damage from gliosis and other immune responses to cell death. For controls, we injected wildtype littermates with the same virus in the caudal Arc. We then administered the GLP-1R agonist liraglutide or a saline vehicle into TrhArc-TeNT mice and their controls at baseline and 11 weeks after TeNT transduction. For each trial, we removed food from the home cage 2.5 hours prior to the onset of the dark cycle, injected the mice with liraglutide or vehicle 0.5 hours prior to the onset of the dark cycle, and measured food intake over the course of the dark cycle with a FED3 system 54 (Fig 7F). To account for changes in body weight affecting food intake 55, we calculated food intake after liraglutide treatment as a percentage of food intake following vehicle injection for the corresponding time point (i.e., baseline or 11 weeks post-transduction).
As expected, liraglutide potently reduced food intake in both groups of mice before TeNT transduction (Fig. 7G). However, while liraglutide suppressed food intake to a similar degree in control mice 11 weeks later, in TrhArc-TeNT mice, this suppression was significantly less (Fig. 7G). These results demonstrate that TrhArc neuron signaling is necessary for the full extent of liraglutide’s anorectic effect. Interestingly, leptin’s anorectic effects remained stable in both groups, before vs. 11 weeks after TeNT transduction (Fig. 7H), suggesting that TrhArc neuron signaling is not necessary for leptin to acutely suppress feeding. However, as with our ex vivo calcium imaging studies, we cannot rule out that leptin has a delayed effect on the activity of TrhArc neurons through transcriptional changes.
Since TrhArc neurons can decrease feeding behavior and contribute to liraglutide-induced satiety, we wondered whether these neurons are generally necessary for energy balance. To test this, we tracked total body weight and food intake in the TrhArc-TeNT mice and their controls on a weekly basis at baseline and for 8 weeks, starting 3 weeks after the surgery date. We found that silencing TrhArc cells significantly escalated body weight gain in mice on a standard chow diet (Fig. 7I). This weight gain coincided with a significant increase in food intake (Fig. 7J). Overall, our results demonstrate that liraglutide, but not leptin, can rapidly activate TrhArc neurons ex vivo, independent of fast-acting neurotransmission, and that TrhArc neuron signaling contributes to liraglutide’s anorectic effects and limits feeding and body weight gain in vivo.
Trh Arcuate Neurons Receive Synaptic Input Largely from Arcuate and DMH Neurons
While most of the body’s GLP1 comes from L-cells of the small intestine, it is also secreted by neurons in the medullary nucleus of the solitary tract (NTS) which control feeding 56–58. To determine whether TrhArc neurons receive input from GLP1 NTS neurons, we mapped synaptic afferents to TrhArc neurons using monosynaptic retrograde rabies tracing. We restricted rabies infection to TrhArc neurons and their presynaptic partners by injecting a Cre-dependent helper virus expressing the TVA receptor and oG into the caudal Arc of Trh-Cre mice and one month later injecting the same region with [EnvA]rabies-H2b-mCherry (Fig. 7K). Our results indicated that a large majority of H2b-mCherry+ cells were in the vicinity of the TrhArc neurons (Fig. 7L). Quantifying expression levels revealed the largest percentage of rabies-infected cells were in the Arc and dorsomedial hypothalamus (DMH), with far smaller subsets in nearby hypothalamic regions, including the dorsal tuberomammillary (DTM), paraventricular hypothalamus (PVH), ventrolateral/ventromedial preoptic nucleus (VLPO/VMPO), suprachiasmatic nucleus (SCH), and midline group of the dorsal thalamus (MTN) (Fig 7L). Notably, we failed to detect rabies-labeled cells in the medulla, suggesting TrhArc neurons receive the bulk of their synaptic input from other mediobasal hypothalamic neurons. While it remains possible that TrhArc neurons receive polysynaptic input from medullary GLP1 neurons, it is also conceivable that the TrhArc neurons and their afferents integrate information from circulating signals via the third ventricle and median eminence.
DISCUSSION
We molecularly classified afferents to AgRP neurons in the mediobasal hypothalamus using RAMPANT, a novel method combining rabies-based connectomics with single-cell transcriptomics. Among the afferents was a previously uncharacterized subtype of inhibitory neurons in the caudal Arc marked by expression of Trh, Glp1r, and Lepr. We confirmed that TrhArc neurons provide direct GABAergic input to AgRP neurons and found that activating TrhArc neurons decreased feeding in an AgRP neuron-dependent manner. Finally, we demonstrated that TrhArc neurons can directly respond to liraglutide and that their signaling contributes to the satiating effects of this drug (but not that of exogenous leptin) and limits feeding and body weight gain. By identifying this liraglutide-sensing TrhArc→ AgRP neuron satiety circuit, our studies provide a potential mechanism for the effectiveness of weight loss-inducing GLP-1R agonists.
The Arc contains abundant GABAergic neurons, many of which increase feeding when activated, including AgRP neurons 11,13, somatostatin/Sst+ Arc neurons 28,59, and tyrosine hydroxylase/Th+ Arc neurons 60,61. Chronically activating non-AgRP GABAergic Arc neurons causes hyperphagia and obesity 62, indicating an orexigenic role for GABAergic Arc neurons in general. To our knowledge, TrhArc neurons are the first GABAergic Arc neuron found to have the opposite effect and suppress feeding when activated.
Determining synaptic connectivity in neural networks, including synaptic inputs to AgRP neurons, is a fundamental challenge in neuroscience. The current standard for identifying connected neurons is to infect them with a modified rabies virus (e.g., SADΔG-B19) which spreads monosynaptically, labeling only the initially infected neurons and their presynaptic partners 18–20. While this method reveals the location and anatomy of synaptic afferents, it provides little insight into their molecular identities. Recent studies have profiled gene expression in rabies-infected cells by single-cell RNA-sequencing (scRNA-seq). Their results show that, while rabies infection alters the expression of some genes, infected cells can still be classified by comparing their gene expression profiles to those of uninfected cells 23,27,63,64. Our use of RAMPANT confirms that rabies-infected cells can be molecularly identified and extends these previous findings, demonstrating that most AgRP neuron marker genes are unaffected by rabies 5 days after infection and that their molecular response to fasting and feeding remains largely intact. Importantly, this method can be applied to any neuron of interest in order to molecularly classify its synaptic afferents in a high-throughput manner.
Our RAMPANT results predict 14 molecular subtypes of Arc neurons that synapse on AgRP neurons. The extensive interconnectivity suggested by our results is consistent with previous anatomical studies of the Arc 65. For instance, roughly half of all synapses in the Arc are thought to originate from other Arc neurons 66. Prominent among the known afferents we detected were KNDy neurons, which release glutamate onto metabotropic receptors on AgRP neurons, thereby inhibiting them 67. In our RAMPANT analysis of AgRP neurons and their afferents, n20.Kiss1/Tac2 neurons were the third most abundant Arc neuron subtype.
Another source of synaptic input to AgRP neurons may be dopaminergic Arc neurons. Specifically, dopaminergic axons arborize and form terminal-like structures around AgRP neuron bodies 60. However, optogenetically activating axons from Arc tyrosine hydroxylase (TH)+ neurons failed to alter AgRP neuron membrane potential in acute brain sections 60. Our RAMPANT analysis identifies tuberoinfundibular dopaminergic (TIDA) neurons (n08.Th/Slc6a3 neurons) as a potential source of local dopaminergic input to AgRP neurons. However, while the rabies transmission from AgRP neurons to n08.Th/Slc6a3 neurons we observed is consistent with a synaptic connection between these populations, further investigation is needed to validate that connection and determine its functionality.
Finally, Arc neurons that express dopamine receptor D1 (Drd1+) neurons also provide glutamatergic and GABAergic input to AgRP neurons 30. Among the Drd1+ subtypes in our RAMPANT dataset are POMC neurons (n15.Pomc/Anxa2, n21.Pomc/Glipr1), inhibitory neuron subtypes (e.g., n24.Sst/Pthlh, n27.Tbx19), and excitatory neuron subtypes (e.g., n32.Slc17a6/Trhr, n29.Nr5a1/Bdnf; Fig. S4). Our results thus predict specific subtypes of Drd1+ neurons which could transduce dopamine signaling for AgRP neurons.
While some studies have implicated the Arc in liraglutide’s suppression of appetite 2, others indicate that Arc GLP-1Rs do not control appetite. For instance, Sandoval and colleagues reported that injecting glucagon-like peptide 1 (GLP-1) into the Arc of rats did not significantly affect their feeding 68. However, this study targeted GLP-1 ventrally in the caudal Arc, near the bottom of the third ventricle 68. Since the TrhArc neurons targeted in our study predominantly reside at the top of the third ventricle, it is possible that they were not affected by the GLP-1 injection. Our study demonstrates that signaling from TrhArc neurons participates in liraglutide’s satiating effects but does not rule out the possibility that liraglutide acts upstream of TrhArc neurons in the circuit. For instance, the liraglutide-induced calcium transients we observed in TrhArc neurons ex vivo may have been due to neuropeptidergic signaling from liraglutide-sensing neurons to TrhArc neurons, signaling which would have been spared by the synaptic blockers we used. Consistent with this, gene knockout studies indicate that Glp1r expression by glutamatergic (Slc17a6+) neurons but not by GABAergic (Slc32a1+) neurons is required for liraglutide to suppress appetite 51. Further investigation is needed to determine whether TrhArc neurons can directly sense liraglutide in vivo and whether this is necessary for the resulting satiety.
To investigate neurons that co-express Lepr, Glp1r, and Slc32a1, such as the TrhArc neurons described here, a recent study used conditional knock-out and rescue strategies to better define the role of these neurons in body weight maintenance 4. The authors found that deleting Lepr expression from Glp1r+ cells stimulated weight gain through overeating. Reactivating Lepr expression in GABAergic (Slc32a1+) neurons in otherwise Lepr-null mice almost completely rescued them from obesity and hyperphagia, akin to complementary studies deleting Lepr from GABAergic neurons 69. However, no such rescue occurred if GABAergic Glp1r+ neurons were excluded from the Lepr reactivation, indicating that leptin acts on GABAergic Glp1r+ neurons to control feeding and body weight. Importantly, a similar knockout and conditional reactivation approach showed that expressing Glp1r only in GABAergic Lepr+ cells was sufficient for liraglutide to suppress appetite 4. The study concluded that the likely site of interaction of liraglutide and leptin was the DMH given the abundance of leptin-sensing Glp1r+ neurons there 4. However, this study does not rule out the role for TrhArc neurons characterized here, since they also co-express Slc32a1, Lepr, and Glp1r.
Finally, a co-submitted manuscript found that Glp1r+ DMH neurons are rapidly activated just prior to and during feeding and can suppress AgRP neuron activity and feeding (REF). Our RAMPANT study also identified Glp1r+ DMH neurons as AgRP neuron afferents (Fig. S3G), and our clustering analysis shows that these DMH neurons are similar in their gene expression profile to TrhArc neurons (adjacent clusters in Fig. S3B). Still, the relative functional roles of these anatomically-distinct neuronal subtypes remain unclear. One possibility is that the Glp1r+ DMH neurons rapidly inhibit AgRP neurons in response to external food cues, as previously reported of DMH Lepr+ neurons 17, potentially to reinforce food-seeking behavior (Berrios et al., 2021). Accordingly, a recent single-cell RNA-seq analysis of DMH neurons showed that expression Glp1r and Lepr are highly co-localized 70. However, unlike the Lepr+ DMH neurons, the TrhArc neurons characterized in our study received little if any synaptic input from the lateral hypothalamus (Fig. 7L) and so are unlikely to respond to food-related cues 71. Instead, the TrhArc neurons might respond to post-absorptive metabolic cues, consistent with their abundant synaptic input from Arc and DMH neurons (Fig. 7L). Further investigation is needed to understand the physiological role of TrhArc neurons and how it differs from the molecularly similar DMH neurons. Along with these Glp1r+ DMH neurons (REF) and other neural cell populations 72, we propose that TrhArc neurons are part of a distributed network of neural cells through which GLP-1 signaling suppresses feeding.
METHODS
All animal care and experimental procedures were approved in advance by the University of Virginia Institutional Animal Care and Use Committee (RAMPANT and RNA FISH experiments) and by the US National Institutes of Health Animal Care and Use Committee (all other experiments). Mice were housed with a 12-h light/dark cycle and provided ad libitum access to food (standard chow, Envigo 7017 NIH-31, or 20 mg grain pellets, TestDiet 5TUM) and water unless otherwise noted. All experiments were carried out in adult (>8 weeks) mice that were group-housed until experiments began. Some measurements were carried out in the same mouse across conditions (see individual methods sections for further details).
Genotypes
C57BL/6J, Agrp-IRES-Cre (“Agrp-Cre”, Jackson Laboratories, JAX, stock no. 012899), Trh-IRES-Cre (“Trh-Cre”, gift from Bradford B. Lowell), Npy-hrGFP (JAX stock no. 006417), and Pomc-eGFP (JAX, stock no. 009593) mice were used. Agrp-Cre mice have an internal ribosome entry site (IRES)-Cre inserted after the stop codon of the agouti related peptide gene (Agrp) on chromosome 8 73. Trh-Cre mice have an internal ribosome entry site (IRES)-Cre inserted after the stop codon of the thyrotropin-releasing hormone gene ((Trh) on chromosome 6 22. For the electrophysiology experiments, Trh-Cre mice were crossed with Npy-hrGFP mice to produce Trh-Cre;Npy-hrGFP mice, and with Pomc-eGFP mice to produce Trh-Cre;Pomc-eGFP mice.
Drugs
Leptin (R&D Systems, 498-OB), Liraglutide (Selleckchem, S8256), KCl (Sigma Aldrich, 7447-40-7), and NBQX (Abcam, ab120046), and DL-AP5 (Abcam, ab120004) was dissolved in saline at stock concentrations and stored at −20 °C until use. Picrotoxin (Abcam, ab120315) was dissolved in DSMO and stored at room temperature until use. For in vivo experiments, on the day of testing, the stock solution was thawed, diluted with saline, and delivered at a volume of 10 ml/kg at the following doses: Leptin (4 mg/kg) 28 and Liraglutide (0.2 mg/kg) 74. For in vitro slice experiments, drugs were diluted in 1X artificial cerebrospinal fluid (aCSF) at the following concentrations: leptin (100nM) 75, liraglutide (100nM) 16, KCl (10 mM), picrotoxin (25 uM), AP5 (20 uM) and NBQX (10 uM).
Viral Vectors for Functional and Connectivity Studies
AAV8-hSyn-DIO-mCherry (Addgene, 50459) was used to determine the optimal injection coordinates for target TrhArc , AAV1-hSyn-Flex-GCaMP6s (Addgene, 100845) was used for two-photon slice experiments to record calcium signaling in TrhArc neurons following application of liraglutide or leptin, pAAV-EF1alpha-dFlox-hChR2-mCherry (Addgene, 20297) was used for CRACM experiments evaluating the monosynaptic connection from TrhArc to AgRP arcuate neurons, pAAV-EF1alpha-dFlox-hChR2-eYFP (Addgene, 20298) was used for all optogenetic experiments and anterograde experiments, and AAV-DJ-CMV-DIO-EGFP-2A-TeNT (gift from Richard Palmiter) was used for experiments testing the necessity of Trh-Cre+ neurons for regulating body weight, food intake, and responses to liraglutide, leptin, and saline injections.
Virus Injections
Stereotaxic coordinates for TrhArc neurons were first determined by injecting AAV8-hSyn-DIO-mCherry at 100-micron intervals in the AP direction. Injections from −1.5 to −2.3 AP, 0.23 ML, and −5.7 DV were performed. 3-weeks later, the mice were sacrificed, perfused, and imaged.
After this validation, we determined the optimal coordinates to localize virus expression in TrhArc neurons were −2.20 AP, + − 0.23 ML, and −5.7 DV. During surgeries, mice were anesthetized with isoflurane, placed in a stereotaxic frame (Stoelting’s Just for Mouse), and provided with analgesia (meloxicam, 0.5 mg/kg). Following a small incision on top of the skull and skull leveling, a small hole was drilled for injection. A pulled-glass pipette (20–40 mm tip diameter) was inserted into the brain at coordinates aimed at the Arc (AP: −2.20, ML: + − 0.23, DV: −5.7), and 100 nL of virus was injected using a micromanipulator (Grass Technologies, Model S48 Stimulator, 25 nL/min). For in vivo optogenetic experiments targeting TrhArc terminals and AgRP soma in the arcuate, the virus was injected to target TrhArc neuron somas (AP: −2.20, ML: + − 0.23, DV: −5.7) and AgRP neuron somas (AP: −1.5, ML: + − 0.23, DV: −5.7). The pipette was pulled up 10 minutes after injection to reduce the backflow of the virus.
Rabies Injections for RAMPANT experiments
Agrp-Cre heterozygous mice were anesthetized with ketamine (80 mg/kg) and xylazine (10 mg/kg) diluted in phosphate-buffered saline (PBS). Mouse body temperature was maintained at 37 °C throughout the surgery with a closed loop infrared warming system (RightTemp Jr. or SomnoSuite, Kent Scientific). Once anesthetized, the mouse’s head was secured between the ear bars of a stereotaxic apparatus (Kopf). Local analgesic was provided by long-acting Bupivacaine (50-100nL; Nocita). After waiting 5 minutes for local analgesia effect, skin overlying the skull was incised and retracted to expose the skull surface. Next, a small craniotomy was drilled above the arcuate nucleus of the hypothalamus (Arc). A glass micropipette and Nanoject III microinjection system (Drummond Scientific) was used to inject into the bilateral ARC an adeno-associated virus (AAV) vector (AAV8-hSyn-FLEX-TVA-P2A-eGFP-2A-oG; titer, 3.10 x 10¹³ transduction units (TU)/mL; Salk Institute for Biological Studies; 400 nL total; 100 nL per injection; rate: 60 nL/second). Arc injection coordinates were based on “The Mouse Brain in Stereotaxic Coordinates” 76: AP: −1.48 mm, −1.62 mm, DV: −5.8 mm, ML +/− 0.2 mm. The pipette was slowly withdrawn from the injection site 5 minutes after each injection. The incised scalp was sutured closed with surgical glue (Vetbond). Mice were provided with Meloxicam Sustained-Release (ZooPharm; 5mg/kg; IP) for post-operative analgesia, 1 mL of lactated Ringers solution in 5% dextrose to support hydration, and returned to the vivarium once ambulatory. Three weeks after AAV injections, mice again underwent stereotactic surgery to receive bilateral injections of EnvA-rabies-deltaG-H2b-mCherry into the ARC (400nL total; coordinates above; titer: 7.35 x 10⁹ TU/ml; Salk Institute for Biological Studies). After recovery, mice were returned to their home cage and allowed to recover for 5 days before brain tissue was harvested.
AAV-H2b-mCherry Injections
A separate cohort of Agrp-Cre mice (n=5; 4 male and 1 female; mean age: 13 weeks old +/− 8 weeks) underwent stereotactic surgery as described above, except to inject AAV9-DIO-H2b-mCherry (plasmid gifted by Dr. Bradford B. Lowell) into the bilateral ARC (400nL total; coordinates above; titer: 3.94 x 10¹³ genome copies (GC)/mL; Vigene). After recovery, mice were returned to their home cage and allowed to recover for 3 weeks before tissue was harvested for sequencing.
Feeding Conditions for RAMPANT experiments
Five days after rabies injection, each mouse underwent one of three feeding conditions: ad libitum feeding (“fed”), restricted from food for 13 hours (“fasted”), or restricted from food for 12 hours and then given ab libitum access to food for 2 hours (“post-fast re-fed”). Tissue harvest was performed at approximately the same time of day (+/− 1 hour) to minimize circadian effects on gene expression. All mice were allowed ad libitum access to water for the entirety of the experiment. Body weight of each mouse was documented before and after fasting and re-feeding to assess weight loss in fasted mice and weight regain in post-fast re-fed mice(Fig. S5A–C).
Single-Nuclei RNA-Sequencing
Mice were rapidly decapitated without anesthesia for brain extraction to avoid stress and anesthesia-related changes in nuclear mRNA. Brains were immediately extracted and coronally sectioned at 500 um intervals through the hypothalamus (Bregma +0.14mm to −2.92mm) using a compresstome (VF-200-0Z Legacy Compresstome; Precisionary Instruments). Brain sections were immediately immersed in ice-cold RNAprotect reagent (Qiagen, catalog # 76106) to preserve RNA. Brain sections remained in RNAprotect in the dark overnight at 4 °C. The following day, brain sections were visualized under a fluorescence stereomicroscope (Zeiss Discovery V8) and regions of interest visibly containing H2b-mCherry+ nuclei were microdissected into chilled microcentrifuge tubes. Tissue samples were then stored at −80 °C for no longer than 2 weeks.
Once all samples for each batch were collected, tissue samples were thawed on ice and pooled by region and feeding condition. Tissue was dounce homogenized and purified by density gradient centrifugation into a single-nuclei suspension as previously described 25,77, but with the following modifications: In Batch 2, TruSeq anti-Nuclear Pore Complex Proteins Hashtags were applied to track the brain region of origin for each cell nuclei (BioLegend, CAT: 682205, 682207, 682209). We counterstained nuclei with a far-red DNA fluorescent intercalator, DRAQ5 (Thermo Fisher, catalog #62251, 1:500 dilution in sample) and kept them chilled on ice until sorting. We sorted single, DRAQ5+/mCherry+ nuclei using the Becton Dickenson FACS Aria Fusion (sample batch 1) or Becton Dickenson Influx (batch 2) cell sorters. All sorts were performed with SCYM (ASCP) certified technical assistance at the University of Virginia Flow Cytometry Core, using an 85 micron nozzle and set to purity mode. To separate nuclei from non-nucleated debris, we gated for events with high relative intensity of DRAQ5 fluorescence, using a 640nm excitation and a 670/30 collection filter. We then gated the nuclei by forward scatter area vs. side scatter area to eliminate large aggregates, followed by forward scatter area vs. forward scatter height to select for singlets. Finally, from the single nuclei, we selected mCherry+ nuclei based on their high relative fluorescence, excitation 561nm and 610/20 collection filter.
We sorted mCherry+ nuclei into 18.8uL of RT Reagent B from the 10x Genomics Chromium Next GEM Single Cell 3′ Kit v3.1, added the remainder of the kit Step 1 master mix reagents to the capture tube, plus enough resuspension buffer to reach a total volume of 75 uL. We then processed the sample into complementary DNA (cDNA) sequencing libraries according to the manufacturer’s instructions (10X Genomics, CG000204 Rev D). Hashtag oligonucleotide (HTO) libraries were prepared according to a previously published protocol 78, with the following modification: double-sided SPRI (solid phase reversible immobilization) was repeated for a total of two times to cleanly separate HTO libraries from cDNA libraries after amplification and, if needed, just prior to pooling libraries for sequencing. Libraries were sequenced at a concentration of 1.85 pM and with a 75-cycle, high-output kit on the Illumina NextSeq 550 according to the manufacturer’s instructions.
Sequencing Data Processing and Analysis
The 10X Genomics Cell Ranger pipeline (version 5.0) was used to map reads to the mouse reference transcriptome (mm10-2020-A) and quantify Unique Molecular Identifier (UMI)-corrected, gene-level expression values. Introns were included using the Cell Ranger include-introns parameter. The Cellbender software package was used to mitigate the effects of contaminating ambient RNA on our analysis 79,80. For libraries containing HTOs, the Seurat HTODemux() function was used to match each single nuclei transcriptome to a brain region-specific HTO. snRNA-seq feature-barcode matrices were analyzed in R (version 4.2.3) with Seurat v4.3.0 package 81.
We applied filters to each library based on their library specific distribution of quality metrics (parameters shown in Fig. S2). Libraries containing HTOs were filtered to remove any suspected doublets and HTO-negative cells. All 4 libraries were then integrated to correct for technical variance including batch effects 81. In brief, we log-normalized the data, selected 2,000 most variable genes for each batch (“feature selection”); integrated the libraries using the IntegrateData() function in Seurat; scaled each gene; performed Principal Component Analysis (PCA) to reduce linearly the dimensionality of the highly variable gene space; clustered the cells using the Louvian algorithm, based on Euclidean distance in the PCA space comprising the first 50 principal components (PCs) with a resolution value of 1.0; and performed non-linear dimensionality reduction by Uniform Manifold Approximation and Projection (McInnes, Healy, and Melville 2018) for visualizing the clustered data in two dimensions. Cluster relatedness in PCA space was illustrated with dendrograms using the BuildClusterTree() function in Seurat.
Cell clusters were separated into three brain region-specific datasets according to each cluster’s HTO content. Clusters containing 5% or more cells labeled with a regional HTO were included in the corresponding regional dataset, accordingly. Clusters with more than one regional HTO, potentially representing cells near regional borders, were expected as an artifact of dissection. Each regional dataset was then re-clustered, including the steps of feature selection, PCA, and UMAP visualization. PC and resolution settings for each regional dataset are described in Supplemental Figure 2. Supervised cell type annotation 29 was performed for Arc cell clusters using cell type labels from a previously published database of Arc neuron molecular subtypes 28. For this, a weighted vote classifier derived from the reference cell identities was used to predict cell identities for each rabies+ cell using Seurat’s FindTransferAnchors() function. Following integration, Seurat’s TransferData() function was used to transfer cell type labels and calculate cell-type prediction scores for each Arc rabies+ cell. Prediction scores are values between 0 to 1 which reflect the confidence of each cell-type prediction. Cells with prediction scores <0.5 were excluded from further analysis.
RNA Fluorescence In Situ Hybridization (RNA FISH)
RNA FISH experiments were performed on brain tissue from mice that underwent monosynaptic rabies tracing from Agrp-Cre cells of the arcuate hypothalamus. Mice were terminally anesthetized with ketamine (80 mg/kg) and xylazine (10 mg/kg) diluted in PBS, followed by transcardial perfusion with 0.9% saline plus heparin and 4% paraformaldehyde (Thomas Scientific). Brains were extracted and post-fixed for 24 h at 4 °C. Following fixation, brains were sectioned coronally at 35 um thickness on a vibratome (Leica VT1000S).
The day before RNA FISH, sections were rinsed in PBS and then mounted on slides (Fisher Scientific) and left to dry overnight. An ImmEdge Hydrophobic Barrier Pen (Vector Laboratories) was used to draw a barrier around the sections. The sections were then incubated in Protease IV in a HybEZ II Oven for 30 min at 40 °C, followed by incubation with the target probe (Slc6a3, Ghrh, Trh, or Pomc) for 2 hr at 40 °C. Slides were then treated with AMP 1-3, HRP-C1, HRP-C2, HRP-C3, and HRP Blocker for 15–30 min at 40 °C, as previously described (Wang et al., 2012). TSA Plus Cy5 (Akoya Biosciences) was used for probe visualization. Rabies-H2b-mCherry was visualized using immunofluorescence with a rabbit anti-RFP primary antibody (Rockland Cat# 600-401-379, 1:1000) overnight at room temperature and a donkey anti-rabbit 550 secondary antibody (Thermo Scientific Cat# PISA510039, 1:1000) for 2 hours at room temperature.
Sections were coverslipped with mounting medium plus DAPI (Vector Laboratories, CAT#: H-1200), and sealed with fingernail polish. Figure images were taken as Z-stacks using a confocal microscope (Zeiss LMS800). Optimal Z depth and slice interval were determined empirically for each image (20x, range of 6-14.85 um, 4-12 slices; 63x, range of 3.6-8 um, 5-31 slices). Z-stack images were compressed into a single image using ImageJ, with the projection type set to Maximum Intensity. For quantification, sections were imaged using a Revolve R4 fluorescence microscope (ECHO, RVL-100G). Anatomical borders were approximated based on the “The Mouse Brain in Stereotaxic Coordinates” 76.
Optical Fiber Implantation
For in vivo optogenetic experiments targeting the TrhArc soma, an optic-fiber cannula (200um diameter core; CFMLC22U-20, Thor Labs) was implanted directly over the Arc (AP: −2.20, ML: + 0.3, DV: −5.60) following virus injection and fixed to the skull (C&B-Metabond Quick Adhesive Cement/dental acrylic). For in vivo optogenetic experiments targeting AgRP neuron somas and/or TrhArc terminals, an optic fiber was placed directly over AgRP neuron somas (AP: −1.5, ML: + − 0.23, DV: −5.6). After recovery, mice were singly housed and allowed to recover for >3 weeks before further experimentation.
Optogenetic Behavior Paradigm
For all optogenetic experiments, mice were habituated to the photostimulation setup and the FED3 device 2-3 times. Fiber optic cables (200mm diameter, Doric Lenses) coupled to lasers were attached to the fiber cannula of the mice via zirconia sleeves (Doric Lenses). Light was delivered to the brain through an optical fiber (200um diameter core; CFMLC22U-20, Thor Labs). Light power exiting the fiber tip was 10mW for all optogenetic experiments.
For photostimulation, pulse trains (20HZ; 2 sec on, 2 sec off; 473nm from Laserglow laser technologies) were programmed using a waveform generator (PCGU100; Valleman Instruments) for continuous photostimulation during all tasks. For fasted photostimulation experiments, mice were fasted for ~18 hours overnight, and photostimulation experiments were conducted at 08:00–11:00 hours, near the beginning of the light cycle when food intake was low. For sated photostimulation experiments, photostimulation experiments were conducted at the onset of the dark cycle when food intake was high. For priming experiments, mice were stimulated for 1 hour before food presentation, stimulation was turned off, and food was presented.
Food Intake from Feeding Experimentation Devices (FED3)
Feeding information was collected using FED3 devices 54, which dispense 20 mg pellets of chow food ad libitum. In all experiments using the FED3 device, mice were habituated to the device in the homecage for at least one day. Mice were considered trained on the FED3 when they consumed at least 200 pellets in a day (4 grams).
Loss-of-Function Studies with Tetanus Toxin
Mice were single-housed and separated into two groups: Trh-Cre mice injected with Cre-dependent AAV-TeNT (tetanus toxin) and C57BL/6J mice injected with the same AAV, both with standard housing conditions and ad libitum access to food and water unless otherwise specified.
For experiments involving injections of liraglutide, leptin, or vehicle, both groups of mice were initially matched for age and weight, and habituated three times to the protocol before experiments began. The protocol consisted of removing the standard diet from each cage 3 hours before the onset of the dark cycle, injecting saline, liraglutide, or leptin 30 minutes before the onset of the dark cycle, and reintroducing a FED3 device set to ad-libitum pellet mode at the onset of the dark cycle. Baseline measurements were taken after surgery but before viral expression had occurred, and experimental measurements were collected approximately 8 weeks after surgery.
The same mice injected with liraglutide, leptin, and vehicle were also used to measure the long-term effects of TeNT on feeding and body weight. Baseline measurements were taken after the mice had been singly housed for 1 week. Six baseline measurements of body weight and food intake were averaged together per mouse. Experimental measurements began three weeks after AAV injection surgery.
Ex Vivo Calcium Imaging
Trh-Cre mice of age 2-3 months were injected with AAV1-hSyn-Flex-GCaMP6s (Addgene, 100845). More than 3 weeks after surgery, mice were anesthetized by isoflurane and decapitated. The brain was quickly extracted and immediately placed into ice-cold, carbogen-saturated (95% O2, 5% CO2), choline cutting solution (in mM): 2.5 KCl; 1.25 NaH2PO4; 20 HEPES; 10 MgSO4.7H20; 0.5 CaCl2; 92 Choline Chloride; 25 Glucose; 2 Thiorea; 5 Sodium Ascorbate; 3 Sodium Pyruvate; and 30 NaHCO3 (pH 7.3 - 7.6). Then, 275 μm thick coronal sections of the Arc were cut with a Campden Instruments 7000smz-2 Vibrotome. Slices were settled in the same carbogen-saturated cutting solution for 10 minutes at 36 °C, and then incubated at 36 °C in oxygenated aCSF for 60 minutes (in mM): 125 NaCl; 21.4 NaHCO3; 2.5 KCl; 1.2 NaH2PO4; 1.4 CaCl2; 10 Glucose; and 1.2 MgCl2. Slices were maintained and recorded at room temperature (20-24 °C) until transferred to an immersion-recording chamber and superfused at a rate of 2.5 ml min−1.
Two-photon imaging was performed using a multiphoton laser scanning microscope (Olympus FVMPE-RS) at 33.3 frames/second and 512x512 pixels/frame as described previously (Lutas et al., 2022). An InSight X3 laser (Spectra-Physics) was used to excite the fluorophore (920 nm), and the emission light was filtered (green: 495 - 540 nm) before collection with a GaAsP photomultiplier tube. The XY scanning was performed using resonant/galvo mirrors, and the Z scanning was performed by motorized z-axis (Avg Slice Number: 27 , Step-size: 5 um , Avg cycle rate: 31.73 s). For two-photon imaging of acute brain slices, slices were transferred to a recording chamber perfused with aCSF (oxygenated with 95% O2 and 5% CO2; flow rate: 2-5 mL/min) at room temperature. Imaging was performed with a 20x 1.0 NA water-immersion objective (Olympus). The excitation wavelength used was 920 nm.
Data Processing and Analysis for Ex Vivo Calcium Imaging
Following data acquisition, Olympus Fluoview files (.oif) were opened in Fiji (ImageJ). A grouped z-project was used to obtain the max intensity across z-stacks, rigid body registration was used to reduce motion artifacts (TurboReg), and then the z-project was used to get an average intensity projection over the course of the recording. This max z-projection was exported to Cellpose2.0 82 (Mouseland), and the “cyto” model was used to automatically select ROIs. Based on the model performance, ROIs were manually added or deleted. ROIs were exported back to Fiji, and the change in fluorescence was calculated by subtracting the 5 minute baseline fluorescence (F0(t)) from F(t), then dividing by F0(t): DF/F(t) = (F(t) - F0(t))/F0(t) for each ROI. To calculate “responsive” cells, the Z-score for each ROI was calculated by subtracting the mean change in fluorescence during the 5 minute baseline period from F(t) and dividing by the standard deviation of mean fluorescence from the 5 minute baseline period. Cells were “responsive” if the average Z-score during the 10-min wash on period of either saline, liraglutide, or leptin was above or below 1.645. These results were exported to Prism for further analysis.
Ex Vivo Whole-cell Patch Clamp Electrophysiology
Channelrhodopsin (ChR2)-assisted circuit mapping (CRACM) was performed. CRACM involves in vivo targeted expression of ChR2, a photo-excitable cation channel, in presumptive presynaptic upstream neurons (and their terminals), followed by ex vivo electrophysiologic assessment in acute brain slices of light-evoked postsynaptic currents in candidate downstream neurons. Trh-Cre;Npy-hrGFP or Trh-Cre;Pomc-eGFP (6-12 weeks) received bilateral 100 nl injections of AAV9-EF1alpha-dFlox-hChR2-mCherry in the Arc. Four to 6 weeks later, brain slices were obtained and stored at 30 °C in a heated, oxygenated chamber containing aCSF (in mmol/L) 124 NaCl, 4 KCl, 2 CaCl2, 1.2 MgSO4, 1 NaH2PO4, 10 glucose, and 26 sodium bicarbonate before being transferred to a submerged recording chamber maintained at 30 °C (Warner Instruments, Hamden, CT). Recording electrodes (3-5 MOhm) were pulled with a Flaming-Brown Micropipette Puller (Sutter Instruments, Novato, CA) using thin-walled borosilicate glass capillaries. Light-evoked inhibitory postsynaptic currents (IPSCs) were measured in voltage-clamp mode using electrodes filled with an intracellular recording solution containing (in mM): 130 CsCl, 1 EGTA, 10 HEPES, 2 Mg-ATP, 0.2 Na-GTP. To isolate GABAergic synaptic transmission, Kynurenic acid (3mM) was included in the bath aCSF, and the Npy GFP+ neurons held at −70mV. Light evoked IPSCs was recorded in the presence of Tetrodotoxin (TTX, 500 nM) and 4-aminopyridine (4-AP, 100 mM).
Rabies Injections for TrhArc Neuron Tracing
Monosynaptic rabies tracing was performed in Trh-Cre mice (n=3, age 2-3 months) using the same viruses described above. Brain tissue was harvested 7 days after injection with [EnvA]rabies-H2b-mCherry. Anatomical borders for quantified regions were established using “The Mouse Brain in Stereotaxic Coordinates” 76.
Perfusion and Histology
After completing behavioral experiments, mice with viral injections and/or optical implants were terminally anesthetized using chloral hydrate (Sigma-Aldrich, 301-17-0) and transcardially perfused first with phosphate-buffered saline (PBS) followed by 10% neutral buffered formalin (Fisher Scientific, SF100). Brains were removed, post-fixed, and dehydrated in 30% sucrose before sectioning into 30–50 um slices using a freezing sliding microtome (Leica Biosystems). Coronal sections were collected and stored at 4 °C. Slices were mounted with a mounting medium containing DAPI (Vectashield, H-1200-10), and images were captured using a 10X objective on an Olympus VS200 Scanscope and 20x objective on a Zeiss Observer Z1 confocal microscope.
Statistical Analysis
GraphPad Prism 10 was used for statistical analysis, and GraphPad Prism10 and Adobe Illustrator 2020 were used to generate graphs. For discrete comparisons between two groups, two-tailed t-tests were used. For comparisons across groups or between groups over time, repeated measures one-way or two-way ANOVAs were used, respectively, with corresponding post hoc tests adjusted for multiple comparisons. Normality and equal variances were assumed. Mice were randomly assigned to groups but were matched for age, sex, and body weight. Except for the RNA FISH quantitative analysis, experimenters were not blinded to conditions during testing and analysis. Power analyses were not used to determine sample sizes, however, group sizes were chosen to match similar studies.
Supplementary Material
Key resources table
| REAGENT or RESOURCE | SOURCE | IDENTIFIER |
|---|---|---|
| Antibodies | ||
| anti-RFP primary antibody | Rockland | Cat# 600-401-379 |
| anti-rabbit 550 secondary antibody | Thermo Scientific | Cat# PISA510039 |
| TotalSeq™-A 0451 anti-Nuclear Pore Complex Proteins Hashtag 1 Antibody | BioLegend | Cat# 682205 |
| TotalSeq™-A 0452 anti-Nuclear Pore Complex Proteins | BioLegend | Cat# 682207 |
| Hashtag 2 Antibody | ||
| TotalSeq™-A 0453 anti-Nuclear Pore Complex Proteins Hashtag 3 Antibody | BioLegend | Cat# 682209 |
| Bacterial and virus strains | ||
| AAV8-hSyn-FLEX-TVA-P2A-eGFP-2A-oG | Salk Institute for Biological Studies | Custom Prep. by GT3 Core |
| EnvA-rabies-deltaG-H2b-mCherry | Salk Institute for Biological Studies | Custom Prep. by GT3 Core |
| AAVDJ-DIO-H2b-mCherry | Tao et al., 2021 | NA |
| AAV8-hSyn-DIO-mCherry | Addgene | 50459 |
| AAV1-hSyn-Flex-GCaMP 6s | Addgene | 100845 |
| pAAV-EF1alpha-dFlox-hChR2-mCherry | Addgene | 20297 |
| pAAV-EF1alpha-dFlox-hChR2-eYFP | Addgene | 20298 |
| AAV-DJ-CM V-DIO-EGFP-2A-TeNT | gifted from Richard Palmiter | |
| Chemicals, peptides, and recombinant proteins | ||
| Leptin | R & D Systems | 498-OB |
| Liraglutide | Selleckchem | S8256 |
| KCl | Sigma Aldrich | 7447-40-7 |
| Picrotoxin | Abcam | ab120315 |
| NBQX | Abcam | ab120046 |
| DL-AP5 | Abcam | ab120004 |
| TSA Plus Cy5 | Akoya Biosciences | Cat# TS-000203 |
| Critical commercial assays | ||
| RNAscope Multiplex Fluorescent Reagent Kit v2 | Advanced Cell Diagnostics | Cat# 323110 |
| RNAscope H202 and Protease Reagents | Advanced Cell Diagnostics | Cat# 322381 |
| Chromium Next GEM Chip M Single Cell Kit | 10X Genomics | Cat# 1000371 |
| Deposited data | ||
| Raw and processed single-nucli RNA-seq data files | GEO | |
| Clustered single nuclei RNA-seq data | Broad Single Cell Portal | |
| Experimental models: Organisms/strains | ||
| Mouse/Agrp-IRES-Cre | Jackson Laboratories, Tong et al., 2008 (PMID:19160495) | CAT# 012899; RRID:IMSR_JAX:012899 |
| Mouse/Trh-I RES-Cre | Jackson Laboratories, Krashes et al., 2014 (PMID: 24487620) | Cat# 032468; RRID:IMSR_JAX:032468 |
| Mouse/Npy-hrGFP | Jackson Laboratories, van den Pol et al., 2009 (PMID:19357287) | Cat# 006417; RRID:IMSR_JAX:006417 |
| Mouse/Pomc-eGFP | Jackson Laboratories, Cowley et al., 2001 (PMID: 11373681) | Cat# 009593; RRID:IMSR_JAX:009593 |
| Oligonucleotides | ||
| Mm-Slc6a3-C3 | Advanced Cell Diagnostics | Cat#: 315441-C3 |
| Mm-Ghrh-C3 | Advanced Cell Diagnostics | Cat#: 470991-C3 |
| Mm-Trh | Advanced Cell Diagnostics | Cat#: 436811 |
| Mm-Pomc-C2 | Advanced Cell Diagnostics | Cat #: 314081-C2 |
| Recombinant DNA | ||
| Software and algorithms | ||
| Cell Ranger v5.0 | 10x Genomics | https://support.10xgenomics.com/single-cell-gene-expression/software/pipelines/latest/what-is-cell-ranger; RRID:SCR_017344 |
| bcl2fastq v2.20.0 | Illumina | https://support.illumina.com/sequencing/sequencing_software/bcl2fastq-conversion-software.html RRID: SCR_015058 |
| R | version 4.2.3 | https://www.r-proiect.org/ RRID:SCR_001905 |
| Seurat v4.3.0 | Stuart et al., 2019 | https://github.com/satiialab/seurat RRID:SCR_016341 |
| Seurat code used from cell clustering | Zenodo | |
| Illustrator | Adobe | https://www.adobe.com; RRID:SCR_010279 |
| Excel | Microsoft | https://www.microsoft.com/en-us/; RRID:SCR_016137 |
| ImageJ | version 2.9.0 | https://imagej.net/software/fiji/ RRID:SCR_003070 |
| Mouseland Cellpose | version 2.2.2 | https://github.com/MouseLand/cellpose |
| FED3 Software | version 1.16.3 | https://github.com/KravitzLabDevices/FED3_library |
| Other | ||
| FED3 devices | Matikainen-Ankney et al., 2021 | https://github.com/KravitzLabDevices/FED3 |
ACKNOWLEDGMENTS
We gratefully acknowledge technical support of Maisie Crook, Nicholas Conley, Catherine Bundon, and Ruei-Jen Abraham-Fan, and Jinhua Cang and Xiaorong Liu for the use of their confocal microscope. T.H.P. acknowledges the Novo Nordisk Foundation (unconditional donation to the Novo Nordisk Foundation Center for Basic Metabolic Research; grant number NNF18CC0034900) and the Danish Council for Independent Research (Grant number 8045-00091B). This work was supported in part by the GT3 Core Facility of the Salk Institute with funding from NIH-NCI CCSG: P30 CA01495, an NINDS R24 Core Grant and funding from NEI. Cell sorting and cytometry was performed by the University of Virginia Flow Cytometry Core Facility (RRid:SCR_017829), which is partially supported by the National Cancer Center (award, P30 CA044579). Sequencing on the Illumina Next-Seq platform was performed by the Genomics Core of the Biology Department at University of Virginia and by the Genome Analysis and Technology Core of University of Virginia’s School of Medicine (RRID:SCR_018883). This research was funded by: a University of Virginia Brain Institute Fellowship to A.N.W.; American Diabetes Association Pathway to Stop Diabetes (Initiator Award 1-18-INI-14), National Heart, Lung, and Blood Institute (R01 HL153916), and National Eye Institute (R21 EY033528) awards to J.N.C.; by the Intramural Research Program of the National Institutes of Health and National Institute of Diabetes and Digestive and Kidney Diseases (DK075088 and DK075087-06) awards to M.J.K.
DATA AND CODE AVAILABILITY
The raw and processed snRNA-seq data are available at the Gene Expression Omnibus (GEO) repository at GEO accession number #####. The code for further processing and analyzing the data using Seurat can be found at Zenodo record number #####. The whole RAMPANT dataset (all-rabies) and its Arc-only subset are each available for user-friendly exploration and visualization through the Broad Single Cell Portal at these links: all-rabies, #####; Arc-only, #####. R data files (.RDS) of these fully processed and analyzed datasets can be downloaded directly from their Broad Single Cell Portal site. All other raw and processed data are available from the corresponding authors upon request.
REFERENCES
- 1.Sisley S., Gutierrez-Aguilar R., Scott M., D’Alessio D.A., Sandoval D.A., and Seeley R.J. (2014). Neuronal GLP1R mediates liraglutide’s anorectic but not glucose-lowering effect. The Journal of clinical investigation 124, 2456–2463. 10.1172/JCI72434. [DOI] [PMC free article] [PubMed] [Google Scholar]
- 2.Secher A., Jelsing J., Baquero A.F., Hecksher-Sorensen J., Cowley M.A., Dalboge L.S., Hansen G., Grove K.L., Pyke C., Raun K., et al. (2014). The arcuate nucleus mediates GLP-1 receptor agonist liraglutide-dependent weight loss. The Journal of clinical investigation 124, 4473–4488. 10.1172/JCI75276. [DOI] [PMC free article] [PubMed] [Google Scholar]
- 3.Bruning J.C., and Fenselau H. (2023). Integrative neurocircuits that control metabolism and food intake. Science 381, eabl7398. 10.1126/science.abl7398. [DOI] [PubMed] [Google Scholar]
- 4.Rupp A.C., Tomlinson A.J., Affinati A.H., Yacawych W.T., Duensing A.M., True C., Lindsley S.R., Kirigiti M.A., MacKenzie A., Polex-Wolf J., et al. (2023). Suppression of food intake by Glp1r/Lepr-coexpressing neurons prevents obesity in mouse models. The Journal of clinical investigation 133. 10.1172/JCI157515. [DOI] [PMC free article] [PubMed] [Google Scholar]
- 5.Merchenthaler I., Lane M., and Shughrue P. (1999). Distribution of pre-pro-glucagon and glucagon-like peptide-1 receptor messenger RNAs in the rat central nervous system. The Journal of comparative neurology 403, 261–280. . [DOI] [PubMed] [Google Scholar]
- 6.Cork S.C., Richards J.E., Holt M.K., Gribble F.M., Reimann F., and Trapp S. (2015). Distribution and characterisation of Glucagon-like peptide-1 receptor expressing cells in the mouse brain. Mol Metab 4, 718–731. 10.1016/j.molmet.2015.07.008. [DOI] [PMC free article] [PubMed] [Google Scholar]
- 7.Fortin S.M., Lipsky R.K., Lhamo R., Chen J., Kim E., Borner T., Schmidt H.D., and Hayes M.R. (2020). GABA neurons in the nucleus tractus solitarius express GLP-1 receptors and mediate anorectic effects of liraglutide in rats. Sci Transl Med 12. 10.1126/scitranslmed.aay8071. [DOI] [PMC free article] [PubMed] [Google Scholar]
- 8.Imbernon M., Saponaro C., Helms H.C.C., Duquenne M., Fernandois D., Deligia E., Denis R.G.P., Chao D.H.M., Rasika S., Staels B., et al. (2022). Tanycytes control hypothalamic liraglutide uptake and its anti-obesity actions. Cell metabolism 34, 1054–1063 e1057. 10.1016/j.cmet.2022.06.002. [DOI] [PMC free article] [PubMed] [Google Scholar]
- 9.Deem J.D., Faber C.L., and Morton G.J. (2022). AgRP neurons: Regulators of feeding, energy expenditure, and behavior. FEBS J 289, 2362–2381. 10.1111/febs.16176. [DOI] [PMC free article] [PubMed] [Google Scholar]
- 10.Andermann M.L., and Lowell B.B. (2017). Toward a Wiring Diagram Understanding of Appetite Control. Neuron 95, 757–778. 10.1016/j.neuron.2017.06.014. [DOI] [PMC free article] [PubMed] [Google Scholar]
- 11.Aponte Y., Atasoy D., and Sternson S.M. (2011). AGRP neurons are sufficient to orchestrate feeding behavior rapidly and without training. Nature neuroscience 14, 351–355. 10.1038/nn.2739. [DOI] [PMC free article] [PubMed] [Google Scholar]
- 12.Atasoy D., Betley J.N., Su H.H., and Sternson S.M. (2012). Deconstruction of a neural circuit for hunger. Nature 488, 172–177. 10.1038/nature11270. [DOI] [PMC free article] [PubMed] [Google Scholar]
- 13.Krashes M.J., Koda S., Ye C., Rogan S.C., Adams A.C., Cusher D.S., Maratos-Flier E., Roth B.L., and Lowell B.B. (2011). Rapid, reversible activation of AgRP neurons drives feeding behavior in mice. The Journal of clinical investigation 121, 1424–1428. 10.1172/JCI46229. [DOI] [PMC free article] [PubMed] [Google Scholar]
- 14.Beutler L.R., Chen Y., Ahn J.S., Lin Y.C., Essner R.A., and Knight Z.A. (2017). Dynamics of Gut-Brain Communication Underlying Hunger. Neuron 96, 461–475 e465. 10.1016/j.neuron.2017.09.043. [DOI] [PMC free article] [PubMed] [Google Scholar]
- 15.Dong Y., Carty J., Goldstein N., He Z., Hwang E., Chau D., Wallace B., Kabahizi A., Lieu L., Peng Y., et al. (2021). Time and metabolic state-dependent effects of GLP-1R agonists on NPY/AgRP and POMC neuronal activity in vivo. Mol Metab 54, 101352. 10.1016/j.molmet.2021.101352. [DOI] [PMC free article] [PubMed] [Google Scholar]
- 16.He Z., Gao Y., Lieu L., Afrin S., Cao J., Michael N.J., Dong Y., Sun J., Guo H., and Williams K.W. (2019). Direct and indirect effects of liraglutide on hypothalamic POMC and NPY/AgRP neurons - Implications for energy balance and glucose control. Mol Metab 28, 120–134. 10.1016/j.molmet.2019.07.008. [DOI] [PMC free article] [PubMed] [Google Scholar]
- 17.Garfield A.S., Shah B.P., Burgess C.R., Li M.M., Li C., Steger J.S., Madara J.C., Campbell J.N., Kroeger D., Scammell T.E., et al. (2016). Dynamic GABAergic afferent modulation of AgRP neurons. Nature neuroscience 19, 1628–1635. 10.1038/nn.4392. [DOI] [PMC free article] [PubMed] [Google Scholar]
- 18.Wall N.R., Wickersham I.R., Cetin A., De La Parra M., and Callaway E.M. (2010). Monosynaptic circuit tracing in vivo through Cre-dependent targeting and complementation of modified rabies virus. Proceedings of the National Academy of Sciences of the United States of America 107, 21848–21853. 10.1073/pnas.1011756107. [DOI] [PMC free article] [PubMed] [Google Scholar]
- 19.Wickersham I.R., Finke S., Conzelmann K.K., and Callaway E.M. (2007). Retrograde neuronal tracing with a deletion-mutant rabies virus. Nature methods 4, 47–49. 10.1038/nmeth999. [DOI] [PMC free article] [PubMed] [Google Scholar]
- 20.Wickersham I.R., Lyon D.C., Barnard R.J., Mori T., Finke S., Conzelmann K.K., Young J.A., and Callaway E.M. (2007). Monosynaptic restriction of transsynaptic tracing from single, genetically targeted neurons. Neuron 53, 639–647. 10.1016/j.neuron.2007.01.033. [DOI] [PMC free article] [PubMed] [Google Scholar]
- 21.Wang D., He X., Zhao Z., Feng Q., Lin R., Sun Y., Ding T., Xu F., Luo M., and Zhan C. (2015). Whole-brain mapping of the direct inputs and axonal projections of POMC and AgRP neurons. Front Neuroanat 9, 40. 10.3389/fnana.2015.00040. [DOI] [PMC free article] [PubMed] [Google Scholar]
- 22.Krashes M.J., Shah B.P., Madara J.C., Olson D.P., Strochlic D.E., Garfield A.S., Vong L., Pei H., Watabe-Uchida M., Uchida N., et al. (2014). An excitatory paraventricular nucleus to AgRP neuron circuit that drives hunger. Nature 507, 238–242. 10.1038/nature12956. [DOI] [PMC free article] [PubMed] [Google Scholar]
- 23.Huang K.W., and Sabatini B.L. (2020). Single-Cell Analysis of Neuroinflammatory Responses Following Intracranial Injection of G-Deleted Rabies Viruses. Front Cell Neurosci 14, 65. 10.3389/fncel.2020.00065. [DOI] [PMC free article] [PubMed] [Google Scholar]
- 24.Bakken T.E., Hodge R.D., Miller J.A., Yao Z., Nguyen T.N., Aevermann B., Barkan E., Bertagnolli D., Casper T., Dee N., et al. (2018). Single-nucleus and single-cell transcriptomes compared in matched cortical cell types. PloS one 13, e0209648. 10.1371/journal.pone.0209648. [DOI] [PMC free article] [PubMed] [Google Scholar]
- 25.Habib N., Li Y., Heidenreich M., Swiech L., Avraham-Davidi I., Trombetta J.J., Hession C., Zhang F., and Regev A. (2016). Div-Seq: Single-nucleus RNA-Seq reveals dynamics of rare adult newborn neurons. Science 353, 925–928. 10.1126/science.aad7038. [DOI] [PMC free article] [PubMed] [Google Scholar]
- 26.Lake B.B., Codeluppi S., Yung Y.C., Gao D., Chun J., Kharchenko P.V., Linnarsson S., and Zhang K. (2017). A comparative strategy for single-nucleus and single-cell transcriptomes confirms accuracy in predicted cell-type expression from nuclear RNA. Sci Rep 7, 6031. 10.1038/s41598-017-04426-w. [DOI] [PMC free article] [PubMed] [Google Scholar]
- 27.Patino M., Lagos W.N., Patne N.S., Tasic B., Zeng H., and Callaway E.M. (2022). Single-cell transcriptomic classification of rabies-infected cortical neurons. Proceedings of the National Academy of Sciences of the United States of America 119, e2203677119. 10.1073/pnas.2203677119. [DOI] [PMC free article] [PubMed] [Google Scholar]
- 28.Campbell J.N., Macosko E.Z., Fenselau H., Pers T.H., Lyubetskaya A., Tenen D., Goldman M., Verstegen A.M., Resch J.M., McCarroll S.A., et al. (2017). A molecular census of arcuate hypothalamus and median eminence cell types. Nature neuroscience 20, 484–496. 10.1038/nn.4495. [DOI] [PMC free article] [PubMed] [Google Scholar]
- 29.Stuart T., and Satija R. (2019). Integrative single-cell analysis. Nat Rev Genet 20, 257–272. 10.1038/s41576-019-0093-7. [DOI] [PubMed] [Google Scholar]
- 30.Chadwick S.R., and Guler A.D. (2022). Local Drd1-neurons input to subgroups of arcuate AgRP/NPY-neurons. iScience 25, 104605. 10.1016/j.isci.2022.104605. [DOI] [PMC free article] [PubMed] [Google Scholar]
- 31.Henry F.E., Sugino K., Tozer A., Branco T., and Sternson S.M. (2015). Cell type-specific transcriptomics of hypothalamic energy-sensing neuron responses to weight-loss. Elife 4. 10.7554/eLife.09800. [DOI] [PMC free article] [PubMed] [Google Scholar]
- 32.Tartaglia L.A., Dembski M., Weng X., Deng N., Culpepper J., Devos R., Richards G.J., Campfield L.A., Clark F.T., Deeds J., et al. (1995). Identification and expression cloning of a leptin receptor, OB-R. Cell 83, 1263–1271. 10.1016/0092-8674(95)90151-5. [DOI] [PubMed] [Google Scholar]
- 33.Chen H., Charlat O., Tartaglia L.A., Woolf E.A., Weng X., Ellis S.J., Lakey N.D., Culpepper J., Moore K.J., Breitbart R.E., et al. (1996). Evidence that the diabetes gene encodes the leptin receptor: identification of a mutation in the leptin receptor gene in db/db mice. Cell 84, 491–495. 10.1016/s0092-8674(00)81294-5. [DOI] [PubMed] [Google Scholar]
- 34.Wan J.Y., Goodman D.L., Willems E.L., Freedland A.R., Norden-Krichmar T.M., Santorico S.A., Edwards K.L., and American Diabetes G.S.G. (2021). Genome-wide association analysis of metabolic syndrome quantitative traits in the GENNID multiethnic family study Diabetol Metab Syndr 13, 59. 10.1186/s13098-021-00670-3. [DOI] [PMC free article] [PubMed] [Google Scholar]
- 35.Zeng F., Wang Y., Kloepfer L.A., Wang S., and Harris R.C. (2018). ErbB4 deletion predisposes to development of metabolic syndrome in mice. American journal of physiology. Endocrinology and metabolism 315, E583–E593. 10.1152/ajpendo.00166.2018. [DOI] [PMC free article] [PubMed] [Google Scholar]
- 36.Chang Y.C., Su C.Y., Chen M.H., Chen W.S., Chen C.L., and Hsiao M. (2017). Secretory RAB GTPase 3C modulates IL6-STAT3 pathway to promote colon cancer metastasis and is associated with poor prognosis. Mol Cancer 16, 135. 10.1186/s12943-017-0687-7. [DOI] [PMC free article] [PubMed] [Google Scholar]
- 37.Dodington D.W., Desai H.R., and Woo M. (2018). JAK/STAT - Emerging Players in Metabolism. Trends Endocrinol Metab 29, 55–65. 10.1016/j.tem.2017.11.001. [DOI] [PubMed] [Google Scholar]
- 38.Roqueta-Rivera M., Esquejo R.M., Phelan P.E., Sandor K., Daniel B., Foufelle F., Ding J., Li X., Khorasanizadeh S., and Osborne T.F. (2016). SETDB2 Links Glucocorticoid to Lipid Metabolism through Insig2a Regulation. Cell metabolism 24, 474–484. 10.1016/j.cmet.2016.07.025. [DOI] [PMC free article] [PubMed] [Google Scholar]
- 39.Clark J.T., Kalra P.S., Crowley W.R., and Kalra S.P. (1984). Neuropeptide Y and human pancreatic polypeptide stimulate feeding behavior in rats. Endocrinology 115, 427–429. 10.1210/endo-115-1-427. [DOI] [PubMed] [Google Scholar]
- 40.Rossi M., Kim M.S., Morgan D.G., Small C.J., Edwards C.M., Sunter D., Abusnana S., Goldstone A.P., Russell S.H., Stanley S.A., et al. (1998). A C-terminal fragment of Agouti-related protein increases feeding and antagonizes the effect of alpha-melanocyte stimulating hormone in vivo. Endocrinology 139, 4428–4431. 10.1210/endo.139.10.6332. [DOI] [PubMed] [Google Scholar]
- 41.Semjonous N.M., Smith K.L., Parkinson J.R., Gunner D.J., Liu Y.L., Murphy K.G., Ghatei M.A., Bloom S.R., and Small C.J. (2009). Coordinated changes in energy intake and expenditure following hypothalamic administration of neuropeptides involved in energy balance. Int J Obes (Lond) 33, 775–785. 10.1038/ijo.2009.96. [DOI] [PMC free article] [PubMed] [Google Scholar]
- 42.Chen Y., Essner R.A., Kosar S., Miller O.H., Lin Y.C., Mesgarzadeh S., and Knight Z.A. (2019). Sustained NPY signaling enables AgRP neurons to drive feeding. Elife 8. 10.7554/eLife.46348. [DOI] [PMC free article] [PubMed] [Google Scholar]
- 43.Krashes M.J., Shah B.P., Koda S., and Lowell B.B. (2013). Rapid versus delayed stimulation of feeding by the endogenously released AgRP neuron mediators GABA, NPY, and AgRP. Cell metabolism 18, 588–595. 10.1016/j.cmet.2013.09.009. [DOI] [PMC free article] [PubMed] [Google Scholar]
- 44.Engstrom Ruud L., Pereira M.M.A., de Solis A.J., Fenselau H., and Bruning J.C. (2020). NPY mediates the rapid feeding and glucose metabolism regulatory functions of AgRP neurons. Nat Commun 11, 442. 10.1038/s41467-020-14291-3. [DOI] [PMC free article] [PubMed] [Google Scholar]
- 45.Jensen T.L., Kiersgaard M.K., Sorensen D.B., and Mikkelsen L.F. (2013). Fasting of mice: a review. Lab Anim 47, 225–240. 10.1177/0023677213501659. [DOI] [PubMed] [Google Scholar]
- 46.Kowal M., Buda-Lewandowska D., Plytycz B., and Styrna J. (2002). Day/night food consumption in mice is strain and age-dependent. Folia Biol (Krakow) 50, 1–3. [PubMed] [Google Scholar]
- 47.Betley J.N., Cao Z.F., Ritola K.D., and Sternson S.M. (2013). Parallel, redundant circuit organization for homeostatic control of feeding behavior. Cell 155, 1337–1350. 10.1016/j.cell.2013.11.002. [DOI] [PMC free article] [PubMed] [Google Scholar]
- 48.Elias C.F., Lee C., Kelly J., Aschkenasi C., Ahima R.S., Couceyro P.R., Kuhar M.J., Saper C.B., and Elmquist J.K. (1998). Leptin activates hypothalamic CART neurons projecting to the spinal cord. Neuron 21, 1375–1385. 10.1016/s0896-6273(00)80656-x. [DOI] [PubMed] [Google Scholar]
- 49.Cowley M.A., Smart J.L., Rubinstein M., Cerdan M.G., Diano S., Horvath T.L., Cone R.D., and Low M.J. (2001). Leptin activates anorexigenic POMC neurons through a neural network in the arcuate nucleus. Nature 411, 480–484. 10.1038/35078085. [DOI] [PubMed] [Google Scholar]
- 50.Bates S.H., Stearns W.H., Dundon T.A., Schubert M., Tso A.W., Wang Y., Banks A.S., Lavery H.J., Haq A.K., Maratos-Flier E., et al. (2003). STAT3 signalling is required for leptin regulation of energy balance but not reproduction. Nature 421, 856–859. 10.1038/nature01388. [DOI] [PubMed] [Google Scholar]
- 51.Adams J.M., Pei H., Sandoval D.A., Seeley R.J., Chang R.B., Liberles S.D., and Olson D.P. (2018). Liraglutide Modulates Appetite and Body Weight Through Glucagon-Like Peptide 1 Receptor-Expressing Glutamatergic Neurons. Diabetes 67, 1538–1548. 10.2337/db17-1385. [DOI] [PMC free article] [PubMed] [Google Scholar]
- 52.Pi-Sunyer X., Astrup A., Fujioka K., Greenway F., Halpern A., Krempf M., Lau D.C., le Roux C.W., Violante Ortiz R., Jensen C.B., et al. (2015). A Randomized, Controlled Trial of 3.0 mg of Liraglutide in Weight Management. N Engl J Med 373, 11–22. 10.1056/NEJMoa1411892. [DOI] [PubMed] [Google Scholar]
- 53.Xu W., and Sudhof T.C. (2013). A neural circuit for memory specificity and generalization. Science 339, 1290–1295. 10.1126/science.1229534. [DOI] [PMC free article] [PubMed] [Google Scholar]
- 54.Matikainen-Ankney B.A., Earnest T., Ali M., Casey E., Wang J.G., Sutton A.K., Legaria A.A., Barclay K.M., Murdaugh L.B., Norris M.R., et al. (2021). An open-source device for measuring food intake and operant behavior in rodent home-cages. Elife 10. 10.7554/eLife.66173. [DOI] [PMC free article] [PubMed] [Google Scholar]
- 55.Holliday M.A., Potter D., Jarrah A., and Bearg S. (1967). The relation of metabolic rate to body weight and organ size. Pediatr Res 1, 185–195. 10.1203/00006450-196705000-00005. [DOI] [PubMed] [Google Scholar]
- 56.Muller T.D., Finan B., Bloom S.R., D’Alessio D., Drucker D.J., Flatt P.R., Fritsche A., Gribble F., Grill H.J., Habener J.F., et al. (2019). Glucagon-like peptide 1 (GLP-1). Mol Metab 30, 72–130. 10.1016/j.molmet.2019.09.010. [DOI] [PMC free article] [PubMed] [Google Scholar]
- 57.Larsen P.J., Tang-Christensen M., Holst J.J., and Orskov C. (1997). Distribution of glucagon-like peptide-1 and other preproglucagon-derived peptides in the rat hypothalamus and brainstem. Neuroscience 77, 257–270. 10.1016/s0306-4522(96)00434-4. [DOI] [PubMed] [Google Scholar]
- 58.Barrera J.G., Jones K.R., Herman J.P., D’Alessio D.A., Woods S.C., and Seeley R.J. (2011). Hyperphagia and increased fat accumulation in two models of chronic CNS glucagon-like peptide-1 loss of function. The Journal of neuroscience : the official journal of the Society for Neuroscience 31, 3904–3913. 10.1523/JNEUROSCI.2212-10.2011. [DOI] [PMC free article] [PubMed] [Google Scholar]
- 59.Luo S.X., Huang J., Li Q., Mohammad H., Lee C.Y., Krishna K., Kok A.M., Tan Y.L., Lim J.Y., Li H., et al. (2018). Regulation of feeding by somatostatin neurons in the tuberal nucleus. Science 361, 76–81. 10.1126/science.aar4983. [DOI] [PubMed] [Google Scholar]
- 60.Zhang X., and van den Pol A.N. (2016). Hypothalamic arcuate nucleus tyrosine hydroxylase neurons play orexigenic role in energy homeostasis. Nature neuroscience 19, 1341–1347. 10.1038/nn.4372. [DOI] [PMC free article] [PubMed] [Google Scholar]
- 61.Zhang X., and van den Pol A.N. (2015). Dopamine/Tyrosine Hydroxylase Neurons of the Hypothalamic Arcuate Nucleus Release GABA, Communicate with Dopaminergic and Other Arcuate Neurons, and Respond to Dynorphin, Met-Enkephalin, and Oxytocin. The Journal of neuroscience : the official journal of the Society for Neuroscience 35, 14966–14982. 10.1523/JNEUROSCI.0293-15.2015. [DOI] [PMC free article] [PubMed] [Google Scholar]
- 62.Zhu C., Jiang Z., Xu Y., Cai Z.L., Jiang Q., Xu Y., Xue M., Arenkiel B.R., Wu Q., Shu G., and Tong Q. (2020). Profound and redundant functions of arcuate neurons in obesity development. Nat Metab 2, 763–774. 10.1038/s42255-020-0229-2. [DOI] [PMC free article] [PubMed] [Google Scholar]
- 63.Zhang Y., Xing X., Long B., Cao Y., Hu S., Li X., Yu Y., Tian D., Sui B., Luo Z., et al. (2022). A spatial and cellular distribution of rabies virus infection in the mouse brain revealed by fMOST and single-cell RNA sequencing. Clin Transl Med 12, e700. 10.1002/ctm2.700. [DOI] [PMC free article] [PubMed] [Google Scholar]
- 64.Lee H., Ciabatti E., Gonzalez-Rueda A., Williams E., Nugent F., Mookerjee S., Morgese F., and Tripodi M. (2023). Combining long-term circuit mapping and network transcriptomics with SiR-N2c. Nature methods. 10.1038/s41592-023-01787-1. [DOI] [PMC free article] [PubMed] [Google Scholar]
- 65.van den Pol A.N., and Cassidy J.R. (1982). The hypothalamic arcuate nucleus of rat--a quantitative Golgi analysis. The Journal of comparative neurology 204, 65–98. 10.1002/cne.902040108. [DOI] [PubMed] [Google Scholar]
- 66.Matsumoto A., and Arai Y. (1978). Morphologic evidence for intranuclear circuits in the hypothalamic arcuate nucleus. Exp Neurol 59, 404–412. [DOI] [PubMed] [Google Scholar]
- 67.Nestor C.C., Qiu J., Padilla S.L., Zhang C., Bosch M.A., Fan W., Aicher S.A., Palmiter R.D., Ronnekleiv O.K., and Kelly M.J. (2016). Optogenetic Stimulation of Arcuate Nucleus Kiss1 Neurons Reveals a Steroid-Dependent Glutamatergic Input to POMC and AgRP Neurons in Male Mice. Mol Endocrinol 30, 630–644. 10.1210/me.2016-1026. [DOI] [PMC free article] [PubMed] [Google Scholar]
- 68.Sandoval D.A., Bagnol D., Woods S.C., D’Alessio D.A., and Seeley R.J. (2008). Arcuate glucagon-like peptide 1 receptors regulate glucose homeostasis but not food intake. Diabetes 57, 2046–2054. 10.2337/db07-1824. [DOI] [PMC free article] [PubMed] [Google Scholar]
- 69.Vong L., Ye C., Yang Z., Choi B., Chua S. Jr., and Lowell B.B. (2011). Leptin action on GABAergic neurons prevents obesity and reduces inhibitory tone to POMC neurons. Neuron 71, 142–154. 10.1016/j.neuron.2011.05.028. [DOI] [PMC free article] [PubMed] [Google Scholar]
- 70.Tang Q., Godschall E., Brennan C.D., Zhang Q., Abraham-Fan R.J., Williams S.P., Gungul T.B., Onoharigho R., Buyukaksakal A., Salinas R., et al. (2023). Leptin receptor neurons in the dorsomedial hypothalamus input to the circadian feeding network. Sci Adv 9, eadh9570. 10.1126/sciadv.adh9570. [DOI] [PMC free article] [PubMed] [Google Scholar]
- 71.Berrios J., Li C., Madara J.C., Garfield A.S., Steger J.S., Krashes M.J., and Lowell B.B. (2021). Food cue regulation of AGRP hunger neurons guides learning. Nature 595, 695–700. 10.1038/s41586-021-03729-3. [DOI] [PMC free article] [PubMed] [Google Scholar]
- 72.Chen X.Y., Chen L., Yang W., and Xie A.M. (2021). GLP-1 Suppresses Feeding Behaviors and Modulates Neuronal Electrophysiological Properties in Multiple Brain Regions. Front Mol Neurosci 14, 793004. 10.3389/fnmol.2021.793004. [DOI] [PMC free article] [PubMed] [Google Scholar]
- 73.Tong Q., Ye C.P., Jones J.E., Elmquist J.K., and Lowell B.B. (2008). Synaptic release of GABA by AgRP neurons is required for normal regulation of energy balance. Nature neuroscience 11, 998–1000. 10.1038/nn.2167. [DOI] [PMC free article] [PubMed] [Google Scholar]
- 74.Brierley D.I., Holt M.K., Singh A., de Araujo A., McDougle M., Vergara M., Afaghani M.H., Lee S.J., Scott K., Maske C., et al. (2021). Central and peripheral GLP-1 systems independently suppress eating. Nat Metab 3, 258–273. 10.1038/s42255-021-00344-4. [DOI] [PMC free article] [PubMed] [Google Scholar]
- 75.Xu A.W., Kaelin C.B., Takeda K., Akira S., Schwartz M.W., and Barsh G.S. (2005). PI3K integrates the action of insulin and leptin on hypothalamic neurons. The Journal of clinical investigation 115, 951–958. 10.1172/JCI24301. [DOI] [PMC free article] [PubMed] [Google Scholar]
- 76.Paxinos G., and Franklin K.B.J. (2004). The mouse brain in stereotaxic coordinates, Compact 2nd Edition (Elsevier Academic Press; ). [Google Scholar]
- 77.Todd W.D., Venner A., Anaclet C., Broadhurst R.Y., De Luca R., Bandaru S.S., Issokson L., Hablitz L.M., Cravetchi O., Arrigoni E., et al. (2020). Suprachiasmatic VIP neurons are required for normal circadian rhythmicity and comprised of molecularly distinct subpopulations. NatCommun 11, 4410. 10.1038/s41467-020-17197-2. [DOI] [PMC free article] [PubMed] [Google Scholar]
- 78.Gaublomme J.T., Li B., McCabe C., Knecht A., Yang Y., Drokhlyansky E., Van Wittenberghe N., Waldman J., Dionne D., Nguyen L., et al. (2019). Nuclei multiplexing with barcoded antibodies for single-nucleus genomics. Nat Commun 10, 2907. 10.1038/s41467-019-10756-2. [DOI] [PMC free article] [PubMed] [Google Scholar]
- 79.Fleming S.J., Chaffin M.D., Arduini A., Akkad A.D., Banks E., Marioni J.C., Philippakis A.A., Ellinor P.T., and Babadi M. (2023). Unsupervised removal of systematic background noise from droplet-based single-cell experiments using CellBender. Nature methods 20, 1323–1335. 10.1038/s41592-023-01943-7. [DOI] [PubMed] [Google Scholar]
- 80.Janssen P., Kliesmete Z., Vieth B., Adiconis X., Simmons S., Marshall J., McCabe C., Heyn H., Levin J.Z., Enard W., and Hellmann I. (2023). The effect of background noise and its removal on the analysis of single-cell expression data. Genome Biol 24, 140. 10.1186/s13059-023-02978-x. [DOI] [PMC free article] [PubMed] [Google Scholar]
- 81.Hao Y., Hao S., Andersen-Nissen E., Mauck W.M. 3rd, Zheng S., Butler A., Lee M.J., Wilk A.J., Darby C., Zager M., et al. (2021). Integrated analysis of multimodal single-cell data. Cell 184, 3573–3587 e3529. 10.1016/j.cell.2021.04.048. [DOI] [PMC free article] [PubMed] [Google Scholar]
- 82.Stringer C., Wang T., Michaelos M., and Pachitariu M. (2021). Cellpose: a generalist algorithm for cellular segmentation. Nature methods 18, 100–106. 10.1038/s41592-020-01018-x. [DOI] [PubMed] [Google Scholar]
Associated Data
This section collects any data citations, data availability statements, or supplementary materials included in this article.
Supplementary Materials
Data Availability Statement
The raw and processed snRNA-seq data are available at the Gene Expression Omnibus (GEO) repository at GEO accession number #####. The code for further processing and analyzing the data using Seurat can be found at Zenodo record number #####. The whole RAMPANT dataset (all-rabies) and its Arc-only subset are each available for user-friendly exploration and visualization through the Broad Single Cell Portal at these links: all-rabies, #####; Arc-only, #####. R data files (.RDS) of these fully processed and analyzed datasets can be downloaded directly from their Broad Single Cell Portal site. All other raw and processed data are available from the corresponding authors upon request.