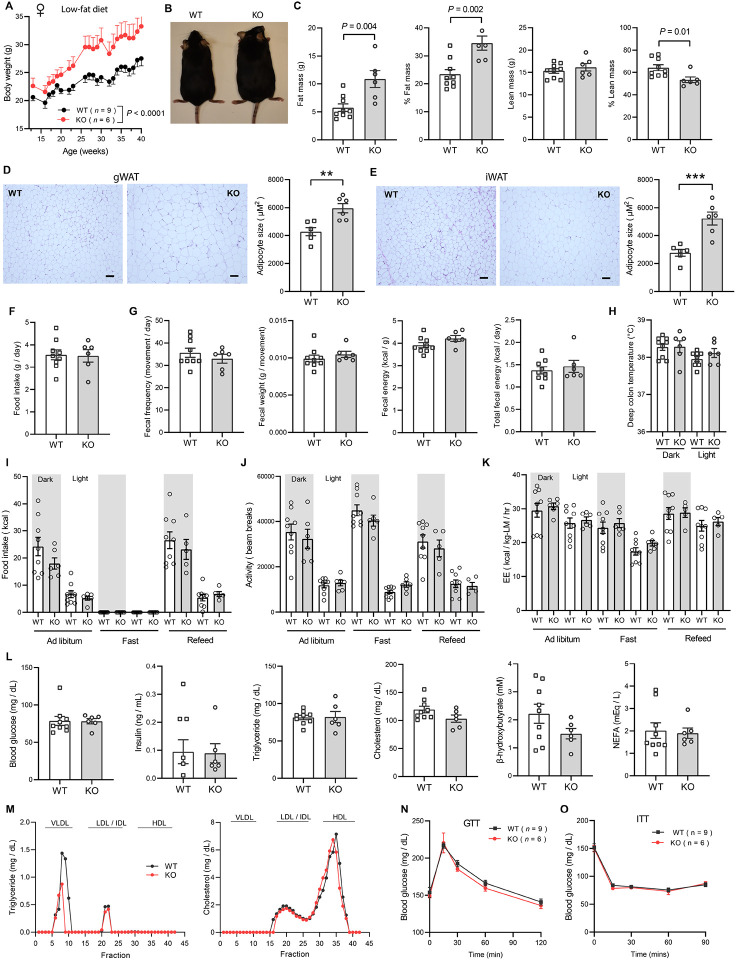
Figure 4. Ctrp10-KO female mice on a low-fat diet develop obesity with age.
(A) Body weights over time of WT and KO female mice fed a low-fat diet (LFD). (B) Representative image of WT and KO female on LFD for 40 weeks. (C) Body composition analysis of WT (n = 9) and KO (n = 6) female mice fed a LFD. (D) Representative H&E stained histology of gonadal white adipose tissue (gWAT) and the quantification of adipocyte cell size (n = 6 per genotype). Scale bar = 100 μM. (E) Representative H&E stained histology of inguinal white adipose tissue (iWAT) and the quantification of adipocyte cell size (n = 6 per genotype). Scale bar = 100 μM. (F) 24-hr food intake data measured manually. (G) Fecal frequency, fecal weight, and fecal energy over a 24 hr period. (H) Deep colon temperature measured at the light and dark cycle. (I-K) Food intake, physical activity, and energy expenditure in female mice across the circadian cycle (light and dark) and metabolic states (ad libitum fed, fasted, refed) (WT, n = 9; KO, n = 6). Indirect calorimetry analysis was performed after female mice were on LFD for 30 weeks. (L) Overnight (16-hr) fasted blood glucose, serum insulin, triglyceride, cholesterol, non-esterified free fatty acids, and β-hydroxybutyrate levels. (M) Very-low density lipoprotein-triglyceride (VLDL-TG) and high-density lipoprotein-cholesterol (HDL-cholesterol) analysis by FPLC of pooled (n = 6-7 per genotype) mouse sera. (N) Blood glucose levels during glucose tolerance tests (GTT). (O) Blood glucose levels during insulin tolerance tests (ITT). GTT and ITT were performed when the female mice reached 28 and 29 weeks of age, respectively. WT, n = 9; KO, n = 6.

