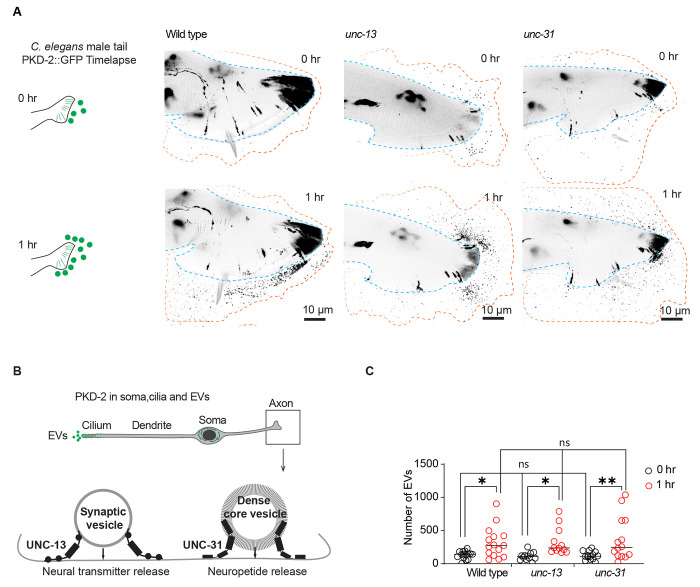
Figure 2. Neuronal transmission-independent release of PKD-2::GFP-labeled ciliary EVs.
(A) Representative images showing EV release from the tail at the initial imaging (0 hr) and the second imaging (1 hr) while the animals were mounted on slides, in wild-type, unc-13, and unc-31 males.
(B) Schematic diagram depicts the functional roles of UNC-13 and UNC-31 in synaptic vesicle- and dense core vesicle-mediated neuronal transmission in the axon. (C) Quantification of EV release from the tail at the initial imaging (0 hr) and second imaging (1 hr) in wild-type, unc-13, and unc-31 males. The scatter plot with lines indicates the mean ± SEM. Each data point represents the total EV count released by an individual C. elegans male. 12-15 animals were imaged for each genotype. Statistical analysis was performed by two-way ANOVA with Bonferroni correction. ns denotes not significant, * denotes p < 0.05, and ** denotes p < 0.01.

