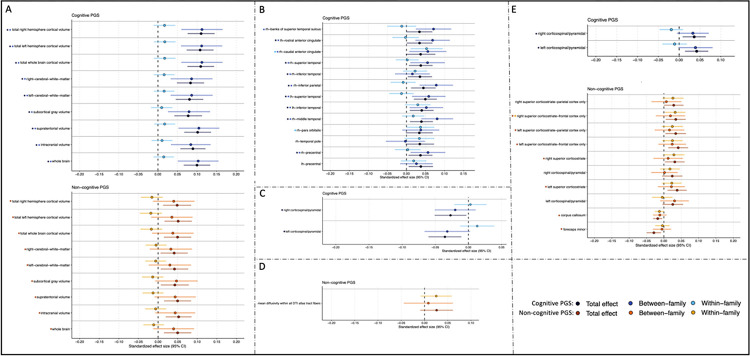
Figure 5: Total, Between, and Within-family Estimates for the Associations Between Cognitive and Non-cognitive PGS and Neural Indices of Interest.
Total, Within- and between-family associations between Cognitive and Noncognitive PGS (p <0.05) and significant measures for the neural indices of A) global volume, B) regional volume, C) regional MD, D) average MD, and E) regional FA. (i.e., outcomes with pfdr<0.05 in Figure 4 and Supplemental Table 8). For the cognitive PGS, black, dark blue, and light blue asterisks correspond to significant total, between-, and within-family associations, respectively. For the non-cognitive PGS, red, orange, and yellow asterisks correspond to significant total, between-, and within-family associations, respectively.

