Abstract
When the rate of glucose addition to nongrowing Streptococcus bovis cell suspensions was increased, the fermentation was homolactic, fructose-1,6-diphosphate (FDP) increased, intracellular inorganic phosphate (Pi) declined, and the energy-spilling rate increased. ATP and ADP were not significantly affected by glucose consumption rate, but the decrease in Pi was sufficient to cause an increase in the free energy of ATP hydrolysis (ΔG′p). The increase in ΔG′p was correlated with an increase in proton motive force (Δp). S. bovis continuous cultures (dilution rate of 0.65 h−1) that were provided with ammonia as the sole nitrogen source also had high rates of lactate production and energy spilling. When Trypticase was added as a source of amino acids, lactate production decreased; a greater fraction of the glucose was converted to acetate, formate, and ethanol; and the energy-spilling rate decreased. Trypticase also caused a decrease in FDP, an increase in Pi, and a decrease in Δp. The change in Δp could be explained by Pi-dependent changes in the ΔG′p. When Pi declined, ΔG′p and Δp increased. The ratio of ΔG′p to Δp (millivolt per millivolt) was always high (>4) at low rates of energy spilling but declined when the energy-spilling rate increased. Based on these results, it appears that Δp and the energy-spilling rate are responsive to fluctuations in the intracellular Pi concentration.
l-Lactate dehydrogenase of Streptococcus bovis requires fructose-1,6-diphosphate (FDP) and is inhibited by inorganic phosphate (Pi) (29), and this pattern of regulation is common in low-G+C gram-positive anaerobes (9). FDP and phosphate also regulate pyruvate kinase (1, 6, 11), a protein kinase involved in inducer expulsion (20), the F1F0 ATPase of S. bovis (3), and CcpA, a transcriptional regulator involved in catabolite repression (5). The FDP pool can change rapidly, but nuclear magnetic resonance spectroscopy and fluorography corroborated enzymatic measurements as long as the extraction was rapid (8, 13, 21, 27, 28, 30). Thompson and Torchia (28) noted that “phosphate (was) conserved by formation of FDP during glycolysis” and concluded that “the net direction of the FDP↔Pi interconversion will fluctuate according to the energetic status of the cell.” This inverse relationship is supported by the observation that cells with high rates of glycolysis generally have high FDP and low intracellular phosphate (8, 21, 27, 30).
ATP hydrolysis is the primary mechanism of proton motive force (Δp) generation in low-G+C gram-positive anaerobes. Kashket (12) and Otto et al. (18) noted “consistently lower Δp values” when cells were grown in rich versus minimal media, but a relationship between amino acid availability and “nongrowth” ATP hydrolysis was not addressed. S. bovis dissipates ATP via a mechanism involving a membrane-bound ATPase and a futile cycle of ions across the cell membrane, and cultures that were deprived of amino acids had low cell yields and high rates of nongrowth ATP hydrolysis (energy spilling). Pulse doses of glucose increased the Δp and energy-spilling rate of S. bovis continuous cultures (7), and this result indicated that energy spilling might be affected by the Δp, a driving force for proton influx. A 10-fold decrease in intracellular phosphate (induced by energy-excess conditions) would increase the free energy of ATP hydrolysis (ΔG′p) available to the proton-pumping ATPase by approximately 8 kJ/mol (77 mV). The following experiments were designed to determine the effect of glucose availability and amino nitrogen on intracellular FDP and phosphate concentrations, ΔG′p, Δp, and the energy-spilling rate in S. bovis.
MATERIALS AND METHODS
Cell growth.
S. bovis JB1 was routinely grown under anaerobic conditions at 39°C in basal medium containing (per liter) 292 mg of K2HPO4, 292 mg of KH2PO4, 480 mg of (NH4)2SO4, 480 mg of NaCl, 100 mg of MgSO4 · 7H2O, 64 mg of CaCl2 · 2H2O, 500 mg of cysteine hydrochloride, 1 g of Trypticase (BBL Microbiology Systems, Cockeysville, Md.), and 0.5 g of yeast extract. The medium was adjusted to pH 6.7, and the final pH was never less than 6.5. Glucose was provided as the energy source at a growth-limiting concentration of 1 mg/ml (5.55 mM). S. bovis was also grown in glucose-limited continuous culture under O2-free CO2 at a dilution rate of 0.65 h−1 (190-ml culture vessel, 39°C). Minimal medium contained 22 mM glucose, trace minerals, and vitamins (3) (yeast extract was omitted). Increasing amounts of Trypticase were added to the minimal medium as indicated in the figure legends. At least a 98% turnover of the medium through the continuous-culture vessel occurred between samplings (approximately 4 culture vessel volumes).
Nongrowing cells.
Exponentially growing cells were harvested and washed three times anaerobically in minimal medium lacking (NH4)2SO4 (replaced by Na2SO4). Cell suspensions were placed in an anaerobic, water-jacketed (39°C) chemostat vessel (35 ml) that was purged with O2-free CO2. A pulse of glucose (1 mM final concentration) was used to energize the cells and reestablish ion gradients across the cell membrane. Glucose (1% [wt/vol]) was then added with an accurate peristaltic pump (model 2232; LKB Instruments, Inc., Gaithersburg, Md.) at a rate of 2 ml/h. Once the cell suspensions had equilibrated (30 min), samples (1 ml) were withdrawn at regular intervals. The removal of samples caused a decrease in volume and an increase in the rate of glucose delivery. By accounting for decreases in volume, glucose accumulation in the vessel, and cell protein concentration, it was possible to calculate the glucose consumption rate of nongrowing cell suspensions. This rate was verified by measuring the concentrations of fermentation acids.
Intracellular FDP.
Batch cultures and cell suspensions having excess glucose were layered onto silicone for FDP extraction as previously described (3), but this procedure was too slow for glucose-limited cells. Glucose-limited cell suspensions and cultures (5 ml) were drawn into a syringe prefilled with 0.5 ml of 37% formaldehyde, mixed rapidly, and injected into a cold (stored on ice) 50-ml glass beaker. Preliminary work indicated that FDP concentrations were stable even if the cells were left in the beaker for 5 min. The cell suspensions (1 ml) were then placed into a microcentrifuge tube containing 0.3 ml of silicone oil (equal-parts mixture of Dexter Hysol 550 and 560) layered on top of 0.1 ml of perchloric acid (0.1 mg of perchlorate plus 0.01 mg of methyl orange per ml). After centrifugation (13,000 × g, 5 min), FDP was assayed by a spectrophotometric assay as previously described (4). All determinations were performed in triplicate.
Intracellular phosphate.
Intracellular phosphate also changed rapidly if glucose was limiting. The procedure for phosphate determination was similar to the one for FDP determination, except cells were centrifuged into 50 μl of perchloric acid. Cell-free supernatants and silicone oil were removed by vacuum, and the cell extracts were carefully resuspended in the perchloric acid and transferred to a fresh tube to avoid phosphate contamination from residual medium. Extracts were incubated on ice for 10 min and frozen (−15°C) until analysis. Phosphate was determined according to the method of Hess and Derr (10). The assay consisted of 10 to 20 μl of cell extract in a total volume of 600 μl of ammoniumheptamolybdate, malachite green, and Sterox color reagent. Experiments to obtain standard curves used KH2PO4 in 10% perchloric acid (0 to 2,000 μM). Corrections were made for phosphate present in the extracellular space (medium concentration of intracellular phosphate, approximately 2.1 mM). New plastic vessels or acid-washed glassware minimized phosphate contamination. All determinations were performed in triplicate.
Δp.
The pH gradient across the cell membrane and the electrical potential (Δψ) were determined by methods employing silicon oil centrifugation, the distributions of 3H-tetraphenylphosphonium bromide (3H-TPP+) and 14C-benzoate across the cell membrane, and the Nernst equation {−2.3 RT/F × log ([concentration in]/[concentration out]), where RT is 2.59 kJ/mol and F is 96.5 kJ/V · mol}. Intracellular volume was estimated from the difference between 14C-polyethylene glycol and 3H2O distributions and was similar for growing and nongrowing cells (4.3 μl/mg of protein). Corrections were made for extracellular contamination. Nongrowing cell suspensions were incubated anaerobically at 39°C in a 35-ml vessel, and 3H-TPP+ and 14C-benzoate were injected directly into the vessel. Growing cultures were withdrawn from the continuous-culture vessel (190 ml), transferred anaerobically to a tube (2 ml) containing 3H-TPP+ and 14C-benzoate, and incubated at 39°C for 1 min. The pH gradient across the cell membrane and Δψ were dissipated by incubating the cells with a combination of nigericin (5 μM) and valinomycin (5 μM) for 10 min.
Intracellular ATP.
Samples for ATP determination were prepared as previously described (23) and assayed with a luminometer (model 1250; LKB Instruments, Inc.) to measure the light output of a luciferin-luciferase mix (Sigma Chemical Co., St. Louis, Mo.).
Other assays.
Fermentation acids in cell-free supernatant samples were analyzed by high-pressure liquid chromatography (87H Bio-Rad column, 0.5 ml of 0.17 N H2SO4 per min, refractive index detector, 50°C). Glucose was determined via a method employing hexokinase and glucose-6-phosphate dehydrogenase (2). Cells were treated with 0.2 N NaOH (100°C, 10 min), and protein was determined by the Lowry method (14).
RESULTS
Nongrowing cells.
When washed-cell suspensions of S. bovis JB1 were provided with a low rate of glucose addition via a peristaltic pump, extracellular glucose was never detected. By removing portions of the cell suspension, it was possible to increase the specific rate of glucose consumption by nongrowing cells in a stepwise fashion from 7 to 35 mmol of glucose/g of protein/h. Cell suspensions with glycolytic rates of less than 10 mmol of glucose/g of protein/h were heterofermentative (acetate, formate, ethanol, and lactate), but the fermentation was homolactic at higher rates of glucose consumption. ATP production was estimated from the production rates of fermentation products (1 mol of ATP per mol of lactate in culture medium or 3 mol of ATP per 1 mol of acetate, 2 mol of formate, and 1 mol of ethanol).
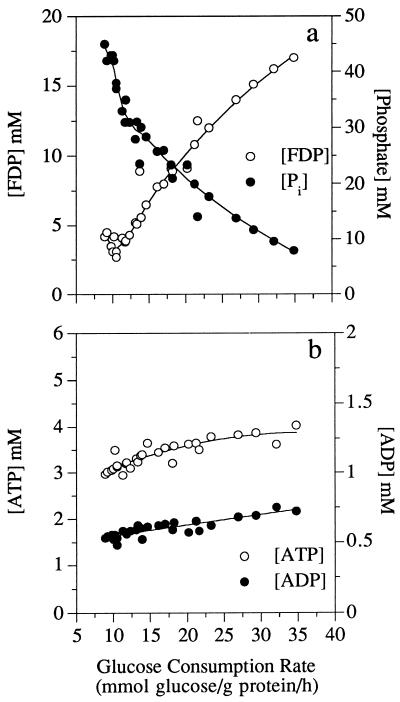
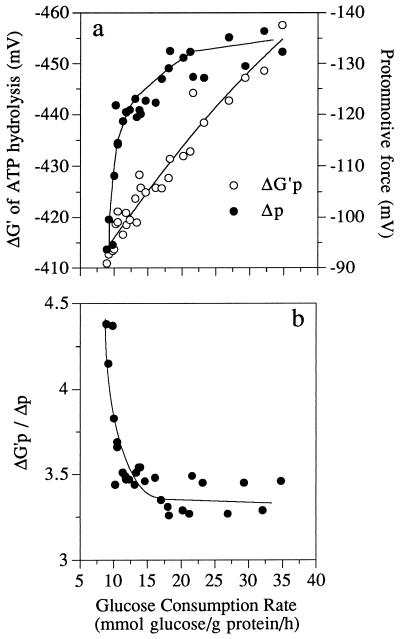
When the glucose consumption rate increased, intracellular FDP increased from 2.5 to 17 mM and inorganic phosphate decreased from 45.5 to 7.5 mM (Fig. 1a). ATP and ADP concentrations increased slightly, but the ratio of ATP to ADP remained relatively constant (Fig. 1b). The intracellular pH was 6.7 ± 0.2. Based on the data of Rosing and Slater (21) and an intracellular magnesium concentration of 1 mM, it was possible to estimate the phosphorylation potential by using the formula ΔG′p = −285 mV − 62 log ([ATP]/[ADP] × [Pi]), where Pi is intracellular phosphate. When the glucose consumption rate increased from 7 to 35 mmol of glucose/g of protein/h, the ΔG′p increased from −410 to −460 mV (39 to 44 kJ/mol) (Fig. 2a). The Δp was also influenced by glucose consumption rate. At low rates of glucose consumption the Δp was only −90 mV, but rapidly glycolyzing cells had a Δp of −135 mV. The increase in Δp was due entirely to an increase in the membrane potential (Δψ). The chemical gradient of protons was always less than −20 mV and did not change appreciably. The ratio of ΔG′p to Δp was greater than 4 at low rates of glucose consumption, but this value decreased to 3.3 when the rate of glucose consumption was increased (Fig. 2b).
FIG. 1.
Glucose consumption rate of nongrowing S. bovis cells and its effect on intracellular FDP and phosphate ([Pi]) (a) or ATP and ADP (b).
FIG. 2.
Glucose consumption rate of nongrowing S. bovis cells and its effects on the ΔG′p and Δp (a) or the ratio of ΔG′p to Δp (b).
Continuous culture.
When S. bovis was grown in continuous culture in a medium containing ammonia as the sole source of nitrogen at a dilution rate of 0.65 h−1, all of the glucose was utilized, 95% of the glucose carbon could be recovered as either cells or fermentation products, and the cell yield was 15.3 g of protein/mol of glucose fermented. Lactate was the predominant end product, accounting for 85% of the glucose fermentation. The remaining products were acetate, formate, and ethanol (ratio of 1 to 2 to 1).
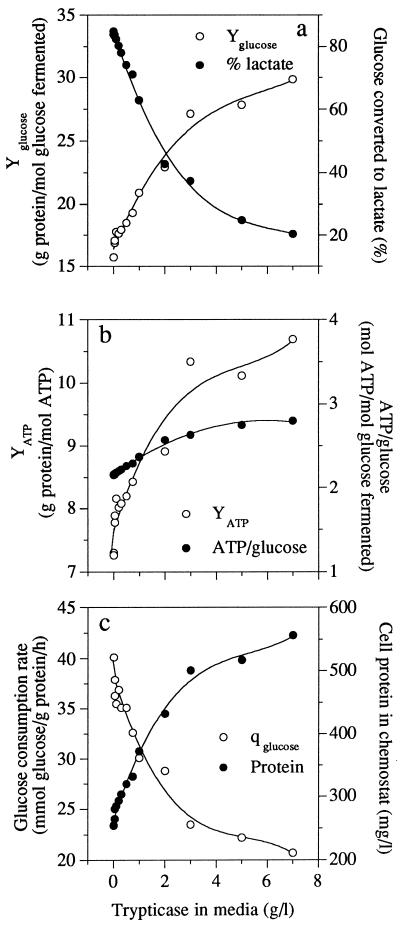
S. bovis could not utilize Trypticase as an energy source for growth, but Trypticase increased the cell yield of glucose-limited continuous cultures. The glucose yield increased from 15.3 to 30 g of protein/mol of glucose fermented, but some of this increase was caused by a shift from lactate production to acetate, formate, and ethanol production. This shift resulted in an increase in ATP production (Fig. 3a). Increased ATP availability could not explain all of the increase in glucose yield, however, and the ATP yield (or grams of protein per mole of ATP) also increased (Fig. 3b). When all changes in cell protein and ATP production were accounted for, cultures utilizing Trypticase as a nitrogen source decreased their specific rate of glucose consumption by 50% and their rate of ATP consumption by 65% (Fig. 3c), while maintaining the same growth rate.
FIG. 3.
Effect of Trypticase addition on the glucose yield (Yglucose) and the percentage of glucose being converted to lactate (% lactate) (a), on the ATP yield (YATP) and the production of ATP per glucose fermented (b), and on the rate of consumption of glucose (qglucose) and the amount of cell protein in the chemostat culture (Protein) (c) of S. bovis grown in glucose-limited continuous culture (0.65 h−1).
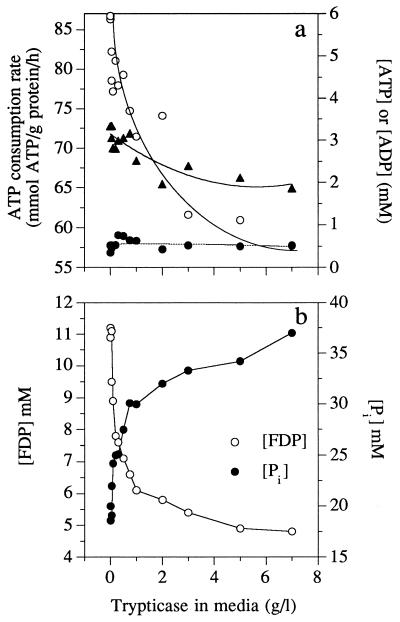
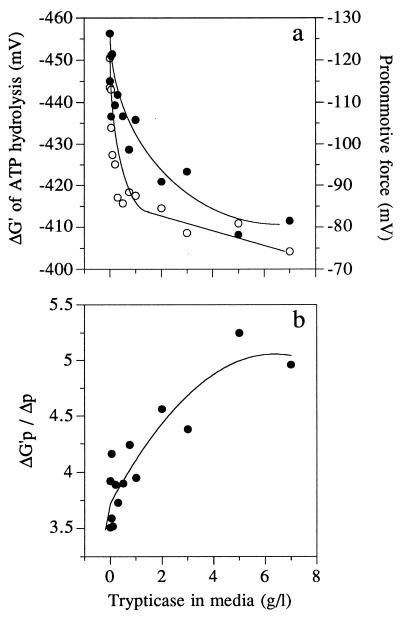
The Trypticase-dependent decrease in the rate of ATP consumption was not correlated with a change in intracellular ATP or ADP (Fig. 4a), but there was a decrease in FDP and an increase in intracellular phosphate (Fig. 4b). Trypticase addition caused a decrease in the ΔG′p of ATP hydrolysis (Fig. 5a), and most of this change was due to the change in intracellular phosphate (Fig. 4b). Δp also declined, and this decrease paralleled the decline in ΔG′p (Fig. 5a). Virtually all of the change in Δp was due to a change in Δψ, and the chemical gradient of protons was less than 20 mV. The ratio of ΔG′p to Δp increased from 3.5 to 5.0 as Trypticase increased and the ATP consumption rate decreased (Fig. 5b).
FIG. 4.
Effects of Trypticase addition on the ATP consumption rate (○), intracellular ATP (▴), and intracellular ADP (•) (a) or on FDP and intracellular phosphate ([Pi]) of S. bovis grown in glucose-limited continuous culture (0.65 h−1) (b).
FIG. 5.
Effects of Trypticase addition on the ΔG′p (○), intracellular ATP (○), and Δp (•) (a) or the ratio of ΔG′p to Δp (b) of S. bovis grown in glucose-limited continuous culture (0.65 h−1).
DISCUSSION
It has long been noted that resting-cell suspensions had rates of catabolism higher than the rates needed for maintenance (24). Nongrowing S. bovis cells consumed glucose at a rate 10-fold higher than the maintenance rate, and this mechanism of energy spilling was constitutive (23). Based on the observation that nongrowth energy dissipation could be enhanced by protonophores and eliminated by an inhibitor of the membrane-bound ATPase, it appeared that S. bovis had a mechanism of cycling protons through the cell membrane (23). When glucose-limited continuous cultures were given a pulse dose of glucose, Δp (a driving force for proton influx) increased, but the relationship between Δp and energy spilling was not entirely clear (7).
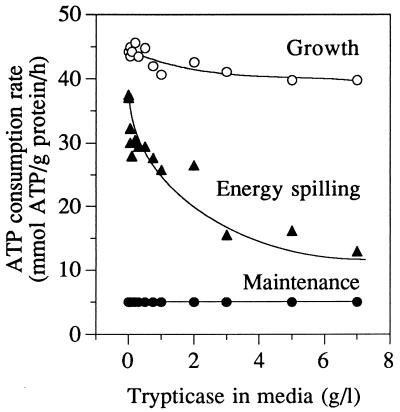
Continuous cultures of S. bovis with low dilution rates had very low rates of nongrowth energy dissipation (high growth yield), but the growth yield of nitrogen-limited cells was abnormally low (3, 7). By using Stouthamer’s ATP requirements for bacterial growth (26), a maintenance rate of 5 μmol of ATP/mg of protein/h (3), and a dilution rate of 0.65 h−1, it was possible to estimate the energy-spilling rate of growing cells in continuous culture. Previous work indicated that amino acid limitation (due to growth on ammonia nitrogen) increased the energy-spilling rate of S. bovis energy-excess batch cultures (22), and the present experiments indicated that amino nitrogen was also able to regulate the energy-spilling rate of energy-limited continuous cultures (Fig. 6). Other workers reported that bacteria growing in rich media had lower Δp values than bacteria growing in minimal media, but a relationship between Δp and energetic efficiency was not considered (12, 18). When S. bovis continuous cultures were supplemented with a source of amino acids (Trypticase), Δp and energy spilling both declined (Fig. 5a and 6).
FIG. 6.
Effect of Trypticase addition on the ATP consumption rate of S. bovis growing in glucose-limited continuous culture (0.65 h−1). ATP consumption was partitioned into growth, maintenance energy, or energy spilling. Growth was estimated by the calculations of Stouthamer (26). Data for maintenance energy were taken from Bond et al. (4). Energy spilling was the remainder.
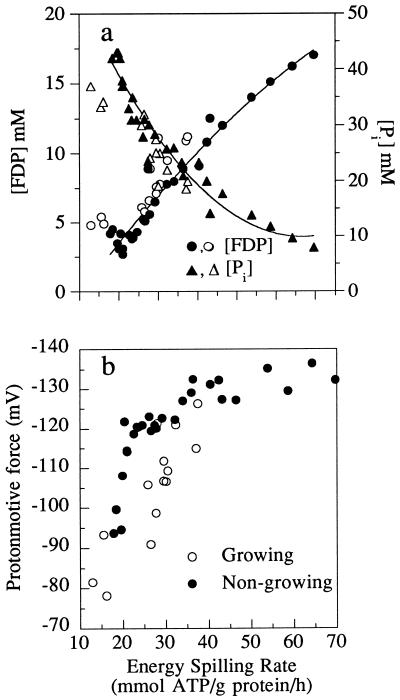
The energy-spilling rates of growing and nongrowing S. bovis cells could be correlated with a decline in FDP and an increase in intracellular phosphate (Fig. 7). When intracellular phosphate increased, both the ΔG′p and the Δp declined. Creation of the Δp is driven by the ΔG′p, and some researchers have assumed that Δp is in equilibrium with ΔG′p. However, the cell membrane is not a perfect insulator. If proton flux into the cell is rapid (e.g., high rates of energy spilling), Δp should be less than the amount predicted by ΔG′p. When S. bovis was spilling energy at a low rate, the ratio of ΔG′p to Δp was greater than 4, but this ratio declined to 3.3 when the energy-spilling rate was high. Other workers have noted a similar variation. The ΔG′p-to-Δp ratio of Lactococcus lactis ranged from 3 to 4.3 (16), and the ΔG′p-to-Δp ratio of Lactococcus cremoris ranged from 4.5 to 2 (18).
FIG. 7.
(a) Energy-spilling rate of nongrowing S. bovis cultures (filled symbols) or S. bovis cultures growing in glucose-limited continuous cultures (open symbols) and its effect on intracellular FDP or intracellular phosphate ([Pi]); (b) effect of the energy-spilling rate on Δp in nongrowing or growing cultures. For nongrowing cells, energy spilling was calculated from the ATP production rate, but for growing cells, the method demonstrated in Fig. 6 was used.
Previous work indicated that the energy-spilling reaction of S. bovis required a decrease in membrane resistance and an increase in proton conductance (7). Because the nongrowth energy dissipation rate was as high as 70 mmol of ATP/g of protein/h and the H+-ATP stoichiometry of the F1F0 ATPase can be high as 4 (16), the proton permeability of S. bovis could be as high as 280 mmol of H+/g of protein/h. Maloney (15) used acid pulses to estimate the passive proton permeability of L. lactis, and his values were approximately 1.6 μS/cm2 (approximately 1.5 mmol of H+/g of protein/h at a Δp of −120 mV). Mammalian mitochondria have ion channels that can increase nongrowth energy dissipation, but flux through these channels decreases Δp (19). S. bovis cells had higher (not lower) Δp when rates of energy spilling were high (Fig. 7b). The bacterial protein, colicin E1, is a Δp-dependent (voltage-gated) ion channel, with a threshold of approximately 80 mV (25). Further work is needed to see if S. bovis uses a similar mechanism to regulate membrane resistance and energy-spilling rate.
ACKNOWLEDGMENT
This research was supported by the U.S. Dairy Forage Research Center, Madison, Wis.
REFERENCES
- 1.Abbe K, Yamada T. Purification and properties of pyruvate kinase from Streptococcus mutans. J Bacteriol. 1982;149:299–305. doi: 10.1128/jb.149.1.299-305.1982. [DOI] [PMC free article] [PubMed] [Google Scholar]
- 2.Bergmeyer H U, Klotch H J. Sucrose. In: Bergmeyer H U, editor. Methods of enzymatic analysis. New York, N.Y: Academic Press, Inc.; 1965. pp. 99–102. [Google Scholar]
- 3.Bond D R, Russell J B. A role for fructose 1,6-diphosphate in the ATPase-mediated energy-spilling reaction of Streptococcus bovis. Appl Environ Microbiol. 1996;62:2095–2099. doi: 10.1128/aem.62.6.2095-2099.1996. [DOI] [PMC free article] [PubMed] [Google Scholar]
- 4.Bond, D. R., B. M. Tsai, and J. B. Russell. The diversion of lactose carbon through the tagatose pathway reduces the intracellular fructose 1,6 diphosphate and growth rate of Streptococcus bovis. Appl. Microbiol. Biotechnol., in press. [DOI] [PubMed]
- 5.Chauvaux S. CcpA and HPr (ser-P): mediators of catabolite repression in Bacillus subtilis. Res Microbiol. 1996;147:518–527. doi: 10.1016/0923-2508(96)84006-x. [DOI] [PubMed] [Google Scholar]
- 6.Collins L B, Thomas T D. Pyruvate kinase of Streptococcus lactis. J Bacteriol. 1974;120:52–58. doi: 10.1128/jb.120.1.52-58.1974. [DOI] [PMC free article] [PubMed] [Google Scholar]
- 7.Cook G M, Russell J B. Energy-spilling reactions of Streptococcus bovis and resistance of its membrane to proton conductance. Appl Environ Microbiol. 1994;60:1942–1948. doi: 10.1128/aem.60.6.1942-1948.1994. [DOI] [PMC free article] [PubMed] [Google Scholar]
- 8.Fordyce A M, Crow V L, Thomas T D. Regulation of product formation during glucose or lactose limitation in nongrowing cells of Streptococcus lactis. Appl Environ Microbiol. 1984;48:332–337. doi: 10.1128/aem.48.2.332-337.1984. [DOI] [PMC free article] [PubMed] [Google Scholar]
- 9.Garvie E I. Bacterial lactate dehydrogenases. Microbiol Rev. 1980;44:106–139. doi: 10.1128/mr.44.1.106-139.1980. [DOI] [PMC free article] [PubMed] [Google Scholar]
- 10.Hess H H, Derr J E. Assay of inorganic and organic phosphorus in the 0.1–5 nanomole range. Anal Biochem. 1975;63:607–613. doi: 10.1016/0003-2697(75)90388-7. [DOI] [PubMed] [Google Scholar]
- 11.Jonas H A, Anders R F, Jago G R. Factors affecting the activity of the lactate dehydrogenase of Streptococcus cremoris. J Bacteriol. 1972;111:397–403. doi: 10.1128/jb.111.2.397-403.1972. [DOI] [PMC free article] [PubMed] [Google Scholar]
- 12.Kashket E R. Proton motive force in growing Streptococcus lactis and Staphylococcus aureus cells under aerobic and anaerobic conditions. J Bacteriol. 1981;146:369–376. doi: 10.1128/jb.146.1.369-376.1981. [DOI] [PMC free article] [PubMed] [Google Scholar]
- 13.Lohmeier-Vogel E M, Hägerdahl B H, Vogel H J. Phosphorus-31 NMR studies of maltose and glucose metabolism in Streptococcus lactis. Appl Microbiol Biotechnol. 1986;25:43–51. [Google Scholar]
- 14.Lowry O H, Rosebrough N J, Farr A L, Randall R J. Protein measurement with the Folin phenol reagent. J Biol Chem. 1951;193:265–275. [PubMed] [Google Scholar]
- 15.Maloney P C. Membrane H+ conductance of Streptococcus lactis. J Bacteriol. 1979;140:197–205. doi: 10.1128/jb.140.1.197-205.1979. [DOI] [PMC free article] [PubMed] [Google Scholar]
- 16.Maloney P C. Relationship between phosphorylation potential and electrochemical H+ gradient during glycolysis in Streptococcus lactis. J Bacteriol. 1983;153:1461–1470. doi: 10.1128/jb.153.3.1461-1470.1983. [DOI] [PMC free article] [PubMed] [Google Scholar]
- 17.Mason P, Carbone D P, Cushman R A, Waggoner A S. The importance of inorganic phosphate in regulation of energy metabolism of Streptococcus lactis. J Biol Chem. 1981;256:1861–1866. [PubMed] [Google Scholar]
- 18.Otto R, Klont B, Konings W N. The relation between phosphate potential and growth rate of Streptococcus cremoris. Arch Microbiol. 1985;142:97–100. [Google Scholar]
- 19.Porter R K, Brand M D. Causes of differences in respiration rates of hepatocytes from mammals of different body mass. Am J Physiol. 1995;269:R1213–R1224. doi: 10.1152/ajpregu.1995.269.5.R1213. [DOI] [PubMed] [Google Scholar]
- 20.Reizer J, Novotny M J, Hengstenberg W, Saier M H., Jr Properties of ATP-dependent protein kinase from Streptococcus pyogenes that phosphorylates a seryl residue in HPr, a phosphocarrier protein of the phosphotransferase system. J Bacteriol. 1984;160:333–340. doi: 10.1128/jb.160.1.333-340.1984. [DOI] [PMC free article] [PubMed] [Google Scholar]
- 21.Rosing J, Slater E C. The value of ΔG° for the hydrolysis of ATP. Biochim Biophys Acta. 1972;267:275–290. doi: 10.1016/0005-2728(72)90116-8. [DOI] [PubMed] [Google Scholar]
- 22.Russell J B. Effect of amino acids on the heat production and growth efficiency of Streptococcus bovis: balance of anabolic and catabolic rates. Appl Environ Microbiol. 1993;59:1747–1751. doi: 10.1128/aem.59.6.1747-1751.1993. [DOI] [PMC free article] [PubMed] [Google Scholar]
- 23.Russell J B, Strobel H J. ATPase-dependent energy spilling by the ruminal bacterium Streptococcus bovis. Arch Microbiol. 1990;153:378–383. doi: 10.1007/BF00249009. [DOI] [PubMed] [Google Scholar]
- 24.Russell J B, Cook G M. Energetics of bacterial growth: balance of anabolic and catabolic reactions. Microbiol Rev. 1995;59:48–62. doi: 10.1128/mr.59.1.48-62.1995. [DOI] [PMC free article] [PubMed] [Google Scholar]
- 25.Slatin S L, Raymond L, Finkelstein A. Gating of voltage-dependent channel colicin E1 in planar lipid bilayers: the role of protein translocation. J Membr Biol. 1986;92:247–254. doi: 10.1007/BF01869393. [DOI] [PubMed] [Google Scholar]
- 26.Stouthamer A H. A theoretical study on the amount of ATP required for synthesis of microbial cell material. Antonie Leeuwenhoek. 1973;39:545–565. doi: 10.1007/BF02578899. [DOI] [PubMed] [Google Scholar]
- 27.Thomas T D, Ellwood D C, Longyear V M C. Change from homo- to heterolactic fermentation by Streptococcus lactis resulting from glucose limitation in anaerobic chemostat cultures. J Bacteriol. 1979;138:109–117. doi: 10.1128/jb.138.1.109-117.1979. [DOI] [PMC free article] [PubMed] [Google Scholar]
- 28.Thompson J, Torchia D A. Use of 31P nuclear magnetic resonance spectroscopy and 14C fluorography in studies of glycolysis and regulation of pyruvate kinase in Streptococcus lactis. J Bacteriol. 1984;158:791–800. doi: 10.1128/jb.158.3.791-800.1984. [DOI] [PMC free article] [PubMed] [Google Scholar]
- 29.Wolin M J. Fructose-1,6-diphosphate requirement of streptococcal lactic dehydrogenases. Science. 1964;146:775–777. doi: 10.1126/science.146.3645.775. [DOI] [PubMed] [Google Scholar]
- 30.Yamada T, Carlsson J. Regulation of lactate dehydrogenase and change of fermentation products in streptococci. J Bacteriol. 1975;124:55–61. doi: 10.1128/jb.124.1.55-61.1975. [DOI] [PMC free article] [PubMed] [Google Scholar]


