

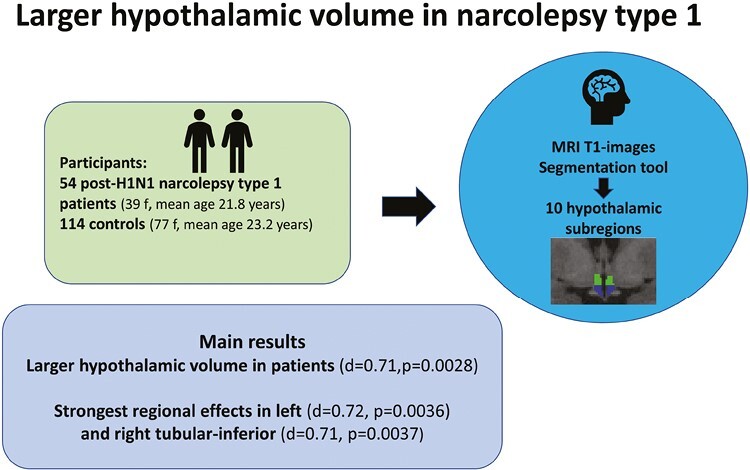
Abstract
Study Objectives
Narcolepsy type 1 (NT1) is a neurological sleep disorder. Postmortem studies have shown 75%–90% loss of the 50 000–70 000 hypocretin-producing neurons and 64%–94% increase in the 64 000–120 000 histaminergic neurons and conflicting indications of gliosis in the hypothalamus of NT1 patients. The aim of this study was to compare MRI-based volumes of the hypothalamus in patients with NT1 and controls in vivo.
Methods
We used a segmentation tool based on deep learning included in Freesurfer and computed the volume of the whole hypothalamus, left/right part of the hypothalamus, and 10 hypothalamic subregions. We included 54 patients with post-H1N1 NT1 (39 females, mean age 21.8 ± 11.0 years) and 114 controls (77 females, mean age 23.2 ± 9.0 years). Group differences were tested with general linear models using permutation testing in Permutation Analysis of Linear Models and evaluated after 10 000 permutations, yielding two-tailed P-values. Furthermore, a stepwise Bonferroni correction was performed after dividing hypothalamus into smaller regions.
Results
The analysis revealed larger volume for patients compared to controls for the whole hypothalamus (Cohen’s d = 0.71, p = 0.0028) and for the left (d = 0.70, p = 0.0037) and right part of the hypothalamus (d = 0.65, p = 0.0075) and left (d = 0.72, p = 0.0036) and right tubular-inferior (d = 0.71, p = 0.0037) hypothalamic subregions.
Conclusions
In conclusion, patients with post-H1N1 NT1 showed significantly larger hypothalamic volume than controls, in particular in the tubular-inferior subregions which could reflect several processes as previous studies have indicated neuroinflammation, gliosis, and changes in the numbers of different cell types.
Keywords: narcolepsy, hypothalamus, MRI, T1
Graphical Abstract
Statement of Significance.
This is the first large-scale MRI study to obtain volume data for the whole hypothalamus with subregions in patients with narcolepsy type 1 (NT1). Postmortem studies of patients with NT1 have shown a loss/dysfuntion of hypocretin-producing neurons, an increase in the number of histaminergic neurons, and possible gliosis in the hypothalamus. Previous structural MRI studies have reported conflicting results for hypothalamic volume changes in living patients with NT1. Our MRI study revealed larger hypothalamic volume for the patients with NT1, particularly in the tubular-inferior subregions. Future studies should explore if these structural changes could be linked to neuroinflammation, gliosis, vaccination status, or changes in cell types as increased knowledge of these types of structural changes can give important insights into disease mechanisms.
Introduction
Narcolepsy type 1 (NT1) is a disabling, chronic, neurological sleep disorder with excessive daytime sleepiness, and cataplexy (muscle atonia triggered by emotions) among the core symptoms. Patients can also experience disturbed night sleep, hypnagogic hallucinations, and sleep paralysis [1]. The H1N1 mass vaccination in 2009/2010 with Pandemrix led to over 10-fold increase in the incidence of narcolepsy in several countries including Norway [2, 3].
There are about 50 000–70 000 hypocretin-producing neurons in the lateral hypothalamus which project widely throughout the brain and have a central role in sleep–wake regulation [4–6]. In NT1, it has consistently been shown that the core symptoms are associated with hypocretin deficiency [7, 8] which can be measured in the CSF [4], reflecting the loss/dysfunction of these hypocretin-producing neurons in postmortem samples [1, 5, 6, 9]. The loss of hypocretin-producing neurons is most likely due to an autoimmune attack [1, 4]. Some of the neurons might not be irreversibly lost, but could still be undetectable due to silencing of the hypocretin expression [1].
In the tuberomammillary nucleus of the hypothalamus about 64 000–120 000 histaminergic neurons are targets for the projections from the hypocretin-producing neurons, and are partly responsible for some of the wake-promoting effects [6, 10–13]. Postmortem studies have shown 64%–94% higher numbers of histaminergic neurons in the tuberomammillary nucleus in patients with NT1 compared to healthy controls [6, 11]. Although controversial, the histaminergic neuron increase could represent a compensatory response to the loss of the hypocretin-producing neurons [1, 6], also supported by some animal models [6]. However, several other animal models do not show increased numbers of histaminergic neurons [12], suggesting that it could be more linked to the immune-based loss of hypocretin-producing neurons in patients with NT1 rather than a compensatory mechanism [11, 12]. However, a recent study of a neuroinflammatory mice model with major hypocretin impairment exhibited protracted local neuroinflammation with reactive microglia, but there was no change in the number of histaminergic neurons [14]. In regards to gliosis in the hypothalamus of patients with NT1 there have been conflicting results from previous postmortem studies where two studies [5, 15] have found gliosis and two studies [9, 16] have not.
Previous structural MRI studies in narcolepsy have reported conflicting results [17]. Some voxel-based morphometry studies have shown gray matter reduction bilaterally in the hypothalamus of narcolepsy patients compared to controls [18–21], while others report no hypothalamic volume differences between the groups [22–25].
Manual delineation of the hypothalamus from MRI scans suffers from reproducibility issues, and automated segmentation of the hypothalamus has been challenging due to both small size and lack of image contrast in its vicinity [26]. Here, we, therefore, applied a recent fully automated tool for segmentation of the hypothalamus into 10 subregions from T1-weighted MRI scans [26] on a large dataset of post-H1N1 NT1 patients and healthy controls. There has been one previous study [27] that obtained a hypothalamus segmentation of patients with narcolepsy, which found no volume differences when comparing a small, mixed, patient group of NT1, and patients with narcolepsy type 2 (NT2) with healthy controls. In our large-scale study, we therefore wanted to obtain this type of hypothalamus segmentation for patients with NT1, as increased knowledge of the structural changes in the hypothalamus of patients with NT1 could give valuable insight into the disease mechanisms.
Methods
Participants
The demographic and clinical information are summarized in Table 1. From June 2015 to April 2017, we recruited 70 patients who had a suspected NT1 disease onset after the 2009/2010 H1N1-pandemic and vaccination campaign. The patients were referred for narcolepsy disease education and counseling courses at the Norwegian Center of Expertise for neurodevelopmental disorders and hypersomnias (NevSom) as part of a national post-H1N1 narcolepsy project prompted by the Norwegian Ministry of Health and Care Services. Written informed consent was provided by all participants before inclusion (parents signed for children <16 years of age) according to the Declaration of Helsinki, and the Norwegian regional committees for medical and health research ethics (REK) approved the study.
Table 1.
Demographic and Clinical Data
| Narcolepsy type 1 patients (n = 54) |
Healthy controls (n = 114) |
|
|---|---|---|
| Sex (female), n (%) | 39 (72.2) | 77 (67.5) |
| Age (years), mean ± SD | 21.8 ± 11.0 | 23.2 ± 9.0 |
| Age at disease onset (years), mean ± SD | 16.1 ± 10.8 | N/A |
| Disease duration (years), mean ± SD |
5.8 ± 1.4 | N/A |
| H1N1-vaccinated, n (%) | 48 (88.9)* | N/A |
| Cataplexy, n (%) | 53 (98.1) | N/A |
| HLA-DQB1*06:02-positivity, n (%) | 54 (100) | N/A |
| CSF hypocretin-1 ≤ 1/3 level in normal population | 51 3 -N/A |
N/A |
| Hypnagogic hallucinations, n (%) | 46 (85.2) | N/A |
| Sleep paralysis, n (%) | 38 (70.4) | N/A |
*Disease onset was reclassified to being before the H1N1-vaccination for three typical NT1 patients after additionally acquired information during/after study inclusion. N/A, not available; SD, standard deviation.
Exclusion criteria for patients were severe somatic, neurological, or psychiatric disorders, previous head injury with loss of consciousness for 10 minutes or 30 minutes amnesia, excessive movement during MRI, metallic implants, and neuroradiological findings requiring clinical follow-up. Two patients were excluded due to not fulfilling the NT1 ICSD-3 diagnostic criteria [28], two patients were excluded due to severe psychiatric/neurological disorders, eight patients were excluded due to excessive movement during MRI, and four patients due to braces leading to bad quality MRI data, therefore 54 patients were included in the analysis.
After a thorough evaluation of their medical history and records, disease onsets were prior to inclusion determined to be after autumn 2009 i.e. post-H1N1 (48/54 were H1N1-vaccinated; 6/54 were unvaccinated). However, during/after inclusion, additional information revealed that three of the H1N1-vaccinated patients had disease onset prior to vaccination, but as these had typical NT1 phenotypes, being hypocretin-deficient, HLA-DQB1*06:02-positive with cataplexy, they remained enrolled in the study.
Pandemrix was the only vaccine used for H1N1 vaccination in Norway and H1N1-vaccination status was obtained from the official Norwegian Immunization Registry (SYSVAK) for the patients. We also included two patients in the H1N1-vaccinated group, who reported having been H1N1-vaccinated at their workplace but had not been registered in SYSVAK.
Five patients were not treated with narcolepsy medication. All other patients stopped their narcolepsy medication 14 days prior to MRI and polysomnography (PSG), except for two patients, who due to severe cataplexy were only without Venlafaxine for 7 days, and due to comorbidity one patient used Fluoxetine and one patient used Catapresan during the examinations. Patients with NT1 often have comorbidities [4]. We, therefore, accepted the following comorbidities in the main analysis: migraine (n = 6), Asperger syndrome (n = 2), attention-deficit hyperactivity disorder (ADHD; n = 1), anxiety (n = 1), depression (n = 1), Tourette syndrome (n = 1), prematurity without severe long-term complications (n = 1), kidney disease (n = 1), type 2 diabetes (n = 1), and hypothyroidism (n = 1). Since some patients had more than one comorbidity there were in total 14 patients with these comorbidities. Six patients had apnea–hypopnea index (AHI) ≥ 5 and the average AHI for the patients were 3.3 ± 9.1.
All patients were HLA-DQB1*06:02- positive. All patients with a measured hypocretin level (n = 51) were hypocretin-deficient (CSF -hypocretin-1 level < 1/3 of the normal mean). Three patients had not measured hypocretin, but had typical cataplexy and were HLA-DQB1*0602-positive. 88.9% (48/54) of all patients were H1N1-vaccinated. Cataplexy was reported in 98.1% (53/54) of all patients. Hypnagogic hallucinations were reported in 85.2% (46/54) and 70.4% (38/54) experienced sleep paralysis.
Data from the 114 healthy age- and sex-matched controls were included from ongoing studies coordinated by the Norwegian Centre for Mental Disorders Research (NORMENT), with the same MRI scanner and protocol as for the patients. Exclusion criteria were somatic, neurological or psychiatric disease, severe psychiatric family history, metallic implants, excessive movement during the MRI-scanning, previous head injury with 30 minutes amnesia or loss of consciousness for 10 minutes, and neuroradiological findings indicating ongoing or previous disease or abnormalities.
Narcolepsy diagnosis
Evaluation of the clinical and sleep parameters and CSF hypocretin-1 measurements obtained from patients were done by an experienced neurologist, sleep medicine, and narcolepsy expert (S.K.H.), including the verification of the NT1 diagnosis using the ICSD-3 criteria [28]. The patients underwent semi-structured interviews, including a Norwegian translation of the validated Stanford Sleep Questionnaire [29]. Further evaluation included clinical evaluations with examinations including a neurological examination, actigraphy, PSG, multiple sleep latency test (MSLT), human leukocyte antigen (HLA)-typing, and routine blood parameter sampling. The patients had spinal taps conducted at local hospitals prior to or after inclusion. CSF hypocretin-1 levels were analyzed at the Hormone Laboratory of Oslo University Hospital using a slight modification to the method of Phoenix Pharmaceutical St. Joseph, MO, as previously reported [7, 30].
Polysomnography recordings
Prior to their polysomnography and MSLT most of the patients were evaluated with actigraphy; 34 patients for 12–14 days (one patient not consistently), 14 patients for 8–11 days (three patients not consistently), two patients wore the actigraphy very inconsistently, and five patients were without actigraphy (Philips Actiwatch, Respironics Inc., Murrysville, PA, USA). The SOMNOmedics system (SOMNOmedics GmbH, Randersacker, Germany) were used to obtain polysomnography recordings with the electrodes F3-A2, C3-A2, O1-A2, F4-A1, C4-A1, and O2-A1, vertical and horizontal electro-oculography, surface electromyography of the tibialis anterior and submentalis muscles, nasal thermistor, nasal pressure transducer, thoracic respiratory effort, oxygen saturation, and electrocardiography. Impedance was kept below 10 kΩ (preferably 5 Ω). The full-night polysomnography was followed the next day by a 5-nap MSLT, were 2-hour intervals separated the naps (30 minutes). The MSLT was run offline and therefore not stopped before 30 minutes. However, in our patient group with almost all being confirmed hypocretin-deficient NT1 patients this does not seem to cause problems as the average sleep onset REM (SOREM)s where 4.5 and average sleep latency on MSLTs of 2.6 ± 3.0 seconds, comparable with previous studies [31]. The American Academy of Sleep Medicine criteria were used for sleep scoring [28].
MRI acquisition and processing
MRI data were collected with a General Electric Discovery MR750 3-T scanner at Oslo University Hospital using a 32-channel head coil. T1-weighted images (duration: 4 minutes and 43 seconds) were obtained with voxel size 1 × 1 × 1 mm; repetition time (TR): 8.16 milliseconds; echo time (TE): 3.18 milliseconds; flip angle: 12°; 188 sagittal slices. The T1-weighted data wer processed in FreeSurfer (v.7.1.0) using the standard recon-all pipeline. For quality control, FreeSurfer’s Euler number [32] were plotted and datasets with Euler number ± 3 standard deviations were visually inspected for possible rejection. Volume data were obtained for the whole hypothalamus, left/right part of the hypothalamus, and for 10 left/right hypothalamic subregions [26] using Freesurfer (v 7.2.0). The grouping of the hypothalamic nuclei [26, 33, 34] is summarized in Table 2. Previously we have reported on fMRI data [35] for 37 of the patients and DTI data [36] for 51 of the patients obtained in the same scanning session.
Table 2.
Overview of Hypothalamic Subregions
| Hypothalamic subregions | Hypothalamic nuclei |
|---|---|
| Anterior–superior | Paraventricular nucleus, preoptic area |
| Anterior–inferior | Suprachiasmatic nucleus, supraoptic nucleus |
| Posterior | Tuberomammillary nucleus, mamillary body (including medial and lateral mamillary nuclei), lateral hypothalamus |
| Tubular-superior | Lateral hypothalamus, dorsomedial nucleus, paraventricular nucleus |
| Tubular-inferior | Tuberomammillary nucleus, infundibular (or arcuate) nucleus, ventromedial nucleus, supraoptic nucleus, lateral tubular nucleus |
Statistical analysis
We tested for group differences for the extracted volume measures for the whole hypothalamus, the left/right part of the hypothalamus, and 10 left/right hypothalamic subregions with general linear models using permutation testing in permutation analysis of linear models [37–39]. We included age, sex, and standardized intracranial volume (ICV) in the models and ran 10 000 permutations, yielding Cohen’s d, t-statistics, contrast of parameter estimates and two-tailed P-values considered significant for the whole hypothalamus if p < 0.05. In permutation analysis of linear models, Cohen’s d is calculated as contrast of parameter estimate/ square root (variance of the residuals). Exchangeability was constrained for two siblings in the patient group to control for the lack of independence between them, but otherwise, the data could be freely exchanged. A stepwise Bonferroni correction were performed when dividing hypothalamus into smaller regions, first for the left/right part of the hypothalamus (0.05/2), therefore considered significant if p < 0.025, and then for 10 hypothalamic subregions (0.05/10), therefore considered significant if p < 0.005. We applied Statistical Package for the Social Sciences (SPSS) (v 28.0.1.1) to provide adjusted means for age, sex, and ICV for the hypothalamic volume measures. Furthermore, a subanalysis for the results showing significance in the main analysis were performed, excluding all patients with the comorbidities listed above and AHI ≥ 5. The subanalysis included 36 patients with NT1 (27 females, mean age 21.0 ± 11.2), and 114 healthy controls (77 females, mean age 23.2 ± 9.0). SPSS (v 28.0.1.1) was used to run multiple linear regression analyses to test the relationship between disease duration and the hypothalamic volumes (whole hypothalamus, right/left part of the hypothalamus, right/left tubular inferior), including ICV, age, and sex, yielding two-tailed P-values. In addition, we have divided the hypothalamic volumes (whole hypothalamus, left/right part of the hypothalamus, and left/right tubular-inferior subregions) into ≥75 quartile and ≤25 quartile groups and performed descriptive statistics.
Data availability
Due to privacy and ethical approval restrictions, the data are not publicly available as it could compromise the privacy of the participants, due to Norway having a relatively small population and NT1 being a rare disorder.
Results
Hypothalamus as a whole: patients with NT1 have larger hypothalamic volume
Figure 1 shows an example of a hypothalamic segmentation in a participant. Table 3 gives an overview of the uncorrected and adjusted (for ICV, sex, and age) mean volumes for patients with NT1 and healthy controls for hypothalamus and its subregions. Permutation testing with models including age, sex, and ICV revealed larger volume for patients compared to controls for the whole of hypothalamus (Cohen’s d = 0.71, p = 0.0028) and for the left (d = 0.70, p = 0.0037) and right part of the hypothalamus (d = 0.65, p = 0.0075), also surviving the additional stepwise Bonferroni correction (0.05/2 = 0.025).
Figure 1.
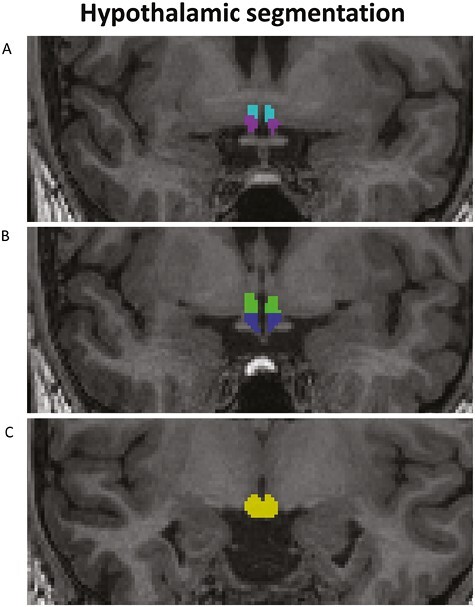
Example of the hypothalamic segmentation as included in Freesurfer v 7.2.0 [58] for one participant. (A) Light blue: anterior–superior; purple: anterior–inferior; (B) green: tubular-superior; blue: tubular-inferior; (C) yellow, posterior.
Table 3.
Uncorrected and Adjusted Mean Volumes for Hypothalamus With Subregions for Narcolepsy Type 1 Patients and Controls
| Narcolepsy type 1 patients | Healthy controls | |
|---|---|---|
| Wh. hypoth., mean (adj.mean) ± SD | 872.9 (881.1) ± 76.6* | 857.3 (853.4) ± 68.4* |
| L. part hypoth., mean (adj.mean) ± SD | 442.1 (446.1) ± 38.5* | 434.6 (432.7) ± 34.0* |
| R. part hypoth., mean(adj.mean) ± SD | 430.8 (435.0) ± 40.8* | 422.7(420.8) ± 37.4* |
| L. tubular-inferior, mean(adj.mean) ± SD | 141.8 (143.0) ± 15.2* | 137.5 (136.9) ± 12.6* |
| R. tubular-inferior, mean(adj.mean) ± SD | 132.0 (133.3) ± 13.7* | 127.9 (127.3) ± 14.1* |
| L. anterior–inferior, mean(adj.mean) ± SD | 20.6 (20.8) ± 4.8 | 19.7(19.6) ± 3.7 |
| R. anterior–inferior, mean(adj.mean) ± SD | 20.1 (20.2) ± 3.7 | 19.2 (19.2) ± 3.6 |
| L. anterior–superior, mean(adj.mean) ± SD | 25.2 (25.3) ± 5.0 | 25.0 (24.9) ± 4.1 |
| R. anterior–superior, mean(adj.mean) ± SD | 24.4 (24.6) ± 3.8 | 24.1 (24.0) ± 4.2 |
| L. posterior, mean(adj.mean) ± SD | 129.8 (131.3) ± 14.8 | 128.4 (127.6) ± 15.2 |
| R. posterior, mean(adj.mean) ± SD | 128.2 (129.7) ± 16.9 | 128.9 (128.3) ± 15.9 |
| L. tubular-superior, mean(adj.mean) ± SD | 124.7 (125.8) ± 15.0 | 124.1 (123.6) ± 13.4 |
| R. tubular-superior, mean(adj.mean) ± SD | 126.1 (127.3) ± 16.3 | 122.6 (122.1) ± 15.1 |
Volumes are in mm3, the adjusted means (adj. mean) are corrected for age, sex, and intracranial volume. Hypoth., hypothalamus; L, left; R, right; SD, standard deviation; Wh, whole; *, significant results in the main analysis.
Hypothalamic subregions: patients with NT1 have larger volumes in tubular-inferior subregions.
We found larger volume for patients compared to controls for the left (d = 0.72, p = 0.0036) and right tubular-inferior (d = 0.71, p = 0.0037) hypothalamic subregions, which also survived the additional stepwise Bonferroni correction for 10 hypothalamic subregions (0.05/10 = 0.005). Anatomically this area contains parts of the histaminergic tuberomammillary nucleus. We also found larger volume for patients compared to controls for the right tubular-superior subregion (d = 0.52, p = 0.032); however, this finding did not survive the additional stepwise Bonferroni correction.
Hypothalamic subregions with no significant findings
Permutation testing revealed no group differences for left (d = 0.13, p = 0.60) and right anterior–superior (d = 0.19, p = 0.43), left (d = 0.41, p = 0.095) and right anterior–inferior (d = 0.43, p = 0.080), left (d = 0.41, p = 0.099) and right posterior (d = 0.15, p = 0.55) and left tubular-superior (d = 0.26, p = 0.28) subregions.
Subanalysis–disease duration
Descriptive statistics for ≥75 quartile and ≤25 quartile groups for the hypothalamic volumes (whole hypothalamus, left/right part of the hypothalamus, and left/right tubular-inferior subregions) are presented in Supplementary Table S1 and S2. Multiple linear regression analysis was performed to explore the relationship between disease duration and hypothalamic volumes (whole hypothalamus, left/right part of the hypothalamus, and left/right tubular-inferior subregions), ICV, age, and sex were included in the analysis. There were no significant results for the whole hypothalamus (p = 0.63), left (p = 0.55) or right part of the hypothalamus (p = 0.75) or the left (p = 0.49) or right tubular-inferior (p = 0.77).
Subanalysis–Comorbidity
Follow-up analyses excluding patients with the comorbidities listed above and AHI ≥ 5 were performed for the whole hypothalamus, left/right part of the hypothalamus, and left/right tubular-inferior subregions. Similar results were seen after permutation testing, with patients having larger volume than controls, for the whole hypothalamus (d = 0.57, p = 0.03), right part of the hypothalamus (d = 0.60, p = 0.027), left part of the hypothalamus (d = 0.47, p = 0.077), left tubular-inferior (d = 0.52 p = 0.059) and right tubular-inferior (d = 0.61, p = 0.020) subregions.
Discussion
Our main finding was a larger hypothalamic volume in post-H1N1 NT1 patients compared to healthy controls. The strongest regional effect was observed bilaterally for tubular-inferior hypothalamic subregions, which was likewise larger in patients compared to controls.
There are several possible explanations for the increase in volume as previous studies have indicated neuroinflammation, gliosis, and increase in the number of histaminergic neurons in the hypothalamus of patients with NT1 [1, 5, 6, 9, 12, 15, 16]. Interestingly, the hypothalamic tubular-inferior subregion where we have our strongest regional finding of volume increase, consists of several nuclei where Thannickal et al. [15] in a postmortem study found indications of gliosis through increase in glial fibrillary acidic protein stained astrocytes; tuberomammillary nucleus (183.5%), arcuate nucleus (150.1%), ventromedial nucleus (127.3%) and supraoptic nucleus (57.8%). Gliosis could therefore be part of the explanation for our findings. However, two other postmortem studies [9, 16] reported no microglial response indicating active inflammation or residual gliosis in the hypothalamus of NT1 patients.
Furthermore, the tuberomammillary nucleus, which is partly included in the hypothalamic tubular-inferior subregion is where about 64 000–120 000 histaminergic neurons normally can be found [6, 12, 13, 40]. Previous postmortem studies have reported 64%–94% higher number of these neurons in NT1 patients [6, 11, 12, 40], which also possibly could be a part of the processes that leads to the current findings of larger volume for patients with NT1 compared to controls in the hypothalamus and specifically in the tubular-inferior subregions.
Both hypocretin-producing neurons and histaminergic neurons have roles in sleep–wake regulation and they are often found adjacent to each other in the posterior parts of hypothalamus [11]. Furthermore, their projections to other parts of the brain largely overlap and hypocretin-producing neurons project heavily to the areas of the histaminergic neurons and vice versa [11]. The histaminergic neurons and the hypocretin-producing neurons are both maximally active during wakefulness and downregulated during sleep [11]. Pitolisant, which activates histamine release in the brain can reduce excessive daytime sleepiness and cataplexy, and is used for treating narcolepsy [41, 42]. It is still controversial whether the increased numbers of histaminergic neurons represent a compensatory mechanism [1, 6, 12, 14]. However, if this is the case the findings from our patient group with a homogenous and relatively low disease duration of 5.8 ± 1.4 years further point to that such a compensatory mechanism is present already at this time of the disease course. Alternatively, the increased number of histaminergic neurons in NT1 patients could represent a part of the pathogenesis, being linked to the immune-based loss of the hypocretin-producing neurons, or perhaps be influenced by treatment, since some of the animal models of NT1 do not exhibit this type of increase [11, 12]. To the best of our knowledge, there are no clinical studies directly addressing hypothalamic size and use of stimulants. However, in MRI studies of treated versus non-treated ADHD patients, there are some indications that stimulants could be linked to structural alterations, for example, a larger posttreatment thalamus were reported in stimulant-treated patients with ADHD than controls [43]. Another study [44] found smaller volume of right hippocampus in ADHD patients using stimulant treatment compared to medication-naïve patients and controls, while a third study [45] indicated a relationship between treatment history with caudate and anterior cingulate volumetric changes in children with ADHD. In narcolepsy patients, there are conflicting results in regard to medication, as three small studies found no difference between drug-naïve and stimulant-treated patients [21, 23, 25]. While one study [18] found that six drug-naïve patients had lower occipital gray matter volume compared to 11 drug-exposed, however, as the authors themselves note the findings should be interpreted with caution due to few patients in each group.
Most of the hypocretin-producing neurons will be located in the tuberal part of the hypothalamus, they can be found throughout the dorsal part of the parafornical nucleus, the tuberal lateral hypothalamic areas, and areas near the dorsomedial and ventromedial hypothalamic nuclei [9]. The loss of up to 90% of the 50 000–70 000 neurons could counteract some of the possible volume effects of up to 94% increase in the 64 000–120 000 histaminergic neurons; however, as our study indicates the volume increase still seems to be dominating, similar to what the postmortem studies have indicated [5, 6, 9, 12]. Also as previously mentioned, it is possible that some of the hypocretin-producing neurons are not irreversibly lost but could be difficult to detect due to silencing of the hypocretin expression [1]. A recent study [46] indicates that a substantial number of hypocretin neurons could be present in patients with NT1, but that methylation has silenced the hypocretin gene.
Only one previous study [27] has performed hypothalamic segmentation of patients with narcolepsy. However, the study had a small, mixed patient group of nine NT1 patients and six patients with NT2 and found no volume differences when comparing the mixed group to healthy controls. The disease mechanism behind NT2 is still unknown. Although some patients with NT2 can clinically progress into NT1 [47], and a single postmortem study has shown partially loss of hypocretin neurons in a few patients with NT2 [48], CSF hypocretin-1 levels are per definition normal in NT2 [28]. Some patients without cataplexy and without known CSF hypocretin-1 levels diagnosed as NT2 can in reality be hypocretin-deficient if CSF hypocretin-1 is later measured, but this is expectedly only a small part of this group [7]. Hence including this many patients with NT2 in their patient group would mean that most likely about 40% of their patient group would not be hypocretin-deficient and not have an increase in the numbers of histaminergic neurons or gliosis [1].
Most other previous studies have largely used voxel-based morphometry and examined hypothalamus as a whole, with conflicting results [17–25]. Previous studies have either found gray matter hypothalamic volume reduction in narcolepsy patients [18–21] or no significant volume differences between narcolepsy patients and controls [22–25]. Except for two 3-T MRI studies [18, 27] all the previous publications have been performed on data obtained from 1.5-T scanners. This could be part of the explanation for the difference in the results between our study and the previous studies. Another likely explanation could be the increased power of our study as we have almost twice the number of NT1 patients (n = 54) as the two previous largest studies (n = 29) [19, 20], and the remaining studies have <20 patients included; n = 12 [22, 23], n = 15 [24, 27], n = 16 [25], n =17 [18], and n = 19 [21]. An alternative explanation for the discrepancies could be that we have a very homogenous patient sample relatively close to disease onset compared to previous studies. In our study, 51/54 patients have confirmed hypocretin deficiency (three of the patients had not yet performed this measure but had confirmed NT1 with cataplexy and HLA-DQB1*0602-positivity) and our patients had a very homogenous disease duration of approximately 6 years. In one of the largest previous studies, Draganski et al. [19] reported reduced hypothalamic volume in patients with narcolepsy, 29 narcolepsy patients were compared to 29 age- and sex-matched controls with voxel-based morphometry. However, it is unclear if there were both NT1 and patients with NT2 included and disease duration, medication, and hypocretin status were not reported, making a direct comparison with our results difficult.
Buskova et al. [21] also reported reduction in hypothalamus in 19 NT1 patients compared to 16 controls using voxel-based morphometry. They had available hypocretin measures, but the patient group had a wide range in age (18–67 years) and disease duration (1–40 years). In fact, most previous studies have longer disease duration with a wider range than our study, although the same information is not available for every study.
Studies reporting no hypothalamic gray matter volume differences between groups have also often included highly heterogeneous groups of narcolepsy patients. Brenneis et al. [22] reported an age range from 22 to 72 years and a narcolepsy disease duration varying between 3–55 years. Overeem et al. [24] reported a similar wide age range (mean: 44.7 years, range: 21-70 years) as well as narcolepsy disease duration (mean: 19.2 years, range: 2–50 years), as well as Scherfler et al. [25] with age (mean: 56.8 years, range: 40–70 years) and narcolepsy disease duration (mean: 30.6 years, range: 6–-59 years), and Kaufmann et al. [23] with a wide age range (mean: 36.9 years, range: 22–65 years) and a mean disease duration of 12 years. Given that NT1 are known to both have a loss/dysfunction of the hypocretin-producing neurons as well as the increase in histaminergic neuron numbers, having a similar disease duration of the patient group might be important for the assessment of potential compensatory processes [11].
Another possible explanation could be that the current finding of larger volume is specific to H1N1-vaccinated narcolepsy patients as 88.9% of our patients were H1N1-vaccinated (although three of the H1N1-vaccinated patients had disease onset prior to vaccination). In a previous study by our group [36] using diffusion tensor imaging, we found white matter abnormalities more widespread than previously reported in studies of sporadic narcolepsy. However, these differences could also simply be due to increased power as our study had almost three times more patients (n = 57) as the largest previous diffusion tensor imaging study of narcolepsy (n = 22) [49].
Previous studies have largely indicated that sporadic and H1N1-vaccine-related narcolepsy have quite similar clinical core phenotypes [3, 50–52]. However, a few possible differences have been noted like more abrupt onset of symptoms [2, 3, 52–54], shorter mean sleep latency, more disturbed sleep characteristics [50], a higher number of sleep onset rapid eye movement periods [51] and some reports of severe psychiatric symptoms in a few cases [3, 53]. In a study [55] specifically comparing polysomnographic and actigraphic characteristics between patients with H1N1-vaccine-related narcolepsy and patients with sporadic narcolepsy, findings were fairly similar except for a possible earlier sleep–wake rhythm in H1N1-vaccine-related narcolepsy.
Furthermore, in a previous study by our group of post-H1N1 narcolepsy (largely H1N1-vaccinated) [56], as well as a study from 2020 [57], the risk/protective profile for HLA-alleles for post-H1N1 NT1 was similar as reported previously for pre-H1N1 narcolepsy. However, it cannot be entirely ruled out that our MRI T1 findings are specific to patients with post-H1N1 narcolepsy, since the automated hypothalamic segmentation from Freesurfer still has not been performed on a pre-H1N1 narcolepsy sample.
In the main analysis, we included patients with comorbidities and AHI ≥ 5 to support generalizability to a real-world clinical setting [4]. Supporting the main results, the subanalysis excluding patients with these comorbidities indicated similar results as the main analysis, although there was some loss of power (36 vs. 54 patients). There was no significant correlation between the hypothalamic volumes (whole hypothalamus, right/left part of the hypothalamus, right/left tubular inferior) and disease duration. However, exploring correlations with disease duration in our sample has limitations as our sample is quite homogenous including for the mean disease duration 5.8 ± 1.4 years (range 9.15 years), this should therefore be further assessed in a multi-center study to obtain larger and more heterogenous samples.
A limitation of our study is that we cannot perfectly adapt the hypothalamic segmentation into the subregions that we are most interested in; however, the automated segmentation is based on visible anatomical landmarks which can be reliably segmented [26, 33]. Furthermore, we have studied post-H1N1 patients and the automatic hypothalamic segmentation will have to be performed in sporadic NT1 patients to verify that the results are generalizable. We further acknowledge that our MSLT approach (30 minutes offline pr SLT test) could potentially lower the sleep pressure, but in our NT1 sample, the average SOREMs and average sleep latency on MSLTs were comparable with previous studies [31].
In conclusion, we found larger hypothalamic volumes in post-H1N1 NT1 patients compared to controls, particularly bilaterally in the tubular-inferior hypothalamic subregions, which we speculate could possibly be linked to gliosis due to neuroinflammation or increase in the numbers of histaminergic neurons in NT1. We believe our findings shed light on the disease processes occurring in the hypothalamus of NT1. Moreover, if structural brain changes are shown to be specific for hypocretin-deficient narcolepsy this could also in the future have potential to be used for noninvasive diagnostic purposes.
Supplementary Material
Acknowledgments
A special thank you goes to Janita Vevelstad (nurse at the Norwegian Centre of Expertise for Neurodevelopmental Disorders and Hypersomnias (NevSom), Oslo University Hospital) and Rannveig Viste (nurse, molecular biologist and PhD-student at the Norwegian Centre of Expertise for Neurodevelopmental Disorders and Hypersomnias (NevSom), Oslo University Hospital) for being a part of the data collection and sleep scoring of polysomnography/MSLTs. Furthermore, we would like to express our appreciation for Ranveig Østrem’s (bioengineer at the Hormone Laboratory at Oslo University Hospital) work with the HLA-typing.
Contributor Information
Hilde T Juvodden, Department of Rare Disorders, Norwegian Centre of Expertise for Neurodevelopmental Disorders and Hypersomnias (NevSom), Oslo University Hospital, Ullevål, Oslo, Norway.
Dag Alnæs, Division of Mental Health and Addiction, NORMENT Centre, University of Oslo and Oslo University Hospital, Oslo, Norway; Departement of Psychology, Pedagogy and Law, Kristiania University College, Oslo, Norway.
Martina J Lund, Division of Mental Health and Addiction, NORMENT Centre, University of Oslo and Oslo University Hospital, Oslo, Norway; Norwegian Centre for Mental Disorders Research, Institute of Clinical Medicine, University of Oslo, Oslo, Norway.
Ingrid Agartz, Norwegian Centre for Mental Disorders Research, Institute of Clinical Medicine, University of Oslo, Oslo, Norway; Department of Psychiatric Research, Diakonhjemmet Hospital, Oslo, Norway; K.G. Jebsen Centre for Neurodevelopmental Disorders, University of Oslo, Oslo, Norway.
OIe A Andreassen, Division of Mental Health and Addiction, NORMENT Centre, University of Oslo and Oslo University Hospital, Oslo, Norway; K.G. Jebsen Centre for Neurodevelopmental Disorders, University of Oslo, Oslo, Norway.
Andres Server, Department of Radiology and Nuclear Medicine, Oslo University Hospital, Oslo, Norway.
Per M Thorsby, Hormone Laboratory, Department of Medical Biochemistry, Biochemical Endocrinology and Metabolism Research Group, Oslo University Hospital, Aker, Oslo, Norway; Institute of Clinical Medicine, University of Oslo, Oslo, Norway.
Lars T Westlye, Division of Mental Health and Addiction, NORMENT Centre, University of Oslo and Oslo University Hospital, Oslo, Norway; K.G. Jebsen Centre for Neurodevelopmental Disorders, University of Oslo, Oslo, Norway; Department of Psychology, University of Oslo, Oslo, Norway.
Stine Knudsen Heier, Department of Rare Disorders, Norwegian Centre of Expertise for Neurodevelopmental Disorders and Hypersomnias (NevSom), Oslo University Hospital, Ullevål, Oslo, Norway; Institute of Clinical Medicine, University of Oslo, Oslo, Norway.
Funding
S.K.H. was partially funded by research support from the Norwegian Ministry of Health and Care Services. H.T.J. was during data collection fully funded by the Norwegian Ministry of Health and Care Services and during data analyses by a grant from the South–Eastern Norway Regional Health Authority (2019032). D. A was supported by the South–Eastern Norway Regional Health Authorities (2019107, 2020086). M.J.L. was supported by the Research Council of Norway (276082 - LifespanHealth). The European Union’s Horizon 2020 Research and Innovation program (ERC StG, Grant # 802998), the Research Council of Norway (300767) and the South–Eastern Norway Regional Health Authority (2019101) was also part of funding this study.
Disclosure Statement
Financial Disclosure: H.T.J has no financial interests to disclose. D.A. has no financial interests to disclose. M.J.L. has no financial interests to disclose. I.A. has no financial interests to disclose. O.A.A. is a consultant for CorTechs.ai and has received speaker’s honorarium from Lundbeck, Jansen, and Sunovion. A.S. has no financial interests to disclose. P.M.T. has no financial interests to disclose. L.T.W has no financial interests to disclose. S.K.H have been lecturing about narcolepsy for UCB Pharma, AOP Orphan, Jazz Pharmaceuticals, Lundbeck AS, honorarium have been paid to Norwegian Centre of Expertise for Neurodevelopmental Disorders and Hypersomnias (NevSom). S.K.H. has received honorarium for being an expert consultant for the Norwegian state regarding narcolepsy and Pandemrix. NonFinancial Disclosure: None of the authors have nonfinancial interests to disclose.
References
- 1. Bassetti CLA, Adamantidis A, Burdakov D, et al. Narcolepsy - clinical spectrum, aetiopathophysiology, diagnosis and treatment. Nat Rev Neurol. 2019;15(9):519–539. doi: 10.1038/s41582-019-0226-9 [DOI] [PubMed] [Google Scholar]
- 2. Heier MS, Gautvik KM, Wannag E, et al. Incidence of narcolepsy in Norwegian children and adolescents after vaccination against H1N1 influenza A. Sleep Med. 2013;14(9):867–871. doi: 10.1016/j.sleep.2013.03.020 [DOI] [PubMed] [Google Scholar]
- 3. Sarkanen TO, Alakuijala APE, Dauvilliers YA, Partinen MM.. Incidence of narcolepsy after H1N1 influenza and vaccinations: systematic review and meta-analysis. Sleep Med Rev. 2018;38:177–186. doi: 10.1016/j.smrv.2017.06.006 [DOI] [PubMed] [Google Scholar]
- 4. Kornum BR, Knudsen S, Ollila HM, et al. Narcolepsy. Nat Rev Dis Primers. 2017;3:16100. doi: 10.1038/nrdp.2016.100 [DOI] [PubMed] [Google Scholar]
- 5. Thannickal TC, Moore RY, Nienhuis R, et al. Reduced number of hypocretin neurons in human narcolepsy. Neuron. 2000;27(3):469–474. doi: 10.1016/s0896-6273(00)00058-1 [DOI] [PMC free article] [PubMed] [Google Scholar]
- 6. Valko PO, Gavrilov YV, Yamamoto M, et al. Increase of histaminergic tuberomammillary neurons in narcolepsy. Ann Neurol. 2013;74(6):794–804. doi: 10.1002/ana.24019 [DOI] [PubMed] [Google Scholar]
- 7. Knudsen S, Jennum PJ, Alving J, Sheikh SP, Gammeltoft S.. Validation of the ICSD-2 criteria for CSF hypocretin-1 measurements in the diagnosis of narcolepsy in the Danish population. Sleep. 2010;33(2):169–176. doi: 10.1093/sleep/33.2.169 [DOI] [PMC free article] [PubMed] [Google Scholar]
- 8. Mignot E, Lammers GJ, Ripley B, et al. The role of cerebrospinal fluid hypocretin measurement in the diagnosis of narcolepsy and other hypersomnias. Arch Neurol. 2002;59(10):1553–1562. doi: 10.1001/archneur.59.10.1553 [DOI] [PubMed] [Google Scholar]
- 9. Peyron C, Faraco J, Rogers W, et al. A mutation in a case of early onset narcolepsy and a generalized absence of hypocretin peptides in human narcoleptic brains. Nat Med. 2000;6(9):991–997. doi: 10.1038/79690 [DOI] [PubMed] [Google Scholar]
- 10. Mochizuki T, Arrigoni E, Marcus JN, et al. Orexin receptor 2 expression in the posterior hypothalamus rescues sleepiness in narcoleptic mice. Proc Natl Acad Sci U S A. 2011;108(11):4471–4476. doi: 10.1073/pnas.1012456108 [DOI] [PMC free article] [PubMed] [Google Scholar]
- 11. Shan L, Dauvilliers Y, Siegel JM.. Interactions of the histamine and hypocretin systems in CNS disorders. Nat Rev Neurol. 2015;11(7):401–413. doi: 10.1038/nrneurol.2015.99 [DOI] [PMC free article] [PubMed] [Google Scholar]
- 12. John J, Thannickal TC, McGregor R, et al. Greatly increased numbers of histamine cells in human narcolepsy with cataplexy. Ann Neurol. 2013;74(6):786–793. doi: 10.1002/ana.23968 [DOI] [PMC free article] [PubMed] [Google Scholar]
- 13. Airaksinen MS, Paetau A, Paljärvi L, et al. Histamine neurons in human hypothalamus: anatomy in normal and Alzheimer diseased brains. Neuroscience. 1991;44(2):465–481. doi: 10.1016/0306-4522(91)90070-5 [DOI] [PubMed] [Google Scholar]
- 14. Melzi S, Morel AL, Scoté-Blachon C, Liblau R, Dauvilliers Y, Peyron C.. Histamine in murine narcolepsy: what do genetic and immune models tell us? Brain Pathol. 2022;32(2):e13027. doi: 10.1111/bpa.13027 [DOI] [PMC free article] [PubMed] [Google Scholar]
- 15. Thannickal TC, Siegel JM, Nienhuis R, Moore RY.. Pattern of hypocretin (orexin) soma and axon loss, and gliosis, in human narcolepsy. Brain Pathol. 2003;13(3):340–351. doi: 10.1111/j.1750-3639.2003.tb00033.x [DOI] [PMC free article] [PubMed] [Google Scholar]
- 16. Honda M, Arai T, Fukazawa M, et al. Absence of ubiquitinated inclusions in hypocretin neurons of patients with narcolepsy. Neurology. 2009;73(7):511–517. doi: 10.1212/WNL.0b013e3181b2a6af [DOI] [PMC free article] [PubMed] [Google Scholar]
- 17. Wada M, Mimura M, Noda Y, et al. Neuroimaging correlates of narcolepsy with cataplexy: a systematic review. Neurosci Res. 2019;142:16–29. doi: 10.1016/j.neures.2018.03.005 [DOI] [PubMed] [Google Scholar]
- 18. Kim SJ, Lyoo IK, Lee YS, et al. Gray matter deficits in young adults with narcolepsy. Acta Neurol Scand. 2009;119(1):61–67. doi: 10.1111/j.1600-0404.2008.01063.x [DOI] [PubMed] [Google Scholar]
- 19. Draganski B, Geisler P, Hajak G, et al. Hypothalamic gray matter changes in narcoleptic patients. Nat Med. 2002;8(11):1186–1188. doi: 10.1038/nm1102-1186 [DOI] [PubMed] [Google Scholar]
- 20. Joo EY, Tae WS, Kim ST, Hong SB.. Gray matter concentration abnormality in brains of narcolepsy patients. Korean J Radiol. 2009;10(6):552–558. doi: 10.3348/kjr.2009.10.6.552 [DOI] [PMC free article] [PubMed] [Google Scholar]
- 21. Buskova J, Vaneckova M, Sonka K, Seidl Z, Nevsimalova S.. Reduced hypothalamic gray matter in narcolepsy with cataplexy. Neuro Endocrinol Lett. 2006;27(6):769–772. [PubMed] [Google Scholar]
- 22. Brenneis C, Brandauer E, Frauscher B, et al. Voxel-based morphometry in narcolepsy. Sleep Med. 2005;6(6):531–536. doi: 10.1016/j.sleep.2005.03.015 [DOI] [PubMed] [Google Scholar]
- 23. Kaufmann C, Schuld A, Pollmächer T, Auer DP.. Reduced cortical gray matter in narcolepsy: preliminary findings with voxel-based morphometry. Neurology. 2002;58(12):1852–1855. doi: 10.1212/wnl.58.12.1852 [DOI] [PubMed] [Google Scholar]
- 24. Overeem S, Steens SC, Good CD, et al. Voxel-based morphometry in hypocretin-deficient narcolepsy. Sleep. 2003;26(1):44–46. [PubMed] [Google Scholar]
- 25. Scherfler C, Frauscher B, Schocke M, et al. White and gray matter abnormalities in narcolepsy with cataplexy. Sleep. 2012;35(3):345–351. doi: 10.5665/sleep.1692 [DOI] [PMC free article] [PubMed] [Google Scholar]
- 26. Billot B, Bocchetta M, Todd E, Dalca AV, Rohrer JD, Iglesias JE.. Automated segmentation of the hypothalamus and associated subunits in brain MRI. Neuroimage. 2020;223:117287. doi: 10.1016/j.neuroimage.2020.117287 [DOI] [PMC free article] [PubMed] [Google Scholar]
- 27. Kim HC, Lee DA, Lee HJ, Shin KJ, Park KM.. Alterations in the structural covariance network of the hypothalamus in patients with narcolepsy. Neuroradiology. 2022;64:1351–1357. doi: 10.1007/s00234-021-02878-6 [DOI] [PubMed] [Google Scholar]
- 28. American Academy of Sleep Medicine(AASM). International Classification of Sleep Disorders (ICSD) 3ed.Darien, IL: American Academy of Sleep Medicine; 2014. [Google Scholar]
- 29. Anic-Labat S, Guilleminault C, Kraemer HC, Meehan J, Arrigoni J, Mignot E.. Validation of a cataplexy questionnaire in 983 sleep-disorders patients. Sleep. 1999;22(1):77–87. [PubMed] [Google Scholar]
- 30. Heier MS, Evsiukova T, Vilming S, Gjerstad MD, Schrader H, Gautvik K.. CSF hypocretin-1 levels and clinical profiles in narcolepsy and idiopathic CNS hypersomnia in Norway. Sleep. 2007;30(8):969–973. doi: 10.1093/sleep/30.8.969 [DOI] [PMC free article] [PubMed] [Google Scholar]
- 31. Arand DL, Bonnet MH.. The multiple sleep latency test. Handb Clin Neurol. 2019;160:393–403. doi: 10.1016/B978-0-444-64032-1.00026-6 [DOI] [PubMed] [Google Scholar]
- 32. Rosen AFG, Roalf DR, Ruparel K, et al. Quantitative assessment of structural image quality. Neuroimage. 2018;169:407–418. doi: 10.1016/j.neuroimage.2017.12.059 [DOI] [PMC free article] [PubMed] [Google Scholar]
- 33. Makris N, Swaab DF, van der Kouwe A., et al. Volumetric parcellation methodology of the human hypothalamus in neuroimaging: normative data and sex differences. Neuroimage. 2013;69:1–10. doi: 10.1016/j.neuroimage.2012.12.008 [DOI] [PMC free article] [PubMed] [Google Scholar]
- 34. Bocchetta M, Gordon E, Manning E, et al. Detailed volumetric analysis of the hypothalamus in behavioral variant frontotemporal dementia. J Neurol. 2015;262(12):2635–2642. doi: 10.1007/s00415-015-7885-2 [DOI] [PMC free article] [PubMed] [Google Scholar]
- 35. Juvodden HT, Alnaes D, Lund MJ, et al. , Hypocretin-deficient narcolepsy patients have abnormal brain activation during humor processing. Sleep. 2019;42(7). doi: 10.1093/sleep/zsz082 [DOI] [PubMed] [Google Scholar]
- 36. Juvodden HT, Alnaes D, Lund MJ, et al. , Widespread white matter changes in post-H1N1 patients with narcolepsy type 1 and first-degree relatives. Sleep. 2018;41(10). doi: 10.1093/sleep/zsy145 [DOI] [PubMed] [Google Scholar]
- 37. Winkler AM, Ridgway GR, Webster MA, Smith SM, Nichols TE.. Permutation inference for the general linear model. Neuroimage. 2014;92:381–397. doi: 10.1016/j.neuroimage.2014.01.060 [DOI] [PMC free article] [PubMed] [Google Scholar]
- 38. Winkler AM, Webster MA, Vidaurre D, Nichols TE, Smith SM.. Multi-level block permutation. Neuroimage. 2015;123:253–268. doi: 10.1016/j.neuroimage.2015.05.092 [DOI] [PMC free article] [PubMed] [Google Scholar]
- 39. Winkler, A. PALM. FMRIB Software Library 2020. https://fsl.fmrib.ox.ac.uk/fsl/fslwiki/PALM. Accessed June 26, 2023.
- 40. Yoshikawa T, Nakamura T, Yanai K.. Histaminergic neurons in the tuberomammillary nucleus as a control centre for wakefulness. Br J Pharmacol. 2021;178(4):750–769. doi: 10.1111/bph.15220 [DOI] [PubMed] [Google Scholar]
- 41. Dauvilliers Y, Bassetti C, Lammers GJ, et al.; HARMONY I study group. Pitolisant versus placebo or modafinil in patients with narcolepsy: a double-blind, randomised trial. Lancet Neurol. 2013;12(11):1068–1075. doi: 10.1016/S1474-4422(13)70225-4 [DOI] [PubMed] [Google Scholar]
- 42. Szakacs Z, Dauvilliers Y, Mikhaylov V, et al.; HARMONY-CTP study group. Safety and efficacy of pitolisant on cataplexy in patients with narcolepsy: a randomised, double-blind, placebo-controlled trial. Lancet Neurol. 2017;16(3):200–207. doi: 10.1016/S1474-4422(16)30333-7 [DOI] [PubMed] [Google Scholar]
- 43. Ivanov I, Bansal R, Hao X, et al. Morphological abnormalities of the thalamus in youths with attention deficit hyperactivity disorder. Am J Psychiatry. 2010;167(4):397–408. doi: 10.1176/appi.ajp.2009.09030398 [DOI] [PMC free article] [PubMed] [Google Scholar]
- 44. Onnink AM, Zwiers MP, Hoogman M, et al. Brain alterations in adult ADHD: effects of gender, treatment and comorbid depression. Eur Neuropsychopharmacol. 2014;24(3):397–409. doi: 10.1016/j.euroneuro.2013.11.011 [DOI] [PubMed] [Google Scholar]
- 45. Semrud-Clikeman M, Pliśzka SR, Lancaster J, Liotti M.. Volumetric MRI differences in treatment-naïve vs chronically treated children with ADHD. Neurology. 2006;67(6):1023–1027. doi: 10.1212/01.wnl.0000237385.84037.3c [DOI] [PubMed] [Google Scholar]
- 46. Seifinejad A, Ramosaj M, Shan L, et al. Epigenetic silencing of selected hypothalamic neuropeptides in narcolepsy with cataplexy. Proc Natl Acad Sci U S A. 2023;120(19):e2220911120. doi: 10.1073/pnas.2220911120 [DOI] [PMC free article] [PubMed] [Google Scholar]
- 47. Latorre D, Sallusto F, Bassetti CLA, Kallweit U.. Narcolepsy: a model interaction between immune system, nervous system, and sleep-wake regulation. Semin Immunopathol. 2022;44(5):611–623. doi: 10.1007/s00281-022-00933-9 [DOI] [PMC free article] [PubMed] [Google Scholar]
- 48. Thannickal TC, Nienhuis R, Siegel JM.. Localized loss of hypocretin (orexin) cells in narcolepsy without cataplexy. Sleep. 2009;32(8):993–998. doi: 10.1093/sleep/32.8.993 [DOI] [PMC free article] [PubMed] [Google Scholar]
- 49. Park YK, Kwon OH, Joo EY, et al. White matter alterations in narcolepsy patients with cataplexy: tract-based spatial statistics. J Sleep Res. 2016;25(2):181–189. doi: 10.1111/jsr.12366 [DOI] [PubMed] [Google Scholar]
- 50. Pizza F, Peltola H, Sarkanen T, Moghadam KK, Plazzi G, Partinen M.. Childhood narcolepsy with cataplexy: comparison between post-H1N1 vaccination and sporadic cases. Sleep Med. 2014;15(2):262–265. doi: 10.1016/j.sleep.2013.09.021 [DOI] [PubMed] [Google Scholar]
- 51. Dauvilliers Y, Arnulf I, Lecendreux M, et al.; Narcoflu-VF study group. Increased risk of narcolepsy in children and adults after pandemic H1N1 vaccination in France. Brain. 2013;136(Pt 8):2486–2496. doi: 10.1093/brain/awt187 [DOI] [PubMed] [Google Scholar]
- 52. Sarkanen T, Alakuijala A, Partinen M.. Clinical course of H1N1-vaccine-related narcolepsy. Sleep Med. 2016;19:17–22. doi: 10.1016/j.sleep.2015.11.005 [DOI] [PubMed] [Google Scholar]
- 53. Partinen M, Saarenpaa-Heikkila O, Ilveskoski I, et al. Increased incidence and clinical picture of childhood narcolepsy following the 2009 H1N1 pandemic vaccination campaign in Finland. PLoS One. 2012;7(3):e33723. doi: 10.1371/journal.pone.0033723 [DOI] [PMC free article] [PubMed] [Google Scholar]
- 54. Szakács A, Darin N, Hallböök T.. Increased childhood incidence of narcolepsy in western Sweden after H1N1 influenza vaccination. Neurology. 2013;80(14):1315–1321. doi: 10.1212/WNL.0b013e31828ab26f [DOI] [PubMed] [Google Scholar]
- 55. Alakuijala A, Sarkanen T, Partinen M.. Polysomnographic and actigraphic characteristics of patients with H1N1-vaccine-related and sporadic narcolepsy. Sleep Med. 2015;16(1):39–44. doi: 10.1016/j.sleep.2014.07.024 [DOI] [PubMed] [Google Scholar]
- 56. Juvodden HT, Viken MK, Nordstrand SEH, et al. , HLA and sleep parameter associations in post-H1N1 narcolepsy type 1 patients and first-degree relatives. Sleep. 2020;43(3). doi: 10.1093/sleep/zsz239 [DOI] [PubMed] [Google Scholar]
- 57. Schinkelshoek M, Fronczek R, Verduijn W, et al. HLA associations in narcolepsy type 1 persist after the 2009 H1N1 pandemic. J Neuroimmunol. 2020;342:577210. doi: 10.1016/j.jneuroim.2020.577210 [DOI] [PubMed] [Google Scholar]
- 58. Billot, B. Segmentation of hypothalamic subunits. FreeSurfer 2022. https://surfer.nmr.mgh.harvard.edu/fswiki/HypothalamicSubunits. Accessed June 26, 2023.
Associated Data
This section collects any data citations, data availability statements, or supplementary materials included in this article.
Supplementary Materials
Data Availability Statement
Due to privacy and ethical approval restrictions, the data are not publicly available as it could compromise the privacy of the participants, due to Norway having a relatively small population and NT1 being a rare disorder.