

Abstract
Background
The programmed cell death protein 1 (PD-1) and programmed death ligand 1 (PD-L1) are validated cancer targets; however, emerging mechanisms and impact of PD-L1 intracellular signaling on cancer behavior are poorly understood.
Methods
We investigated the cancer cell intrinsic role of PD-L1 in multiple patient-derived models in vitro and in vivo. PD-L1 overexpression, knockdown, and PD-L1 intracellular domain (PD-L1–ICD) deletion (Δ260-290PD-L1) models were assessed for key cancer properties: clonogenicity, motility, invasion, and immune evasion. To determine how PD-L1 transduces signals intracellularly, we used the BioID2 platform to identify the PD-L1 intracellular interactome. Both human papillomavirus-positive and negative patient-derived xenografts were implanted in NOD-scid-gamma and humanized mouse models to investigate the effects of recombinant PD-1, anti–PD-L1, and anti–signal transducer and activator of transcription 3 (STAT3) in vivo.
Results
PD-L1 intracellular signaling increased clonogenicity, motility, and invasiveness in multiple head and neck squamous cell carcinoma (HNSCC) models, and PD-1 binding enhanced these effects. Protein proximity labeling revealed the PD-L1 interactome, distinct for unbound and bound PD-1, which initiated cancer cell–intrinsic signaling. PD-L1 binding partners interleukin enhancer binding factors 2 and 3 (ILF2-ILF3) transduced their effect through STAT3. Δ260-290PD-L1 disrupted signaling and reversed pro-growth properties. In humanized HNSCC in vivo models bearing T-cells, PD-1 binding triggered PD-L1 signaling, and dual PD-L1 and STAT3 inhibition were required to achieve tumor control.
Conclusions
Upon PD-1 binding, the PD-L1 extracellular and intracellular domains exert a synchronized effect to promote immune evasion by inhibiting T-cell function while simultaneously enhancing cancer cell–invasive properties.
Programmed cell death protein 1 (PD-1) and programmed death ligand 1 (PD-L1) inhibitors are widely used in human cancers, thus elucidating a new mechanism of intracellular signaling modulated by receptor binding has profound implications to understanding treatment effect and resistance. We posit the novel notion that PD-1–PD-L1 signaling intrinsically alters the cancer cell phenotype, in addition to impacting the immune milieu.
The PD-1 pathway drives immune escape in human cancers, and inhibition extends survival of relapsed and/or metastatic head and neck squamous cell carcinoma (HNSCC) patients (1,2). Treatment efficacy is modest, with response rates of 17% and 13% for anti–PD-1 and anti–PD-L1, respectively (1-6). PD-1 expressed on T-cells binds to its ligand, PD-L1, suppressing T-cell induction and preventing autoreactive immune response (7-9). HNSCC cells express and/or upregulate PD-L1 thereby dampening the potential immune response within the tumor microenvironment (10). Fewer tumor-infiltrating lymphocytes (TILs) are associated with worse prognosis (11).
PD-L1 is composed of an extracellular domain (PD-L1–ECD), which binds to PD-1, a transmembrane domain, and an intracellular domain (PD-L1–ICD), and is expressed in cancer and antigen-presenting cells (7,12,13). Although the binding dynamics of the PD-L1–ECD are well characterized, much less is known about the role of the 31-amino acid PD-L1–ICD. Human PD-L1 lacks predictive signaling motifs, though murine PD-L1 contains 3 sequences (RMLDVEKC, DTSSK, and QFEET) necessary for intracellular transduction of anti-apoptotic signaling and migratory stimuli (14-17). PD-L1 is related to Ras, β-catenin, epithelial-to-mesenchymal transition, mammalian target of rapamycin, transforming growth factor β, p38, mitogen-activated protein kinase, phosphoinositide 3-kinases, and signal transducer and activator of transcription 3 (STAT3) activation independent of PD-1 (17-19). The signaling changes upon PD-1 binding, and the nature and intermediaries of such signaling are unexplored.
We identified a PD-L1 cancer cell–intrinsic signaling role and used the BioID2 platform (20), a proximity-dependent labeling assay fusing a protein of interest to assess the PD-L1 intracellular interactome. We identified PD-L1 intracellular partners transducing pro-growth signaling, including interleukin enhancer binding factors 2 and 3 (ILF2 and ILF3), which canonically heterodimerize (ILF2–ILF3) within the nuclear factor of activated T-cell (NFAT) complex (21,22). The PD-L1–ILF2–ILF3 interaction activated STAT3, and combined inhibition of PD-L1 and STAT3 was required to achieve durable responses in humanized HNSCC models.
Methods
recombinant PD-1
For in vitro studies, 1 µg/mL recombinant PD-1 (AbCam ab221398) was immobilized on flasks. For in vivo studies, mice were given 50 mg/kg biweekly for 4 weeks via intraperitoneal injection.
iSphere
CD3 T-cells were isolated from adult blood (University of Colorado Hospital), activated using 2 ng/uL anti–CD3ε (R&DSystems MAB100), 5 ng/uL anti–CD28 (R&DSystems MAB342), and 0.2 pg/uL IL-2 (R&DSystems 202-IL-010/cf). Cancer cells were seeded in ultralow attachment plates (Corning 3471). Activated T-cells were added on spheroid day 3 and cocultured until day 10.
BioID2
CUHN013 and CUHN036 cell lines were analyzed in duplicate. Cells were seeded with and without recombinant PD-1 (see Figure 3, A), followed by 24 hours in 5% Fetal Bovine Serum (FBS) in Dulbecco’s Modified Eagle Medium (DMEM) (BioID2 Media). BioID2 plasmids were transfected in BioID2 Media for 24 hours (FuGene, Promega E2312), followed by 50 uM biotin (LifeTechnologies 20217) for 16 hours. Samples were prepared as previously described (23).
Figure 3.

The programmed death ligand 1 (PD-L1) interactome. A) Workflow of BioID2 experiment. Created with BioRender.com. B) PD-L1 interactome. Node border indicates the Bayesian false discovery rate, connecting line indicates fold change. C) Immunoprecipitation of PD-L1 confirms interaction with interleukin enhanceer binding factor 2 (ILF2), interleukin enhanceer binding factor 3 (ILF3), and recombinant programmed cell death protein 1 (rPD-1) in vitro, in both CUHN013 and CUHN036 in a dose-dependent manner, exacerbated by rPD-1. D) Co-immunoprecipitation between PD-L1 with either ILF2 or ILF3 are dependent on the PD-L1 intracellular domain. E) Recombinant ILF2, ILF3, and PD-L1 produced in a heterologous system show PD-L1 and ILF3 directly interact by immunoprecipitation with PD-L1. F) Cytoplasmic and nuclear fractionation suggests that PD-L1 overexpression initiates nuclear translocation of both ILF2 and ILF3 and is exacerbated by rPD-1. G) CUHN013 and CUHN036 cytoplasmic and nuclear fractionation show a decrease in nuclear ILF2 and ILF3 with short hairpin RNA knockdown of PD-L1 (shPD-L1). *P ≤ .05, **P ≤ .01, ***P ≤ .001, ****P ≤ .0001. Error bars represent standard deviation. Δ = Δ260-290PD-L1 overexpression; BDFR = Bayesian false discovery rate; C = cytoplasmic; E = empty; LC/MS MS = liquid chromatography coupled with tandem mass spectrometry/mass spectrometry; N = nuclear; OE = PD-L1 overexpression; rPD-1 = recombinant PD-1; shC = short hairpin RNA non-targeting control; sh1 = short hairpin RNA targeting PD-L1 #1; sh2 = short hairpin RNA targeting PD-L1 #2.
Mass spectrometry
Samples were prepared for liquid chromatography coupled with tandem mass spectrometry as previously described (23). Prey protein spectral matches greater than 3 were input into Significant Analysis of INTeractome (SAINTexpress) software (24) and filtered by a P value less than .05, SAINTScore greater than 0.9, Bayesian False Discovery Rate (BFDR) less than 0.02, and Contaminant Repository for Affinity Purification database (CRAPome) frequency less than 0.2 or fold change greater than 3 (25). Protein localization and function were identified via Uniprot, accessed April 19, 2022 (26).
Statistical analysis
Endpoints were analyzed by 2-sided t test, longitudinal data were analyzed via mixed-effects model, using GraphPad Prism version 9.0. Data are represented as mean (SD). P values no more than .05 were considered statistically significant.
Results
PD-L1 intracellular signaling impacts cancer cell behavior
PD-L1 cancer-intrinsic signaling is poorly understood, with a range of properties affected, including proliferation, apoptosis, and autophagy (17,27). We used 2 human papillomavirus (HPV)–negative low-passage HNSCC cell lines, CUHN013 and CUHN036, confirming recombinant PD-1 (rPD-1) interacted with PD-L1 in vitro (Supplementary Figure 1, A, available online). Stable PD-L1 overexpression (Figure 1, A;Supplementary Figure 1, B and C, available online) increased invasiveness (Figure 1, B), motility (Figure 1, C), and clonogenicity (Figure 1, D), and PD-L1 short hairpin RNA knockdown (shPD-L1) (Figure 1, E;Supplementary Figure 1, D and E, available online) had the opposite effects (Figure 1, F-H). rPD-1 increased invasion and motility (not clonogenicity) across parental (Supplementary Figure 1, F and H, available online), PD-L1 overexpression (Figure 1, B-D), and shPD-L1 (Figure 1, F-H), indicating that although PD-1 may not be necessary for intrinsic PD-L1 function, it has an activating effect for some properties. PD-L1 overexpression conferred modest cisplatin resistance in CUHN013 and CUHN036 and radiation resistance in CUHN013, and shPD-L1 sensitized cells to cisplatin and radiation, with rPD-1 having no effect (Supplementary Figure 2, A-F, available online).
Figure 1.

Programmed death ligand 1 (PD-L1) cancer cell-intrinsic phenotypes. A) Immunoblot confirming PD-L1 overexpression. B) PD-L1 overexpression and recombinant programmed cell death protein 1 (rPD-1) increase invasion. C) PD-L1 overexpression decreases time to scratch-wound closure, exacerbated by rPD-1. (Wound confluence 16 hours postscratch: CUHN013 empty = 60.95%; empty rPD-1 = 83.85%; PD-L1 overexpression = 85.59%; PD-L1 overexpression rPD-1 = 94.09%; CUHN036 empty = 68.74%; empty rPD-1 = 81.36%; PD-L1 overexpression = 87.51%; PD-L1 overexpression rPD-1 = 97.08%.) D) PD-L1 overrexpression increases clonogenicity. E) Immunoblot confirming short hairpin RNA knockdown of PD-L1 (shPD-L1). F) shPD-L1 decreases invasion, and rPD-1 is not sufficient to rescue the decrease. G) shPD-L1 slows scratch-wound closure and is not rescued by rPD-1 (wound confluence 16 hours postscratch: CUHN013 shC = 80.46%; shC rPD-1 = 91.87%; sh1 = 57.89%; sh1 rPD-1 = 55.76%; sh2 = 64.34%; sh2 rPD-1 = 51.19%; CUHN036 shC = 99.65%; shC rPD-1 = 100%; sh1 = 87.89%; sh1 rPD-1 = 93.12%; sh2 = 87.88%; sh2 rPD-1 = 88.75%). H) shPD-L1 decreases clonogenicity. rPD-1 has no significant effect on clonogenic growth. PD-L1 overexpression invasion and clonogenic measurements are normalized to empty control, shPD-L1 measurements are normalized to shCTRL. *P ≤ .05, **P ≤ .01, ***P ≤ .001, ****P ≤ .0001. Error bars represent standard deviation. E = empty; FC = fold change; OE = PD-L1 overexpression; P = parental; shC = short hairpin RNA non-targeting control; sh1 = short hairpin RNA targeting PD-L1 #1; sh2 = short hairpin RNA targeting PD-L1 #2; rPD-1 = recombinant PD-1.
To determine whether the PD-L1–ICD was necessary to transduce these phenotypic changes, we transduced a PD-L1 overexpression variant with the PD-L1–ICD deleted (Δ260-290PD-L1) (Figure 2, A and B). Δ260-290PD-L1 overexpression abrogated invasion, motility and clonogenicity back to native levels (Figure 2, C-E).
Figure 2.
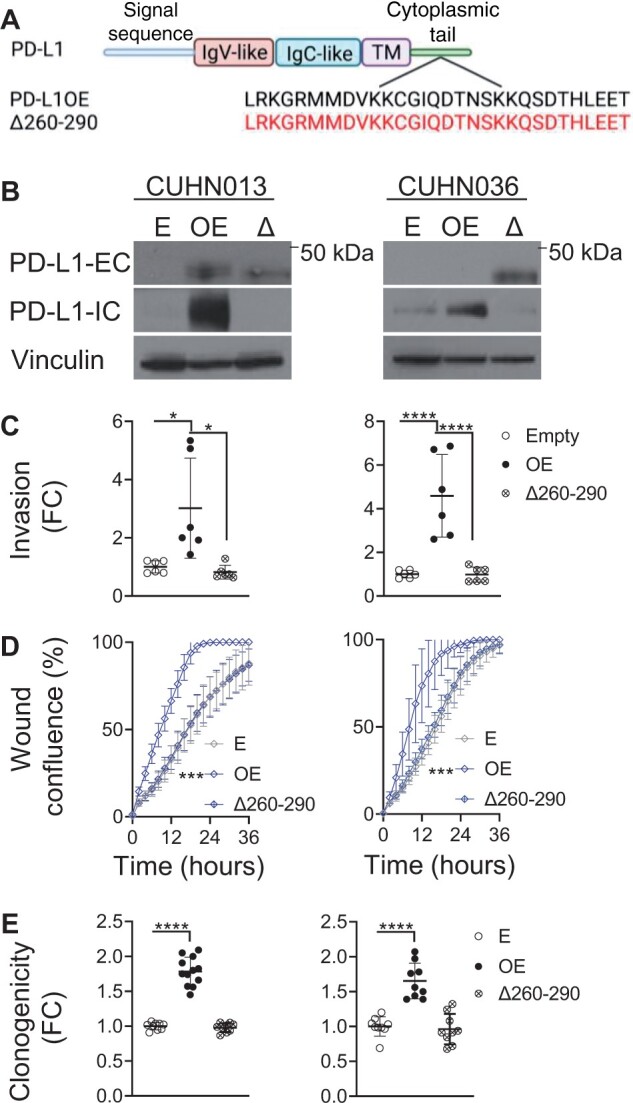
Programmed death ligand 1 (PD-L1) intracellular domain and intrinsic function. A) Schemata of PD-L1 structural domains. PD-L1 intracellular domain (PD-L1–ICD) is expanded to amino acid structure below. PD-L1 overexpression and PD-L1–ICD deletion mutant (Δ260-290PD-L1) shown below. Created with BioRender.com. B) Confirmation of Δ260-290PD-L1 overexpression in CUHN013 and CUHN036 by immunoblot. C) PD-L1 overexpression increases invasion, (D) wound healing, and (E) clonogenic growth, but this is reversed with Δ260-290PD-L1 overexpression (wound confluence 16 hours postscratch: CUHN013 empty = 46.59%; PD-L1 overexpression = 85.59%; Δ260-290PD-L1 = 47.11%; CUHN036 empty = 46.59%; PD-L1 overexpression = 87.51%; Δ260-290PD-L1 = 51.20%). *P ≤ .05, **P ≤ .01, ***P ≤ .001, ****P ≤ .0001. Error bars represent standard deviation. E = empty; FC = fold change; IgC = immunoglobulin constant; IgV = immunoglobulin variable; OE = PD-L1 overexpression; Δ and Δ260-290 = Δ260-290PD-L1 overexpression; PD-L1-EC = PD-L1 extracellular-specific antibody; PD-L1-IC = PD-L1 intracellular specific antibody.
PD-L1 modulation impacts T-cell infiltration
To evaluate the canonical function of PD-L1 (T-cell suppression), we developed an immunosphere (iSphere) assay in which PD-L1 overexpression and shPD-L1 had opposite effects of decreasing and increasing T-cell invasion, respectively (Supplementary Figure 2, G and H, available online); shPD-L1 increased granzyme B expression, indicating T-cell–mediated killing. Δ260-290PD-L1 overexpression iSpheres had similar T-cell invasion to intact PD-L1 overexpression iSpheres (Supplementary Figure 2, G, available online), confirming the canonical role of PD-L1 is fulfilled by the PD-L1–ECD.
The intracellular PD-L1 interactome is influenced by PD-1
The above findings established PD-L1 intracellular signaling had a cancer cell–intrinsic impact driven by the PD-L1–ICD, which did not require PD-1 but was influenced by it. Therefore, a protein–protein interaction in the cytoplasmic region was investigated, both at baseline and upon PD-1 binding. We cloned and transfected a PD-L1-BioID2 fusion protein (Supplementary Figure 3, A, available online) into CUHN013 and CUHN036 cell lines. Specific expression, proper localization, and consistent function of the PD-L1-BioID2 fusion was confirmed (Supplementary Figure 3, B-F, available online). Liquid chromatography coupled with tandem mass spectrometry defined the interactome of experimental duplicates of each condition: empty-BioID2 or PD-L1-BioID2, with and without rPD-1 (Figure 3, A). A total of 57 proteins were found in the PD-L1 interactome; 8 proteins exclusive to PD-L1 alone, 35 proteins specifically recruited upon rPD-1 binding, and 14 proteins that interacted irrespective of rPD-1 (Figure 3, B;Supplementary Table 1, available online). Of the 14 proteins that constitutively interacted with PD-L1, 10 of these increased in magnitude upon rPD-1, indicating rPD-1 binding qualitatively and quantitatively influenced PD-L1 interactions (Figure 3, B;Supplementary Table 1, available online). The PD-L1 interactome included proteins involved in RNA binding, RNA processing, cell signaling (particularly calcium-based signaling), antiviral response, canonical immune receptor signaling, and posttranslational modification (Supplementary Table 1, available online) (26).
PD-L1 functionally interacts with ILF2–ILF3
We sought to correlate PD-L1 signaling with cancer-related properties and focused on biologically relevant interactome partners correlative with PD-L1 localization (ie, excluded nuclear or endoplasmic reticulum proteins) (Table 1). We confirmed impact in invasion, motility, and clonogenicity of annexin A11 (ANXA11), family with sequence similarity 129 member B (FAM129B), ILF2, ILF3, protein tyrosine phosphatase nonreceptor type 1 (PTPN1), and zinc finger CCCH-type containing, antiviral 1 (ZC3HAV1) (Supplementary Table 2, available online) and confirmed PD-L1 interaction in vitro with ILF2, ILF3 (Figure 3, C), FAM129B, and PTPN1 by co-immunoprecipitation (Supplementary Table 2, available online). ILF2 and ILF3 were PD-L1 interactome partners with and without rPD-1 (Figure 3, B, Table 1), associated with PD-L1 in a PD-1–dependent manner (Figure 3, C), and the interaction was lost with Δ260-290PD-L1 overexpression (Figure 3, D). Further, in a heterologous system, PD-L1 co-immunoprecipitated with ILF3, but not ILF2, suggesting PD-L1 and ILF3 are direct binding partners (Figure 3, E), whereas ILF2 comes into proximity to PD-L1 while heterodimerized with ILF3. ILF2–ILF3 were pursued because of their wide-ranging functionality as a heterodimer within NFAT, including transcription, DNA damage repair, RNA processing, tumorigenesis, and antiviral immunity (28).
Table 1.
Membranous and cytoplasmic PD-L1 interactomea
| Bait | PD-L1 |
recombinant PD-1–PD-L1 |
||
|---|---|---|---|---|
| PREY | SS | FCa | SS | FC |
| ANXA7 | 1.0 | 142.5 | 1.0 | 197.5 |
| ESYT1 | 1.0 | 140.0 | 1.0 | 300.0 |
| ANXA11 | 1.0 | 72.5 | 1.0 | 82.5 |
| RTN4 | 1.0 | 67.5 | 1.0 | 100.0 |
| ILF2 | 1.0 | 37.3 | 0.9 | 33.0 |
| ZC3HAV1 | 1.0 | 27.3 | 1.0 | 67.3 |
| ILF3 | 1.0 | 12.7 | 0.9 | 8.8 |
| PDCD6IP | 0.9 | 6.0 | 1.0 | 9.1 |
| AHCTF1 | 0.9 | 4.6 | 1.0 | 11.6 |
| FAM98A | 1.0 | 47.5 | — | — |
| FAM98B | 1.0 | 20.0 | — | — |
| HNRNPR | 1.0 | 11.3 | — | — |
| EPB41L2 | — | — | 1.0 | 130.0 |
| FAM129B | — | — | 1.0 | 107.5 |
| ERBIN | — | — | 1.0 | 67.5 |
| FERMT2 | — | — | 1.0 | 67.5 |
| PTPN2 | — | — | 1.0 | 62.5 |
| TPD52L2 | — | — | 1.0 | 60.0 |
| ARHGAP1 | — | — | 1.0 | 47.5 |
| SLC4A7 | — | — | 1.0 | 40.0 |
| SLC38A1 | — | — | 1.0 | 37.5 |
| STIM1 | — | — | 1.0 | 37.5 |
| NECTIN2 | — | — | 1.0 | 30.0 |
| CTNND1 | — | — | 1.0 | 27.5 |
| LBR | — | — | 1.0 | 27.5 |
| EFHD2 | — | — | 1.0 | 25.0 |
| ITGB5 | — | — | 1.0 | 25.0 |
| TRIP11 | — | — | 1.0 | 20.0 |
| MIF | — | — | 1.0 | 17.5 |
| STAM | — | — | 1.0 | 17.5 |
| HNRNPA2B1 | — | — | 0.9 | 5.4 |
| DHX29 | — | — | 0.9 | 5.2 |
| AKAP12 | — | — | 0.9 | 4.5 |
| CKAP4 | — | — | 0.9 | 2.7 |
Fold change, no data indicate that the prey protein was either not identified in the sample or did not meet the statistical threshold described. FC = fold change; PD-1 = programmed cell death protein 1; PD-L1 = programmed death ligand 1; SS = Saint score.
PD-L1–ILF2–ILF3 interaction increased nuclear ILF2 and ILF3 translocation in PD-L1 overexpression (Figure 3, F), while shPD-L1 reduced nuclear ILF2 and ILF3 (Figure 3, G). To assess ILF2–ILF3 functionality, we transduced both CUHN013 and CUHN036 with pGreenFire2.0 Antigen Receptor Response Element-2 (ARRE-2) reporter containing the ILF2–ILF3 target consensus sequence (21,22) (Supplementary Figure 4, A, available online). Loss of PD-L1, ILF2, or ILF3 reduced transcriptional activity (Figure 4, A;Supplementary Figures 3, G-I, and 4, B-D, available online). Conversely, rPD-1 increased activity (Supplementary Figure 4, E, available online) in a PD-1–PD-L1–dependent manner, as this effect was abrogated by anti–PD-1 and anti–PD-L1 therapies (Figure 4, B;Supplementary Figure 4, F and G, available online). PD-L1 blockade had no effect on transcriptional activity in the absence of rPD-1 (Supplementary Figure 4, H, available online).
Figure 4.

Impacts of programmed death ligand 1 (PD-L1) on interleukin enhancer binding factors 2 and 3 (ILF2 and ILF3) transcriptional activity and anti–signal transducer and activator of transcription 3 (STAT3) response. A) Antigen receptor response element 2 (ARRE-2) reporter confirms a loss of transcriptional activity with small interfering RNA targeting ILF2 (siILF2), ILF3 (siILF3), and PD-L1 (siPD-L1). B) ARRE-2 reporter treated with recombinant programmed cell death protein 1 (rPD-1) increases ARRE-2 transcriptional activity, and this is blocked with anti–PD-1 or anti–PD-L1 treatment compared with immunoglobulin G (IgG) control. C) Phospho–STAT3 is increased by PD-L1 overexpression but is dependent on the intracellular domain, as determined by the PD-L1 intracellular domain deletion mutant (Δ260-290PD-L1). D) STAT3 phosphorylation is decreased by short hairpin RNA knockdown of PD-L1 (shPD-L1). E) Phospho–STAT3 decreased by siILF2 and siILF3. F) PD-L1 overexpression is selectively resistant to anti–STAT3 treatment as measured by sulforhodmain B colorimetric assay (SRB) (y axis in log scale). anti–STAT3 treatment rescues the effect of PD-L1 overexpression on (G) invasion, (H) motility, and (I) clonogenicity (wound confluence 16 hours postscratch: CUHN013 empty dimethylsulfoxide (DMSO) = 68.79%; empty anti–STAT3 = 59.87%; PD-L1 overexpression DMSO = 91.85%; PD-L1 overexpression anti–STAT3 = 70.55%; Δ260-290PD-L1 DMSO = 72.51%; Δ260-290PD-L1 anti–STAT3 = 60.92%; CUHN036 empty DMSO = 81.21%; empty anti–STAT3 = 66.23%; PD-L1 overexpression DMSO = 96.64%; PD-L1 overexpression anti–STAT3 = 88;10%, Δ260-290PD-L1 DMSO = 83.37%; Δ260-290PD-L1 anti–STAT3 = 68.05%). *P ≤ .05, **P ≤ .01, ***P ≤ .001, ****P ≤ .0001. Error bars represent standard deviation. GCU = green calibrated units; p-STAT3 = phospho-STAT3; Δ = Δ260-290PD-L1 overexpression; E = empty vector; FC = fold change; OE = PD-L1 overexpression; shC = short hairpin RNA non-targeting control; sh1 = short hairpin RNA targeting PD-L1 #1; sh2 = short hairpin RNA targeting PD-L1 #2; siC = small interfering RNA non-targing control; si2 = small interfering RNA targeting ILF2; si3 = small interfering RNA targeting ILF3; α-STAT3 = anti–STAT3.
We compared RNA sequencing (RNAseq) transcriptomic profiles of PD-L1 overexpression and shPD-L1 (Supplementary Table 3, available online) and identified an array of ILF2–ILF3 transcriptional targets that were also modulated by PD-L1 (Supplementary Figure 3, J, available online). STAT3, known to be related to ILF2–ILF3 (29-31), was downregulated in PD-L1 overexpression (Padjusted = 0.0009) and upregulated in shPD-L1 (Padjusted = 0.03) (Supplementary Figure 3, J, available online).
PD-L1 signaling is transduced by ILF2–ILF3 and then STAT3
Whereas ILF2–ILF3 were necessary for PD-L1–driven cancer cell–intrinsic phenotypes in vitro (Supplementary Table 2, available online), extrinsically small interfering RNAs targeting ILF2 (siILF2) or ILF3 (siILF3) had no impact in T-cell invasion or granzyme B expression (Supplementary Figure 2, I, available online). In assessing the role of STAT3 signaling suggested by RNAseq (Supplementary Figure 3, J, available online), PD-L1 overexpression increased phospho–STAT3 (Figure 4, C;Supplementary Figure 2, G, available online), whereas shPD-L1 (Figure 4, D;Supplementary Figure 2, H, available online), siILF2, and siILF3 (Figure 4, E;Supplementary Figure 2, I, available online) decreased phospho–STAT3. Phospho–STAT3 was dependent on the PD-L1–ICD, as demonstrated by the Δ260-290PD-L1 overexpression effect (Figure 4, C;Supplementary Figure 2, G, available online). PD-L1–ICD was resistant to STAT3 inhibition by the selective phosphorylation inhibitor LLL12 (anti–STAT3) compared with empty control and Δ260-290PD-L1 overexpression (Figure 4, F;Supplementary Figure 3, K, available online). The increase in tumorigenic properties driven by PD-L1 overexpression were rescued by anti–STAT3 (Figure 4, G-I). These key findings were corroborated in the well-characterized CAL27 and MDA-584 cell lines (Supplementary Figure 5, available online) (32,33).
rPD-1 increases STAT3 activation in vivo
To assess PD-1–PD-L1 interactions in vivo, we implanted the HPV-negative CUHN013 and CUHN036 patient-derived xenografts (PDXs) into an immunocompromised NOD-scid-gamma (NSG) model. Mice were supplemented with rPD-1 biweekly, leading to stable exposure (Figure 5, A), which increased tumor expression of PD-L1, ILF2, ILF3, and phospho-STAT3 (Figure 5, B and C), suggesting activation of PD-L1 signaling and a positive feedback loop by which rPD-1 promoted expression of PD-L1 and its signaling partners (34). PD-L1 interaction with rPD-1, ILF2, ILF3, and STAT3 were confirmed by proximity ligation assay (Figure 5, D).
Figure 5.

Recombinant programmed cell death protein 1 (rPD-1) in vivo. A) rPD-1 is stable in vivo for 2 weeks as measured by enzyme-linked immunosorbent assay of NOD-scid-gamma (NSG) blood (n = 3). B-C) rPD-1 increased immunohistochemistry expression of programmed death ligand 1 (PD-L1), interleukin enhancer binding factor 2 (ILF2), interleukin enhancer binding factor 3 (ILF3), and phospho–signal transducer and activator of transcription 3 (STAT3) but did not alter expression of total STAT3. D) Proximity ligation assay confirms in vivo interaction between PD-L1 and rPD-1, ILF2, ILF3, and STAT3 in CUHN013 in vivo. *P ≤ .05, **P ≤ .01, ***P ≤ .001, ****P ≤ .0001. Error bars represent standard deviation. Scale bar = 10μm (left); magnified PLA (right) is 4x original size. p-STAT = phospho-STAT3.
Dual PD-L1 and STAT3 inhibition elicits sustained tumor control in humanized mice
To assess the PD-1 and PD-L1 interaction in a native state with human T-cells, we implanted NSG and humanized mice (HM) with HPV-positive CUHN022 PDXs and compared anti–PD-L1 treatment with control. We observed tumor growth reduction exclusively in HM, suggesting a competent immune system and the PD-1–PD-L1 interaction were required for anti–PD-L1 effects (Supplementary Figure 6, A, available online). Given the central role of STAT3 in PD-L1 signaling, we then treated larger cohorts of NSG and HM mice bearing either CUHN036 (HPV-negative) or CUHN022 (HPV-positive) PDXs with anti–PD-L1, anti–STAT3, or the combination of both. Anti–PD-L1 again only reduced growth in HM, but anti–STAT3 (alone or combined with anti–PD-L1) blocked tumor growth in both groups (Figure 6, A and B). CUHN036 was collected after end of treatment (EOT) (4 weeks) due to tumor burden; combined therapy showed higher efficacy. CUHN022 control and anti–PD-L1 groups were sacrificed at EOT, but anti–STAT3 and combination groups were observed for 4 additional weeks. In NSG, neither group regrew, whereas in HM the anti–STAT3 arm relapsed, and only the combination exhibited prolonged tumor control (Figure 6, B). We postulate the PD-1–PD-L1 interaction triggered by the T-cells exclusive to HM that were not blocked by anti–PD-L1 led to tumor regrowth in anti–STAT3 group.
Figure 6.

Anti–programmed death ligand 1 (PD-L1) and/or anti–signal transducer and activator of transcription 3(STAT3) in humanized mice (HM). Tumor volume decreases upon anti–PD-L1 in the HM model compared with the HM control in (A) CUHN036 and (B) CUHN022. No changes were observed in control vs anti–PD-L1–treated NOD-scid-gamma (NSG) mice. Treatment with anti–STAT3 or the combination of anti–PD-L1 and anti–STAT3 (combo) ablated tumor growth in the NSG and HM models. In CUHN022, the anti–STAT3 group relapsed following end of treatment (EOT) in the HM group, while the combo maintained response. Arrows indicate date of treatment, with both immunoglobulin G and dimethylsulfoxide control, anti–PD-L1, and anti–STAT3 given simultaneously. C) In CUHN022, anti–PD-L1, anti–STAT3, and combo increase CD3+CD4+ and CD3+CD8+ tumor-infiltrating cells. Anti–PD-L1 and combo increase CD3+granzyme B+ cells. Quantification to the right. Arrows indicate double-positive or single-positive signal (ie, CD3+granzyme B+ vs CD3+granzyme B-). Human T-cells (CD45+CD3+) analyzed from (D) HM spleen or (E) peripheral blood, from control, anti–PD-L1, anti–STAT3 EOT, combo EOT, anti–STAT3 (4 weeks post-EOT), and combo (4 weeks post-EOT) from the CUHN022 HM mice. Cells were additionally assayed for CD4, CD8, and PD-1 expression (statistical analysis of total CD3+CD4+ cells is indicated above, analysis of CD3+CD4+PD-1+ is indicated below). The combination released group exhibited a decrease in peripheral CD4 T-cells at 4 weeks post-EOT compared with EOT, whereas the anti–STAT3 release mice had increased peripheral CD4 and CD8 subpopulations. F) Immunohistochemistry images (left) and quantification (right) of PD-L1, interleukin enhancer binding factor 2 (ILF2), interleukin enhancer binding factor 3 (ILF3), phospho–STAT3, and STAT3 show an increase in the HM model that is blocked upon anti–PD-L1, anti–STAT3, or combo treatment. Anti–PD-L1 had no effect on the NSG model. Anti–STAT3 reduced PD-L1, interleukin ehancer binding factor 2 (ILF2), ILF3, and phospho–STAT3 in NSG and HM tumors, with deeper effect in HM particularly in the combination arm. G) Multicolor proximity ligation assay shows an increase in interaction between PD-L1–ILF2, PD-L1–ILF3, and PD-L1–STAT3 in the HM compared with NSG control. Anti–PD-L1 and combo decreased the interaction of PD-L1–STAT3. In the HM model, targeting PD-L1 reduced the interaction between PD-L1 and STAT3, with the combination of anti–PD-L1 and anti–STAT3 being even more effective. The PD-L1–ILF2 and PD-L1–ILF3 interactions remained stable, with neither therapy effectively impacting this association. H) Proposed conceptual model of PD-1– PD-L1 interaction leading to immune escape on one side, and PD-L1 recruitment of ILF2–ILF3 and subsequent activation of STAT3, leading to tumor progression. *P ≤ .05, **P ≤ .01, ***P ≤ .001, ****P ≤ .0001. Error bars represent standard deviation. Scale bar = 25μm (B), scale bar = 50μm (E). α-PD-L1 = anti–PD-L1; α-STAT3 = anti–STAT3; α-STAT3* and combo* = samples collected 4 weeks after EOT; HM = humanized mice; NSG = NOD-scid-gamma; PLA = proximity ligation assay.
PD-L1 and STAT3 inhibition impact T-cell infiltration and circulating patterns in vivo
Assessing tumors, peripheral blood, and the spleens of HM, all 3 therapies yielded TILs increase including CD4 and CD8 T-cells, however, the subpopulations in each treatment differed (Figure 6, C;Supplementary Figures 6, B, and 7,A, available online). Anti–PD-L1 induced mainly CD8 TILs, with a marginal increase in CD4 TILs (Figure 6, C;Supplementary Figure 7, A, available online); however, the recruited TILs had higher cytotoxic activity, as measured by granzyme B (Figure 6, C;Supplementary Figure 7, A, available online). Anti–STAT3 induced the opposite effect, with higher CD4 and CD8 TILs, however, granzyme B–positive cells did not increase (Figure 6, C;Supplementary Figure 7, A, available online); this corresponds to an exhausted tumor microenvironment and can explain in part the regrowth after EOT. Combined anti–PD-L1 and anti–STAT3 resulted in the highest TIL recruitment, including cytotoxic cells and CD4 and CD8 TILs (Figure 6, C;Supplementary Figure 7, A, available online).
Splenic T-cells (CD45–positive and CD3–positive) had higher CD4 and CD8 cells in the combination arm at EOT; total and PD-1–positive cells sustained an increase 4 weeks post-EOT (Figure 6, D;Supplementary Figure 7, B, available online). Peripherally, only in anti–PD-L1 did CD4–positive as well as CD4–positive and PD-1–positive T-cells increase (Figure 6, E;Supplementary Figure 7, C, available online).
PD-L1 promotes phospho–STAT3 via ILF2–ILF3 in humanized mice
As seen with rPD-1 (Figure 5, B and C), PD-1–driven interactions increased PD-L1, ILF2, ILF3, and phospho–STAT3 in HM (Figure 6, F;Supplementary Figure 7, D, available online). Single and multicolor proximity ligation assay confirmed a T-cell–mediated effect, showing PD-1 interacted with PD-L1, and PD-L1 subsequently interacted with ILF2, ILF3, and STAT3 (Figures 5, D, and 6 G; Supplementary Figure 6, C, and 7, E, available online). Whereas total STAT3 remained unchanged, PD-L1, ILF2, ILF3, and phospho–STAT3 decreased upon anti–PD-L1 in HM tumors exclusively, whereas anti–STAT3 was effective in both arms (Figure 6, F; Supplementary Figures 6, D, and 7, D, available online). This suggests the positive feedback loop of PD-L1 synthesis after PD-1 and PD-L1 binding, described in melanoma (34) and corroborated here in HNSCC, is mediated by STAT3.
Finally, RNAseq revealed treatment effects with anti–PD-L1 and anti–STAT3, both alone and combined, were influenced by the presence of human immune cells as the interferon alpha and gamma pathways were inhibited in HM only (Supplementary Figure 7, F, available online). Interestingly, in this unsupervised analysis, the STAT3 pathway was the only gene set to reach statistical significance that was altered exclusively in the combination arm, with an inhibitory effect in HM vs the NSG model.
Discussion
The PD-1–PD-L1 pathway is the most widely validated immune target in cancer, with a range of efficacy from relatively modest (1,2) to natural history changing (35), suggesting a more complex role than anticipated. In HNSCC models, PD-L1 signaling influenced invasiveness, motility, clonogenicity, chemotherapy, and radiation sensitivity. This supports a coordinated, evolutionarily efficient mechanism toward tumor progression when other key determinants are favorable, such as attenuated immune surveillance resulting from PD-1 and PD-L1 binding (Figure 6, H, shows a conceptual model). Given the profound and carefully synchronized pro-growth effect of the ensuing signaling, that the tertiary and/or quaternary nature of the interaction is not structurally elucidated should not detract from its importance. These protein–protein interactions were consistent across several patient-derived models, PD-L1–ICD dependent, and showed remarkable specificity (ie, BioID2 identified proximity interactions with heterodimer partners, ILF2–ILF3, but co-immunoprecipitation demonstrated ILF3 physically interacts with PD-L1).
We have identified ILF2–ILF3 as prominent members of the PD-L1 interactome, which canonically act in the NFAT complex, discovered for its role in T-cell activation via interleukin-2 transcription (21,22). Other roles include transcription, DNA damage repair, RNA processing, tumorigenesis, and antiviral immunity (28). We found STAT3 activation was dependent on PD-1, PD-L1, and ILF2–ILF3 expression both in vitro and in vivo, and rPD-1, PD-1 and PD-L1 exacerbated this effect. In HM, anti–STAT3 combined with anti–PD-L1 blockade were a potent cocktail in which anti–PD-L1 blocks PD-1 binding extracellularly, while anti–STAT3 blunts constitutive and induced intracellular signaling and feedback loop-driven PD-L1 expression. The effects of anti–PD-L1 were shown in 2 independent HM cohorts, highlighting the necessity and reproducibility of the model.
The PD-L1 interactome included other partners (ANXA11, FAM129B, PTPN1, and ZC3HAV1), and we confirmed they influenced cancer properties. These interactors represent a spectrum of biological functions, with the most common themes being RNA processing, calcium signaling, antiviral response, and basic signal transduction (26). Interestingly, ILF2–ILF3 interact with other proteins in the PD-L1 interactome, such as scaffold attachment factor B (SAFB) and heterogeneous nuclear ribonucleoprotein A2/B1 (HNRNPA2B1) (36,37), suggesting this interactome has far-reaching implications. This supports the evolutionary selection of protumorigenic mechanisms based on their pleiotropic impact in acquiring a spectrum of advantageous properties; concomitantly triggering immune evasion and tumor growth is an efficient solution.
The unstructured PD-L1–ICD contains no predictive signaling motifs, though 3 murine motifs are necessary for known mechanisms of intrinsic signaling: RMLDVEKC, DTSSK, and QFEET. These motifs are 75%, 80%, and 60% conserved in humans, respectively: RMMDVKKCG, DTNSKK, and HLEET (9). The RMLDVEKC and DTSSK motifs span an RNA Pol-like domain and contain putative ubiquitination targets, but the role of this motif is unclear (15,17). In a melanoma model, these motifs inhibited interferon-mediated cytotoxicity, serving as a frontline cancer cell defense mechanism (15,17). There are also multiple points of posttranslational modification that alter PD-L1 expression and stability (13,38). Further, tumor hyperprogression following anti–PD-1 and PD-L1 therapy (39) necessitates further study of the PD-1 and PD-L1 axis intrinsically within the cancer cell. Our finding of intrinsic PD-L1 signaling may shed light on the nuances of this expression and may indicate a more comprehensive role than previously noted, which may include a cancer-specific analysis of the proteomic milieu available for PD-L1-intrinsic signaling. Here, we identified the human PD-L1–ICD is necessary for STAT3 phosphorylation and protumorigenic signaling via the protein–protein interaction with ILF3 and by association with ILF2. Our work corroborated previous literature that upon PD-1 binding, STAT3 promotes PD-L1 expression, providing a positive feedback loop to sustain immune evasion (40,41), with intrinsic consequences, including invasion, motility, clonogenicity, and drug resistance.
From a translational perspective, although immunotherapy has revolutionized cancer therapy, improving efficacy is an unmet need. PD-L1 expression and function are imperfectly associated with anti–PD-1 and anti–PD-L1 efficacy across diseases (38,42). Tumor hyperprogression following anti–PD-1 and anti–PD-L1 therapy is increasingly reported (39), and our finding of PD-L1–ICD signaling may shed light; steric hindrance of the PD-1 and PD-L1 interaction alters cancer intrinsic signaling as well. rPD-1 administration to immunodeficient NSG model increases PD-L1, ILF2, ILF3, and phospho–STAT3 in cancer cells.
We developed a series of in vitro and in vivo models, including the iSphere assay enabling the quantification of T-cell invasion, as well as the mechanistic characterization of the cell-to-cell interaction allowing the incorporation of functional genomic alterations into cancer cells. HM (43) allowed quantitating peripheral and intratumor T-cells, dissecting the tumor microenvironment, differences in T-cell subpopulations, and differentiating PD-L1 signaling effects in the presence and absence of human T-cells.
In summary, PD-L1 has intrinsic properties mediating proliferation, clonogenicity, motility, and invasion in HNSCC that are independent of and additive to the known T-cell inhibition role as a PD-1 ligand. Future studies are warranted to elucidate the nature of PD-L1 interactions, including modeling tertiary and/or quaternary structure analyses will be of interest given the RNA-modulating proteins identified in the PD-L1 interactome. Considering the relevance of the PD-L1 and PD-1 axis and its targeting in most solid tumors, understanding the mechanistic events, intrinsically and extrinsically to the cancer cell, is a vital area of focus for cancer biology and immunology. PD-L1 is central in a coordinated mechanism whereby upon binding to PD-1 extracellularly, the PD-1–expressing T-cell inactivation enables immune evasion, while intracellularly PD-L1–driven signaling increases cancer cell clonogenicity, motility, and invasion, jointly leading to tumor progression.
Supplementary Material
Acknowledgements
The authors are indebted to the patients and their families who donated their tissue, blood, and time and to the clinical teams who facilitated patient-informed consent, as well as sample and data acquisition. The authors wish to thank Pamela Garl, Mair Churchill, Lynn Heasley, and James DeGregori for helpful discussions.
The funders had no role in the design of the study; the collection, analysis, and interpretation of the data; the writing of the manuscript; and the decision to submit the manuscript for publication.
Contributor Information
Cera Nieto, Division of Medical Oncology, Department of Medicine, University of Colorado Denver, School of Medicine (UCDSOM), Aurora, CO, USA.
Bettina Miller, Division of Medical Oncology, Department of Medicine, University of Colorado Denver, School of Medicine (UCDSOM), Aurora, CO, USA.
Nathaniel Alzofon, Division of Medical Oncology, Department of Medicine, University of Colorado Denver, School of Medicine (UCDSOM), Aurora, CO, USA.
Tugy Chimed, Division of Medical Oncology, Department of Medicine, University of Colorado Denver, School of Medicine (UCDSOM), Aurora, CO, USA.
Jack Himes, Division of Medical Oncology, Department of Medicine, University of Colorado Denver, School of Medicine (UCDSOM), Aurora, CO, USA.
Molishree Joshi, Department of Pharmacology, UCDSOM, Aurora, CO, USA.
Karina Gomez, Division of Medical Oncology, Department of Medicine, University of Colorado Denver, School of Medicine (UCDSOM), Aurora, CO, USA.
Farshad N Chowdhury, Department of Otolaryngology, UCDSOM, Aurora, CO, USA.
Phuong N Le, Division of Medical Oncology, Department of Medicine, University of Colorado Denver, School of Medicine (UCDSOM), Aurora, CO, USA.
Alice Weaver, Division of Medical Oncology, Department of Medicine, University of Colorado Denver, School of Medicine (UCDSOM), Aurora, CO, USA.
Hilary Somerset, Department of Pathology, UCDSOM, Aurora, CO, USA.
J Jason Morton, Division of Medical Oncology, Department of Medicine, University of Colorado Denver, School of Medicine (UCDSOM), Aurora, CO, USA.
Jing H Wang, Department of Immunology and Microbiology, UCDSOM, Aurora, CO, USA; University of Pittsburgh Medical Center Hillman Cancer Center, Department of Medicine, University of Pittsburgh, Pittsburgh, PA, USA.
Xiao-Jing Wang, Department of Pathology, UCDSOM, Aurora, CO, USA; Department of Pathology, University of California Davis, Davis, CA, USA.
Dexiang Gao, Department of Pediatrics, UCDSOM, Aurora, CO, USA.
Kirk Hansen, Department of Biochemistry and Molecular Genetics, UCDSOM, Aurora, CO, USA.
Stephen B Keysar, Division of Medical Oncology, Department of Medicine, University of Colorado Denver, School of Medicine (UCDSOM), Aurora, CO, USA.
Antonio Jimeno, Division of Medical Oncology, Department of Medicine, University of Colorado Denver, School of Medicine (UCDSOM), Aurora, CO, USA; Gates Center for Regenerative Medicine, UCDSOM, Aurora, CO, USA.
Data availability
Materials will be shared per the University of Colorado’s Office for Technology Transfer policies and Institutional Review Board. RNA sequencing data will be deposited on the NCBI Sequence Read Archive; proteomics data will be deposited on PRIDE.
Author contributions
Cera Nieto, PhD (Conceptualization; Data curation; Formal analysis; Methodology; Validation; Visualization; Writing—original draft; Writing—review & editing), Kirk Hansen, PhD (Conceptualization; Formal analysis; Methodology; Writing—review & editing), Dexiang Gao, PhD (Formal analysis; Writing—review & editing), Xiao-Jing Wang, MD, PhD (Conceptualization; Writing—review & editing), Jing H Wang, MD, PhD (Conceptualization; Writing—review & editing), J. John Morton, PhD (Data curation; Methodology; Resources; Supervision; Writing—review & editing), Hilary Somerset, MD (Data curation; Resources), Alice Weaver, MD, PhD (Data curation; Writing—review & editing), Phuong N Le, PhD (Data curation; Writing—review & editing), Farshad Chowdhury, MD (Data curation), Karina Gomez, MD, PhD (Data curation; Methodology; Writing—review & editing), Molishree Joshi, PhD (Data curation), Jack Himes, BS (Data curation), Tugs-Saikhan Chimed, MS (Data curation; Writing—review & editing), Nathaniel Alzofon, MS (Data curation; Formal analysis; Writing—review & editing), Bettina Miller, MS (Data curation; Writing—review & editing), Stephen B Keysar, PhD (Conceptualization; Data curation; Methodology; Writing—review & editing), and Antonio Jimeno, MD PhD (Conceptualization; Funding acquisition; Resources; Writing—original draft; Writing—review & editing).
Funding
This work was supported by National Institutes of Health grants R01CA149456 (AJ), R21DE019712 (AJ), R01DE024371 (AJ), P50CA261605 (AJ and XJW), Training in Otolaryngology Research T32DC012280 (CN trainee), the Daniel and Janet Mordecai Foundation (AJ), and the Peter and Rhonda Grant Foundation (AJ). All authors received P30-CA046934 from the University of Colorado Cancer Center Support Grant.
Conflicts of interest
AJ has the following disclosures: stock/options ownership in Suvica and Champions Oncology; BlueDot Bio one-time advisory; AJ institution has contracts with Cantargia, DebioPharm, Genentech, Iovance, Khar Biopharma, Merck, Moderna, Pfizer, Sanofi, and SQZ for clinical trials where AJ is the local PI. Other authors declare no disclosures.
References
- 1. Ferris RL, Blumenschein G, Fayette J, et al. Nivolumab for recurrent squamous-cell carcinoma of the head and neck. N Engl J Med. 2016;375(19):1856-1867. [DOI] [PMC free article] [PubMed] [Google Scholar]
- 2. Burtness B, Harrington KJ, Greil R, et al. ; for the KEYNOTE-048 Investigators. Pembrolizumab alone or with chemotherapy versus cetuximab with chemotherapy for recurrent or metastatic squamous cell carcinoma of the head and neck (KEYNOTE-048): a randomised, open-label, phase 3 study. Lancet. 2019;394(10212):1915-1928. [DOI] [PubMed] [Google Scholar]
- 3. Zandberg DP, Algazi AP, Jimeno A, et al. Durvalumab for recurrent or metastatic head and neck squamous cell carcinoma: results from a single-arm, phase II study in patients with ≥25% tumour cell PD-L1 expression who have progressed on platinum-based chemotherapy. Eur J Cancer. 2019;107:142-152. [DOI] [PubMed] [Google Scholar]
- 4. Pfister DG, Haddad RI, Worden FP, et al. Biomarkers predictive of response to pembrolizumab in head and neck cancer. Cancer Med. 2023;12(6):6603-6614. [DOI] [PMC free article] [PubMed] [Google Scholar]
- 5. Emancipator K, Huang L, Aurora-Garg D, et al. Comparing programmed death ligand 1 scores for predicting pembrolizumab efficacy in head and neck cancer. Mod Pathol. 2021;34(3):532-541. [DOI] [PubMed] [Google Scholar]
- 6. Burtness B, Rischin D, Greil R, et al. Pembrolizumab alone or with chemotherapy for recurrent/metastatic head and neck squamous cell carcinoma in KEYNOTE-048: subgroup analysis by programmed death ligand-1 combined positive score. J Clin Oncol. 2022;40(21):2321-2332. [DOI] [PMC free article] [PubMed] [Google Scholar]
- 7. Freeman GJ, Long AJ, Iwai Y, et al. Engagement of the PD-1 immunoinhibitory receptor by a novel B7 family member leads to negative regulation of lymphocyte activation. J Exp Med. 2000;192(7):1027-1034. [DOI] [PMC free article] [PubMed] [Google Scholar]
- 8. Yokosuka T, Takamatsu M, Kobayashi-Imanishi W, et al. Programmed cell death 1 forms negative costimulatory microclusters that directly inhibit T cell receptor signaling by recruiting phosphatase SHP2. J Exp Med. 2012;209(6):1201-1217. [DOI] [PMC free article] [PubMed] [Google Scholar]
- 9. Latchman Y, Wood CR, Chernova T, et al. PD-L2 is a second ligand for PD-1 and inhibits T cell activation. Nat Immunol. 2001;2(3):261-268. [DOI] [PubMed] [Google Scholar]
- 10. Qiao X-W, Jiang J, Pang X, et al. The evolving landscape of PD-1/PD-L1 pathway in head and neck cancer. Front Immunol. 2020;11:1721. [DOI] [PMC free article] [PubMed] [Google Scholar]
- 11. Spector ME, Bellile E, Amlani L, et al. ; for the University of Michigan Head and Neck SPORE Program. Prognostic value of tumor-infiltrating lymphocytes in head and neck squamous cell carcinoma. JAMA Otolaryngol Head Neck Surg. 2019;145(11):1012-1019. [DOI] [PMC free article] [PubMed] [Google Scholar]
- 12. Dong H, Strome SE, Salomao DR, et al. Tumor-associated B7-H1 promotes T-cell apoptosis: a potential mechanism of immune evasion. Nat Med. 2002;8(8):793-800. [DOI] [PubMed] [Google Scholar]
- 13. Yamaguchi H, Hsu J-M, Yang W-H, et al. Mechanisms regulating PD-L1 expression in cancers and associated opportunities for novel small-molecule therapeutics. Nat Rev Clin Oncol. 2022;19(5):287-305. [DOI] [PubMed] [Google Scholar]
- 14. Azuma T, Yao S, Zhu G, et al. B7-H1 is a ubiquitous antiapoptotic receptor on cancer cells. Blood. 2008;111(7):3635-3643. [DOI] [PMC free article] [PubMed] [Google Scholar]
- 15. Gato-Cañas M, Zuazo M, Arasanz H, et al. PDL1 signals through conserved sequence motifs to overcome interferon-mediated cytotoxicity. Cell Rep. 2017;20(8):1818-1829. [DOI] [PubMed] [Google Scholar]
- 16..Lucas ED, Schafer JB, Matsuda J, et al. PD-L1 reverse signaling in dermal dendritic cells promotes dendritic cell migration required for skin immunity. Cell Rep. 2020;33(2):108258. [DOI] [PMC free article] [PubMed] [Google Scholar]
- 17. Patsoukis N, Wang Q, Strauss L, et al. Revisiting the PD-1 pathway. Sci Adv. 2020;6(38):eabd2712. [DOI] [PMC free article] [PubMed] [Google Scholar]
- 18. Li T, Zhang F, Qin P, et al. Exploring a tumor-intrinsic PD-L1 signal with proximity-dependent biotin identification in lung cancer cells. Biochemistry. 2019;58(18):2293-2296. [DOI] [PubMed] [Google Scholar]
- 19. Yadollahi P, Jeon Y-K, Ng WL, et al. Current understanding of cancer-intrinsic PD-L1: regulation of expression and its protumoral activity. BMB Rep. 2021;54(1):12-20. [DOI] [PMC free article] [PubMed] [Google Scholar]
- 20. Kim DI, Jensen SC, Noble KA, et al. An improved smaller biotin ligase for BioID proximity labeling. Mol Biol Cell. 2016;27(8):1188-1196. [DOI] [PMC free article] [PubMed] [Google Scholar]
- 21. Corthésy B, Kao PN.. Purification by DNA affinity chromatography of two polypeptides that contact the NF-AT DNA binding site in the interleukin 2 promoter. J Biol Chem. 1994;269(32):20682-20690. [PubMed] [Google Scholar]
- 22. Kao PN, Chen L, Brock G, et al. Cloning and expression of cyclosporin A- and FK506-sensitive nuclear factor of activated T-cells: NF45 and NF90. J Biol Chem. 1994;269(32):20691-20699. [PubMed] [Google Scholar]
- 23. Christensen JR, Kendrick AA, Truong JB, et al. Cytoplasmic dynein-1 cargo diversity is mediated by the combinatorial assembly of FTS-Hook-FHIP complexes. Elife. 2021;10:e74538. [DOI] [PMC free article] [PubMed] [Google Scholar]
- 24. Teo G, Liu G, Zhang J, et al. SAINTexpress: improvements and additional features in significance analysis of INTeractome software. J Proteomics. 2014;100:37-43. [DOI] [PMC free article] [PubMed] [Google Scholar]
- 25. Mellacheruvu D, Wright Z, Couzens AL, et al. The CRAPome: a contaminant repository for affinity purification-mass spectrometry data. Nat Methods. 2013;10(8):730-736. [DOI] [PMC free article] [PubMed] [Google Scholar]
- 26. The UniProt Consortium. UniProt: the universal protein knowledgebase in 2021. Nucleic Acids Res. 2021;49(D1):d480-d489. [DOI] [PMC free article] [PubMed] [Google Scholar]
- 27. Escors D, Gato-Canas M, Zuazi M, et al. The intracellular signalosome of PD-L1 in cancer cells. Signal Transduct Target Ther. 2018;3:26. [DOI] [PMC free article] [PubMed] [Google Scholar]
- 28. Castella S, Bernard R, Corno M, et al. ILF3 and NF90 functions in RNA biology. Wiley Interdiscip Rev RNA. 2015;6(2):243-256. [DOI] [PubMed] [Google Scholar]
- 29. DeVaux RS, Ropri AS, Grimm SL, et al. Long noncoding RNA BHLHE40-AS1 promotes early breast cancer progression through modulating IL-6/STAT3 signaling. J Cell Biochem. 2020;121(7):3465-3478. [DOI] [PMC free article] [PubMed] [Google Scholar]
- 30. Jia Y, Li X, Nan A, et al. Circular RNA 406961 interacts with ILF2 to regulate PM(2.5)-induced inflammatory responses in human bronchial epithelial cells via activation of STAT3/JNK pathways. Environ Int. 2020;141:105755. [DOI] [PubMed] [Google Scholar]
- 31. Liu Y, Wang J-X, Nie Z-Y, et al. Upregulation of ERp57 promotes clear cell renal cell carcinoma progression by initiating a STAT3/ILF3 feedback loop. J Exp Clin Cancer Res. 2019;38(1):439. [DOI] [PMC free article] [PubMed] [Google Scholar]
- 32. Keysar SB, Le PN, Anderson RT, et al. Hedgehog signaling alters reliance on EGF receptor signaling and mediates anti-EGFR therapeutic resistance in head and neck cancer. Cancer Res. 2013;73(11):3381-3392. [DOI] [PMC free article] [PubMed] [Google Scholar]
- 33. Jimeno A, Kulesza P, Kincaid E, et al. C-fos assessment as a marker of anti-epidermal growth factor receptor effect. Cancer Res. 2006;66(4):2385-2390. [DOI] [PubMed] [Google Scholar]
- 34. Spranger S, Spaapen RM, Zha Y, et al. Up-regulation of PD-L1, IDO, and T(regs) in the melanoma tumor microenvironment is driven by CD8(+) T cells. Sci Transl Med. 2013;5(200):200ra116. [DOI] [PMC free article] [PubMed] [Google Scholar]
- 35. Cercek A, Lumish M, Sinopoli J, et al. PD-1 blockade in mismatch repair-deficient, locally advanced rectal cancer. N Engl J Med. 2022;386(25):2363-2376. [DOI] [PMC free article] [PubMed] [Google Scholar]
- 36. Kazuma Y, Shirakawa K, Tashiro Y, et al. ILF2 enhances the DNA cytosine deaminase activity of tumor mutator APOBEC3B in multiple myeloma cells. Sci Rep. 2022;12(1):2278. [DOI] [PMC free article] [PubMed] [Google Scholar]
- 37. Jiang F, Tang X, Tang C, et al. HNRNPA2B1 promotes multiple myeloma progression by increasing AKT3 expression via m6A-dependent stabilization of ILF3 mRNA. J Hematol Oncol. 2021;14(1):54. [DOI] [PMC free article] [PubMed] [Google Scholar]
- 38. Li Z, Sun G, Sun G, et al. Various uses of PD1/PD-L1 inhibitor in oncology: opportunities and challenges. Front Oncol. 2021;11:771335. [DOI] [PMC free article] [PubMed] [Google Scholar]
- 39. Cohen EEW, Bell RB, Bifulco CB, et al. The Society for Immunotherapy of Cancer consensus statement on immunotherapy for the treatment of squamous cell carcinoma of the head and neck (HNSCC). J Immunother Cancer. 2019;7(1):184. [DOI] [PMC free article] [PubMed] [Google Scholar]
- 40. Fan Z, Wu C, Chen M, et al. The generation of PD-L1 and PD-L2 in cancer cells: from nuclear chromatin reorganization to extracellular presentation. Acta Pharm Sin B. 2022;12(3):1041-1053. [DOI] [PMC free article] [PubMed] [Google Scholar]
- 41. Morton JJ, Alzofon N, Keysar SB, et al. Studying immunotherapy resistance in a melanoma autologous humanized mouse xenograft. Mol Cancer Res. 2021;19(2):346-357. [DOI] [PMC free article] [PubMed] [Google Scholar]
- 42. Hsieh RW, Borson S, Tsagianni A, et al. Immunotherapy in recurrent/metastatic squamous cell carcinoma of the head and neck. Front Oncol. 2021;11:705614. [DOI] [PMC free article] [PubMed] [Google Scholar]
- 43. Morton JJ, Keysar SB, Perrenoud L, et al. Dual use of hematopoietic and mesenchymal stem cells enhances engraftment and immune cell trafficking in an allogeneic humanized mouse model of head and neck cancer. Mol Carcinog. 2018;57(11):1651-1663. [DOI] [PMC free article] [PubMed] [Google Scholar]
Associated Data
This section collects any data citations, data availability statements, or supplementary materials included in this article.
Supplementary Materials
Data Availability Statement
Materials will be shared per the University of Colorado’s Office for Technology Transfer policies and Institutional Review Board. RNA sequencing data will be deposited on the NCBI Sequence Read Archive; proteomics data will be deposited on PRIDE.