

Abstract
N6‐methyladenosine (m6A) is the most abundant internal modification in eukaryotic RNA and involved in the carcinogenesis of various malignancies. However, the functions and mechanisms of m6A in gallbladder cancer (GBC) remain unclear. In this study, we investigated the role and underlying mechanism of the RNA‐binding protein YT521‐B homology domain‐containing family protein 2 (YTHDF2), an m6A reader, in GBC. Herein, we detected that YTHDF2 was remarkably upregulated in GBC tissues compared to normal gallbladder tissues. Functionally, YTHDF2 overexpression promoted the proliferation, tumor growth, migration, and invasion of GBC cells while inhibiting the apoptosis in vitro and in vivo. Conversely, YTHDF2 knockdown induced opposite results. Mechanistically, we further investigated the underlying mechanism by integrating RNA immunoprecipitation sequencing (RIP‐seq), m6A‐modified RIP‐seq, and RNA sequencing, which revealed that death‐associated protein kinase 3 (DAPK3) is a direct target of YTHDF2. YTHDF2 binds to the 3′‐UTR of DAPK3 mRNA and facilitates its degradation in an m6A‐dependent manner. DAPK3 inhibition restores the tumor‐suppressive phenotype induced by YTHDF2 deficiency. Moreover, the YTHDF2/DAPK3 axis induces the resistance of GBC cells to gemcitabine. In conclusion, we reveal the oncogenic role of YTHDF2 in GBC, demonstrating that YTHDF2 increases the mRNA degradation of the tumor suppressor DAPK3 in an m6A‐dependent way, which promotes GBC progression and desensitizes GBC cells to gemcitabine. Our findings provide novel insights into potential therapeutic strategies for GBC.
Keywords: cancer progression, DAPK3, gallbladder cancer, m6A modification, YTHDF2
Our study reveals the essential role of YTHDF2 in gallbladder cancer (GBC). YTHDF2 was identified as the most significantly upregulated m6A‐related gene in GBC and increases the mRNA degradation of the tumor suppressor DAPK3 in an m6A‐dependent way, which promotes GBC progression and reduces its response to gemcitabine. These findings highlight an m6A‐dependent molecular mechanism of GBC progression and provide new insights into the development of effective therapeutic approaches for GBC.
Abbreviations
- Act‐D
actinomycin D
- CNOT1
CCR4‐NOT transcription complex subunit 1
- co‐IP
coimmunoprecipitation
- DAPK3
death‐associated protein kinase 3
- DEG
differentially expressed gene
- GBC
gallbladder cancer
- GO
Gene Ontology
- GSEA
Gene Set Enrichment Analysis
- IHC
immunohistochemistry
- KEGG
Kyoto Encyclopedia of Genes and Genomes
- m6A
N6‐methyladenosine
- MeRIP‐seq
m6A‐modified RNA immunoprecipitation and sequencing
- Mut
mutant
- RIP‐seq
RNA immunoprecipitation sequencing
- RNA‐seq
RNA sequencing
- RT‐qPCR
real‐time quantitative PCR
- TIMER
Tumor Immune Estimation Resource online
- YTHDF2
YT521‐B homology domain‐containing family proteins 2
1. INTRODUCTION
Gallbladder carcinoma is the most common malignancy of the biliary tract, with adenocarcinoma as the main histological type. 1 The incidence rate of GBC shows significant heterogeneity in sex, ethnicity, and geographical region, with 115,949 new cases and 84,695 cancer‐related deaths reported worldwide in 2020. 2 Insidious onset, high aggressiveness, and frequent lymph node metastasis result in deprived prognosis for GBC, with a 5‐year survival rate of less than 10%. 3 , 4 , 5 Even after radical surgery, the median overall survival of patients with GBC is only 3–5 years. 6 , 7 Gemcitabine‐based chemotherapy has been accepted as the first‐line treatment for advanced GBC, with a limited drug resistance. 8 Therefore, an improved understanding of the molecular mechanisms underlying the progression of GBC is urgently required to identify effective therapeutic targets.
The m6A modification, the most frequently observed mRNA modification in eukaryotes, 9 has recently been highlighted in a multitude of cancers due to its important roles in tumorigenesis, progression, drug resistance, and immune escape. 10 , 11 , 12 , 13 RNA m6A modification is a dynamic and reversible process and functions through regulating RNA metabolism in multiple dimensions, such as stabilization, degradation, translation, alternative splicing, and nuclear export. The components of the m6A modification system including m6A methyltransferases (writers), demethylase (erasers), and m6A‐binding proteins (readers) have been implicated in the development of various cancers. 14 , 15 The RNA‐binding protein YTHDF2 is the first functionally identified reader that recognizes and binds specific m6A sites through its C‐terminal region. Furthermore, the N‐terminal region of YTHDF2 interacts with the SH domain of CNOT1 and initiates the deadenylation‐dependent degradation process of targeted mRNA, which begins with the removal of the 3′‐end poly(A) tail. 16 , 17 Accumulating evidence suggests that YTHDF2 is involved in various cancers, such as gastric cancer, 18 prostate cancer, 19 cholangiocarcinoma, 20 bladder cancer, 21 and hepatocellular carcinoma, 22 by regulating the expression of target tumor suppressor genes or oncogenes. However, the role of YTHDF2 in GBC progression remains obscure.
In this study, we found YTHDF2 promoted the malignant behavior of GBC cells. RNA immunoprecipitation sequencing, MeRIP‐seq, and RNA‐seq determined DAPK3 as a direct target of YTHDF2. Mechanistically, YTHDF2 promotes the degradation of DAPK3 mRNA in an m6A‐dependent manner. Together, our study investigated the epitranscriptomic mechanisms underlying GBC progression and identified YTHDF2 as an oncogene with potential therapeutic significance.
2. MATERIALS AND METHODS
2.1. Clinical specimens
Ten pairs of frozen GBC tissue specimens and matched nontumor adjacent tissues were collected during surgery at Peking Union Medical College Hospital for western blot analysis, and eight tissue pairs were selected for RNA‐seq. Ten pairs of GBC tissues and matched normal tissues were collected and stored in paraformaldehyde for IHC staining. Pathological classification of the samples was undertaken by two pathologists. This study was carried out in accordance with the principles of the Declaration of Helsinki and received approval from the Institutional Ethics Committee of Peking Union Medical College Hospital, Chinese Academy of Medical Sciences, for conducting clinical research on human participants (JS‐1569).
2.2. N6‐methyladenosine‐modified RIP‐seq
Total RNA was fragmented using NEBNext Magnesium RNA Fragmentation Module (NEB) at 94°C for 10 min. A total of 100 μL precleaned Protein G Dynabeads (10003D; ThermoFisher) was mixed with 5 μg anti‐m6A Ab (ab151230; Abcam) or IgG isotype control Ab (#3900S; CST) overnight at 4°C with rotation. The total RNA mixed with Ab‐coated beads was rotated for 2 h at 4°C for immunoprecipitation. The beads were then washed with NT2 buffer, followed by incubation with proteinase K at 37°C for 30 min. The RNeasy MinElute Cleanup Kit (Qiagen) was used to purify the immunoprecipitated RNA. Library preparation for RNA‐seq was carried out using the NEBNext Ultra II Directional RNA Library Prep Kit (NEB). Peak annotation was conducted using the R package, exomePeak. Read coverage and visualization genomic views of read coverage were undertaken using bedtools and the R package Gviz.
2.3. Coimmunoprecipitation assay
The protein–protein interaction was detected by co‐IP. The washed Protein G Dynabeads were mixed with target Ab and incubated overnight on a rotator at 4°C. The GBC cells were lysed at 4°C for 30 min. The total protein was then isolated and mixed with Ab‐bound Protein G Dynabeads for 4 h at 4°C with gentle rotation. The precipitated protein was then washed with NT2 wash buffer. The samples were then subjected to western blotting with the indicated Abs.
2.4. RNA stability assay
To detect the stability of mRNA, Act‐D (5 μg/mL) was added into medium containing GBC for the indicated period. Total RNA was extracted using the Eastep Super Total RNA Extraction Kit (LS1030; Promega). Real‐time qPCR was carried out to analyze the expression levels and calculate the t 1/2 of mRNA.
2.5. Dual‐luciferase reporter assay
The WT or mutant binding sites containing sequences were cloned into the pmirGLO vectors at the 3′‐UTR region. Oligonucleotide sequences are listed in Appendix S1. Lipofectamine 3000 transfection reagent (Thermo Fisher Scientific) was used to transfect the vectors into NOZ cells. Luciferase activity was detected after 72 h of incubation using the Dual‐Glo Luciferase Assay System (Promega). The ratio of firefly to Renilla luciferase was calculated.
2.6. Tumor xenograft models
Male BALB/c nude mice (6 weeks old) were used for xenograft experiments. A 150 μL‐cell suspension containing 5 × 10⁶ cells was injected s.c. into each nude mouse. Tumor volumes were measured every 4 days for 1 month. To evaluate chemosensitivity to gemcitabine, mice were i.p. injected with gemcitabine (50 mg/kg) every 4 days when the tumor volume reached 100 mm3.
2.7. Lung metastasis model
Male NOD/SCID mice (6 weeks old) were used for lung metastasis experiments. A 150 μL‐cell suspension containing 5 × 10⁵ cells was injected i.v. into the tail vein of each mouse. After 1 month, the lungs were harvested and photographed, and the number of metastatic lesions was calculated.
All animal experiments were approved by the Animal Welfare and Ethics Committee of Peking Union Medical College Hospital (XHDW‐2022‐110) in accordance with the guidelines of the NIH for the care and use of laboratory animals.
2.8. Statistical analysis
Data are presented as mean ± SD. The statistical significance of the differences between groups was determined using two‐tailed Student's t‐test or one‐way ANOVA. For comparison of two factors and more than two variables, two‐way ANOVA and Tukey's multiple comparisons test were utilized. All statistical analyses were carried out using GraphPad Prism 8.0 or IBM SPSS 25 software. Statistical significance was set at p < 0.05, and p < 0.01 indicated high statistical significance.
Other information of materials and methods used in this study is provided in Appendix S2.
3. RESULTS
3.1. YTHDF2 expression significantly upregulated in GBC tissues
To investigate the roles of m6A‐related genes in GBC progression, we undertook transcriptome analysis in eight cases of paired cancer and adjacent tissues using RNA‐seq, which revealed a total of 1579 significant DEGs (Figure 1A). Pathway enrichment analysis was subsequently performed based on the GO and KEGG databases, which revealed that cancer‐associated pathways were distinctly enriched, including the p53 signaling pathway, DNA replication, ferroptosis, and drug metabolism (Figures 1B and S1A). Among the m6A‐related genes, 23 YTHDF2 was the most prominently upregulated, with adjusted p = 0.0116 and paired t‐test p < 0.0001 (Figure 1C,D). In addition, pan‐cancer analysis of YTHDF2 expression in a series of tumors from the TIMER database suggested that YTHDF2 was extensively upregulated across multiple malignancies, emphasizing its potential role in the progression of GBC (Figure S1B). Moreover, western blotting and IHC staining of matched cancerous and paracancerous tissues also indicated elevated YTHDF2 expression levels in GBC tissues compared to adjacent normal tissues (Figures 1E,F and S2).
FIGURE 1.
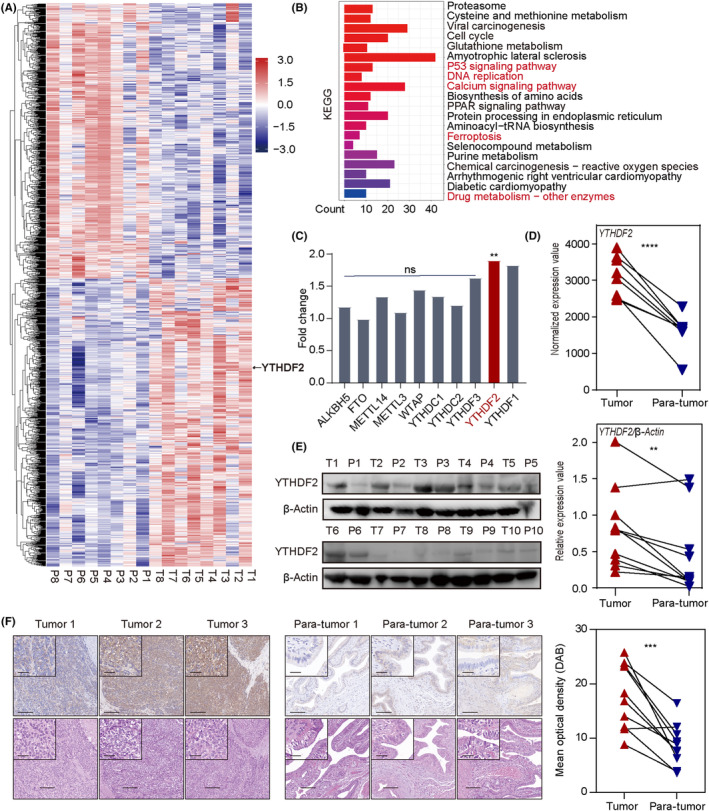
YTHDF2 is highly expressed in gallbladder cancer (GBC) tissues. (A) Heatmap of transcriptome analysis for eight paired GBC tissues. DESeq2‐normalized expression values of differential genes between GBC tissues and adjacent tissues with adjusted p < 0.05. (B) Kyoto Encyclopedia of Genes and Genomes (KEGG) analysis of differentially expressed genes. Red indicates cancer‐related terms. (C) Fold changes in N6‐methyladenosine‐associated gene expression in GBC according to transcriptome sequencing. (D) Paired t‐test analysis of YTHDF2 expression levels between GBC tissues and adjacent normal tissues. (E) Western blot analysis of the relative YTHDF2 protein expression levels in paired GBC specimens. P, para‐tumor; T, tumor. (F) Representative immunohistochemical images of YTHDF2 expression in GBC tissues and adjacent normal tissues. Paired t‐test analysis was used to compare the YTHDF2 expressions between two groups. **p < 0.01, ***p < 0.001, ****p < 0.0001. Scale bar, 200 μm (outside), 50 μm (insets). ns, no significance.
3.2. YTHDF2 significantly promotes GBC cell proliferation and inhibits apoptosis
To further investigate the function of YTHDF2 in GBC progression, we constructed a lentiviral vector for the overexpression of YTHDF2 and an interference lentiviral vector carrying two distinct shRNAs targeting YTHDF2. The efficiencies of overexpression and knockdown were validated by western blot analysis (Figure S3A). Colony formation assays revealed that YTHDF2 overexpression promoted the colony formation of GBC (Figure 2A; both p < 0.001) whereas YTHDF2 knockdown inhibited the GBC colony‐forming capacity of NOZ and GBC‐SD cells (p = 0.0026 and 0.019 for NOZ cells; p < 0.001 and p = 0.0017 for GBC‐SD cells). Gallbladder cancer cell proliferation curves were plotted for evaluating the effect of YTHDF2 on proliferation, which revealed that YTHDF2 overexpression significantly enhanced the proliferation ability (p < 0.001 for NOZ cells; p = 0.0074 for GBC‐SD cells) whereas YTHDF2 knockdown remarkably reduced the proliferative ability of NOZ and GBC‐SD cells (Figure 2B; both p < 0.001 for NOZ cells; p = 0.023 and p = 0.049 for GBC‐SD cells). Furthermore, flow cytometry analysis showed that, compared to the control group, YTHDF2 overexpression favored GBC cell survival (Figure 2C,D; p = 0.0341 for NOZ cells; p = 0.0051 for GBC cells) whereas its knockdown promoted GBC cell apoptosis (p = 0.0060 and p = 0045 for NOZ cells; p = 0.0185 and p = 0.0418 for GBC cells).
FIGURE 2.
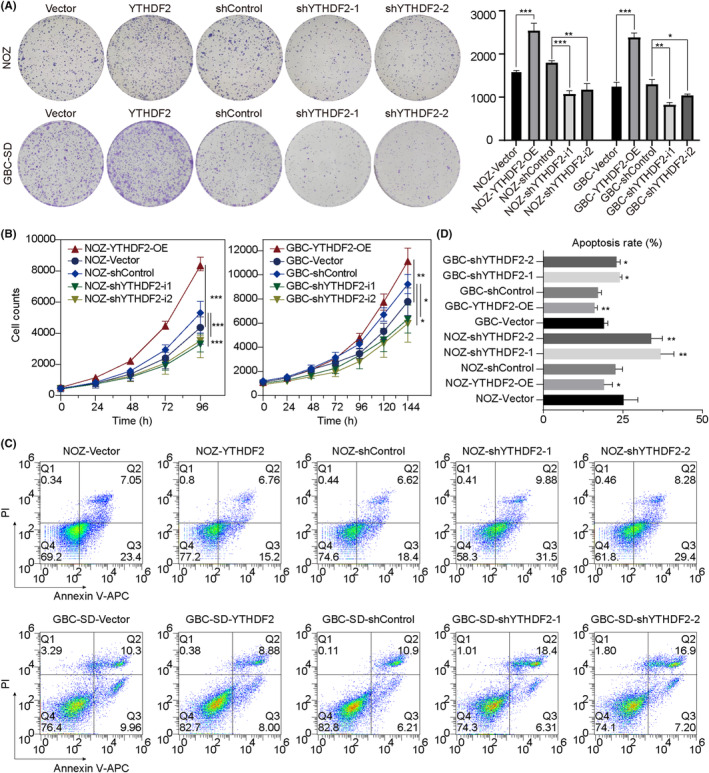
YTHDF2 regulates the proliferation, colony‐forming efficiency, and apoptosis of gallbladder cancer (GBC) in vitro. (A) Colony formation assay on the effect of YTHDF2 on colony‐forming ability. Comparisons between groups were carried out by Student's t‐test and one‐way ANOVA. (B) The number of GBC cells was counted at the indicated times and the proliferation curves were plotted to evaluate the proliferative abilities of GBC cells. Two‐way ANOVA was used for multiple comparison and Tukey's tests were used for multiple pairwise comparison. (C) Flow cytometry assay of the apoptosis rates of NOZ and GBC‐SD cells affected by YTHDF2. APC, allophycocyanin; PI, propidium iodide. (D) Statistical analysis was carried out using Student's t‐test, ANOVA, and post‐hoc tests. *p < 0.05, ** p< 0.01, ***p < 0.001.
3.3. YTHDF2 significantly promotes GBC cell migration and invasion
We undertook Transwell and wound healing assays to investigate whether YTHDF2 affects GBC cell migration and invasion. Transwell assays showed that more NOZ and GBC‐SD cells traveled through the membrane in the YTHDF2 overexpression groups whereas fewer cells traveled through the membrane in the shYTHDF2 groups, with or without Matrigel (Figure 3A; all p < 0.001). These results were confirmed by the results of the wound healing assay; YTHDF2 overexpression significantly facilitated wound healing (Figure 3C; p = 0.0469 for NOZ cells; p = 0.0163 for GBC‐SD cells) whereas YTHDF2 knockdown delayed wound healing (p = 0.0018 and p = 0.0103 for NOZ cells; p < 0.001 and p = 0.0373 for GBC‐SD cells). Collectively, these results suggest that YTHDF2 promotes GBC progression.
FIGURE 3.
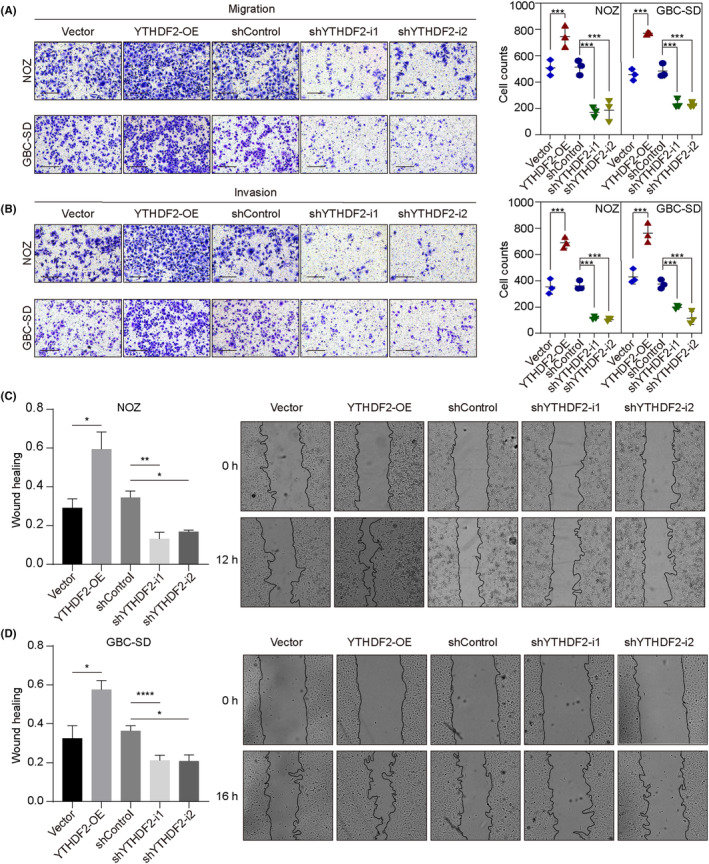
YTHDF2 regulates the migration and invasion of gallbladder cancer (GBC) cells in vitro. (A, B). Transwell assays (with or without Matrigel) were carried out for evaluating the migration and invasion ability of NOZ and GBC‐SD cells with YTHDF2 overexpression (OE) or knockdown. (C, D) Wound healing assay to examine the migration ability of NOZ and GBC‐SD cells with YTHDF2 overexpression or knockdown. The percentage of healed areas was calculated and compared. Statistical differences were analyzed using Student's t‐test, one‐way ANOVA, and post‐hoc tests. *p < 0.05, **p < 0.01, ***p < 0.001, ****p < 0.0001.
3.4. YTHDF2 promotes GBC proliferation and metastasis in vivo
We further investigated the effects of YTHDF2 in vivo by evaluating the growth rate of s.c. xenografts in nude mice. Compared to the control group, tumors with cells overexpressing YTHDF2 showed higher proliferation ability in terms of both volume (Figure 4A, p < 0.001) and weight (p < 0.001). In contrast, tumor cells with YTHDF2 knockdown showed a suppressed proliferative ability in terms of volume (shYTHDF2‐1, p = 0.01; shYTHDF2‐2, p < 0.01) and weight (both p < 0.001). In brief, the results of the mouse xenograft models indicated the promoting effect of YTHDF2 on GBC growth in vivo.
FIGURE 4.
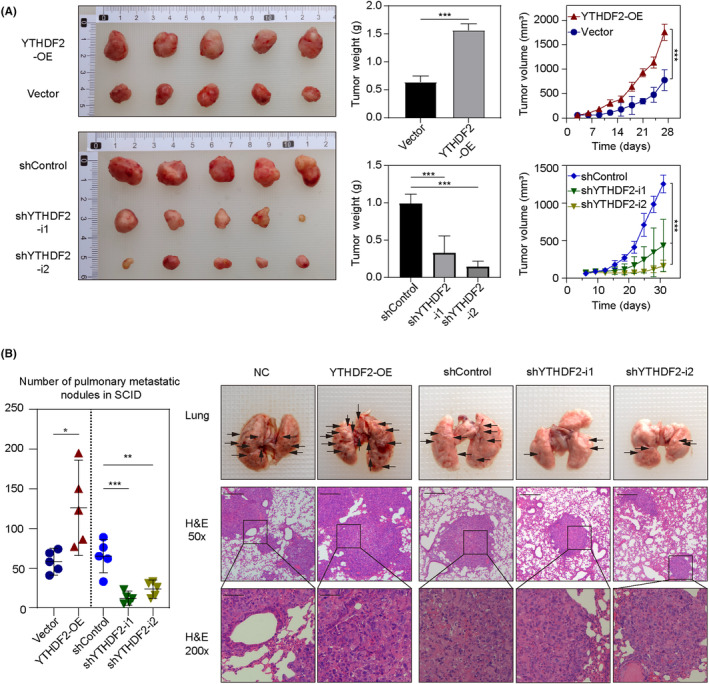
YTHDF2 promotes the growth and metastasis of gallbladder cancer cells in vivo. (A) Subcutaneous xenograft tumors from BALB/c nude mice. The weight of tumors in different groups was measured and the volumes were recorded at indicated times. (B) Representative images and quantification of metastatic nodules in the lungs. Black arrowheads indicate pulmonary metastatic nodules. ANOVA test and Student's t‐test were used for comparison between groups. *p < 0.05, **p < 0.01, ***p < 0.001. NC, negative control; OE, overexpression.
In addition, we constructed a lung metastasis model by i.v. injection into the tail vein of SCID mice to evaluate the effect of YTHDF2 on metastasis ability in vivo. The metastatic foci in the lungs of SCID mice were photographed and counted; the number of metastatic foci was increased in the YTHDF2 overexpression group (Figure 4B; p = 0.0164) and decreased in the YTHDF2 knockdown group (shYTHDF2‐1, p = <0.001; shYTHDF2‐2, p = 0.0012) compared to that in the control groups. These results suggest that YTHDF2 promotes GBC metastasis in vivo.
3.5. Identification of the YTHDF2 downstream target by multi‐omics analysis
We then undertook a multi‐omics analysis to identify the downstream targets regulated by YTHDF2 through m6A modification. We carried out RNA‐seq on YTHDF2‐knockdown and control NOZ cells. A total of 2508 altered mRNA transcripts were determined by transcriptomic analysis in shYTHDF2 versus shControl (log2[fold change] ≥ 0.5 and p < 0.05); among them, 861 genes were upregulated (Figure 5A,B). The KEGG pathway analysis of these DEGs showed that YTHDF2 affected many signaling pathways associated with cancer progression (Figure 5C), including ECM–receptor interaction (p = 0.0014) and apoptosis (p = 0.0147). Moreover, GO analysis revealed and YTHDF2‐regulated genes were enriched in biological processes, including the Notch signaling pathway, tumor necrosis factor‐mediated signaling pathway, growth regulation, and calcium‐dependent cell–cell adhesion (Figure S3B). To determine the downstream biological functions regulated by YTHDF2 in GBC, we further undertook GSEA using a matrix of all genes. Notably, the enrichment plots also showed that the genes associated with apoptosis and the p53 signaling pathway were upregulated in the YTHDF2 knockdown group (Figure 5D). Collectively, our results highlight the crucial role of YTHDF2 in cancer progression, particularly in apoptosis.
FIGURE 5.
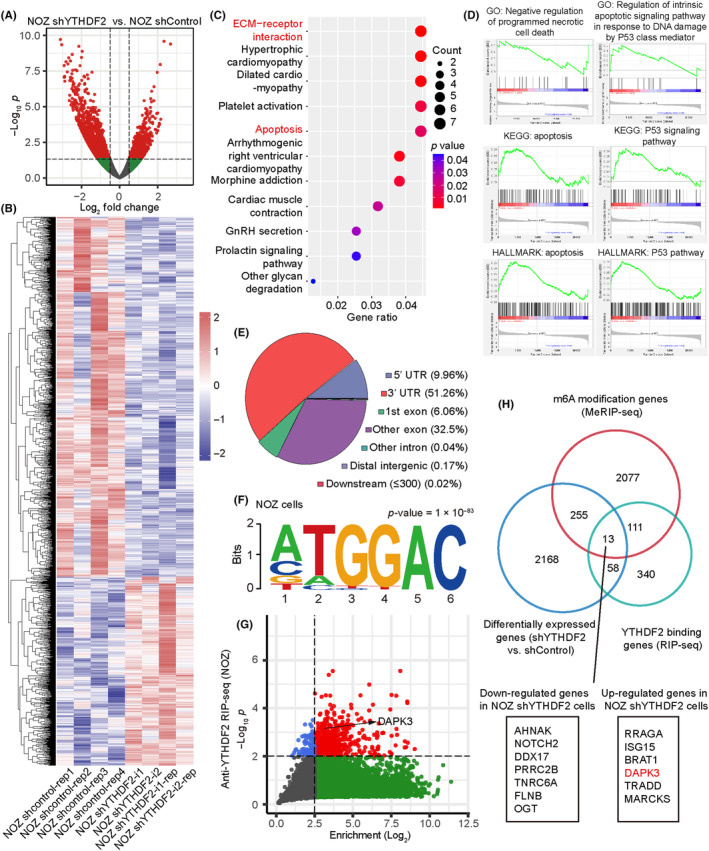
Identification of the YTHDF2 downstream target by multi‐omics analysis. (A) Transcriptome analysis was undertaken using DESeq2 between NOZ with stable YTHDF2 knockdown and control. Volcano plot of differentially expressed genes, with adjusted p < 0.05 and |log2 fold change| ≥ 0.5. (B) Heatmap showing the normalized expression values of the genes screened as described in (A). (C) Kyoto Encyclopedia of Genes and Genomes (KEGG) analysis of differentially expressed genes with YTHDF2 knockdown. (D) Gene Set Enrichment Analysis showing the biological process and pathway enriched following YTHDF2 knockdown. Results are shown as ridge maps. GO, Gene Ontology. (E) Distribution and percentages of N6‐methyladenosine (m6A) modification peaks on different regions of RNAs in NOZ cells. (F) Motif analysis revealing the consensus sequence with enriched m6A modifications in NOZ cells. (G) Plot of enriched genes in the RNA immunoprecipitation analysis (RIP‐seq) following RNA sequencing in NOZ cells. (H) Venn diagram of the overlap of significant genes among the results of the RNA sequencing, m6A‐modified (Me)RIP‐seq, and RIP‐seq. An intersection of 13 genes was obtained, including 7 downregulated and 6 upregulated genes.
Considering the role of YTHDF2 as an m6A “reader,” we carried out MeRIP‐seq in NOZ cells to detect the distribution of m6A modification and found that most of the m6A peaks were highly enriched in the 3′‐UTR of mRNAs (Figure 5E). A motif search identified a consensus sequence motif, GGAC, within the m6A peak region (Figure 5F), which is consistent with previous findings. 24 , 25
To identify the potential target mRNAs directly bounded by YTHDF2, anti‐YTHDF2 RIP‐seq was then carried out in NOZ cells with two replicates, and a total of 1502 genes were obtained (Figure 5G). YTHDF2 primarily acts by selectively binding to m6A‐modified mRNAs and mediating their deadenylation. Therefore, we focused on the genes upregulated following YTHDF2 knockdown based on a multi‐omics intersection analysis (Figure 5H) and identified six genes: RRAGA, ISG15, BRAT1, DAPK3, TRADD, and MARCKS.
3.6. YTHDF2 facilitates DAPK3 mRNA degradation in an m6A‐dependent manner
Based on the above results, apoptosis and the p53 signaling pathway showed strong correlations with the expression levels of YTHDF2 in GBC (Figures 1B and 5C,D). Therefore, we selected the death‐related genes, RRAGA, TRADD, and DAPK3, from the six candidate genes for further analysis and validation in NOZ cells. The RT‐qPCR results indicated that the mRNA level of DAPK3, but not that of RRAGA or TRADD, was inversely correlated with YTHDF2 expression stably (Figure 6A). Western blot analysis also confirmed the regulatory relationship between DAPK3 and YTHDF2, with an increase in DAPK3 protein levels following YTHDF2 knockdown and a decrease following YTHDF2 overexpression (Figure 6B). We further validated the inverse association between the expression levels of YTHDF2 and DAPK3 in GBC‐SD cells by RT‐qPCR and western blotting (Figure S4A,B). Subsequently, we sought to analyze the binding site of YTHDF2 on DAPK3 mRNA and performed Integrative Genomics Viewer (IGV) analysis and observed that the m6A peaks were significantly enriched in the 3′‐UTR region of DAPK3 mRNAs, both in NOZ cells and GBC‐SD cells (Figures 6C and S4C). The binding relationship between DAPK3 and YTHDF2 was also confirmed in GBC‐SD cells by RIP‐qPCR (Figure 4D).
FIGURE 6.
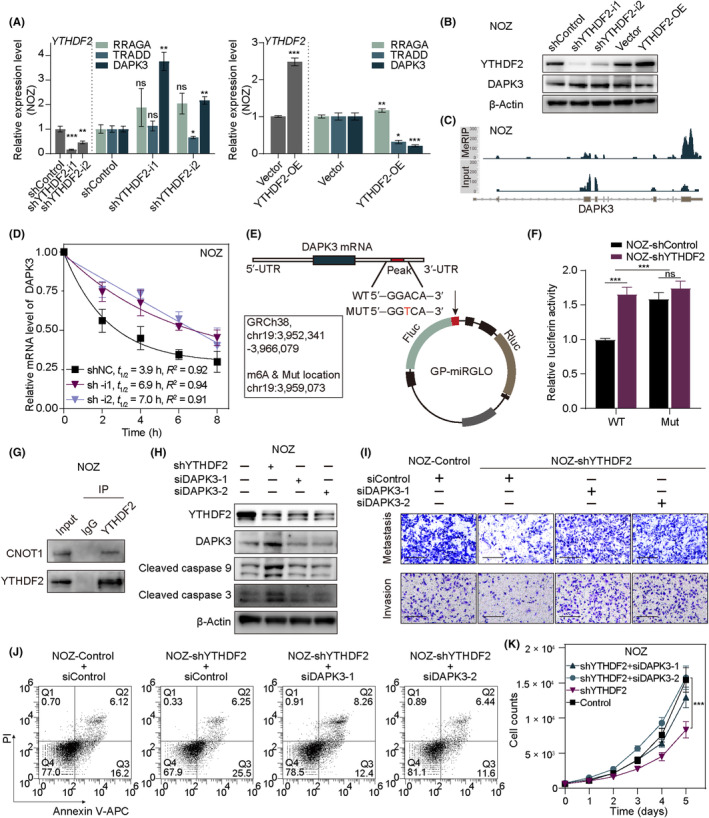
YTHDF2 promotes the degradation of DAPK3 mRNA in an N6‐methyladenosine (m6A)‐dependent manner. (A) Relative RNA level validation of the regulatory relationship between YTHDF2 and three candidate genes (RRAGA, TRADD, and DAPK3) by real‐time quantitative PCR. (B) Western blotting was used to validate the changes in DAPK3 protein levels following YTHDF2 alteration. (C) Integrative Genomics Viewer (IGV) plots showing the m6A binding site on DAPK3 mRNA based on m6A‐modified RNA immunoprecipitation analysis (MeRIP‐seq). Top: IP sample of MeRIP‐seq; bottom: input sample of MeRIP‐seq. (D) DAPK3 mRNA decay assay was conducted following treatment with actinomycin D in NOZ‐shControl and NOZ‐shYTHDF2 cells. (E) Construct details of the dual‐luciferase reporter assays. (F) Dual‐luciferase reporter assays were carried out in peak‐WT and ‐mutant (Mut) GP‐miRGLO in NOZ cells with stable YTHDF2 knockdown and the control. Relative activity levels of firefly luciferase to Renilla luciferase were normalized to the empty pmirGLO vector. (G) Immunoblot analysis of CNOT1 that coimmunoprecipitated with YTHDF2 from lysates of NOZ cells. (H) Western blotting of YTHDF2 knockdown and siDAPK3 rescue assays and downstream cell death‐related proteins. (I) Migration and invasion rescue assays after DAPK3 knockdown in shYTHDF2 NOZ cells. (J) Apoptosis rescue assays after DAPK3 knockdown in shYTHDF2 NOZ cells. (K) Proliferation rescue assays after DAPK3 knockdown in shYTHDF2 NOZ cells. ANOVA and Tukey's multiple comparison tests were used to compare between groups. *p < 0.05, **p < 0.01, ***p < 0.001. APC, allophycocyanin; ns, no significance.
Thereafter, we undertook Act‐D assays to evaluate the effect of YTHDF2 on DAPK3 mRNA stability. As expected, decelerated mRNA decay of DAPK3 following YTHDF2 knockdown was observed in NOZ cells (Figure 6D) and GBC‐SD cells (Figure S4E). To verify the binding of YTHDF2 on the m6A site of DAPK3 in the 3′‐UTR region, a dual‐luciferase reporter system was constructed. A WT DAPK3‐3′‐UTR sequence and a Mut counterpart were designed and inserted into the reporter vectors (Figure 6E). The luciferase activity of Fluc/Rluc was significantly increased following YTHDF2 knockdown in the WT group, whereas no significant difference was observed in the Mut group (Figures 6F and S4F). In addition, the interaction between YTHDF2 and CNOT1 in NOZ and GBC‐SD cells was confirmed by co‐IP and western blotting (Figures 6G and S4G).
Subsequently, we assessed apoptosis marker proteins to confirm that the classical apoptotic pathway was induced by the YTHDF2‐DAPK3 axis. We found that YTHDF2 knockdown increased the levels of cleaved caspase 3 and 9 in NOZ and GBC‐SD cells, which were rescued by siDAPK3 (Figures 6H and S4H). In addition, we undertook a series of rescue experiments to confirm that the oncogenic effect of YTHDF2 was mediated through its pro‐degradation effects on DAPK3. As expected, siDAPK3 rescued the effects of YTHDF2 knockdown on the proliferation, migration, invasion, and apoptosis of GBC cells (Figures 6I–K and S4I–K).
3.7. Deficiency of YTHDF2 increases the sensitivity of GBC to gemcitabine through DAPK3
As a tumor‐suppressing kinase, DAPK3 has also been reported to increase tumor sensitivity to chemotherapy due to enhanced cellular aggregation and cell‐to‐cell adherence. 26 , 27 Therefore, we investigated whether YTHDF2 affects chemosensitivity of GBC to gemcitabine by regulating the expression of DAPK3. Cell viability assays indicated that YTHDF2 knockdown enhanced the sensitivity of NOZ and GBC‐SD cells to gemcitabine. Furthermore, DAPK3 knockdown blocked the chemosensitivity‐enhancing effects mediated by YTHDF2 knockdown following treatment with gemcitabine, as indicated by the IC50 values in Figure 7A. Unexpectedly, YTHDF2 knockdown also enhanced the apoptosis of cells under treatment with gemcitabine, which could be rescued by DAPK3 knockdown both in NOZ and GBC cells(Figure 7B). Notably, the in vivo results were consistent with those observed in vitro (Figures 7C–E and S5). The above results clearly illustrated the impact of the YTHDF2‐DAPK3 axis on the chemosensitivity of GBC cells to gemcitabine.
FIGURE 7.
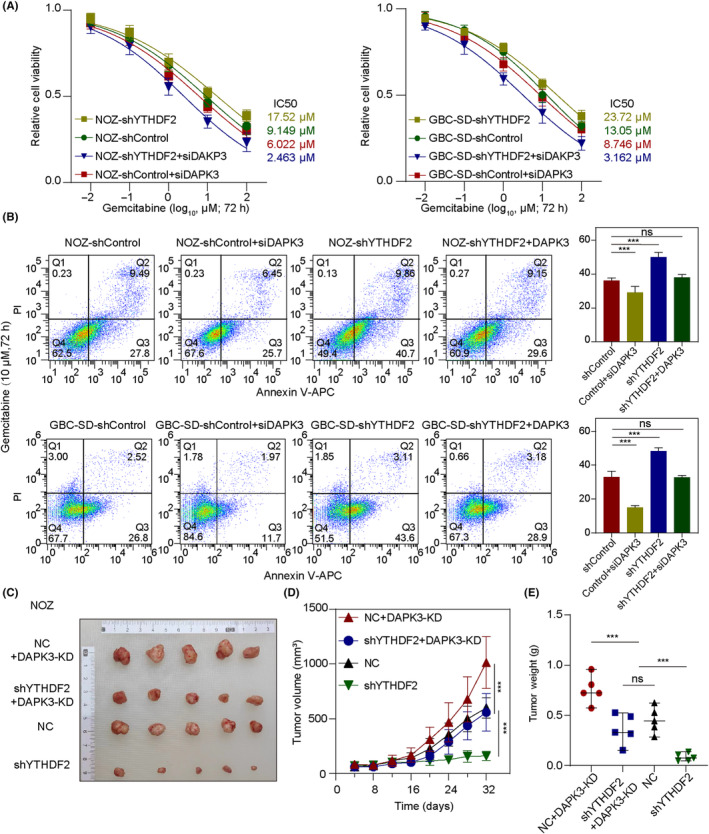
Loss of YTHDF2 enhances antitumor effect of gemcitabine for gallbladder cancer (GBC) by regulating DAPK3 mRNA decay. (A) Cell viability was determined using CCK‐8 assays for NOZ and GBC‐SD cells treated with gemcitabine at the indicated dosages. (B) The apoptosis rates of GBC cells were measured by flow cytometric analysis after exposure to 10 μM gemcitabine for 72 h. Comparisons between groups were carried out by Student's t‐test, one‐way ANOVA, and post‐hoc tests. (C–E) Xenograft tumors were collected from BALB/c nude mice treated with gemcitabine. Weights and volumes of the xenografts in different groups were measured and compared by Student's t‐test, ANOVA, and post‐hoc tests. ***p < 0.001. PI, propidium iodide; APC, allophycocyanin; KD, knockdown; NC, negative control; ns, no significance.
4. DISCUSSION
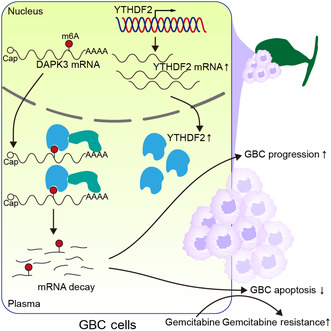
In this study, we identified the oncogenic role of YTHDF2 in GBC for the first time, showing that YTHDF2 promotes the malignant behavior of GBC by increasing the degradation of DAPK3 mRNA in an m6A‐dependent manner. Importantly, we found that the YTHDF2‐DAPK3 axis plays an essential role in resistance to gemcitabine in GBC (Figure 8).
FIGURE 8.
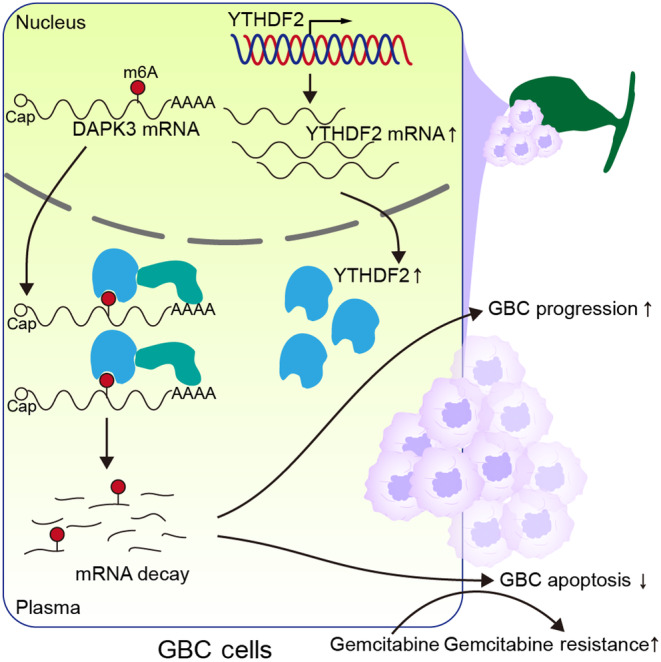
Schematic illustration of gallbladder cancer (GBC) progression induced by the YTHDF2‐DAPK3 axis. m6A, N6‐methyladenosine.
The global abundance and characteristic expression patterns of m6A methylation was usually reported as dysregulated in multiple tumors and plays roles in tumor development by controlling the RNA metabolism of oncogenes and tumor suppressor genes. Various reader proteins mediate the different fates of downstream RNAs by recognizing m6A‐modified sites and the surrounding specific sequences. The best‐characterized m6A readers are the YTH domain family proteins, including YTHDF1, YTHDF2, YTHDF3, YTHDC1, and YTHDC2, which contain a common C‐terminal domain (YTH) that recognizes and binds m6A sites on RNAs. 16 The different functions are determined by their N‐terminal domains, which recruit different effector complexes. For example, YTHDF1 facilitates cap‐dependent translation by interacting with the initiation factor, eIF3, to form a loop with eIF4G. 28 , 29 Classically, YTHDF2 recognizes the 3′‐UTR m6A site and initiates RNA deadenylation and decay by cooperating with the CCR4‐NOT complex. 17 As the most efficient m6A “reader,” YTHDF2 have been reported to enhance the degradation of cyclin‐dependent kinase inhibitor 1B (CDKN1B) mRNA, which influences the chemoresistance to cisplatin and promotes intrahepatic cholangiocarcinoma progression. 20 Li et al. 19 reported that YTHDF2 plays a role in tumor progression through the degradation of the tumor suppressors LHPP and NKX3–1. Moreover, YTHDF2 is upregulated and functions as an oncogene in lung cancer, myelocytic leukemia, gastric cancer, and hepatocellular carcinoma. In contrast, the tumor suppressor roles of YTHDF2 have been reported in melanoma and osteosarcoma. 30 , 31 However, the role and definite molecular mechanism of YTHDF2 in the tumorigenesis and progression of GBC remain unclear.
In the present study, sequencing analysis of clinical samples identified YTHDF2 as the most distinctly upregulated m6A‐related gene in GBC, relative to the other m6A‐associated genes, suggesting its potential oncogenic role in GBC development. Consistent with our data, YTHDF2 expression was also observed to be elevated across a wide range of other cancer types, according to the TIMER database. 23 , 32 Subsequently, we showed that YTHDF2 promoted the proliferation, migration, and invasion abilities and inhibited the apoptosis of NOZ and GBC‐SD cells, both in vitro and in vivo.
Using a multi‐omics strategy integrating MeRIP‐seq, anti‐YTHDF2 RIP‐seq, and mRNA‐seq, we identified the target m6A‐modified mRNAs that are regulated by YTHDF2 by their direct binding. Notably, our KEGG analysis or GSEA revealed that the DEGs between tumor and adjacent tissues and between shYTHDF2 and control cells were enriched in apoptosis and p53 pathway‐associated gene signatures. This result suggests that cell death is a major biological process associated with the differential expression of YTHDF2. We then confirmed DAPK3 as a direct downstream target of YTHDF2. In the dual‐luciferase assay, we fused the DAPK3 3′‐UTR region containing the GGACU motif to a luciferase reporter. The knockdown of YTHDF2 significantly improved the relative luciferase activity (Fluc/Rluc ratio) compared to the control. However, this disparity in the luciferase activity was reversed by a mutation in the GGACU motif. These results indicate that YTHDF2 exerts its regulatory effect on DAPK3 through specific recognition and degradation in an m6A‐dependent manner. Furthermore, the YTHDF2‐CNOT1 interaction was validated by co‐IP, which suggests a deadenylation‐dependent decapping pathway. 17
DAPK3, also called Zipper interacting protein kinase (ZIPK), belongs to a death‐associated protein (DAP) kinase family. DAPK3 has been implicated as a tumor suppressor, and low DAPK3 expression levels have been correlated with short survival times in many cancer types, such as gastric cancer 33 and non‐small‐cell lung cancer. 34 Previous studies have revealed that DAPK3 is involved in the regulation of cell death, mitosis, proliferation, motility, and adherence to mediate its tumor‐inhibitory function. 26 , 35 As a Ca2+/calmodulin‐regulated serine/threonine kinase, DAPK3 predominately promotes cell death through caspase‐dependent signaling with extensive membrane blebbing and inhibits tumor cell growth. This evidence could well support our finding that the levels of cleaved caspases 9 and 3 were altered by DAPK3, which is also consistent with studies on prostate and lung cancers. 36 , 37 , 38 In addition, Li et al. have reported that DAPK3 suppresses the progression of gastric cancer by activating autophagy in tumor cells. 33 Through the posttranslational modification of STING, DAPK3 also activates the STING‐IFN‐β pathway and enhances antitumor innate immunity and immune surveillance. 39 Furthermore, DAPK3 promotes the migration and invasion of non‐small‐cell lung carcinoma cells, which are modulated by Vir‐Like m6A methyltransferase associated (VIRMA). 36 DAPK3 downregulation reportedly showed significant correlation with tumor invasion and poor metastatic prognosis in 162 gastric cancer cases. 35 Consistently, we also found that the inhibition of DAPK3 reversed the tumor‐suppressive effects induced by YTHDF2 knockdown. Nevertheless, the specific molecular mechanisms underlying the effects of DAPK3 on tumor invasion and metastasis are not completely understood and require further investigation.
Increasing evidence has emphasized the role of m6A in chemotherapy resistance. 20 , 40 For instance, the METTL3‐EGFR axis enhances resistance to lenvatinib in hepatocellular carcinoma. 41 In ovarian cancer, Nicotinamide N‐methyltransferase (NNMT) mRNA is demethylated and upregulated by Fat mass and obesity‐associated protein (FTO), thereby increasing sensitivity to platinum. 42 Dysregulation of m6A also contributes to the development of gemcitabine resistance. 43 Moreover, the effect of DAPK3 on chemotherapy resistance has been well established in previous studies, which induces the loss of cell‐to‐cell adhesion, thereby conferring more sensitivity to chemotherapy. 26 , 27 Consistent with this evidence, we observed that YTHDF2 mediated resistance to gemcitabine in GBC cells through DAPK3. Notably, pathways and biological functions relevant to cell‐to‐cell adhesion and the activation of DAPK3 were also significantly enriched based on our GBC data analysis.
In summary, our study reveals the essential role of YTHDF2 in GBC. YTHDF2 increases DAPK3 mRNA degradation in an m6A‐dependent manner, which promotes GBC progression and reduces its response to gemcitabine. These findings highlight an m6A‐dependent mechanism of GBC progression and provide new insights into the development of effective therapeutic approaches.
AUTHOR CONTRIBUTIONS
Xuesong Bai, Jiemin Chen, and Xiaodong He designed this study. Xuesong Bai, Jiemin Chen, and Wenqin Zhang were responsible for conducting the experiments. Xuesong Bai, Jiemin Chen, and Shengnan Zhou performed data analysis and statistical analysis. Liangbo Dong, Shengnan Zhou, and Jianhao Huang were responsible for collecting clinical samples and data. Xuesong Bai, Jiemin Chen, and Xiaodong He drafted and revised the manuscript with input from all authors. All authors read and approved the final manuscript.
FUNDING INFORMATION
This work was supported by the CAMS Initiative for Innovative Medicine (Grant No. 2021‐I2M‐1‐022).
CONFLICT OF INTEREST STATEMENT
The author declares no conflict of interest.
ETHICS STATEMENT
Approval of the research protocol by an institutional review board: This project conformed to the guidelines of the Declaration of Helsinki and was approved by the ethics committee of Peking Union Medical College Hospital (JS‐1569).
Informed consent: All subjects in our research provided a written informed consent before surgery and were fully informed of the details of this study.
Registry and the registration no. of the study/trial: N/A.
Animal studies: All experiments involving animals were approved by the Animal Welfare and Ethics Committee of Peking Union Medical College Hospital (protocol number: XHDW‐2022‐110) in accordance with the guidelines of the NIH for the care and use of laboratory animals, 8th edition.
Supporting information
Figure S1
Figure S2
Figure S3
Figure S4
Figure S5
Appendix S1
Appendix S2
ACKNOWLEDGMENTS
We thank the instrumental and technical support from the Public Laboratory Platform and the Cell Biology Platform, National Major Science and Technology Infrastructure on Translational Medicine in Peking Union Medical College Hospital. Thanks to Professor Chengyu Jiang (Institute of Basic Medical Sciences and School of Basic Medicine, Peking Union Medical College and Chinese Academy of Medical Sciences) for her kind help.
Bai X, Chen J, Zhang W, et al. YTHDF2 promotes gallbladder cancer progression and gemcitabine resistance via m6A‐dependent DAPK3 degradation. Cancer Sci. 2023;114:4299‐4313. doi: 10.1111/cas.15953
Xuesong Bai, Jiemin Chen, and Wenqin Zhang contributed equally to this work and share first authorship.
DATA AVAILABILITY STATEMENT
The raw sequence data reported in this study have been deposited in the Genome Sequence Archive 44 of the National Genomics Data Center, 45 China National Center for Bioinformation/Beijing Institute of Genomics, Chinese Academy of Sciences (PRJCA016190) under the code: GSA‐Human: HRA004358, HRA004359, and are publicly accessible at https://ngdc.cncb.ac.cn/gsa. The custom R scripts used in this study are available upon request from the corresponding author.
REFERENCES
- 1. Roa JC, Garcia P, Kapoor VK, Maithel SK, Javle M, Koshiol J. Gallbladder cancer. Nat Rev Dis Primers. 2022;8(1):69. doi: 10.1038/s41572-022-00398-y [DOI] [PMC free article] [PubMed] [Google Scholar]
- 2. Sung H, Ferlay J, Siegel RL, et al. Global cancer statistics 2020: GLOBOCAN estimates of incidence and mortality worldwide for 36 cancers in 185 countries. CA Cancer J Clin. 2021;71(3):209‐249. doi: 10.3322/caac.21660 [DOI] [PubMed] [Google Scholar]
- 3. Wang X, Liu C, Chen J, et al. Single‐cell dissection of remodeled inflammatory ecosystem in primary and metastatic gallbladder carcinoma. Cell Discov. 2022;8(1):101. doi: 10.1038/s41421-022-00445-8 [DOI] [PMC free article] [PubMed] [Google Scholar]
- 4. Sharma A, Sharma KL, Gupta A, Yadav A, Kumar A. Gallbladder cancer epidemiology, pathogenesis and molecular genetics: recent update. World J Gastroenterol. 2017;23(22):3978‐3998. doi: 10.3748/wjg.v23.i22.3978 [DOI] [PMC free article] [PubMed] [Google Scholar]
- 5. Song X, Wang Z, Liang H, et al. Dioscin induces gallbladder cancer apoptosis by inhibiting ROS‐mediated PI3K/AKT signalling. Int J Biol Sci. 2017;13(6):782‐793. doi: 10.7150/ijbs.18732 [DOI] [PMC free article] [PubMed] [Google Scholar]
- 6. de Savornin Lohman E, de Bitter T, Verhoeven R, et al. Trends in treatment and survival of gallbladder cancer in the Netherlands; identifying gaps and opportunities from a nation‐wide cohort. Cancers (Basel). 2020;12(4):918. doi: 10.3390/cancers12040918 [DOI] [PMC free article] [PubMed] [Google Scholar]
- 7. Lau CSM, Zywot A, Mahendraraj K, Chamberlain RS. Gallbladder carcinoma in the United States: a population based clinical outcomes study involving 22,343 patients from the surveillance, epidemiology, and end result database (1973‐2013). HPB Surg. 2017;2017:1532835. doi: 10.1155/2017/1532835 [DOI] [PMC free article] [PubMed] [Google Scholar]
- 8. Zhang W, Sun Y, Jiang Z, Qu W, Gong C, Zhou A. Nab‐paclitaxel plus tegafur gimeracil oteracil potassium capsule (S‐1) as first‐line treatment for advanced biliary tract adenocarcinoma: a phase 2 clinical trial. Hepatobiliary Surg Nutr. 2023;12(1):37‐44. doi: 10.21037/hbsn-21-172 [DOI] [PMC free article] [PubMed] [Google Scholar]
- 9. Boccaletto P, Stefaniak F, Ray A, et al. MODOMICS: a database of RNA modification pathways. 2021 update. Nucleic Acids Res. 2022;50(D1):D231‐D235. doi: 10.1093/nar/gkab1083 [DOI] [PMC free article] [PubMed] [Google Scholar]
- 10. Ying X, Huang Y, Liu B, et al. Targeted m(6)A demethylation of ITGA6 mRNA by a multisite dCasRx‐m(6)A editor inhibits bladder cancer development. J Adv Res. 2023: S2090‐1232(23)00092‐9. doi: 10.1016/j.jare.2023.03.010 [DOI] [PubMed] [Google Scholar]
- 11. Yu BY, Shi LG, Jiang C, Wang GK, Liu J, Wu TY. Kinesin family member C 1 overexpression exerts tumor‐promoting properties in head and neck squamous cell carcinoma via the Rac1/Wnt/beta‐catenin pathway. Lab Invest. 2023;103:100134. doi: 10.1016/j.labinv.2023.100134 [DOI] [PubMed] [Google Scholar]
- 12. Pan J, Huang T, Deng Z, Zou C. Roles and therapeutic implications of m6A modification in cancer immunotherapy. Front Immunol. 2023;14:1132601. doi: 10.3389/fimmu.2023.1132601 [DOI] [PMC free article] [PubMed] [Google Scholar]
- 13. Sun Y, Shen W, Hu S, et al. METTL3 promotes chemoresistance in small cell lung cancer by inducing mitophagy. J Exp Clin Cancer Res. 2023;42(1):65. doi: 10.1186/s13046-023-02638-9 [DOI] [PMC free article] [PubMed] [Google Scholar]
- 14. Shi H, Wei J, He C. Where, when, and how: context‐dependent functions of RNA methylation writers, readers, and erasers. Mol Cell. 2019;74(4):640‐650. doi: 10.1016/j.molcel.2019.04.025 [DOI] [PMC free article] [PubMed] [Google Scholar]
- 15. He L, Li H, Wu A, Peng Y, Shu G, Yin G. Functions of N6‐methyladenosine and its role in cancer. Mol Cancer. 2019;18(1):176. doi: 10.1186/s12943-019-1109-9 [DOI] [PMC free article] [PubMed] [Google Scholar]
- 16. Chen X, Zhou X, Wang X. m(6)A binding protein YTHDF2 in cancer. Exp Hematol Oncol. 2022;11(1):21. doi: 10.1186/s40164-022-00269-y [DOI] [PMC free article] [PubMed] [Google Scholar]
- 17. Du H, Zhao Y, He J, et al. YTHDF2 destabilizes m(6)A‐containing RNA through direct recruitment of the CCR4‐NOT deadenylase complex. Nat Commun. 2016;7:12626. doi: 10.1038/ncomms12626 [DOI] [PMC free article] [PubMed] [Google Scholar]
- 18. Fang Y, Wu X, Gu Y, et al. LINC00659 cooperated with ALKBH5 to accelerate gastric cancer progression by stabilising JAK1 mRNA in an m(6) A‐YTHDF2‐dependent manner. Clin Transl Med. 2023;13(3):e1205. doi: 10.1002/ctm2.1205 [DOI] [PMC free article] [PubMed] [Google Scholar]
- 19. Li J, Xie H, Ying Y, et al. YTHDF2 mediates the mRNA degradation of the tumor suppressors to induce AKT phosphorylation in N6‐methyladenosine‐dependent way in prostate cancer. Mol Cancer. 2020;19(1):152. doi: 10.1186/s12943-020-01267-6 [DOI] [PMC free article] [PubMed] [Google Scholar]
- 20. Huang CS, Zhu YQ, Xu QC, et al. YTHDF2 promotes intrahepatic cholangiocarcinoma progression and desensitises cisplatin treatment by increasing CDKN1B mRNA degradation. Clin Transl Med. 2022;12(6):e848. doi: 10.1002/ctm2.848 [DOI] [PMC free article] [PubMed] [Google Scholar]
- 21. Zhang L, Li Y, Zhou L, et al. The m6A reader YTHDF2 promotes bladder cancer progression by suppressing RIG‐I‐mediated immune response. Cancer Res. 2023;83:1834‐1850. doi: 10.1158/0008-5472.CAN-22-2485 [DOI] [PMC free article] [PubMed] [Google Scholar]
- 22. Wang JY, Lu AQ. The biological function of m6A reader YTHDF2 and its role in human disease. Cancer Cell Int. 2021;21(1):109. doi: 10.1186/s12935-021-01807-0 [DOI] [PMC free article] [PubMed] [Google Scholar]
- 23. Liu T, Wei Q, Jin J, et al. The m6A reader YTHDF1 promotes ovarian cancer progression via augmenting EIF3C translation. Nucleic Acids Res. 2020;48(7):3816‐3831. doi: 10.1093/nar/gkaa048 [DOI] [PMC free article] [PubMed] [Google Scholar]
- 24. Tang W, Xu N, Zhou J, et al. ALKBH5 promotes PD‐L1‐mediated immune escape through m6A modification of ZDHHC3 in glioma. Cell Death Discov. 2022;8(1):497. doi: 10.1038/s41420-022-01286-w [DOI] [PMC free article] [PubMed] [Google Scholar]
- 25. Han Z, Yang B, Wang Q, Hu Y, Wu Y, Tian Z. Comprehensive analysis of the transcriptome‐wide m(6)A methylome in invasive malignant pleomorphic adenoma. Cancer Cell Int. 2021;21(1):142. doi: 10.1186/s12935-021-01839-6 [DOI] [PMC free article] [PubMed] [Google Scholar]
- 26. Brognard J, Zhang YW, Puto LA, Hunter T. Cancer‐associated loss‐of‐function mutations implicate DAPK3 as a tumor‐suppressing kinase. Cancer Res. 2011;71(8):3152‐3161. doi: 10.1158/0008-5472.CAN-10-3543 [DOI] [PMC free article] [PubMed] [Google Scholar]
- 27. Westhoff MA, Zhou S, Bachem MG, Debatin KM, Fulda S. Identification of a novel switch in the dominant forms of cell adhesion‐mediated drug resistance in glioblastoma cells. Oncogene. 2008;27(39):5169‐5181. doi: 10.1038/onc.2008.148 [DOI] [PubMed] [Google Scholar]
- 28. Liao J, Wei Y, Liang J, et al. Insight into the structure, physiological function, and role in cancer of m6A readers‐YTH domain‐containing proteins. Cell Death Discov. 2022;8(1):137. doi: 10.1038/s41420-022-00947-0 [DOI] [PMC free article] [PubMed] [Google Scholar]
- 29. Wang X, Zhao BS, Roundtree IA, et al. N(6)‐methyladenosine modulates messenger RNA translation efficiency. Cell. 2015;161(6):1388‐1399. doi: 10.1016/j.cell.2015.05.014 [DOI] [PMC free article] [PubMed] [Google Scholar]
- 30. Yang S, Wei J, Cui YH, et al. m(6)A mRNA demethylase FTO regulates melanoma tumorigenicity and response to anti‐PD‐1 blockade. Nat Commun. 2019;10(1):2782. doi: 10.1038/s41467-019-10669-0 [DOI] [PMC free article] [PubMed] [Google Scholar]
- 31. Chen S, Zhou L, Wang Y. ALKBH5‐mediated m(6)A demethylation of lncRNA PVT1 plays an oncogenic role in osteosarcoma. Cancer Cell Int. 2020;20:34. doi: 10.1186/s12935-020-1105-6 [DOI] [PMC free article] [PubMed] [Google Scholar]
- 32. Yang X, Chen T, Hu J, Wang J, Yang D. HKI‐272 contributes to gemcitabine‐mediated anti‐proliferative and anti‐metastatic effects through EGFR suppression in gallbladder cancer. Mol Ther Oncolytics. 2022;27:126‐140. doi: 10.1016/j.omto.2022.10.004 [DOI] [PMC free article] [PubMed] [Google Scholar]
- 33. Li GM, Li L, Li MQ, et al. DAPK3 inhibits gastric cancer progression via activation of ULK1‐dependent autophagy. Cell Death Differ. 2021;28(3):952‐967. doi: 10.1038/s41418-020-00627-5 [DOI] [PMC free article] [PubMed] [Google Scholar]
- 34. Tan XL, Moyer AM, Fridley BL, et al. Genetic variation predicting cisplatin cytotoxicity associated with overall survival in lung cancer patients receiving platinum‐based chemotherapy. Clin Cancer Res. 2011;17(17):5801‐5811. doi: 10.1158/1078-0432.CCR-11-1133 [DOI] [PMC free article] [PubMed] [Google Scholar]
- 35. Bi J, Lau SH, Hu L, et al. Downregulation of ZIP kinase is associated with tumor invasion, metastasis and poor prognosis in gastric cancer. Int J Cancer. 2009;124(7):1587‐1593. doi: 10.1002/ijc.24164 [DOI] [PubMed] [Google Scholar]
- 36. Xu Y, Chen Y, Yao Y, et al. VIRMA contributes to non‐small cell lung cancer progression via N(6)‐methyladenosine‐dependent DAPK3 post‐transcriptional modification. Cancer Lett. 2021;522:142‐154. doi: 10.1016/j.canlet.2021.08.027 [DOI] [PubMed] [Google Scholar]
- 37. Cai Z, Cao R, Zhang K, et al. Oncogenic miR‐17/20a forms a positive feed‐forward loop with the p53 kinase DAPK3 to promote tumorigenesis. J Biol Chem. 2015;290(32):19967‐19975. doi: 10.1074/jbc.M115.661504 [DOI] [PMC free article] [PubMed] [Google Scholar]
- 38. Das TP, Suman S, Papu John AM, et al. Activation of AKT negatively regulates the pro‐apoptotic function of death‐associated protein kinase 3 (DAPK3) in prostate cancer. Cancer Lett. 2016;377(2):134‐139. doi: 10.1016/j.canlet.2016.04.028 [DOI] [PMC free article] [PubMed] [Google Scholar]
- 39. Takahashi M, Lio CJ, Campeau A, et al. The tumor suppressor kinase DAPK3 drives tumor‐intrinsic immunity through the STING‐IFN‐beta pathway. Nat Immunol. 2021;22(4):485‐496. doi: 10.1038/s41590-021-00896-3 [DOI] [PMC free article] [PubMed] [Google Scholar]
- 40. Lin C, Li T, Wang Y, et al. METTL3 enhances pancreatic ductal adenocarcinoma progression and gemcitabine resistance through modifying DDX23 mRNA N6 adenosine methylation. Cell Death Dis. 2023;14(3):221. doi: 10.1038/s41419-023-05715-1 [DOI] [PMC free article] [PubMed] [Google Scholar]
- 41. Wang L, Yang Q, Zhou Q, et al. METTL3‐m(6)A‐EGFR‐axis drives lenvatinib resistance in hepatocellular carcinoma. Cancer Lett. 2023;559:216122. doi: 10.1016/j.canlet.2023.216122 [DOI] [PubMed] [Google Scholar]
- 42. Huang H, Zhao G, Cardenas H, Valdivia AF, Wang Y, Matei D. N6‐methyladenosine RNA modifications regulate the response to platinum through nicotinamide N‐methyltransferase. Mol Cancer Ther. 2023;22(3):393‐405. doi: 10.1158/1535-7163.MCT-22-0278 [DOI] [PubMed] [Google Scholar]
- 43. Lin C, Wang Y, Dong Y, et al. N6‐methyladenosine‐mediated SH3BP5‐AS1 upregulation promotes GEM chemoresistance in pancreatic cancer by activating the Wnt signaling pathway. Biol Direct. 2022;17(1):33. doi: 10.1186/s13062-022-00347-5 [DOI] [PMC free article] [PubMed] [Google Scholar]
- 44. Chen T, Chen X, Zhang S, et al. The genome sequence archive family: toward explosive data growth and diverse data types. Genomics Proteomics Bioinformatics. 2021;19(4):578‐583. doi: 10.1016/j.gpb.2021.08.001 [DOI] [PMC free article] [PubMed] [Google Scholar]
- 45. CNCB‐NGDC Members and Partners . Database resources of the National Genomics Data Center, China National Center for bioinformation in 2022. Nucleic Acids Res. 2022;50(D1):D27‐D38. doi: 10.1093/nar/gkab951 [DOI] [PMC free article] [PubMed] [Google Scholar]
Associated Data
This section collects any data citations, data availability statements, or supplementary materials included in this article.
Supplementary Materials
Figure S1
Figure S2
Figure S3
Figure S4
Figure S5
Appendix S1
Appendix S2
Data Availability Statement
The raw sequence data reported in this study have been deposited in the Genome Sequence Archive 44 of the National Genomics Data Center, 45 China National Center for Bioinformation/Beijing Institute of Genomics, Chinese Academy of Sciences (PRJCA016190) under the code: GSA‐Human: HRA004358, HRA004359, and are publicly accessible at https://ngdc.cncb.ac.cn/gsa. The custom R scripts used in this study are available upon request from the corresponding author.