

Abstract
Peritoneal dialysis (PD) use has increased in the United States since 2009, but how this has affected disparities in PD use is unclear. We used data from the United States Renal Data System to identify a cohort of incident dialysis patients from 2009 to 2019. We used logistic regression models to examine how odds of PD use changed by demographic characteristics. The incident PD population increased by 203% from 2009 to 2019, and the odds of PD use increased in every subgroup. PD use increased more among older people because the odds for those aged 75 years or older increased 15% more per 5-year period compared with individuals aged 18–44 years (odds ratio [OR] 1.68, 95% confidence interval [CI], 1.64 to 1.73 versus OR 1.46, 95% CI, 1.42 to 1.50). The odds of PD use increased 5% more per 5-year period among Hispanic people compared with White people (OR 1.58, 95% CI, 1.53 to 1.63 versus OR 1.51, 95% CI, 1.48 to 1.53). There was no difference in odds of PD initiation among people who were Black, Asian, or of another race. The odds of PD use increased 5% more for people living in urban areas compared with people living in nonurban areas (5-year OR 1.54, 95% CI, 1.52 to 1.56 versus 5-year OR 1.46, 95% CI, 1.42 to 1.50). The odds of PD use increased 7% more for people living in socioeconomically advantaged areas compared with people living in more deprived areas (5-year OR 1.60, 95% CI, 1.56 to 1.63 for neighborhoods with lowest Social Deprivation Index versus 5-year OR 1.50, 95% CI, 1.48 to 1.53 in the most deprived areas). Expansion of PD use led to a reduction in disparities for older people and for Hispanic people. Although PD use increased across all strata of socioeconomic deprivation, the gap in PD use between people living in the least deprived areas and those living in the most deprived areas widened.
Keywords: health equity; diversity, inclusion, kidney failure; USRDS (US Renal Data System)
Background
Many patients with kidney failure who undergo long-term dialysis may benefit from home dialysis, which can offer a superior quality of life and comparable clinical outcomes to hemodialysis (HD).1–4 Despite this, before 2009, the peritoneal dialysis (PD) population in the United States had been declining for over a decade, even as the total population with kidney failure grew.16 At that time, the PD population was younger and more likely to be White than the overall kidney failure population.16–7 People living in rural areas and socioeconomically advantaged areas were more likely to initiate PD than those in urban or socioeconomically distressed environments.11–13 Patients with diabetes were less likely to start on PD than those without diabetes and were thought to have significantly worse outcomes on PD than HD.8,5,14–7 Furthermore, PD use has historically been more common in the Midwest and West and less common in the South and Northeast.8,10
Since 2009, the proportion of patients with incident kidney failure initiating PD has more than doubled,1 but the extent to which known disparities in PD use have changed over this time is not clear. Several studies examined how implementation of the Medicare Prospective Payment System affected trends in home dialysis use from 2006 to 2013,16–19 with conflicting results as to whether racial and ethnic disparities in home dialysis narrowed or widened. Subsequent studies have demonstrated that rural people remain more likely to initiate PD20 and that younger adults continue to be more likely to use PD than older adults.21 Many studies since 2009 have pointed to improved PD outcomes among patients with diabetes, but it is unclear how this has affected PD use in this population.22–25
We aimed to examine how PD initiation changed among different demographic groups during the period of PD expansion from 2009 to 2019. We hypothesized that these disparities would not change significantly because of near-equal expansion in PD use among all demographic groups (Figure 1).
Figure 1.
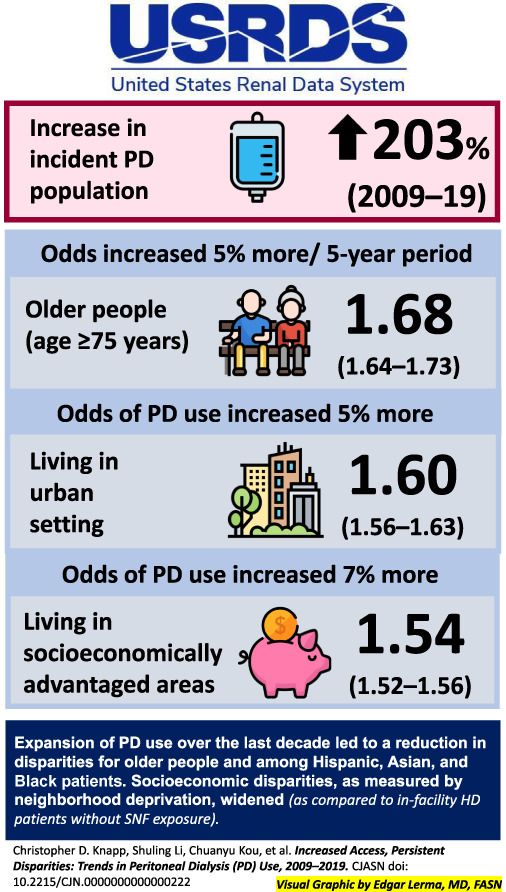
Overview of the study. HD, hemodialysis; PD, peritoneal dialysis; SNF, skilled nursing facility.
Methods
Data Sources
We used data from the United States Renal Data System to ascertain patients' demographic characteristics and their dialysis modality at end-stage renal disease first service date. Thus, patients who had previously received a kidney transplant were not included.
Patient Population
We conducted a longitudinal analysis of all adults (age 18 years or older) initiating dialysis for kidney failure in the United States from January 1, 2009, to December 31, 2019, and residing in the 50 states or the District of Columbia. We chose 2009 as the beginning date because the PD population began to increase in 2009 after its nadir in 2006–2008.8 We chose to end the study in 2019 because of significant differences in home dialysis uptake in 2020 that were likely the result of the coronavirus disease 2019 pandemic.26
Patients with missing Social Deprivation Index (SDI), body mass index, census region, or urban/nonurban residence data were excluded from the analysis (12.9% of the potential study population, with missing or invalid body mass index accounting for >90% of these exclusions). The Institutional Review Board of Hennepin Healthcare Research Institute reviewed this study and determined that it was exempt.
Definitions of Predictors and Covariates
We used the SDI, a composite score that incorporates information about socioeconomic characteristics of neighborhoods at the ZIP code tabulation area level, to approximate patients' socioeconomic status.27 The SDI scores each ZIP code tabulation area from 1 (least deprived) to 100 (most deprived) on the basis of seven measures of neighborhood deprivation.27 SDI scores were split into three nonequal groups: 1–33, 34–66, and 67–100.1 Patients' residence in an urban or nonurban area was determined by the Rural Urban Commuting Area scores.28 We combined micropolitan, small town, and isolated rural into a single nonurban category. Age was defined at dialysis initiation and categorized into four groups: 18–44, 45–64, 65–74, and 75 years or older. For our analysis of race and ethnicity, all people with Hispanic ethnicity were exclusively counted as Hispanic. Other groups include non-Hispanic people who are Asian, Black, and White. Owing to small sample size of other racial groups, we created an other category that included non-Hispanic people who were Native American, Native Hawaiian or Pacific Islander, multiracial, or of another or unknown race. We studied diabetes as a predictor of PD use. Regions of the United States were defined using the US Census boundaries.28 In addition to these predictors, our adjusted model included sex, obesity, heart failure, and impaired physical function (inability to transfer or ambulate on the Medical Evidence Form) as covariates.
Statistical Analyses
We described unadjusted trends in the percentage of PD use over the study period for the overall cohort and stratified by the predictors of interest. We used logistic regression models to estimate secular trends in PD use at dialysis initiation over the study period. Visual inspection of log odds of PD use versus calendar year in the total study population over the study period revealed a general linear trend. We therefore modeled calendar year as a continuous variable to estimate the odds ratios (ORs) of PD use per 5 calendar years over the study period among the incident dialysis population overall and in each subgroup. In unadjusted models, we included year as the only independent variable when modeling the overall trend and included year, the predictor of interest, and a term for the interaction between year and the predictor of interest when modeling trends for each subgroup of the predictor of interest. For each predictor, we performed an adjusted analysis that included all other predictors and covariates listed in Table 1. We report results with 95% confidence intervals (CIs) for the overall cohort and each subgroup, and we tested for interactions to determine whether changes differed across subgroups. We used SAS software, version 9.4 (SAS Institute Inc., Cary, NC) for all analyses.
Table 1.
Demographic characteristics among incident dialysis patients, 2009–2019
| Characteristic | 2009 (N=93,190) | 2014 (N=103,011) | 2019 (N=118,566) | 2009–2019 Combined (N=1,144,180) |
|---|---|---|---|---|
| Age group, yr, n (%) | ||||
| 18–44 | 11,256 (12) | 12,050 (12) | 13,563 (11) | 132,458 (12) |
| 45–64 | 35,305 (38) | 39,701 (39) | 43,946 (37) | 435,857 (38) |
| 65–74 | 22,126 (24) | 26,639 (26) | 32,544 (27) | 295,019 (26) |
| 75+ | 24,503 (26) | 24,621 (24) | 28,513 (24) | 280,846 (25) |
| Diabetes, n (%) | 50,714 (54) | 59,440 (58) | 72,962 (62) | 665,033 (58) |
| Race/ethnicity, n (%) | ||||
| Asian | 3273 (4) | 4008 (4) | 5562 (5) | 45,825 (4) |
| Black | 25,846 (28) | 27,655 (27) | 30,740 (26) | 303,500 (27) |
| Hispanic | 12,334 (13) | 14,730 (14) | 18,898 (16) | 166,388 (15) |
| Othersa | 1917 (2) | 2205 (2) | 2744 (2) | 24,834 (2) |
| White | 49,820 (54) | 54,413 (53) | 60,622 (51) | 603,633 (53) |
| Rural/urban status, n (%) | ||||
| Urban | 77,753 (83) | 86,707 (84) | 99,875 (84) | 961,205 (84) |
| Social Deprivation Index, n (%) | ||||
| 1–33 | 21,468 (23) | 23,801 (23) | 27,202 (23) | 264,017 (23) |
| 34–66 | 28,884 (31) | 31,695 (31) | 36,952 (31) | 352,931 (31) |
| 67–100 | 42,838 (46) | 47,515 (46) | 54,412 (46) | 527,232 (46) |
| Female, n (%) | 40,732 (44) | 43,676 (42) | 49,574 (42) | 486,861 (43) |
| Obese, n (%) | 35,849 (39) | 41,609 (40) | 48,767 (41) | 463,113 (41) |
| US region, n (%) | ||||
| Northeast | 15,576 (17) | 17,090 (17) | 18,954 (16) | 188,129 (16) |
| Midwest | 20,042 (22) | 21,073 (21) | 23,034 (19) | 233,951 (20) |
| South | 37,794 (41) | 42,892 (42) | 50,576 (43) | 476,566 (42) |
| West | 19,778 (21) | 21,956 (21) | 26,002 (22) | 245,534 (22) |
| Heart failure, n (%) | 30,247 (33) | 30,063 (29) | 34,706 (29) | 341,932 (30) |
| Impaired physical function, n (%) | 13,451 (14) | 14,807 (14) | 18,722 (16) | 173,814 (15) |
| Initial dialysis modality, n (%) | ||||
| Peritoneal dialysis | 4028 (4) | 7988 (8) | 12,188 (10) | 86,531 (8) |
Other race/ethnicity includes non-Hispanic people who are Native American, Native Hawaiian or Pacific Islander, multiracial, or of another or unknown race/ethnicity.
Results
Study Population
The study population included 1,144,180 incident dialysis patients (Table 1). The number of incident PD patients each year grew from 4028 in 2009 to 12,188 in 2019, an increase of 203%.
Overall Trends
The percentage of PD use among all incident dialysis patients increased from 4.3% in 2009 to 10.3% in 2019, and we observed an increase in the percentage of PD use in every subgroup of interest (Figure 2). The results from adjusted and unadjusted models were similar (Table 2), so we report adjusted results. In the overall incident dialysis population, the odds of PD use increased by a factor of 1.53 per 5 years (95% CI, 1.51 to 1.54). The odds of PD use increased in every group we studied (Figure 3).
Figure 2.
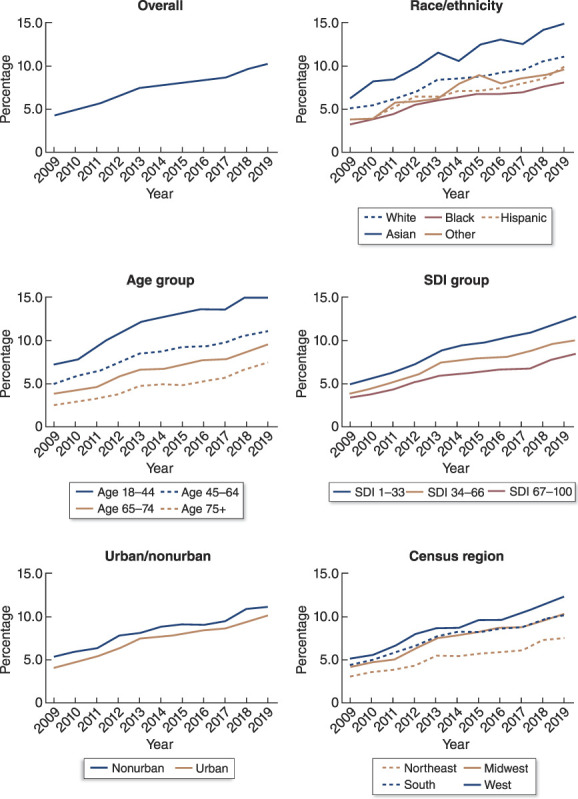
Unadjusted trend in the percentage of PD use among incident dialysis patients from 2009 to 2019, overall and by demographic group. SDI, Social Deprivation Index.
Table 2.
Odds ratio of peritoneal dialysis utilization per 5-year increase during the study period, overall and by demographic groups of interest
| Characteristic | Demographic | Unadjusted OR (95% CI) | P Value for Interaction | Adjusted OR (95% CI) | P Value for Interaction |
|---|---|---|---|---|---|
| Overall | Overall | 1.51 (1.50 to 1.53) | N/A | 1.53 (1.51 to 1.54) | N/A |
| Age, yr | 18–44 | 1.46 (1.42 to 1.50) | <0.001 | 1.46 (1.43 to 1.50) | <0.001 |
| 45–64 | 1.46 (1.44 to 1.49) | 1.48 (1.45 to 1.51) | |||
| 65–74 | 1.55 (1.52 to 1.59) | 1.56 (1.52 to 1.59) | |||
| 75+ | 1.68 (1.64 to 1.73) | 1.68 (1.63 to 1.73) | |||
| Race/ethnicity | Asian | 1.48 (1.41 to 1.55) | 0.09 | 1.51 (1.44 to 1.59) | 0.04 |
| Black | 1.50 (1.46 to 1.53) | 1.54 (1.50 to 1.58) | |||
| Hispanic | 1.56 (1.52 to 1.61) | 1.58 (1.53 to 1.63) | |||
| Others | 1.58 (1.46 to 1.71) | 1.60 (1.47 to 1.73) | |||
| White | 1.50 (1.48 to 1.52) | 1.51 (1.48 to 1.53) | |||
| Rural/urban | Nonurban | 1.44 (1.40 to 1.48) | <0.001 | 1.46 (1.42 to 1.50) | 0.001 |
| Urban | 1.53 (1.51 to 1.55) | 1.54 (1.52 to 1.56) | |||
| Social Deprivation Index | SDI 1–33 | 1.58 (1.55 to 1.61) | <0.001 | 1.60 (1.56 to 1.63) | <0.001 |
| SDI 34–66 | 1.49 (1.46 to 1.51) | 1.49 (1.47 to 1.52) | |||
| SDI 67–100 | 1.50 (1.47 to 1.52) | 1.50 (1.48 to 1.53) | |||
| Diabetes status | Diabetic | 1.52 (1.49 to 1.54) | 0.17 | 1.52 (1.49 to 1.54) | 0.30 |
| Nondiabetic | 1.54 (1.52 to 1.57) | 1.54 (1.51 to 1.56) | |||
| Region | Northeast | 1.53 (1.48 to 1.58) | <0.001 | 1.54 (1.49 to 1.59) | <0.001 |
| Midwest | 1.57 (1.53 to 1.61) | 1.58 (1.54 to 1.62) | |||
| South | 1.47 (1.44 to 1.49) | 1.49 (1.46 to 1.51) | |||
| West | 1.53 (1.50 to 1.57) | 1.54 (1.51 to 1.58) |
OR, odds ratio; CI, confidence interval; SDI, Social Deprivation Index.
Figure 3.
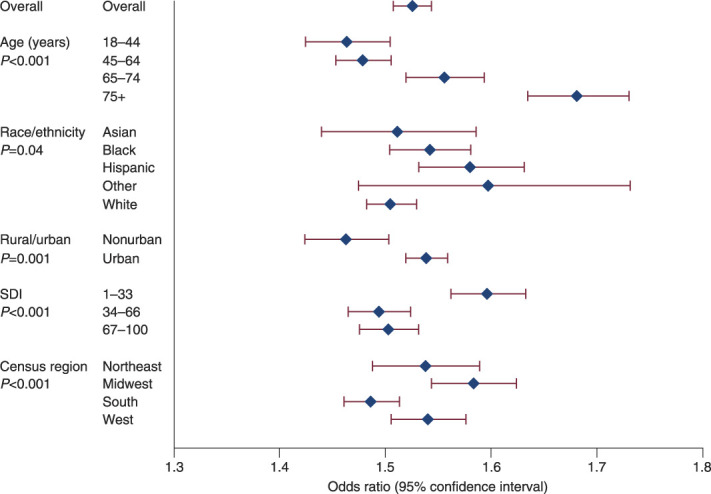
Adjusted odds ratios for PD use per 5 years in the overall population and in key subgroups.
Comparison of Trends by Demographic Group
There was a greater increase in odds of PD use among older incident dialysis patients compared with younger patients (P value for trend across age groups <0.001) (Figure 3, Table 2). The oldest age group (75 years or older) had 15%, 14%, and 8% greater increase in odds of PD use per 5 years than did those aged 18–44, 45–64, and 65–74 years, respectively (OR 1.68, 95% CI, 1.64 to 1.73 for ≥75 years versus OR 1.46, 95% CI, 1.43 to 1.50 for 18–44 years, OR 1.48, 95% CI, 1.45 to 1.51 for 45–64, OR 1.56, 95% CI, 1.52 to 1.59 for 65–74).
The odds of PD use among Hispanic people increased 5% more per 5 years than those of White people (OR 1.58, 95% CI, 1.53 to 1.63 for Hispanic people versus OR 1.51, 95% CI, 1.48 to 1.53 for White people). Point estimates of changes in odds for Asian, Black, and people of other races did not differ significantly and were similar to that of the overall population (P value 0.04 for trend across race/ethnicity groups).
For incident dialysis patients living in socioeconomically advantaged neighborhoods, the odds of PD use grew 7% more per 5 years than those living in less advantaged areas (OR 1.60, 95% CI, 1.56 to 1.63 for SDI 1–33, OR 1.49, 95% CI, 1.47 to 1.52 for SDI 34–66, and OR 1.50, 95% CI, 1.48 to 1.53 for SDI 67–100, P value for trend < 0.001). The odds of an urban-dwelling person initiating PD increased 5% more per 5 years than did the odds for a nonurban person (OR 1.54, 95% CI, 1.52 to 1.56 for urban versus OR 1.46, 95% CI, 1.42 to 1.50 for nonurban, P value = 0.001). Compared with people living in the South, the odds of people starting dialysis with PD in the Midwest rose 6% more per 5 years (OR 1.58, 95% CI, 1.54 to 1.62 versus OR 1.49, 95% CI, 1.46 to 1.51) while the Northeast and West had similar ORs (P value for trend < 0.001).
The odds of PD use increased similarly for people with and without diabetes.
Discussion
The aim of this study was to examine how disparities in PD initiation changed as population-wide use of PD increased. We found that some disparities improved while others worsened. The use of PD increased relatively more in older people, Hispanic people, and urban-dwelling people, lessening disparities in PD use across these groups. However, dialysis patients who started PD were already disproportionately likely to come from socioeconomically advantaged areas at the beginning of the study period, and this gap worsened over time. Moreover, several known disparities in PD use, such as the higher use of PD among White than Black people, did not change over the study period.
The US Government has been working to increase the use of PD for over a decade. These efforts began with the creation of the ESRD Medicare Prospective Payment System, which was implemented in January 2011 and continued with the Advancing American Kidney Health Executive Order issued in 2019. Although the 2011 policy may have been primarily intended to reduce costs,30–32 the 2019 order emphasized the potential benefits of home dialysis, including increased convenience and closer alignment with patient values, and suggested that home dialysis patients experience better survival relative to in-center HD patients.33 The order, therefore, included offering home dialysis to a wider array of patients as an aspect of its goal of providing person-centered treatment options for those with kidney failure.33
Our study shows that there has been progress toward this goal in some areas. Particularly, we found that the odds of older patients initiating PD increased more relative to younger patients and that the growth of PD did not lag among patients with diabetes relative to growth in patients without diabetes. These findings are encouraging because they may indicate a loosening of clinical selection criteria for offering home dialysis in which older individuals and those with diabetes had been considered worse candidates for PD.5 However, a sizable age gap persists, and patients with diabetes remain much less likely to initiate PD than those without diabetes. In order for PD use to continue to grow among older and more medically complex patients, different strategies to promote home dialysis should be considered, such as increasing support or reimbursement of care partners who help patients to perform PD.34
There has been less progress in reducing disparities in access to home dialysis among disadvantaged race/ethnicity groups. White and Asian people have historically had higher odds of PD use than Black people, Hispanic people, and people of other races. However, only Hispanic patients had a significant improvement in their odds of use of PD compared with White patients. Because Black people did not experience significant improvement relative to White people during a period when the PD population grew, there was a wider gap between the percentages of White and Black incident dialysis patients starting PD in 2019 than there was in 2009 (Figure 2). This gap could potentially be ameliorated by increasing PD use among providers in the South because we found that the South, which contains a majority of the Black population in the United States, continues to lag other regions in use of PD.
Furthermore, the odds of an urban-dwelling dialysis patient starting PD increased more rapidly than the odds of a nonurban-dwelling patient, although nonurban patients with kidney failure continued to use PD at higher rates than the overall population (Figure 2). Previous evidence has shown that rural patients benefit from not traveling to a potentially remote dialysis unit,11,35–37 so additional studies are needed to determine whether this urbanizing trend is simply a result of the increased availability of PD services in cities38 or is associated with a lack of PD access in rural areas.
Unfortunately, in addition to slow progress on some disparities, others persisted or worsened. It is striking that the preexisting socioeconomic gap in access to home dialysis got wider over the past decade, as estimated using the SDI. It is not clear whether poverty itself is the main reason for this trend or whether other markers of socioeconomic distress captured by the SDI, such as the percentage of people living in overcrowded or rental housing, are equally or more important, especially considering the space demands that can be imposed by PD.
Our study has limitations. We did not examine outcomes beyond initial modality selection. Further analyses of outcomes such as peritonitis or technique survival in the PD population as a whole and in key subpopulations could shed light on how to target further efforts to expand PD.
Overall, our study highlights that use of PD has grown among all types of people since 2009 but that gaps persist, especially those rooted in socioeconomic deprivation. Home dialysis has become more accessible than ever before in the United States, but people living in privileged areas were disproportionately likely to benefit from this movement over the past decade. In the decades to come, our efforts should focus on empowering patients to live and dialyze within their home communities, regardless of where those communities happen to be.
Acknowledgments
The data reported here have been supplied by the United States Renal Data System (USRDS). The interpretation and reporting of these data are the responsibility of the author(s) and in no way should be seen as an official policy or interpretation of the US Government.
Disclosures
D.T. Gilbertson reports employment with Chronic Disease Research Group; consultancy for Amgen; and research funding from Amgen, DaVita, GSK, HRSA, Merck, and NIH. A. Hart reports employment with Hennepin Healthcare and research funding from CSL Behring. K.L. Johansen reports employment with Hennepin Healthcare; consultancy for Akebia, GlaxoSmithKline, and Vifor; advisory or leadership role for GSK; and role as an Associate Editor of JASN. C.D. Knapp reports employment with Hennepin Healthcare and other interests or relationships as a member of American College of Physicians, ASN, and NKF. C.D. Knapp's spouse reports advisory or leadership role for Minnesota Psychiatric Society (unpaid) and serving as a member of American Psychiatric Association and American Academy of Psychiatry and the Law. C. Kou reports employment with Chronic Disease Research Group. S. Li reports employment with Hennepin Healthcare Research Institute and research funding from Amgen, Inc. E.D. Weinhandl reports employment with Satellite Healthcare, research funding from Dialyze Direct and Outset Medical, and advisory or leadership role for the Board of Directors of Medical Education Institute. J.B. Wetmore reports employment with Hennepin Healthcare; consultancy for BMS-Pfizer Alliance; research funding from Amgen, BMS/Pfizer, AstraZeneca, Genentech, GlaxoSmithKline, Merck, NIH (NIDDK and NHLBI), and OPKO Health; honoraria from BMS-Pfizer Alliance (for advisory board activities), Reata, and Vifor; and honoraria for educational activities (CME-eligible) for NephSAP (ASN) and Healio.
Funding
This work was supported by National Institute of Diabetes and Digestive and Kidney Diseases from 75N94019C00006 (C.D. Knapp).
Author Contributions
Conceptualization: David T. Gilbertson, Kirsten L. Johansen, Christopher D. Knapp, Eric D. Weinhandl, James B. Wetmore.
Data curation: Chuanyu Kou, Shuling Li.
Formal analysis: Kirsten L. Johansen, Christopher D. Knapp, Chuanyu Kou, Shuling Li.
Funding acquisition: David T. Gilbertson, Kirsten L. Johansen, James B. Wetmore.
Investigation: David T. Gilbertson, Allyson Hart, Kirsten L. Johansen, Christopher D. Knapp, Eric D. Weinhandl, James B. Wetmore.
Methodology: David T. Gilbertson, Shuling Li.
Supervision: Kirsten L. Johansen.
Writing – original draft: Christopher D. Knapp.
Writing – review & editing: David T. Gilbertson, Allyson Hart, Kirsten L. Johansen, Christopher D. Knapp, Chuanyu Kou, Eric D. Weinhandl, James B. Wetmore.
References
- 1.United States Renal Data System. 2022 USRDS Annual Data Report: Epidemiology of Kidney Disease in the United States. National Institutes of Health, National Institute of Diabetes and Digestive and Kidney Diseases; 2022. [Google Scholar]
- 2.Iyasere OU Brown EA Johansson L, et al. Quality of life and physical function in older patients on dialysis: a comparison of assisted peritoneal dialysis with hemodialysis. Clin J Am Soc Nephrol. 2016;11(3):423–430. doi: 10.2215/CJN.01050115. [DOI] [PMC free article] [PubMed] [Google Scholar]
- 3.Queeley GL, Campbell ES. Comparing treatment modalities for end-stage renal disease: a meta-analysis. Am Health Drug Benefits. 2018;11(3):118–127. PMID: 29910844. [PMC free article] [PubMed] [Google Scholar]
- 4.Jaar BG Coresh J Plantinga LC, et al. Comparing the risk for death with peritoneal dialysis and hemodialysis in a national cohort of patients with chronic kidney disease. Ann Intern Med. 2005;14(11):7. doi: 10.1016/j.accreview.2005.10.014 [DOI] [PubMed] [Google Scholar]
- 5.United States Renal Data System. 2010 USRDS Annual Data Report: Atlas of Chronic Kidney Disease and End-Stage Renal Disease in the United States. National Institute of Diabetes and Digestive and Kidney Diseases; 2010. [Google Scholar]
- 6.Mehrotra R, Story K, Guest S, Fedunyszyn M. Neighborhood location, rurality, geography, and outcomes of peritoneal dialysis patients in the United States. Perit Dial Int. 2012. May-Jun; 32(3):322–331. doi: 10.1016/j.accreview.2005.10.014 [DOI] [PMC free article] [PubMed] [Google Scholar]
- 7.Shen JI Chen L Vangala S, et al. Socioeconomic factors and racial and ethnic differences in the initiation of home dialysis. Kidney Med. 2020;2(2):105–115. doi: 10.1016/j.xkme.2019.11.006 [DOI] [PMC free article] [PubMed] [Google Scholar]
- 8.Maripuri S, Arbogast P, Ikizler TA, Cavanaugh KL. Rural and micropolitan residence and mortality in patients on dialysis. Clin J Am Soc Nephrol. 2012;7(7):1121–1129. doi: 10.2215/CJN.10831011 [DOI] [PMC free article] [PubMed] [Google Scholar]
- 9.Stack AG. Determinants of modality selection among incident US dialysis patients: results from a national study. J Am Soc Nephrol. 2002;13(5):1279–1287. doi: 10.1681/ASN.v1351279 [DOI] [PubMed] [Google Scholar]
- 10.O’Hare AM, Johansen KL, Rodriguez RA. Dialysis and kidney transplantation among patients living in rural areas of the United States. Kidney Int. 2006;69(2):343–349. doi: 10.1038/sj.ki.5000044 [DOI] [PubMed] [Google Scholar]
- 11.Wang V Maciejewski ML Coffman CJ, et al. Impacts of geographic distance on peritoneal dialysis utilization: refining models of treatment selection. Health Serv Res. 2017;52(1):35–55. doi: 10.1111/1475-6773.12489 [DOI] [PMC free article] [PubMed] [Google Scholar]
- 12.Lee HB, Chung SH, Chu WS, Kim JK, Ha H. Peritoneal dialysis in diabetic patients. Am J Kidney Dis. 2001;38(4):S200–S203. doi: 10.1053/ajkd.2001.27444 [DOI] [PubMed] [Google Scholar]
- 13.Passadakis P, Thodis E, Vargemezis V, Oreopoulos D. Long-term survival with peritoneal dialysis in ESRD due to diabetes. Clin Nephrol. 2001;56(4):257–270. PMID: 11680655. [PubMed] [Google Scholar]
- 14.Vonesh EF, Snyder JJ, Foley RN, Collins AJ. The differential impact of risk factors on mortality in hemodialysis and peritoneal dialysis. Kidney Int. 2004;66(6):2389–2401. doi: 10.1111/j.1523-1755.2004.66028.x [DOI] [PubMed] [Google Scholar]
- 15.Vonesh EF, Snyder JJ, Foley RN, Collins AJ. Mortality studies comparing peritoneal dialysis and hemodialysis: what do they tell us? Kidney Int Suppl. 2006;70:S3–S11. doi: 10.1038/sj.ki.5001910 [DOI] [PubMed] [Google Scholar]
- 16.Turenne M, Baker R, Pearson J, Cogan C, Mukhopadhyay P, Cope E. Payment reform and health disparities: changes in dialysis modality under the new Medicare dialysis payment system. Health Serv Res. 2018;53(3):1430–1457. doi: 10.1111/1475-6773.12713 [DOI] [PMC free article] [PubMed] [Google Scholar]
- 17.Shen JI Erickson KF Chen L, et al. Expanded prospective payment system and use of and outcomes with home dialysis by race and ethnicity in the United States. Clin J Am Soc Nephrol. 2019;14(8):1200–1212. doi: 10.2215/CJN.00290119 [DOI] [PMC free article] [PubMed] [Google Scholar]
- 18.Sloan CE Coffman CJ Sanders LL, et al. Trends in peritoneal dialysis use in the United States after Medicare payment reform. Clin J Am Soc Nephrol. 2019;14(12):1763–1772. doi: 10.2215/CJN.05910519 [DOI] [PMC free article] [PubMed] [Google Scholar]
- 19.Perez JJ, Zhao B, Qureshi S, Winkelmayer WC, Erickson KF. Health insurance and the use of peritoneal dialysis in the United States. Am J Kidney Dis. 2018;71(4):479–487. doi: 10.1053/j.ajkd.2017.09.024 [DOI] [PMC free article] [PubMed] [Google Scholar]
- 20.Adler JT, Husain SA, Xiang L, Rodrigue JR, Waikar SS. Initial home dialysis is increased for rural patients by accessing urban facilities. Kidney360. 2022;3(3):488–496. doi: 10.34067/KID.0006932021 [DOI] [PMC free article] [PubMed] [Google Scholar]
- 21.Wilk AS, Cummings JR, Plantinga LC, Franch HA, Lea JP, Patzer RE. Racial and ethnic disparities in kidney replacement therapies among adults with kidney failure: an observational study of variation by patient age. Am J Kidney Dis. 2022;80(1):9–19. doi: 10.1053/j.ajkd.2021.12.012 [DOI] [PMC free article] [PubMed] [Google Scholar]
- 22.Abe M, Hamano T, Hoshino J, Wada A, Nakai S, Masakane I. Glycemic control and survival in peritoneal dialysis patients with diabetes: a 2-year nationwide cohort study. Sci Rep. 2019;9(1):3320. doi: 10.1038/s41598-019-39933-5 [DOI] [PMC free article] [PubMed] [Google Scholar]
- 23.Duong U Mehrotra R Molnar MZ, et al. Glycemic control and survival in peritoneal dialysis patients with diabetes mellitus. Clin J Am Soc Nephrol. 2011;6(5):1041–1048. doi: 10.2215/CJN.08921010 [DOI] [PMC free article] [PubMed] [Google Scholar]
- 24.Takatori Y Akagi S Sugiyama H, et al. Icodextrin increases technique survival rate in peritoneal dialysis patients with diabetic nephropathy by improving body fluid management: a randomized controlled trial. Clin J Am Soc Nephrol. 2011;6(6):1337–1344. doi: 10.2215/CJN.10041110 [DOI] [PMC free article] [PubMed] [Google Scholar]
- 25.Sekercioglu N Dimitriadis C Pipili C, et al. Glycemic control and survival in peritoneal dialysis patients with diabetes mellitus. Int Urol Nephrol. 2012;44(6):1861–1869. doi: 10.1007/s11255-012-0180-6 [DOI] [PubMed] [Google Scholar]
- 26.Wetmore JB, Johansen KL, Liu J, Peng Y, Gilbertson DT, Weinhandl ED. Changes in treatment of patients with incident ESKD during the novel coronavirus disease 2019 pandemic. J Am Soc Nephrol. 2021;32(11):2948–2957. doi: 10.1681/ASN.2021040579 [DOI] [PMC free article] [PubMed] [Google Scholar]
- 27.Robert Graham Center. Social Deprivation Index. Robert Graham Center. Accessed December 12, 2022. https://www.graham-center.org/maps-data-tools/social-deprivation-index.html [Google Scholar]
- 28.Economic Research Service. US Department of Agriculture. Rural-Urban Commuting Area Codes. US Department of Agriculture; 2020. Accessed November 19, 2022. https://www.ers.usda.gov/data-products/rural-urban-commuting-area-codes.aspx [Google Scholar]
- 29.United States Census Bureau. Geographic Levels. United States Census Bureau; 2021. Accessed May 12, 2023. https://www.census.gov/programs-surveys/economic-census/guidance-geographies/levels.html#par_textimage_34 [Google Scholar]
- 30.Centers for Medicare & Medicaid Services. End Stage Renal Disease (ESRD) Prospective Payment System (PPS) and Consolidated Billing for Limited Part B Services. Centers for Medicare & Medicaid Services; 2021. Accessed February 6, 2023. https://www.hhs.gov/guidance/document/end-stage-renal-disease-esrd-prospective-payment-system-pps-and-consolidated-billing [Google Scholar]
- 31.Winkelmayer WC, Chertow GM. The 2011 ESRD prospective payment system: an uncontrolled experiment. Am J Kidney Dis. 2011;57(4):542–546. doi: 10.1053/j.ajkd.2011.01.013 [DOI] [PubMed] [Google Scholar]
- 32.Blagg CR. Dialysis composite rate bundling: potential effects on the utilization of home hemodialysis, daily and nocturnal hemodialysis, and peritoneal dialysis. Semin Dial. 2011;24(6):674–677. doi: 10.1111/j.1525-139x.2011.00993.x [DOI] [PubMed] [Google Scholar]
- 33.US Department of Health and Human Services. Advancing American Kidney Health. US Department of Health and Human Services; 2019. Accessed December 27, 2022. https://aspe.hhs.gov/sites/default/files/migrated_legacy_files//189996/AdvancingAmericanKidneyHealth.pdf [Google Scholar]
- 34.Oveyssi J Manera KE Baumgart A, et al. Patient and caregiver perspectives on burnout in peritoneal dialysis. Perit Dial Int. 2020;41(5):484–493. doi: 10.1177/0896860820970064 [DOI] [PubMed] [Google Scholar]
- 35.Prakash S Coffin R Schold J, et al. Travel distance and home dialysis rates in the United States. Perit Dial Int. 2014;34(1):24–32. doi: 10.3747/pdi.2012.00234 [DOI] [PMC free article] [PubMed] [Google Scholar]
- 36.Tonelli M Hemmelgarn B Culleton B, et al. Mortality of Canadians treated by peritoneal dialysis in remote locations. Kidney Int. 2007;72(8):1023–1028. doi: 10.1038/sj.ki.5002443 [DOI] [PubMed] [Google Scholar]
- 37.Tonelli M Manns B Culleton B, et al. Association between proximity to the attending nephrologist and mortality among patients receiving hemodialysis. Can Med Assoc J. 2007;177(9):1039–1044. doi: 10.1503/cmaj.070343 [DOI] [PMC free article] [PubMed] [Google Scholar]
- 38.Sloan CE Coffman CJ Sanders LL, et al. Trends in regional supply of peritoneal dialysis in an era of Health reform, 2006 to 2013. Med Care Res Rev. 2021;78(3):281–290. doi: 10.1177/1077558720910633 [DOI] [PMC free article] [PubMed] [Google Scholar]