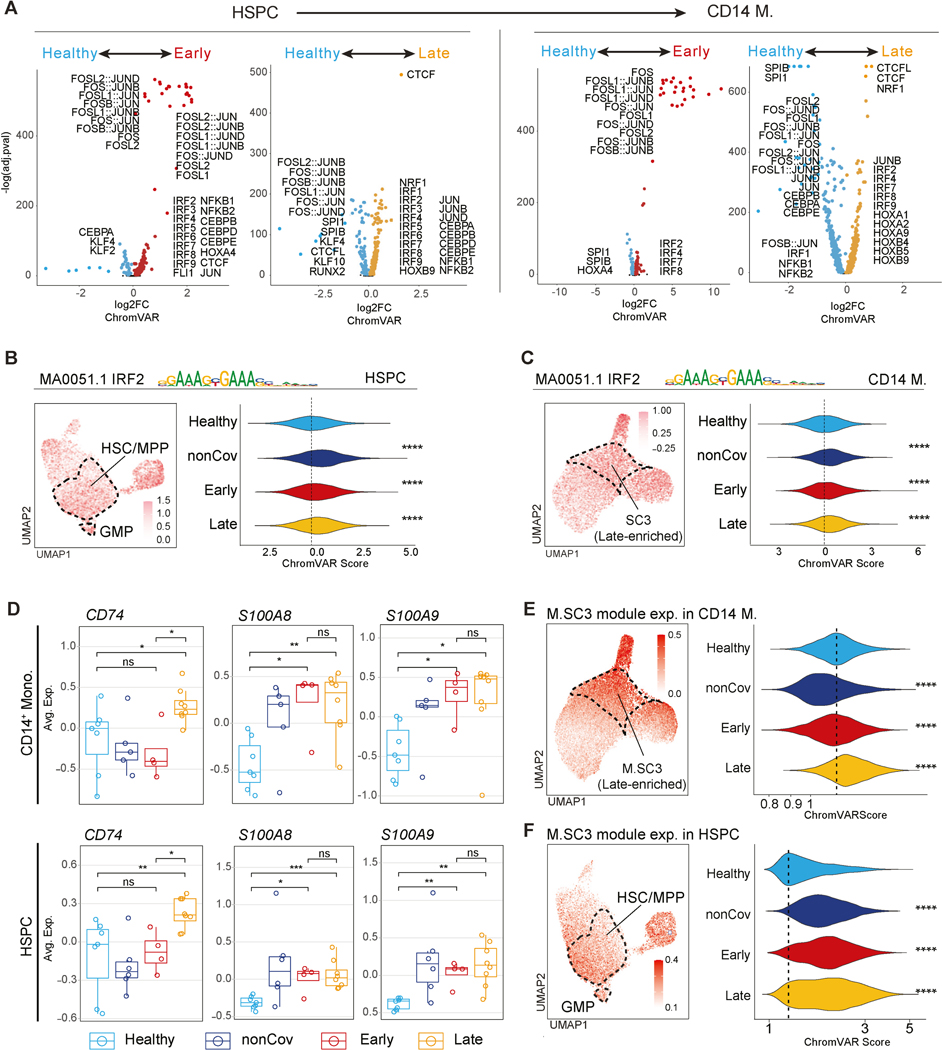
Figure 6. TF programs are durably altered following severe COVID-19 and are shared between HSPC and CD14 + monocytes.
(A) Differentially active TFs in HSPC (left) and CD14+ monocytes (right) between Healthy and Early/Late groups.
(B-C) chromVAR scores for IRF2 in HSPC (B) and CD14+ monocytes (C). Scores projected on myeloid UMAP (left). Per-cell scores across groups (right).
(D) Average expression of representative marker genes of M.SC3 in each individual.
(E-F) M.SC3 module score in myeloid cells (E) and HSPC (F). M.SC3 module score is projected onto UMAP (left). Per-cell M.SC3 module score across groups (right).

