

Abstract
Campylobacter spp. are a leading cause of bacterial gastroenteritis. Foods of animal origin, particularly undercooked poultry, are common sources of Campylobacter species associated with disease in humans. A collection of 110 Campylobacter jejuni and 31 C. coli human and environmental isolates from different Ontario, Canada, abattoirs were analyzed by pulsed-field gel electrophoresis, fatty acid profile typing, and biotyping. Previously collected serotyping data for the same isolates were also analyzed in this study. Pulsed-field gel electrophoresis was found to be the most discriminatory of the typing methods, followed by serotyping, fatty acid profile typing, and biotyping. A wide variety of typing profiles were observed within the isolates, suggesting that several different Campylobacter sp. strains were present within the abattoirs.
Campylobacter spp. recently emerged as the most frequently reported cause of bacterial enteritis in developed countries (14). Campylobacter jejuni and, to a lesser degree, C. coli are the species most commonly associated with disease in humans. Campylobacter spp. have been associated with both large and small food-borne disease outbreaks (5, 17), but sporadic illnesses make up the majority of cases. Raw meats, particularly poultry, are common sources of food-borne Campylobacter enteritides. A previous survey of abattoirs in Ontario, Canada, yielded a large number of Campylobacter sp. isolates from both environmental samples and employee fecal samples (15). In the present study, epidemiological typing was performed on these isolates with four different but complementary typing methods: pulsed-field gel electrophoresis (PFGE), fatty acid profile typing, biotyping, and serotyping. The discriminatory powers of these typing methods for the same group of Campylobacter sp. isolates were compared.
MATERIALS AND METHODS
Isolation and storage of Campylobacter sp. isolates.
A large number of Campylobacter sp. isolates obtained from employee fecal samples and environmental samples were previously isolated during a survey of Ontario abattoirs (15) by three separate isolation protocols. These methods were direct plating onto charcoal selective medium (BBL Microbiology Systems, Cockeysville, Md.) (6), enrichment in Rosef’s broth followed by plating onto Mueller-Hinton blood agar (7), and plating onto horse blood agar through a sterile 0.45-μm-pore-size cellulose acetate filter followed by removal of the filter after 30 min of incubation at 37°C. Serotyping of these isolates was performed by Health Canada, Ottawa, Ontario, Canada. Only isolates which could be definitively serotyped (110 C. jejuni and 31 C. coli isolates) were included in this study. Isolates frozen in 15% glycerol were subcultured twice onto tryptic soy agar plus 5% sheep blood (BBL) before being used in this study.
PFGE typing.
PFGE was performed as described previously, with some modifications (19). Fresh cultures of Campylobacter sp. isolates grown in brucella broth (BBL) were harvested, washed in cold 100 mM Tris–100 mM EDTA–150 mM NaCl (pH 7.5), washed in cold TN (10 mM Tris, 10 mM NaCl [pH 8]), suspended in 0.5% (wt/vol) InCert low-melting-point agarose (FMC, Rockland, Maine) in TN, and dispensed into wells of a plug mold. The solidified plugs were digested in a buffer containing 0.25 M EDTA, 0.5% (wt/vol) N-lauroylsarcosine, and 0.5 mg of proteinase K per ml for 48 h at 50°C and washed three times each in TE (50 mM Tris-HCl, 5 mM EDTA [pH 8]) plus 1 mM phenylmethylsulfonyl fluoride and TE alone. Gel slices (approximately 1 by 3 mm) were digested with 30 U of either SalI or SmaI restriction endonuclease (New England BioLabs, Mississauga, Ontario, Canada) per sample for 4 h at 37°C (SalI) or 25°C (SmaI) and then were washed in TE. The DNA fragments in the gel slices were separated in a 1% (wt/vol) PFGE-grade agarose (Bio-Rad) gel with a CHEF-DR III apparatus and 0.5× Tris-boric acid-EDTA buffer (Bio-Rad). PFGE was performed at 6 V/cm at an included angle of 120° with ramped pulse times from 10 to 35 s for 24 h. Ethidium bromide-stained DNA bands were visualized with a GelDoc 1000 system (Bio-Rad) and analyzed with Molecular Analyst software (Bio-Rad). PFGE profiles of the different isolates were divided into different PFGE profile groups based on the number of migration of bands in the profiles. Controls included in every PFGE run were a lambda ladder PFGE size marker (Bio-Rad), undigested DNA from a C. jejuni reference strain, and SalI-digested DNA from the C. jejuni reference strain.
Typing by whole-cell fatty acid profiles.
Fatty acid profiles were analyzed with the Microbial Identification System developed by Microbial ID Inc. (MIDI), Newark, Del. Campylobacter sp. isolates were grown on quadrant-streaked blood agar plates for 72 h at 42°C in a microaerophilic gas mixture (5% O2, 10% CO2, and 85% N2). The bacteria (50 ± 1 mg [wet weight]) were harvested and treated chemically to extract and convert the fatty acids present in the cell wall or cell membrane fractions of the bacteria to fatty acid methyl esters (FAMEs) as described in the Microbial Identification System operating manual (11). The FAMEs were injected into a Hewlett-Packard 5890 series II gas-liquid chromatography column equipped with a flame ionization detector, which acted to separate and quantify the different FAMEs in the mixture. Calibration standards, a negative control blank, and a positive control culture preparation were run with each batch of samples, as recommended by MIDI (11). The retention times of the sample FAMEs, relative to those of the calibration standards, were used by the MIDI computer program to identify and quantitate the different fatty acids in the samples.
To determine the reproducibility of fatty acid profiles, four representative isolates of C. jejuni and C. coli (two American Type Culture Collection strains and two environmental isolates of each species) were tested on two different days, with two different batches of media per day, and with two replicate analyses per batch of media and two chromatographic separations per replicate sample, for a total of 16 replicate analyses per strain. The MIDI library generation software includes a program for the production of dendrograms. The dendrogram program uses cluster analysis to generate unweighted pair matchings based on the named fatty acid composition of samples to produce a dendrogram illustrating the relatedness of fatty acid profiles of different isolates. Dendrograms of replicate analyses of each of the representative isolates were generated to examine the inherent variability between replicate samples prepared from the same batch of media but on different days, between replicate samples prepared on the same day but from different batches of media, between replicate samples prepared on the same day from the same batch of media, and between chromatographic separations of the same sample extract. The 95th percentile of the distance, in euclidian distance (ED), was calculated for the replicate analyses showing the highest level of variation and was found to be 8.9 ED units. This distance represented the variation inherent in the fatty acid profile analysis of the Campylobacter sp. strains and was used as a cutoff level for generating fatty acid-based library subgroups.
Single fatty acid profiles for each of the Campylobacter sp. isolates included in this study were analyzed with MIDI library generation software. A dendrogram was generated to examine the relatedness of the fatty acid profiles for all isolates in the study, and the cutoff level of 8.9 ED units was applied to this dendrogram. All isolates which clustered together below this cutoff level were considered to be in the same fatty acid profile subgroup. The distribution of the fatty acid profile subgroups within this dendrogram is shown schematically in Fig. 1.
FIG. 1.

Schematic dendrogram illustrating the relatedness of abattoir Campylobacter sp. isolates based on whole-cell fatty acid profiles.
Determination of biotypes and serotypes.
Biotypes were determined as described previously (8, 9). Heat-labile serotyping was performed by Health Canada as described previously (10).
Statistical analysis.
Simpson’s index of diversity was used to compare the relative discriminatory powers of fatty acid groups, PFGE groups, biotype groups, and serotype groups for this collection of isolates (3). A chi-square test was used to examine the potential association between Campylobacter species and abattoir type.
RESULTS AND DISCUSSION
PFGE has been used to study Campylobacter spp. both in epidemiological investigations of food-borne illness (4, 16, 19) and through mapping of Campylobacter sp. genomes (2, 18, 24). Two restriction endonucleases, SalI and SmaI, were used to characterize the Campylobacter isolates in this study. A total of 78 and 86 different PFGE profiles were observed following digestion of 141 Campylobacter isolates with SalI and SmaI, respectively. The four most common SalI PFGE profiles and SmaI PFGE profiles obtained are shown in Fig. 2. The PFGE profile results from each enzyme were combined to generate 98 different PFGE profile groups. The undigested DNA from the C. jejuni reference strain included in each run appeared as a single undigested DNA band (data not shown), indicating that no exogenous nucleases were present. The SalI-digested DNA from the C. jejuni reference strain displayed the same PFGE profile in each run (data not shown), indicating that the PFGE protocol used in these experiments generated reproducible results. The discriminatory index described by Hunter and Gaston (3) is a measure of the ability of a system to distinguish between unrelated isolates and is dependent upon both the number of subgroups in the typing system and the distribution of isolates within these subgroups. The discriminatory index of PFGE with either enzyme was excellent and could be enhanced only slightly by combining the two enzyme groups (Table 1).
FIG. 2.
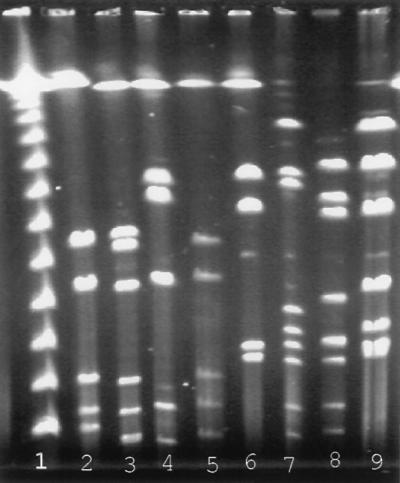
Common Campylobacter sp. PFGE profiles obtained following digestion with SalI or SmaI restriction endonuclease. Lanes: 1, lambda ladder PFGE size marker; 2 to 5, common SalI PFGE profiles; 6 to 9, common SmaI PFGE profiles.
TABLE 1.
Comparison of the discriminatory abilities of different typing methods when tested on the same group of isolates
| Typing method | No. of subgroups/typing method | Avg no. of isolates/ subgroup | Discriminatory indexa |
|---|---|---|---|
| Fatty acid typing | 9 | 15.9 | 0.812 |
| PFGE typing | |||
| SalI | 78 | 1.82 | 0.979 |
| SmaI | 86 | 1.66 | 0.986 |
| SalI/SmaI | 98 | 1.46 | 0.988 |
| Serotyping | 38 | 3.68 | 0.946 |
| Biotyping | 4 | 35.75 | 0.662 |
Based on Simpson’s index of diversity, as described by Hunter and Gaston (3)
The Microbial Identification System utilizes gas chromatography to analyze FAMEs generated after acid hydrolysis of whole bacterial cells. This system was designed for bacterial species identification but has shown potential for epidemiological typing of bacterial isolates (1, 12, 20). Recently, the Microbial Identification System was used to evaluate the relatedness between isolates of Listeria monocytogenes, Salmonella enteritidis, verotoxigenic Escherichia coli, and the Bacillus cereus group (20, 21, 22).
The 141 Campylobacter sp. isolates used in this study were distributed into nine fatty acid-based subgroups. Despite the fact that the isolates were distributed fairly evenly in the different subgroups, the relatively low number of subgroups resulted in a discriminatory index of only 0.812 (Table 1). A discriminatory index of greater than 0.900 is desirable if results are to be interpreted with confidence (3).
Several biotyping systems have been developed for Campylobacter spp. (13). Biotyping is not very discriminatory on its own but is often used in combination with other typing systems, such as serotyping (13). The Lior biotyping scheme, based on hippurate hydrolysis, DNase production, and rapid H2S production, is capable of dividing C. jejuni into four subtypes and C. coli into two subtypes (8, 9). Both of the C. coli subtypes and two of the C. jejuni subtypes were represented within the abattoir isolates. The low number of biotypes resulted in a discriminatory index of only 0.662 (Table 1).
Several serotyping systems have been developed for typing Campylobacter isolates (13). The Lior heat-labile serotyping system (10) was used to type the isolates included in this study. The 141 isolates were distributed into 38 serogroups, with a good discriminatory index, 0.946 (Table 1).
Table 2 shows the distribution of the isolates in the different typing subgroups. The large number of subgroups within these samples indicates that there is a high degree of diversity within Campylobacter strains isolated from abattoirs. This finding suggests that a wide variety of contaminating strains from different sources enter abattoirs. Individual animals would be the expected sources of contamination. Within individual abattoir visits, there was evidence of both the repeated isolation of similar strains and the isolation of multiple genotypically and phenotypically distinct strains. Abattoir visits 7, 11, 16, 17, 22, 25, 31, 36, 39, 48, and 55 all revealed clusters of strains which appeared identical by serotyping, biotyping, PFGE profiling, and fatty acid profile typing. Conversely, abattoir visits 2, 3, 12, 14, 15, 17, 19, 21, 23, 29, 31, 40, 41, 44, 48, and 55 each revealed three or more strain profiles which differed by at least one of the typing methods. These results suggest that while there is the potential for a single strain to be distributed widely within an abattoir, there is also the potential for multiple contaminating strains to be present within the same abattoir.
TABLE 2.
Serotypes, biotypes, PFGE groups, and fatty acid profile groups of Campylobacter isolates from abattoirs
| Visit | No. of isolates | PFGE groupa | Serotypeb | Biotypeb | Fatty acid profile group | Visit | No. of isolates | PFGE group | Serotype | Biotype | Fatty acid profile group | |
|---|---|---|---|---|---|---|---|---|---|---|---|---|
| 1 | 1 | 67 | CJ2 | CJ2 | 8 | 25 | 1 | 63 | CJ111 | CJ1 | 5 | |
| 2 | 1 | 68 | CJ82 | CJ2 | 8 | 26 | 1 | 41 | CJ19 | CJ1 | 5 | |
| 2 | 1 | 2 | CJ8 | CJ2 | 8 | 26 | 1 | 89 | CJ103 | CJ1 | 9 | |
| 2 | 1 | 82 | CJ8 | CJ2 | 4 | 27 | 1 | 31 | CJ6 | CJ2 | 5 | |
| 2 | 1 | 82 | CJ8 | CJ2 | 8 | 28 | 1 | 3 | CJ28 | CJ1 | 8 | |
| 3 | 1 | 38 | CJ7 | CJ2 | 5 | 29 | 1 | 33 | CC**8 | CC2 | 7 | |
| 3 | 1 | 76 | CJ8 | CJ2 | 5 | 29 | 1 | 32 | CC97 | CC1 | 3 | |
| 3 | 1 | 74 | CJ8 | CJ2 | 5 | 29 | 1 | 97 | CC46 | CC2 | 7 | |
| 4 | 1 | 49 | CJ70 | CJ1 | 9 | 30 | 1 | 51 | CC29 | CC1 | 3 | |
| 5 | 1 | 21 | CC29, 55 | CC1 | 5 | 31 | 1 | 47 | CJ5 | CJ2 | 4 | |
| 5 | 1 | 22 | CC29, 55 | CC1 | 6 | 31 | 3 | 47 | CJ5 | CJ2 | 8 | |
| 6 | 1 | 50 | CC105 | CC1 | 3 | 31 | 1 | 47 | CJ5 | CJ2 | 7 | |
| 6 | 1 | 4 | CC20 | CC1 | 3 | 32 | 1 | 52 | CJ4 | CJ2 | 9 | |
| 7 | 5 | 34 | CJ4 | CJ2 | 9 | 33 | 1 | 35 | CJ7 | CJ1 | 5 | |
| 8 | 1 | 56 | CJ36 | CJ1 | 9 | 34 | 1 | 75 | CJ8 | CJ2 | 5 | |
| 9 | 1 | 23 | CC105 | CC1 | 6 | 35 | 1 | 84 | CJ7 | CJ2 | 9 | |
| 10 | 1 | 69 | CC96 | CC2 | 7 | 36 | 5 | 76 | CJ82 | CJ2 | 6 | |
| 11 | 5 | 19 | CJ18 | CJ1 | 5 | 36 | 1 | 77 | CJ82 | CJ2 | 6 | |
| 11 | 1 | 19 | CJ18 | CJ1 | 6 | 37 | 1 | 62 | CJ5 | CJ2 | 5 | |
| 12 | 1 | 9 | CJ1 | CJ1 | 9 | 37 | 2 | 62 | CJ5 | CJ2 | 8 | |
| 12 | 1 | 9 | CJ79 | CJ1 | 9 | 38 | 1 | 43 | CC2 | CJ1 | 9 | |
| 12 | 1 | 86 | CJ79 | CJ1 | 9 | 39 | 3 | 1 | CC8 | CC1 | 6 | |
| 13 | 1 | 86 | CJ79 | CJ1 | 9 | 39 | 1 | 1 | CC45 | CC1 | 6 | |
| 14 | 1 | 70 | CC36 | CC1 | 6 | 40 | 1 | 57 | CJ6 | CJ1 | 2 | |
| 14 | 1 | 24 | CC29, 55 | CC1 | 3 | 40 | 1 | 80 | CJ6 | CJ1 | 2 | |
| 14 | 1 | 71 | CC21 | CC1 | 6 | 40 | 1 | 20 | CJ6 | CJ1 | 2 | |
| 14 | 1 | 72 | CC20 | CC1 | 3 | 41 | 1 | 58 | CJ5 | CJ1 | 8 | |
| 15 | 1 | 79 | CJ36 | CJ1 | 9 | 41 | 1 | 59 | CJ5 | CJ1 | 8 | |
| 15 | 1 | 73 | CJ36 | CJ1 | 9 | 41 | 1 | 3 | CJ28 | CJ1 | 5 | |
| 15 | 1 | 55 | CJ36 | CJ1 | 9 | 42 | 1 | 95 | CC115 | CC1 | 6 | |
| 15 | 1 | 54 | CJ36 | CJ1 | 5 | 43 | 1 | 6 | CJ5 | CJ2 | 8 | |
| 15 | 1 | 8 | CJ6 | CJ1 | 5 | 44 | 1 | 28 | CC55 | CC2 | 6 | |
| 16 | 2 | 83 | CJ2 | CJ1 | 9 | 44 | 1 | 40 | CJ40 | CJ1 | 5 | |
| 16 | 1 | 25 | CC48 | CJ1 | 5 | 44 | 1 | 53 | CC55 | CC1 | 3 | |
| 17 | 1 | 48 | CJ99 | CJ1 | 9 | 45 | 1 | 85 | — | CJ2 | 5 | |
| 17 | 3 | 48 | CJ5 | CJ1 | 9 | 46 | 1 | 64 | CJ82 | CJ2 | 8 | |
| 17 | 1 | 48 | CJ5 | CJ1 | 8 | 46 | 1 | 60 | CJ5 | CJ1 | 8 | |
| 18 | 1 | 12 | CJ55 | CJ1 | 5 | 47 | 1 | 96 | CC46 | CC2 | 6 | |
| 19 | 1 | 66 | CJ5 | CJ1 | 9 | 47 | 1 | 49 | CJ7 | CJ1 | 9 | |
| 19 | 1 | 5 | CJ1 | CJ2 | 5 | 48 | 2 | 19 | CJ18 | CJ1 | 5 | |
| 19 | 1 | 94 | CJ41 | CJ2 | 5 | 48 | 1 | 90 | CJ41 | CJ1 | 8 | |
| 20 | 1 | 18 | CC29 | CC2 | 6 | 48 | 1 | 37 | CJ82 | CJ2 | 5 | |
| 20 | 1 | 92 | CJ1 | CJ1 | 9 | 48 | 1 | 36 | CJ18 | CJ1 | 1 | |
| 21 | 1 | 42 | CJ1 | CJ2 | 4 | 49 | 1 | 61 | CJ5 | CJ1 | 8 | |
| 21 | 1 | 65 | CC29, 55 | CC1 | 7 | 49 | 1 | 98 | CJ7 | CJ2 | 8 | |
| 21 | 1 | 19 | CJ1 | CJ1 | 5 | 50 | 1 | 91 | CJ5 | CJ2 | 8 | |
| 21 | 1 | 19 | CJ23 | CJ1 | 5 | 50 | 1 | 44 | CJ5 | CJ2 | 8 | |
| 21 | 1 | 39 | CJ40 | CJ2 | 5 | 51 | 1 | 78 | CJ4 | CJ2 | 5 | |
| 22 | 3 | 95 | CC105 | CC1 | 6 | 52 | 1 | 88 | CJ4 | CJ2 | 9 | |
| 23 | 1 | 29 | CJ4 | CJ1 | 9 | 53 | 1 | 45 | CJ4 | CJ2 | 9 | |
| 23 | 1 | 30 | CJ1 | CJ2 | 9 | 54 | 1 | 11 | CJ4 | CJ2 | 9 | |
| 23 | 1 | 27 | CC57 | CC1 | 6 | 55 | 2 | 15 | CJ8 | CJ1 | 8 | |
| 23 | 1 | 89 | CJ79 | CJ1 | 9 | 55 | 1 | 13 | CJ4 | CJ1 | 5 | |
| 23 | 1 | 26 | CC57 | CC1 | 6 | 55 | 1 | 17 | CJ28 | CJ1 | 5 | |
| 23 | 1 | 81 | CJ7 | CJ2 | 9 | 55 | 1 | 16 | CJ8 | CJ2 | 8 | |
| 23 | 1 | 93 | CJ7 | CJ2 | 9 | 55 | 1 | 14 | CJ5 | CJ1 | 8 | |
| 24 | 1 | 7 | CJ6 | CJ1 | 5 | 56 | 1 | 19 | CJ5 | CJ2 | 5 | |
| 25 | 2 | 63 | CJ111 | CJ1 | 4 | 57 | 1 | 46 | CJ5 | CJ2 | 4 |
Based on combined results from SalI and SmaI digestions.
CJ, C. jejuni; CC, C. coli.
Because of the large number of PFGE profile groups present within these strains, it was of interest to determine if the PFGE groups were clustered within any of the other typing subgroups. A comparison of the different typing subgroups (Table 2) revealed that strains which displayed the same PFGE group displayed the same biotype an average of 99.4% of the time, the same serotype an average of 79.1% of the time, and the same fatty acid profile an average of 84.16% of the time. These results suggest that PFGE groups are clustered within biotypes and, to a lesser degree, within serotypes and fatty acid profile subgroups.
A strong association was observed between abattoir type and Campylobacter species (P < 0.01). Pork abattoirs were strongly associated with C. coli, while beef and poultry abattoirs were more strongly associated with C. jejuni than with C. coli (Table 3). Assuming the predominant source of Campylobacter spp. in the abattoirs to be the animals themselves, the abattoir type may be considered synonymous with the animal of origin for the isolates. A predominance of C. coli in pork has been reported previously (23).
TABLE 3.
Distribution of Campylobacter isolates by abattoir type
| Campylobacter species | No. of isolates associated with the following abattoir:
|
|||
|---|---|---|---|---|
| Beef | Pork | Poultry | Total | |
| C. coli | 6 | 8 | 17 | 31 |
| C. jejuni | 62 | 0 | 48 | 110 |
| Total | 68 | 8 | 65 | 141 |
In conclusion, a comparison of several typing methods found PFGE to be the most discriminatory, followed by serotyping, fatty acid profile typing, and biotyping. Both PFGE and serotyping were sufficiently discriminatory to be used alone for epidemiological typing of Campylobacter isolates. PFGE is fairly time-consuming but does not require specialized serotyping reagents, making it a better choice for typing of Campylobacter isolates in most laboratories.
ACKNOWLEDGMENTS
This research was funded by the Ontario Food Quality and Safety Research Fund.
We thank Lawrence Price of Health Canada for the control strains used in biotyping, Louise Spilsbury and Kim McFadden for technical assistance with the gas chromatography and PFGE, respectively, and Kris Rahn for critical appraisal of the manuscript.
REFERENCES
- 1.Birnbaum D, Herwaldt L, Low D E, Noble M, Pfaller M, Sherertz R, Chow A W. Efficiency of Microbial Identification System for epidemiologic typing of coagulase-negative staphylococci. J Clin Microbiol. 1994;32:2113–2119. doi: 10.1128/jcm.32.9.2113-2119.1994. [DOI] [PMC free article] [PubMed] [Google Scholar]
- 2.Bourke B, Sherman P, Louie H, Hani E, Islur P, Chan V L. Physical and genetic map of the genome of Campylobacter upsaliensis. Microbiology. 1995;141:2417–2424. doi: 10.1099/13500872-141-10-2417. [DOI] [PubMed] [Google Scholar]
- 3.Hunter P R, Gaston M A. Numerical index of the discriminatory ability of typing systems: an application of Simpson’s index of diversity. J Clin Microbiol. 1988;26:2465–2466. doi: 10.1128/jcm.26.11.2465-2466.1988. [DOI] [PMC free article] [PubMed] [Google Scholar]
- 4.Imai Y, Kikuchi M, Honda M, Fukuyama M, Tsukada M, Kaneuchi C. Macro-fingerprinting analysis at the chromosomal genomic DNA level of isolates of thermophilic Campylobacter coli and C. jejuni, by pulsed-field gel electrophoresis. Cytobios. 1994;78:115–122. [PubMed] [Google Scholar]
- 5.Jones P H, Willis A T, Robinson D A, Skirrow M B, Josephs D S. Campylobacter enteritis associated with the consumption of free school milk. J Hyg Camb. 1981;87:155–162. doi: 10.1017/s0022172400069357. [DOI] [PMC free article] [PubMed] [Google Scholar]
- 6.Karmali M A, Simor A E, Roscoe M, Fleming P C, Smith S S, Lane J. Evaluation of a blood-free, charcoal-based selective medium for the isolation of Campylobacter organisms from feces. J Clin Microbiol. 1986;23:456–459. doi: 10.1128/jcm.23.3.456-459.1986. [DOI] [PMC free article] [PubMed] [Google Scholar]
- 7.Lammerding A M, Garcia M M, Mann E D, Robinson Y, Dorward W J, Truscott R B, Tittiger F. Prevalence of Salmonella and thermophilic Campylobacter in fresh pork, beef, veal, and poultry in Canada. J Food Prot. 1988;51:47–52. doi: 10.4315/0362-028X-51.1.47. [DOI] [PubMed] [Google Scholar]
- 8.Lior H. New extended biotyping scheme for Campylobacter jejuni, Campylobacter coli, and Campylobacter laridis. J Clin Microbiol. 1984;20:636–640. doi: 10.1128/jcm.20.4.636-640.1984. [DOI] [PMC free article] [PubMed] [Google Scholar]
- 9.Lior H, Patel A. Improved toluidine blue-DNA agar for detection of DNA hydrolysis by campylobacters. J Clin Microbiol. 1987;25:2030–2031. doi: 10.1128/jcm.25.10.2030-2031.1987. [DOI] [PMC free article] [PubMed] [Google Scholar]
- 10.Lior H, Woodward D L, Edgar J A, Laroche L J, Gill P. Serotyping of Campylobacter jejuni by slide agglutination based on heat-labile antigenic factors. J Clin Microbiol. 1982;15:761–768. doi: 10.1128/jcm.15.5.761-768.1982. [DOI] [PMC free article] [PubMed] [Google Scholar]
- 11.Microbial ID Inc. Microbial Identification System operating manual, version 4. Newark, Del: Microbial ID Inc.; 1993. [Google Scholar]
- 12.Mukwaya G M, Welch D F. Subgrouping of Pseudomonas cepacia by cellular fatty acid composition. J Clin Microbiol. 1989;27:2640–2646. doi: 10.1128/jcm.27.12.2640-2646.1989. [DOI] [PMC free article] [PubMed] [Google Scholar]
- 13.Patton C M, Wachsmuth I K. Typing schemes: are current methods useful? In: Nachamkin I, Blaser M J, Tompkins L S, editors. Campylobacter jejuni: current status and future trends. Washington, D.C: American Society for Microbiology Press; 1992. pp. 110–128. [Google Scholar]
- 14.Phillips C A. Incidence, epidemiology and prevention of foodborne Campylobacter species. Trends Food Sci Technol. 1995;6:83–87. [Google Scholar]
- 15.Rahn K, Johnson R P, Wilson J B, Renwick S A, Stewart B, Clarke R C, Odumeru J A, Alves D, Johnson W, Clark C G, Karmali M A, McEwen S, Spika J. Abstracts of the 96th General Meeting of the American Society for Microbiology 1996. 1996. Occupational exposure of abattoir workers to verocytotoxigenic Escherichia coli (VTEC), Salmonella spp., and Campylobacter spp., abstr. P-9; p. 370. [Google Scholar]
- 16.Rennie R P, Strong D, Taylor D E, Salama S M, Davidson C, Taylor H. Campylobacter fetus diarrhea in a Hutterite colony: epidemiological observations and typing of the causative organism. J Clin Microbiol. 1994;32:721–724. doi: 10.1128/jcm.32.3.721-724.1994. [DOI] [PMC free article] [PubMed] [Google Scholar]
- 17.Robinson D A, Jones D M. Milk-borne campylobacter infection. Br Med J. 1981;282:1374–1376. doi: 10.1136/bmj.282.6273.1374. [DOI] [PMC free article] [PubMed] [Google Scholar]
- 18.Salama S M, Newnham E, Chang N, Taylor D E. Genome map of Campylobacter fetus subsp. fetus ATCC 27374. FEMS Microbiol Lett. 1995;132:239–245. doi: 10.1016/0378-1097(95)00316-w. [DOI] [PubMed] [Google Scholar]
- 19.Salama S M, Tabor H, Richter M, Taylor D E. Pulsed-field gel electrophoresis for epidemiological studies of Campylobacter hyointestinalis isolates. J Clin Microbiol. 1992;30:1982–1984. doi: 10.1128/jcm.30.8.1982-1984.1992. [DOI] [PMC free article] [PubMed] [Google Scholar]
- 20.Schraft H, Steele M L, McNab B, Odumeru J, Griffiths M. Epidemiological typing of Bacillus spp. isolated from food. Appl Environ Microbiol. 1996;62:4229–4232. doi: 10.1128/aem.62.11.4229-4232.1996. [DOI] [PMC free article] [PubMed] [Google Scholar]
- 21.Steele M, Lammerding A M, McNab W B, Harris L J, Kolar J J, Odumeru J. Proceedings of the XII International Symposium on Problems of Listeriosis (ISOPOL), Perth, Western Australia, Australia. 1995. Evaluation of an automated fatty acid analysis system for typing Listeria monocytogenes; p. 85. [Google Scholar]
- 22.Steele M L, McNab W B, Read S, Poppe C, Harris L, Lammerding A M, Odumeru J. Analysis of whole-cell fatty acid profiles of verotoxigenic Escherichia coli and Salmonella enteritidis using the Microbial Identification System. Appl Environ Microbiol. 1997;63:757–760. doi: 10.1128/aem.63.2.757-760.1997. [DOI] [PMC free article] [PubMed] [Google Scholar]
- 23.Stern N J. Campylobacter jejuni: current status and future trends. Washington, D.C: American Society for Microbiology Press; 1992. Reservoirs for Campylobacter jejuni and approaches for intervention in poultry; pp. 49–60. [Google Scholar]
- 24.Taylor D E, Eaton M, Yan W, Chang N. Genome maps of Campylobacter jejuni and Campylobacter coli. J Bacteriol. 1992;174:2332–2337. doi: 10.1128/jb.174.7.2332-2337.1992. [DOI] [PMC free article] [PubMed] [Google Scholar]