Abstract
Despite the recent progress in increasing the power generation of Anion-exchange membrane fuel cells (AEMFCs), their durability is still far lower than that of Proton exchange membrane fuel cells (PEMFCs). Using the complementary techniques of X-ray micro-computed tomography (CT), Scanning Electron Microscopy (SEM) and Energy Dispersive X-ray (EDX) spectroscopy, we have identified Pt ion migration as an important factor to explain the decay in performance of AEMFCs. In alkaline media Pt+2 ions are easily formed which then either undergo dissolution into the carbon support or migrate to the membrane. In contrast to PEMFCs, where hydrogen cross over reduces the ions forming a vertical “Pt line” within the membrane, the ions in the AEM are trapped by charged groups within the membrane, leading to disintegration of the membrane and failure. Diffusion of the metal components is still observed when the Pt/C of the cathode is substituted with a FeCo-N-C catalyst, but in this case the Fe and Co ions are not trapped within the membrane, but rather migrate into the anode, thereby increasing the stability of the membrane.
Keywords: fuel cells, platinum, stability testing, FeCo migration, electrochemistry
Graphical Abstract
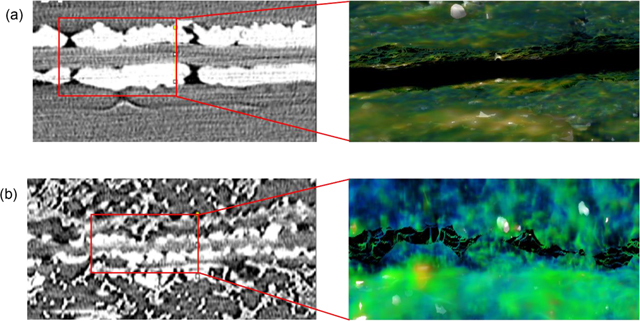
Using the complementary techniques of X-ray micro-computed tomography, scanning electron microscopy and energy dispersive X-ray spectroscopy, Pt ion migration was identified as an important factor to explain the decay in performance of anion-exchange membrane (AEM) fuel cells. The picture shows 3D reconstruction micro-CT images of the cross-section MEAs with Sustainion AEM and Pt/C cathode electrode after (a) 5 h and (b) 70 h of operation at 0.15 A/cm2.
Introduction
Global energy consumption is predicted to increase by around 50% within the next 30 years and there is a necessity for the continuous growth of renewable sources of energy to achieve a sustainable future. A hydrogen economy based on renewables like hydrogen production, storage, and conversion to electricity is considered a promising solution for the future. [1–6] The rapid rise in off-shore energy generation has also spurred interest in saltwater electrolysis, and fuel cells, which can efficiently process the gas streams generated to integrate seamlessly into the grid.
Much progress has been made on anion-exchange membrane fuel cell (AEMFC) performance in terms of peak power density and maximum current density over the past few decades, [1, 7, 8] achieving ≥2 W/cm2 peak power density at 80 °C with PtRu/carbon anode and Pt/carbon cathode electrodes under hydrogen-oxygen feed [9] and ≥1.0 W/cm2 peak power density for AEMFCs at 80–95 oC with other catalysts. [10–14] In 2019, Huang et al. reported a new record in peak power density of 3.4 W/cm2 (80 °C, PtRu/carbon anode, Pt/carbon cathode electrode in oxygen [15], and recently, Dekel et al. showed that AEMFCs could also be operated at temperatures higher than 100 °C. [13, 16, 17] Although acceptable peak power densities have now been demonstrated in AEMFCs, long-term performance durability remains a limiting factor for the scalability of the technology. [18–23] The reported lifetime of most AEMFC is significantly lower than that of proton-exchange membrane fuel cells (PEMFCs). The mechanisms responsible for the relatively rapid performance degradation are only beginning to be investigated. [24–26] Most current studies addressing the poor durability and water management issues have focused on the chemistry of the membranes and resulted in new designs to mitigate alkaline degradation. [27–32] Another factor contributing to the performance degradation, which has not been studied extensively, is the stability of the Pt catalyst. In PEMFCs, it has been shown that after an accelerated stress test (30,000 potential cycles), dissolution of Pt ions occurred at the cathode and contributed to Ostwald ripening on the carbon support. Diffusion of Pt+2 ions also occurred within the membrane, which was reduced at the point of intersection between the diffusion fronts of cross-over H2 and O2. Pt metal thus formed a 2–3 μm thick vertical band whose position within the membrane was controlled by the ratio of gas partial pressures. [33–35] The study of Pt/C cathode durability in AEMFC conditions is relatively scarce. Xie and Kirk investigated the degradation of a Pt/C catalyst at a fixed cell potential of 0.9 V and very low currents, where, using multiple complementary techniques, observed dissolution and migration of Pt ions from cathode to anode [36]. Zadick et al. used identical location transmission electron microscopy to study the stability of Pt/C electrocatalyst in acidic and alkaline media. They found that after the accelerated stress test (150 potential cycles from 0.1 V to 1.23 V vs. RHE), the loss of electrochemical surface area (ECSA) was ~60% in 0.1 M NaOH as compared to 20% in 0.1 M HClO4. [37] A similar result was also reported by Cherevko et al. where they compared the Pt dissolution in both acidic and alkaline media after only 30 cycles between 0 to 1.4 V vs. RHE. [38] Using inductively coupled plasma mass spectrometry (ICP-MS), they found a much larger rate of Pt dissolution in alkaline media (125 ng cm−2 of Pt in 0.05 M NaOH) as compared to acidic media (32 ng cm−2 in 0.1 M HClO4). This study indicated that Pt dissolution in alkaline media started at above 0.9 V vs. RHE and continued until the surface was passivated at ~1.4 V vs. RHE. These high potentials (>1.6 V) may be relevant to explain degradation in AEM water electrolyzers, however, the voltages associated with fuel cells rarely exceed 0.9 V. Cycling the catalyst using cyclic voltammetry tests does not represent the degradation conditions of an operating fuel cell. [39–41] Furthermore, the Pourbaix diagrams for Pt show that at high pH values, typical for AEM fuel cells Pt metal may no longer be stable at voltages as low as 0.5 – 0.6V. [42] Furthermore, as suggested by Cherevko steady-state Pt dissolution at low potentials can be attributed to the formation of soluble hydroxide/oxide species, which the Pourbaix diagrams indicate can be stable at high pH values and low voltages. [43]
We, therefore, tried to explore the mechanisms of catalyst degradation by investigating the nature of the process as a function of operational time, and determining the factors, which thus far limit the durability of the membranes. We employed micro-CT and SEM-EDX, to image the change in spatial distribution of the catalysts, and X-ray Absorption Near Edge Spectroscopy (XANES) and X-ray diffraction (XRD) to explore changes in the molecular and crystalline structures. In order to explore the dependence on membrane molecular chemistry, we studied two AEMs with differing structures, meta-terphenyl fluoro-alkylene trimethylammonium (mTPN1-TMA) membranes [Figure 1(b)] and imidazolium functionalized Sustainion membranes [Figure 1(a)], and compared the profiles obtained with two different catalysts at the cathode, Pt and FeCo-N-C coupled with the same Pt catalyst at the anode.
Figure 1.
Chemical structure of (a) Sustainion X37–50 grade RT AEM [44] and (b) mTPN1-TMA AEM (Br- form). [45]
Results and discussion
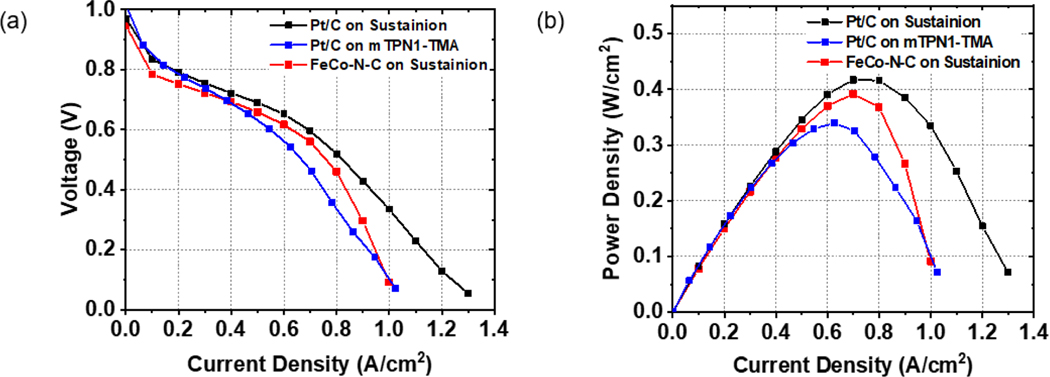
In Figure 2(a) we show the polarization curves obtained from the AEMs listed in Table 1. From Figure 2, you can see that the functional form of the curves is similar for the mTPN1-TMA and Sustainion membranes having Pt/C catalysts at both the anode and cathode. It can be seen that the current density though is consistently lower in magnitude for the mTPN1-TMA membrane as compared to the Sustainion membrane. Comparing the current density of the Sustainion membranes with the Pt/C to those with the FeCo-N-C catalyst at the cathode electrode, we find nearly comparable current densities at 0.6 V of 0.7 A/cm2 and 0.63 A/cm2, respectively, but a larger rate of decrease for the current densities at 0.4 V are 0.91 A/cm2 and 0.82 A/cm2 respectively, where the current density eventually becomes closer to that obtained on the mTPN1-TMA membranes. In Figure 2(b) we show the corresponding power density curves where the maximum power output for the Sustainion membrane is comparable for both Pt/C and FeCo-N-C cathode electrodes at Pmax= 0.417 W/cm2 and Pmax= 0.392 W/cm2, respectively. From Figure 2 we can also see that the maximum power output with mTPN1-TMA membrane together with Pt/C at both electrodes was considerably smaller at Pmax= 0.34 W/cm2. From the figure we can also compare the results for the MEAs having the same Sustanion membrane, but different catalysts at the cathode. It can be seen that the MEA having 0.76 mgPt/cm2 loading of Pt/C catalyst had nearly the same power output as the MEA having only 0.01 mgFeCo/cm2 loading of FeCo-N-C catalyst.
Figure 2.
(a) Polarization and (b) power density versus current density curves of AEMFCs with Pt/C and FeCo-N-C on the cathode.
Table 1.
AEMs with different catalysts.
| AEM | Anode catalyst | Anode loading (mg/cm2) | Cathode catalyst | Cathode loading (mg/cm2) | |
|---|---|---|---|---|---|
| 1 | Sustainion | Pt/C | 0.76 | Pt/C | 0.76 |
| 2 | Sustainion | Pt/C | 0.76 | FeCo-N-C | 0.70 (0.01 FeCo) |
| 3 | mTPN1-TMA | Pt/C | 0.76 | Pt/C | 0.76 |
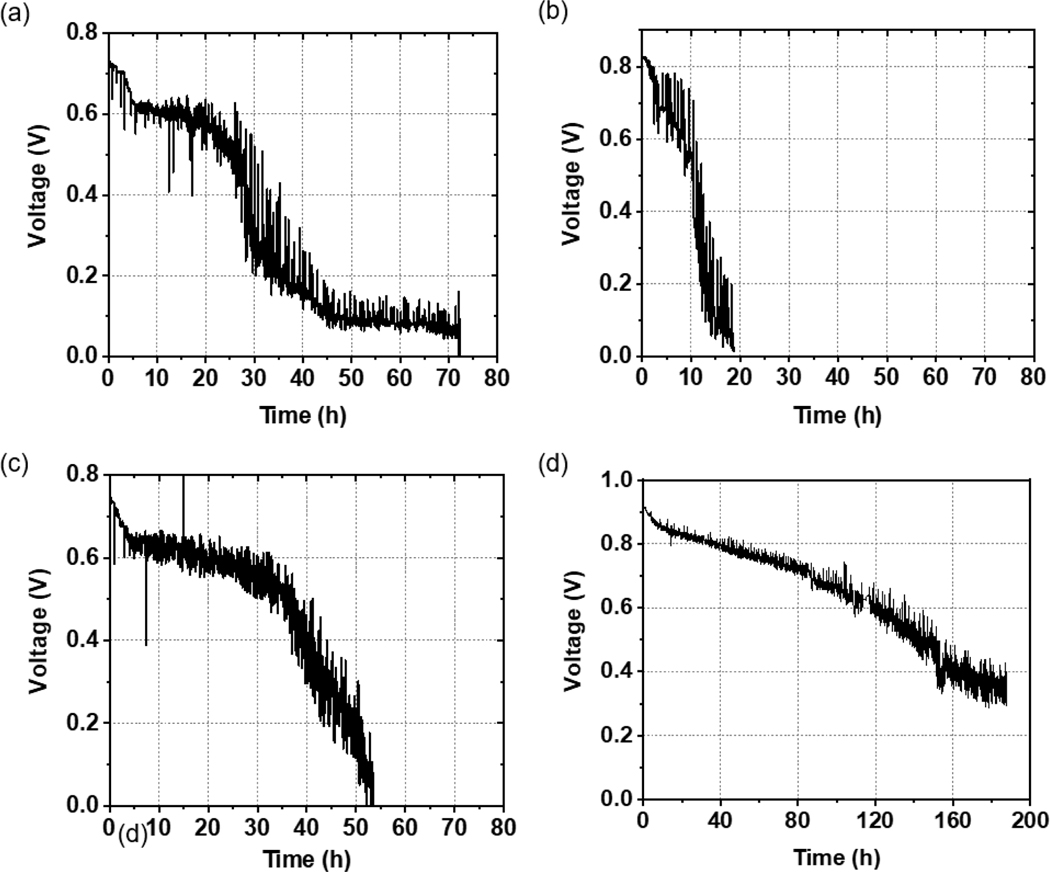
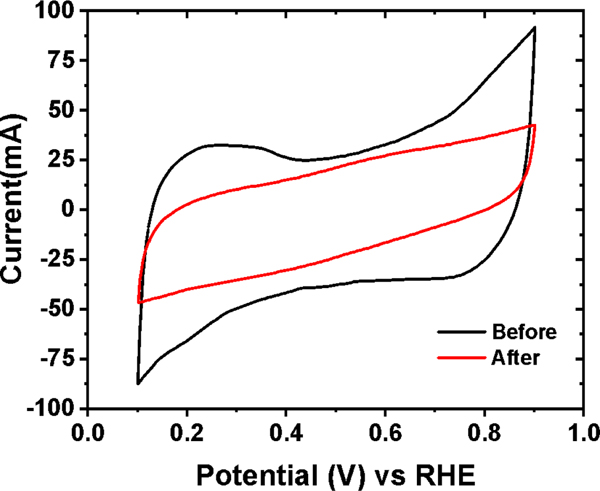
Durability tests of the MEAs were carried out by measuring the voltage at a low constant current density of j=0.15 A/cm2. In Figure 3(b), we plot the values for the mTPN1-TMA membrane, where we see that initially, the power generated by the cell is stable for approximately 10 hours, and then a precipitous drop to nearly 0 V is observed over the next 5 hours. The power of the AEMFC with the Sustainion membrane and the same Pt/C catalysts at the anode and cathode electrodes is initially stable for the first 28 hours, then abruptly drops to nearly half its initial value within the next 5 hours, and then decays slowly over the next 20 hours to 1/7 of the initial power, where it remains stable for the next 25 hours before dropping to zero. Cyclic voltammetry was conducted on the cathode electrodes at the start and the end of the durability test for the Sustainion membrane with Pt/C at both electrodes. The electrochemically active surface area (ECSA) of the Pt catalyst was calculated from the peak current densities in the hydrogen adsorption region. As we can see from Figure 4. and Table 2., the change in ECSA was around 54.6% after 70 h, when the voltage dropped below 0.1 V. In contrast, the MEA with the FeCo-N-C catalyst at the cathode maintains a high voltage for the first 35 hours, followed by a steady, almost linear, decline to 0 V within the next 15 hours. If we compare the time that the voltage degrades within the respective MEAs to 0.1 V, we see that the shortest decay time by far was exhibited by the mTPN1-TMA membrane. Similar decay times were observed for the Sustainion membrane with different cathode catalysts. However, despite the comparable decay times, the overall performance FeCo-N-C catalyst was superior since it extended the period at the higher power by nearly 25%.
Figure 3.
Durability tests of the AEMFC with (a) Sustainion AEM and Pt/C cathode electrode (b) mTPN1-TMA AEM and Pt/C cathode electrode (c) Sustainion AEM and FeCo-N-C cathode electrode where the voltage is plotted as a function of time at a constant current density of 0.15 A/cm2 (d) Sustainion AEM and Pt/C cathode electrode at OCV conditions (no current).
Figure 4.
Cyclic voltammograms of the Sustainion membrane with Pt/C cathode electrode in the H2/N2 gas atmosphere at 600 Celsius after 70 h.
Table 2.
The active Pt surface area change.
| Time(h) | ECSA of Pt (m2/g) | Change (%) |
|---|---|---|
| 0 | 63.78 | N/A |
| 70 | 28.95 | 54.60 |
From the durability data, it became clear that different modalities were responsible for the failure in each case. Furthermore, since the gas flows were similar in all cases, we performed micro-CT on the MEAs before and after the durability testing in order to visualize internal changes of the catalyst layers. This technique allows for 3D imaging of the entire sample, from multiple angles, where issues of sample uniformity can be addressed.
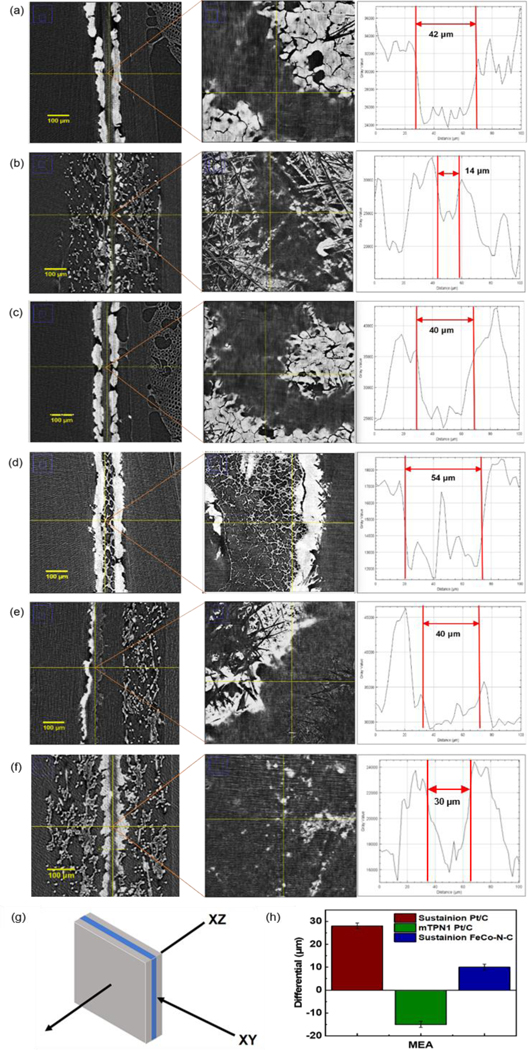
The micro-CT scans obtained from the three MEAs studied are shown in Figure 5, where images were obtained after 5 hours of operation and compared to the images obtained after failure. In the figure we show cross sections obtained edge-on, along the XY plane, and along the XZ plane, normal to the MEA. The contrast obtained in the images is derived from the large differential in atomic number between the metal catalysts, the carbon support, and the membrane. Comparing the images obtained after 5 hours of operation of the MEAs with Pt/C at both electrodes, we find no significant differences between the mTPN1-TMA and Sustainion membranes [Figure 5(a) and 5(c)]. Cross-sectional analysis of the X-ray intensity obtained from the XY images, as shown, indicates that after 5 hours of operation, the membrane thicknesses are 42 μm and 40 μm respectively, for the Sustainion and mTPN1-TMA membranes. Larger magnification images obtained along the XZ plane allows us to clearly view the membranes, where we again see that the membranes are clear with no accumulated catalyst. No Pt edge or lines, similar to the ones reported for the PEM fuel cells are observed in either of the membranes. Striking differences though are observed in the morphology of the membranes after failure. In the case of the Sustainion membrane with the Pt/C electrodes, the Pt seems to have been greatly eroded from the region of the membrane and dispersed within the carbon support, consistent with the cyclic voltammetry indicating large losses.
Figure 5.
micro-CT images obtained in the XY and XZ planes and thickness of MEAs assembled with (a) Sustainion AEM and Pt/C cathode electrode after 5 h (b) and after 70 h; (c) mTPN1-TMA AEM and Pt/C cathode electrode after 5 h (d) after 19 h; (e) Sustainion AEM with FeCo-N-C cathode electrode after 52 h; (f) Sustainion AEM and Pt/C cathode electrode at OCV conditions (no current) after 184 h; (g) Image representation of MEA with XY and XZ plane; (h) The thickness differential in the membranes of MEAs operated for 5 h and after failure at times above.
Closer examination of the images obtained along the XZ plane shows that the thick Pt layer, with the uniform interface, observed after 5 hours of operation, had decomposed into thin Pt fingers extending all through the membrane [Figure 5(b)]. The Pourbaix diagram for Pt shows that at the operating potential of 0.6V, or where we observe the plateau, the stable phase for the ions is Pt(OH)2, which can be easily formed from the catalyst layer and the OH- stream produced at the cathode. Pt ions can therefore undergo dissolution, and diffuse through the membrane, as Pt(OH)2, which can then be either reduced by the crossover front of H2, as observed in PEM fuel cells, or more likely free ionic charges within the disintegrating membranes nucleating the rod-like mesh of Pt structures shown. In this case the membranes are so unstable that the Pt band observed in PEMFCs cannot be developed (no single front but many fronts depending on local membrane degradation). This mode of dissociation and diffusion at low potential, being driven by oxide formation, is consistent with the model suggested by Cherevko, where the high pH~10 of the AEM fuel cells ensures the stability of the oxides and increases the probability of dissolution relative to PEMFC where the oxides are metastable. [43] This hypothesis was further investigated by performing the durability test under OCV conditions and the data is shown in Figure 3(d). Comparing Figures 3(a) and 3(d), we can see that in the absence of current, the voltage still decreases, but the durability of the AEM is much longer, reaching 0.4 V after 184 hours of operation, as opposed to only 25 hours under constant current conditions at 0.15 A/cm2. The corresponding micro-CT images shown in Figure 5(f) shows degradation of the Pt catalyst, but with a much smaller amount nucleated within the membrane.
From the associated cross-sections obtained from the MEAs following 70 hours of operation under the constant current conditions stated, we find that the membrane thickness is now reduced to approximately 14 μm, indicating that unzipping of the polymer was also occurring, which would be consistent with charged groups on the polymer backbone being exposed, reducing the Pt(OH)2, and causing metallic deposition within the membrane. The power generated as a function of operational time shown above can then be interpreted as an initial region where the Pt catalyst is mostly intact, followed by a plateau around 0.6V, where Pt ion dissolution is occurring and being carried along to the cathode with the OH- ions, in its most probable state (according to the Pourbaix diagram) as Pt(OH)2. The decrease in membrane thickness is consistent with unzipping of the polymer backbone exposing functional groups which further reduced the Pt ion complex and precipitate Pt metal within the membrane. This results in decreased current at the anode, reducing the power of the MEA, until finally, a complete electrical short of the fuel cell occurs. Under OCV conditions, Pt ion formation still occurs, and we still observe a significant decrease in membrane thickness, but since the flow of (OH)- ions is decreased, Pt(OH)2 are not constantly removed from the system and hence their formation is decreased, increasing the durability. These results agree with the OCV experiments conducted by Kirk et al, where potential gradient migration of Pt ions was also observed. [36] In Figure 5(f), we show the XY plane, where some deposition of Pt is still observed. This is in contrast to Kirk et al, where no deposition within the membrane was reported, possibly due to different membrane compositions. The dependence on membrane chemistry is further highlighted by the data obtained from the mTPN1-TMA membrane. From the images in Figure 5(d) we see that the Pt/C layers at both anode and cathode are still mostly intact, and the thickness of the membrane is mostly unchanged from its initial values. On the other hand, a fine network of Pt is seen, which completely spans the membrane shorting the electrodes. In this case, the diffusion of the Pt ions was minimal into the carbon support, but greatly accelerated into the membrane, consistent with greater exposure of the charge-carrying groups inherent in this chemistry. [45] In addition to chemical decomposition, possibly aided by the presence of Pt oxide ions, gas crossover can also increase, as the membrane thins, or is strained by metallic deposits, further hastening the decomposition, and possibly accounting for the different rates with which the power was reduced in the MEAs with different membranes.
In Figure 5(e) we also show the images obtained for the Sustanion membrane with FeCo-N-C at the cathode. In this case, the membrane appears intact, and its thickness is comparable to the initial thickness of 42 μm after 5 hours of operation. The loss of power observed for this MEA appears to be due to a simple depletion of the FeCo-N-C catalyst, which would also explain the long plateau at high power, where no membrane degradation is occurring and the sharp sudden failure, which would occur if the catalyst was suddenly exhausted. The method of degradation of Fe-N-C catalysts is far more complex than that of Pt, where multiple pathways have been proposed, especially for alloys, and as a result, it has also been shown that the rate of degradation occurs at lower voltages and is more rapid, especially under alkaline conditions. [46] In addition, while the Pourbaix diagram for alloys is more complicated, the stable forms of oxides for Fe and Co ions under alkaline conditions at pH~10 are Fe2O3 and Co(OH)2. Hence it is not surprising that the catalyst is exhausted more rapidly and interacts differently with the membrane polymer.
Micro-CT is unable to identify the elemental composition of the catalysts, and therefore the MEAs were microtomed and SEM-EDX was performed on the sections, as shown in Figure 6. In Figure 6(a), we show backscattered electron images and the corresponding EDX mapping images obtained from the Pt trace in an MEA at time t=0. From the Figure we can see that the interface with the membrane is sharp, and most of Pt is concentrated in the electrodes. The membrane thickness is seen to be 46 μm, or slightly compressed relative to the original thickness of 50 μm. This is consistent with previously reported softening of the membranes followed by a slight compression, which actually enhances the power output. [32] After 5 hours of operation, the measured thickness is 42 μm, or relatively unchanged. This value, obtained from only a limited section of the MEA, is consistent with the measurements obtained from the micro-CT images over the entire MEA region, confirming the initial uniformity of the membrane thickness. A drastic change in thickness is observed after 70 hours of operation, where the average value obtained, 14 μm, is also in good agreement with the value obtained in the micro-CT scans. Careful observation of both the micro-CT scans and the SEM images shows sections where the membrane is completely degraded, allowing the anode and cathode to electrically short out. The Pt fluorescence maps obtained from the EDX spectra are also shown in Figure 6. From the figures, we see that at times t=0 and 5 hours, the thickness of the Pt catalyst layer at the cathode and anode are comparable, and the interface with the membrane is relatively sharp indicating that degradation of the Pt catalyst had not occurred. After 70 hours of operation though, degradation of the Pt catalyst layer is evident where the uniform dissolution of the Pt into the carbon support is clearly observed at both cathode and anode.
Figure 6.
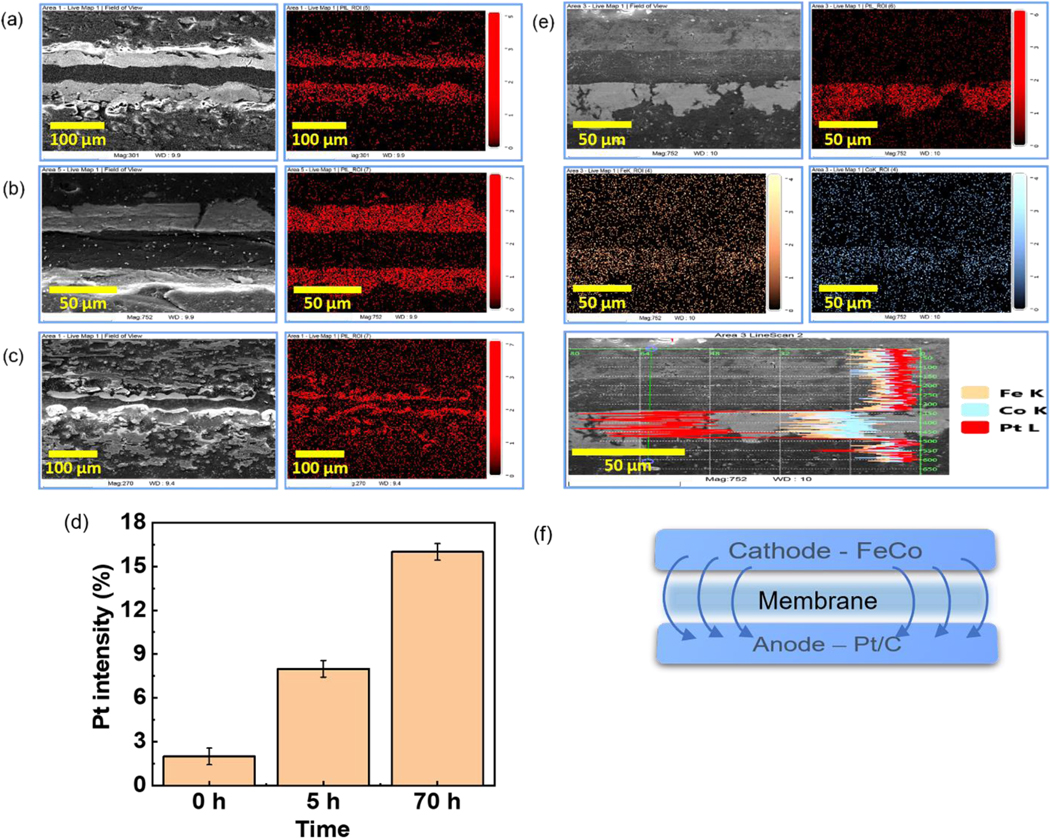
SEM-EDX of sample MEAs with (a) Sustainion AEM and Pt/C cathode electrode after 0 h (b) 5 h and (c) 70 h. (d) Comparison of Pt intensity in the membrane after 0 h, 5 h and 70 h. (e) Sustainion AEM and FeCo-N-C cathode electrode after 52 h. (f) Image representation of MEA with FeCo-N-C catalyst
Even though EDX is not quantitative, we can still estimate the relative changes in concentration as a function of operational time. The relative amounts of Pt per unit area in the membrane are plotted in Figure 6(d), where we can see some background is present initially at t=0, but a significant increase occurs after 5 hours and continues to increase at 70 hours. In Figure 6, we show the SEM images obtained from the MEA with the FeCo-N-C catalyst after operation for 52 hours. In this MEA, Pt/C is only present at the anode, and from the figure, we can see that no significant degradation of the Pt layer has occurred.
A plot of the Fe, Co, and Pt metal concentrations across the MEA is shown in Figure 6(e), where we can see the Fe and Co have both migrated from the cathode and appear to be co-localized within the Pt layer at the anode. In this case, both Fe and Co ions pass through the membrane without being reduced and deposited. Rather, both ions migrate to the Pt layer at the anode, preserving the integrity of the membrane. The recent report of an AEM electrolyzer, using the same Sustainion membranes as those described here, which was able to operate for 1000 hours without significant degradation of the membrane, serves as a possible confirmation of our observation. In this case the authors had substituted Pt based catalysts with Fe-Ni based alloys, and, like in the case of FeCo-N-C catalyst that we used, no significant degradation of the membrane was observed. They did not rule out ion migration in their MEA, but their catalyst load was nearly two orders of magnitude higher than the MEA shown here, consistent with increased operational time. [47]
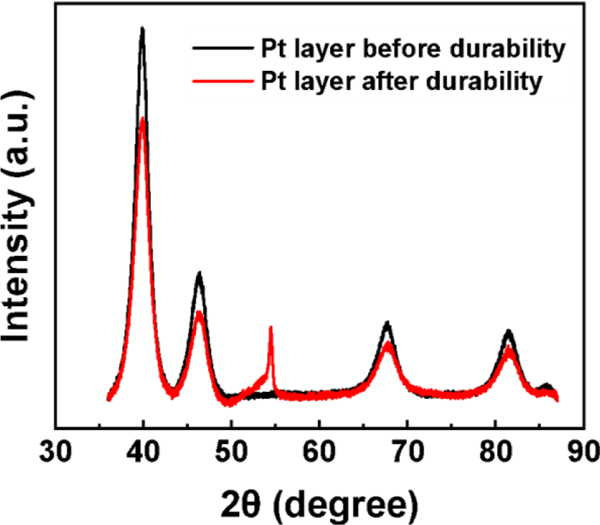
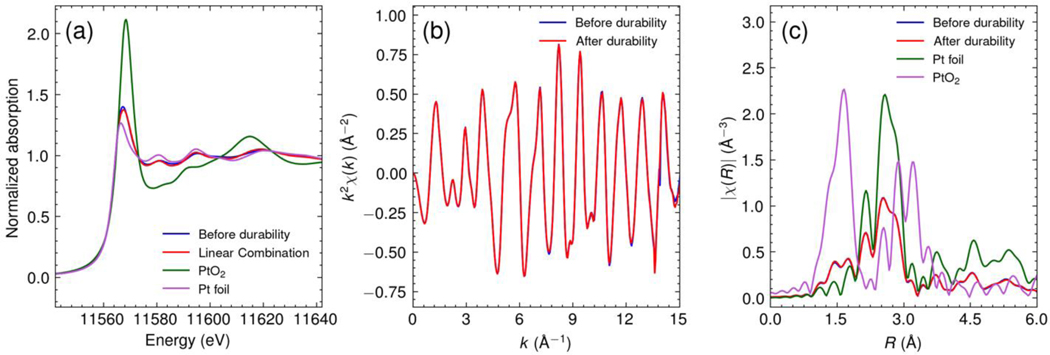
The disintegration of the Pt/C catalyst layer after 70 hours of operation [Figure 5(b) above] and the appearance of Pt within the Sustainion MEA membrane were so unexpected, that we also investigated their molecular nature using XRD and XANES. Comparing the XRD patterns of the MEA at 5 hours and 70 hours in Figure 7 and Table 3, we can see that even though the peak positions correspond to crystalline Pt metal, after the durability test the pattern intensity is reduced and from fitting the peak width, we can infer that the Pt grain size decreased from 6.1 nm to 5.3 nm. While the decreased particle size may enhance catalysis, we also find the emergence of a significant peak corresponding to carbon (004) at 2θ = 54.46 [48] which constituted the support layer of the Pt, consistent with the large bare sections that were apparent in the micro-CT scans, where the Pt had been completely removed. The local chemical structure of the Pt was investigated using XAS (Figure 8). Both the XANES and EXAFS were identical in the two samples, demonstrating no significant changes in oxidation states or local structure of the Pt in the Sustainion MEAs after the durability test. The XANES region was analyzed by linear combination analysis using Pt foil and α-PtO2 as references in the range of 11,542 to 11,602 eV, revealing that the fraction of Pt was 81%, with 19% α-PtO2 within the MEA after 5 hours of operation (Figure S2a). This ratio remained unchanged after an additional 65 hours of operation (Figure S2b), indicating that the fraction of the oxidation state had not changed despite the dissolution of Pt from the anode. The EXAFS spectra in both k and R domains yielded identical spectra before and after the durability test [Figure 8(b)(c)], and the EXAFS fitting results are summarized in Table 1. The first shell coordination numbers of Pt-O were 0.95 and 0.98 for the samples before and after the durability test, respectively. The molar fraction of PtO2 in the sample can be estimated by dividing by the coordination number of Pt-O in α-PtO2, which was calculated as 16% in both samples. This was consistent with the linear combination analysis of XANES spectra, indicating no change in the oxidation state. The first shell Pt-Pt coordination numbers were dominated by the presence of PtO2, and therefore, we scaled the coordination number using Eq. S3, and given in Table 4. The coordination numbers contributed by the Pt were 10.1 and 10.0 for samples before and after the durability test, respectively, which were consistent with the values calculated from the CGS obtained by XRD with the assumption of cuboctahedron shaped nanoparticle. [49, 50] This result also suggests that the local structure of Pt did not change significantly with migration from the cathode followed by nucleation within the membrane. Thus, the failure mechanism does not appear to be associated with any form of chemical poisoning or oxidation of the Pt, but rather a slow dissolution of the Pt from the electrode, causing further disintegration of the membrane potentially causing electrical shorts between the electrodes. Although Fe and Co were also observed to undergo migration from the cathode to the anode, the membrane thickness remained unchanged, indicating that the precipitation of Pt contributed to the disintegration of the MEA membrane.
Figure 7.
XRD pattern of Pt layer before and after durability testing of Sustainion AEM with Pt/C catalyst
Table 3.
XRD results before and after durability testing.
| Sample | a±(Å) | a±(Å) | CGS (nm) | microstrain | a± | RWP (%) |
|---|---|---|---|---|---|---|
| Pt before durability | 3.91954 | 0.00014 | 6.10 | 0.97 | 0.02 | 2.50 |
| Pt after durability | 3.91729 | 0.00011 | 5.30 | 1.18 | 0.03 | 2.20 |
Figure 8.
Pt L3 edge XAS spectra of MEA samples of Sustainion AEM with Pt/C cathode electrode before and after durability test. For comparison, the XAS spectra of standards (Pt foil and α-PtO2) are included. (a) XANES spectra, (b) EXAFS spectra in k space, (c) EXAFS spectra in R space. The k-range of 2 to 14.5 Å−1 and k2 weighting were used in the Fourier transform.
Table 4.
Summary of EXAFS Fitting results of MEA samples of Sustainion AEM with Pt/C cathode electrode before and after durability test.
| Sample | Å | Å | a) | ref: b) | ||
|---|---|---|---|---|---|---|
| Before durability | 2.756±0.003 | 1.99±0.01 | 8.2±0.5 | 0.95±0.21 | 10.1±0.6 | 11.22 |
| After durabilty | 2.756±0.003 | 1.98±0.01 | 8.1±0.5 | 0.98±0.24 | 10.0±0.7 | 11.11 |
The values of CN(Pt-Pt) are ensemble-average over all Pt species. For estimating the coordination numbers pertaining to Pt nanoparticles only, they should be divided by the relative molar fraction of Pt atoms in the nanoparticles, [51, 52] equal to 1 – 0.16 = 0.84, as estimated from the molar fraction of Pt-O using linear combination analysis (vide supra).
The coordination numbers are estimated from the particle diameter obtained by XRD with the assumption of cuboctahedron shape. [49]
Conclusions
In conclusion, using the complementary techniques of micro-CT and SEM-EDX, we have identified the dissolution of the Pt catalyst in combination with reduction of the Pt ions in the membrane, as the primary cause for decreasing the durability and performance of AEMFCs. MEAs were assembled using Sustainion and mTPN1-TMA membranes, which differ substantially in their chemical composition. First, the membranes were placed between Pt/C catalyst electrodes and operated at 0.15 A/cm2 for 5 hours and then until failure. MEA with mTPN1-TMA membrane failed after only 19 hours, while the one with Sustainion failed after 70 hours. Examination of the mTPN1-TMA membrane clearly showed the presence of a Pt lattice that had formed between the electrodes, producing multiple electrical shorts, and causing failure of the MEA. The Sustainion membrane lasted longer but comparing the MEA at 70 hours with the initial value indicates significant shrinking and the presence of Pt domains within the membrane, which again is responsible for the failure. Substitution of Pt/C with FeCo-N-C catalyst at the cathode allowed for a more stable operation, but a decrease in performance was observed after 30 hours. Examination of the MEA after the failure indicated that the Fe and Co had migrated to the anode, thus completely depleting the cathode. However, no precipitation of either of the metal ions within the membrane was observed, leading to the hypothesis that while the potential of the anionic AEMs induces migration of the metal catalyst from cathode to anode, the chemical structure of the membrane will either enable precipitation of metallic regions or simply serve as a charged medium enabling ion conduction.
Supplementary Material
Acknowledgments
The authors acknowledge the access to the facilities at Center for Clean Energy Engineering at University of Connecticut. This work was supported by the Department of Navy award [N00014-29-1-2858] issued by the Office of Naval Research. A.I.F. acknowledges support of this work on XAFS analysis of Pt nanoparticles by the U.S. Department of Energy (DOE), Office of Science, Office of Basic Energy Sciences under grant no. DE-SC0022199. Use of the Stanford Synchrotron Radiation Lightsource, SLAC National Accelerator Laboratory, is supported by the U.S. Department of Energy, Office of Science, Office of Basic Energy Sciences under Contract No. DE-AC02-76SF00515. The SSRL Structural Molecular Biology Program is supported by the DOE Office of Biological and Environmental Research, and by the National Institutes of Health, National Institute of General Medical Sciences (P30GM133894). The contents of this publication are solely the responsibility of the authors and do not necessarily represent the official views of NIGMS or NIH. The authors thank Dr. Ryan Davis for their help with the beamline measurements at beamline 4-1. The authors also thank Mirza A. Shawon for their help with the XRD measurements at Stony Brook University. This study was financially supported by the Estonian Research Council (grant PRG723). This work was partially funded by the Nancy & Stephen Grand Technion Energy Program (GTEP), by the Israeli Science Foundation, grant number 169/22, and by The Israeli Smart Transportation Research Center (ISTRC), grant No. 2070512.
References
- 1.Dekel DR, Journal of Power Sources. 2018, 375, 158–169. [Google Scholar]
- 2.Gottesfeld S, Dekel DR, Page M, Bae C, Yan Y, Zelenay P, and Kim YS, Journal of Power Sources. 2018, 375, 170–184. [Google Scholar]
- 3.Wang L, Zuo X, Raut A, Isseroff R, Xue Y, Zhou Y, Sandhu B, Schein T, Zeliznyak T, and Sharma P, Sustainable Energy & Fuels. 2019, 3, 2725–2732. [Google Scholar]
- 4.Wang L, Bliznakov S, Isseroff R, Zhou Y, Zuo X, Raut A, Wang W, Cuiffo M, Kim T, and Rafailovich MH, Applied Energy. 2020, 261, 114277. [Google Scholar]
- 5.Sharma SK, Sharma PR, Wang L, Pagel M, Borges W, Johnson KI, Raut A, Gu K, Bae C, and Rafailovich M, Sustainable Energy & Fuels. 2022, 6, 3669–3680. [Google Scholar]
- 6.Li S, Cai G, Wu S, Raut A, Borges W, Sharma PR, Sharma SK, Hsiao BS, and Rafailovich M, International Journal of Molecular Sciences. 2022, 23, 15245. [DOI] [PMC free article] [PubMed] [Google Scholar]
- 7.Wang L, Bellini M, Miller HA, and Varcoe JR, Journal of Materials Chemistry A. 2018, 6, 15404–15412. [Google Scholar]
- 8.Wu X, Chen N, Klok HA, Lee YM, and Hu X, Angew Chem Int Ed Engl. 2022, 61, e202114892. [DOI] [PMC free article] [PubMed] [Google Scholar]
- 9.Wang R, Li D, Maurya S, Kim YS, Wu Y, Liu Y, Strmcnik D, Markovic NM, and Stamenkovic VR, Nanoscale Horizons. 2020, 5, 316–324. [Google Scholar]
- 10.Maurya S, Noh S, Matanovic I, Park EJ, Villarrubia CN, Martinez U, Han J, Bae C, and Kim YS, Energy & Environmental Science. 2018, 11, 3283–3291. [Google Scholar]
- 11.Peng H, Li Q, Hu M, Xiao L, Lu J, and Zhuang L, Journal of Power Sources. 2018, 390, 165–167. [Google Scholar]
- 12.Wang J, Zhao Y, Setzler BP, Rojas-Carbonell S, Ben Yehuda C, Amel A, Page M, Wang L, Hu K, and Shi L, Nature Energy. 2019, 4, 392–398. [Google Scholar]
- 13.Dekel DR, Electrochemical Society Meeting Abstracts 242. 2022, 43, 1622 [Google Scholar]
- 14.Singh RK, Davydova ES, Douglin J, Godoy AO, Tan H, Bellini M, Allen BJ, Jankovic J, Miller HA, and Alba‐Rubio AC, Advanced Functional Materials. 2020, 30, 2002087. [Google Scholar]
- 15.Huang G, Mandal M, Peng X, Yang-Neyerlin AC, Pivovar BS, Mustain WE, and Kohl PA, Journal of The Electrochemical Society. 2019, 166, F637. [Google Scholar]
- 16.Douglin JC, Varcoe JR, and Dekel DR, Journal of Power Sources Advances. 2020, 5, 100023. [Google Scholar]
- 17.Liu X, Xie N, Xue J, Li M, Zheng C, Zhang J, Qin Y, Yin Y, Dekel DR, and Guiver MD, Nature Energy. 2022, 7, 329–339. [Google Scholar]
- 18.Ul Hassan N, Mandal M, Huang G, Firouzjaie HA, Kohl PA, and Mustain WE, Advanced Energy Materials. 2020, 10, 2001986. [Google Scholar]
- 19.Merle G, Wessling M, and Nijmeijer K, Journal of Membrane Science. 2011, 377, 1–35. [Google Scholar]
- 20.Ferriday TB and Middleton PH, International Journal of Hydrogen Energy. 2021, 46, 18489–18510. [Google Scholar]
- 21.Mustain WE, Chatenet M, Page M, and Kim YS, Energy & Environmental Science. 2020, 13, 2805–2838. [Google Scholar]
- 22.Mandal M, Huang G, Hassan NU, Peng X, Gu T, Brooks-Starks AH, Bahar B, Mustain WE, and Kohl PA, Journal of The Electrochemical Society. 2019, 167, 054501. [Google Scholar]
- 23.Wierzbicki S, Douglin JC, Kostuch A, Dekel DR, and Kruczała K, The Journal of Physical Chemistry Letters. 2020, 11, 7630–7636. [DOI] [PMC free article] [PubMed] [Google Scholar]
- 24.Lorenz J, Janßen H, Yassin K, Leppin J, Choi Y-W, Cha J-E, Wark M, Brandon S, Dekel DR, and Harms C, ACS Applied Polymer Materials. 2022, 4, 3962–3970 [Google Scholar]
- 25.Yassin K, Rasin IG, Willdorf-Cohen S, Diesendruck CE, Brandon S, and Dekel DR, Journal of Power Sources Advances. 2021, 11, 100066. [Google Scholar]
- 26.Dekel DR, Rasin IG, and Brandon S, Journal of Power Sources. 2019, 420, 118–123. [Google Scholar]
- 27.Piana M, Boccia M, Filpi A, Flammia E, Miller HA, Orsini M, Salusti F, Santiccioli S, Ciardelli F, and Pucci A, Journal of Power Sources. 2010, 195, 5875–5881. [Google Scholar]
- 28.Wright AG, Fan J, Britton B, Weissbach T, Lee H-F, Kitching EA, Peckham TJ, and Holdcroft S, Energy & Environmental Science. 2016, 9, 2130–2142. [Google Scholar]
- 29.Wang X, Sheng W, Shen Y, Liu L, Dai S, and Li N, Journal of Membrane Science. 2019, 587, 117135. [Google Scholar]
- 30.Lin C, Liu X, Yang Q, Wu H, Liu F, Zhang Q, Zhu A, and Liu Q, Journal of Membrane Science. 2019, 585, 90–98. [Google Scholar]
- 31.Dang H-S, Weiber EA, and Jannasch P, Journal of Materials Chemistry A. 2015, 3, 5280–5284. [Google Scholar]
- 32.Raut A, Fang H, Lin Y-C, Sprouster D, Yin Y, Fang Y, Fu S, Sharma S, Wang L, and Bae C, Energy Advances. 2023, 2, 113–122. [Google Scholar]
- 33.Padgett E, Yarlagadda V, Holtz ME, Ko M, Levin BD, Kukreja RS, Ziegelbauer JM, Andrews RN, Ilavsky J, and Kongkanand A, Journal of The Electrochemical Society. 2019, 166, F198–F207. [Google Scholar]
- 34.Zhang J, Litteer BA, Gu W, Liu H, and Gasteiger HA, Journal of the electrochemical society. 2007, 154, B1006. [Google Scholar]
- 35.Bi W, Gray GE, and Fuller TF, Electrochemical and Solid-State Letters. 2007, 10, B101. [Google Scholar]
- 36.Xie L. and Kirk DW, Electrocatalysis. 2020, 11, 292–300. [Google Scholar]
- 37.Zadick A, Dubau L, Sergent N, Berthome G, and Chatenet M, ACS Catalysis. 2015, 5, 4819–4824. [Google Scholar]
- 38.Cherevko S, Zeradjanin AR, Keeley GP, and Mayrhofer KJ, Journal of The Electrochemical Society. 2014, 161, H822. [Google Scholar]
- 39.Wang Z, Tada E, and Nishikata A, Journal of The Electrochemical Society. 2016, 163, C853. [PMC free article] [PubMed] [Google Scholar]
- 40.Kaewsai D. and Hunsom M, Nanomaterials. 2018, 8, 299. [DOI] [PMC free article] [PubMed] [Google Scholar]
- 41.Peng X, Omasta TJ, Roller JM, and Mustain WE, Frontiers in Energy. 2017, 11, 299–309. [Google Scholar]
- 42.Pourbaix M, NACE. 1966.
- 43.Cherevko S, Keeley GP, Geiger S, Zeradjanin AR, Hodnik N, Kulyk N, and Mayrhofer KJ, ChemElectroChem. 2015, 2, 1471–1478. [DOI] [PMC free article] [PubMed] [Google Scholar]
- 44.Richard L QC Zengcai Liu Masel, Kutz Robert, Ion-conducting membranes, U.S. Patent, Editor. 2016, Dioxide Materials, Inc., Boca Raton, FL United States. p. 21. [Google Scholar]
- 45.Lee W-H, Park EJ, Han J, Shin DW, Kim YS, and Bae C, ACS Macro Letters. 2017, 6, 566–570. [DOI] [PubMed] [Google Scholar]
- 46.Ku Y-P, Ehelebe K, Hutzler A, Bierling M, Böhm T, Zitolo A, Vorokhta M, Bibent N, Speck FD, Seeberger D, Khalakhan I, Mayrhofer K, Thiele S, Jaouen F. and Cherevko S, Journal of the American Chemical Society. 2022, 144, 9753–9763. [DOI] [PubMed] [Google Scholar]
- 47.Xing J, Zeng Z, Best W, Liu Z, Bonville L, Maric R, and Bliznakov S, Journal of Power Sources. 2023, 558, 232564. [Google Scholar]
- 48.Van Thanh D, Li L-J, Chu C-W, Yen P-J, and Wei K-H, RSC advances. 2014, 4, 6946–6949. [Google Scholar]
- 49.Montejano-Carrizales J, Aguilera-Granja F, and Moran-Lopez J, Nanostructured materials. 1997, 8, 269–287. [Google Scholar]
- 50.Glasner D. and Frenkel AI AIP Conference Proceedings. 2007, 882, 746–748 [Google Scholar]
- 51.Frenkel AI, Zeitschrift für Kristallographie-Crystalline Materials. 2007, 222, 605–611. [DOI] [PMC free article] [PubMed] [Google Scholar]
- 52.Sun Y, Frenkel AI, Isseroff R, Shonbrun C, Forman M, Shin K, Koga T, White H, Zhang L, and Zhu Y, Langmuir. 2006, 22, 807–816. [DOI] [PubMed] [Google Scholar]
Associated Data
This section collects any data citations, data availability statements, or supplementary materials included in this article.


