Abstract
Bromodomain-containing proteins are readers of acetylated lysine and play important roles in cancer. Bromodomain-containing protein 7 (BRD7) is implicated in multiple malignancies; however, there are no selective chemical probes to study its function in disease. Using crystal structures of BRD7 and BRD9 bromodomains (BDs) bound to BRD9-selective ligands, we identified a binding pocket exclusive to BRD7. We synthesized a series of ligands designed to occupy this binding region and identified two inhibitors with increased selectivity toward BRD7, 1–78 and 2–77, which bind with submicromolar affinity to the BRD7 BD. Our binding mode analyses indicate that these ligands occupy a uniquely accessible binding cleft in BRD7 and maintain key interactions with the asparagine and tyrosine residues critical for acetylated lysine binding. Finally, we validated the utility and selectivity of the compounds in cell-based models of prostate cancer.
Graphical Abstract
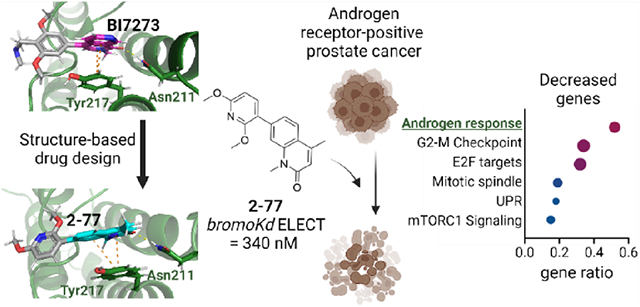
INTRODUCTION
Chromatin remodelers are multi-subunit epigenetic regulators that modulate the accessibility of DNA.1 The BRG1-associated factor (BAF) complexes function as ATP-dependent chromatin remodelers and consist of three biochemically distinct complexes: canonical BAF (cBAF), polybromo-associated BAF (PBAF), and GLTSCR1/like-containing BAF (GBAF or ncBAF) (Figure 1A).2–5 All three types of BAF complexes share the ATPase and several core subunits but also contain unique subunits. BAF complexes are the most frequently mutated chromatin remodeling complex in cancer, and different subunits, in cooperation with the catalytic subunits BRM and BRG1, play crucial roles in regulating chromatin accessibility.6–9 Multiple compounds have been developed to target BAF complex subunits, including small molecules and proteolysis targeting chimeras (PROTACs); however, most of the subunits have yet to be explored as targets in disease.10–27
Figure 1.
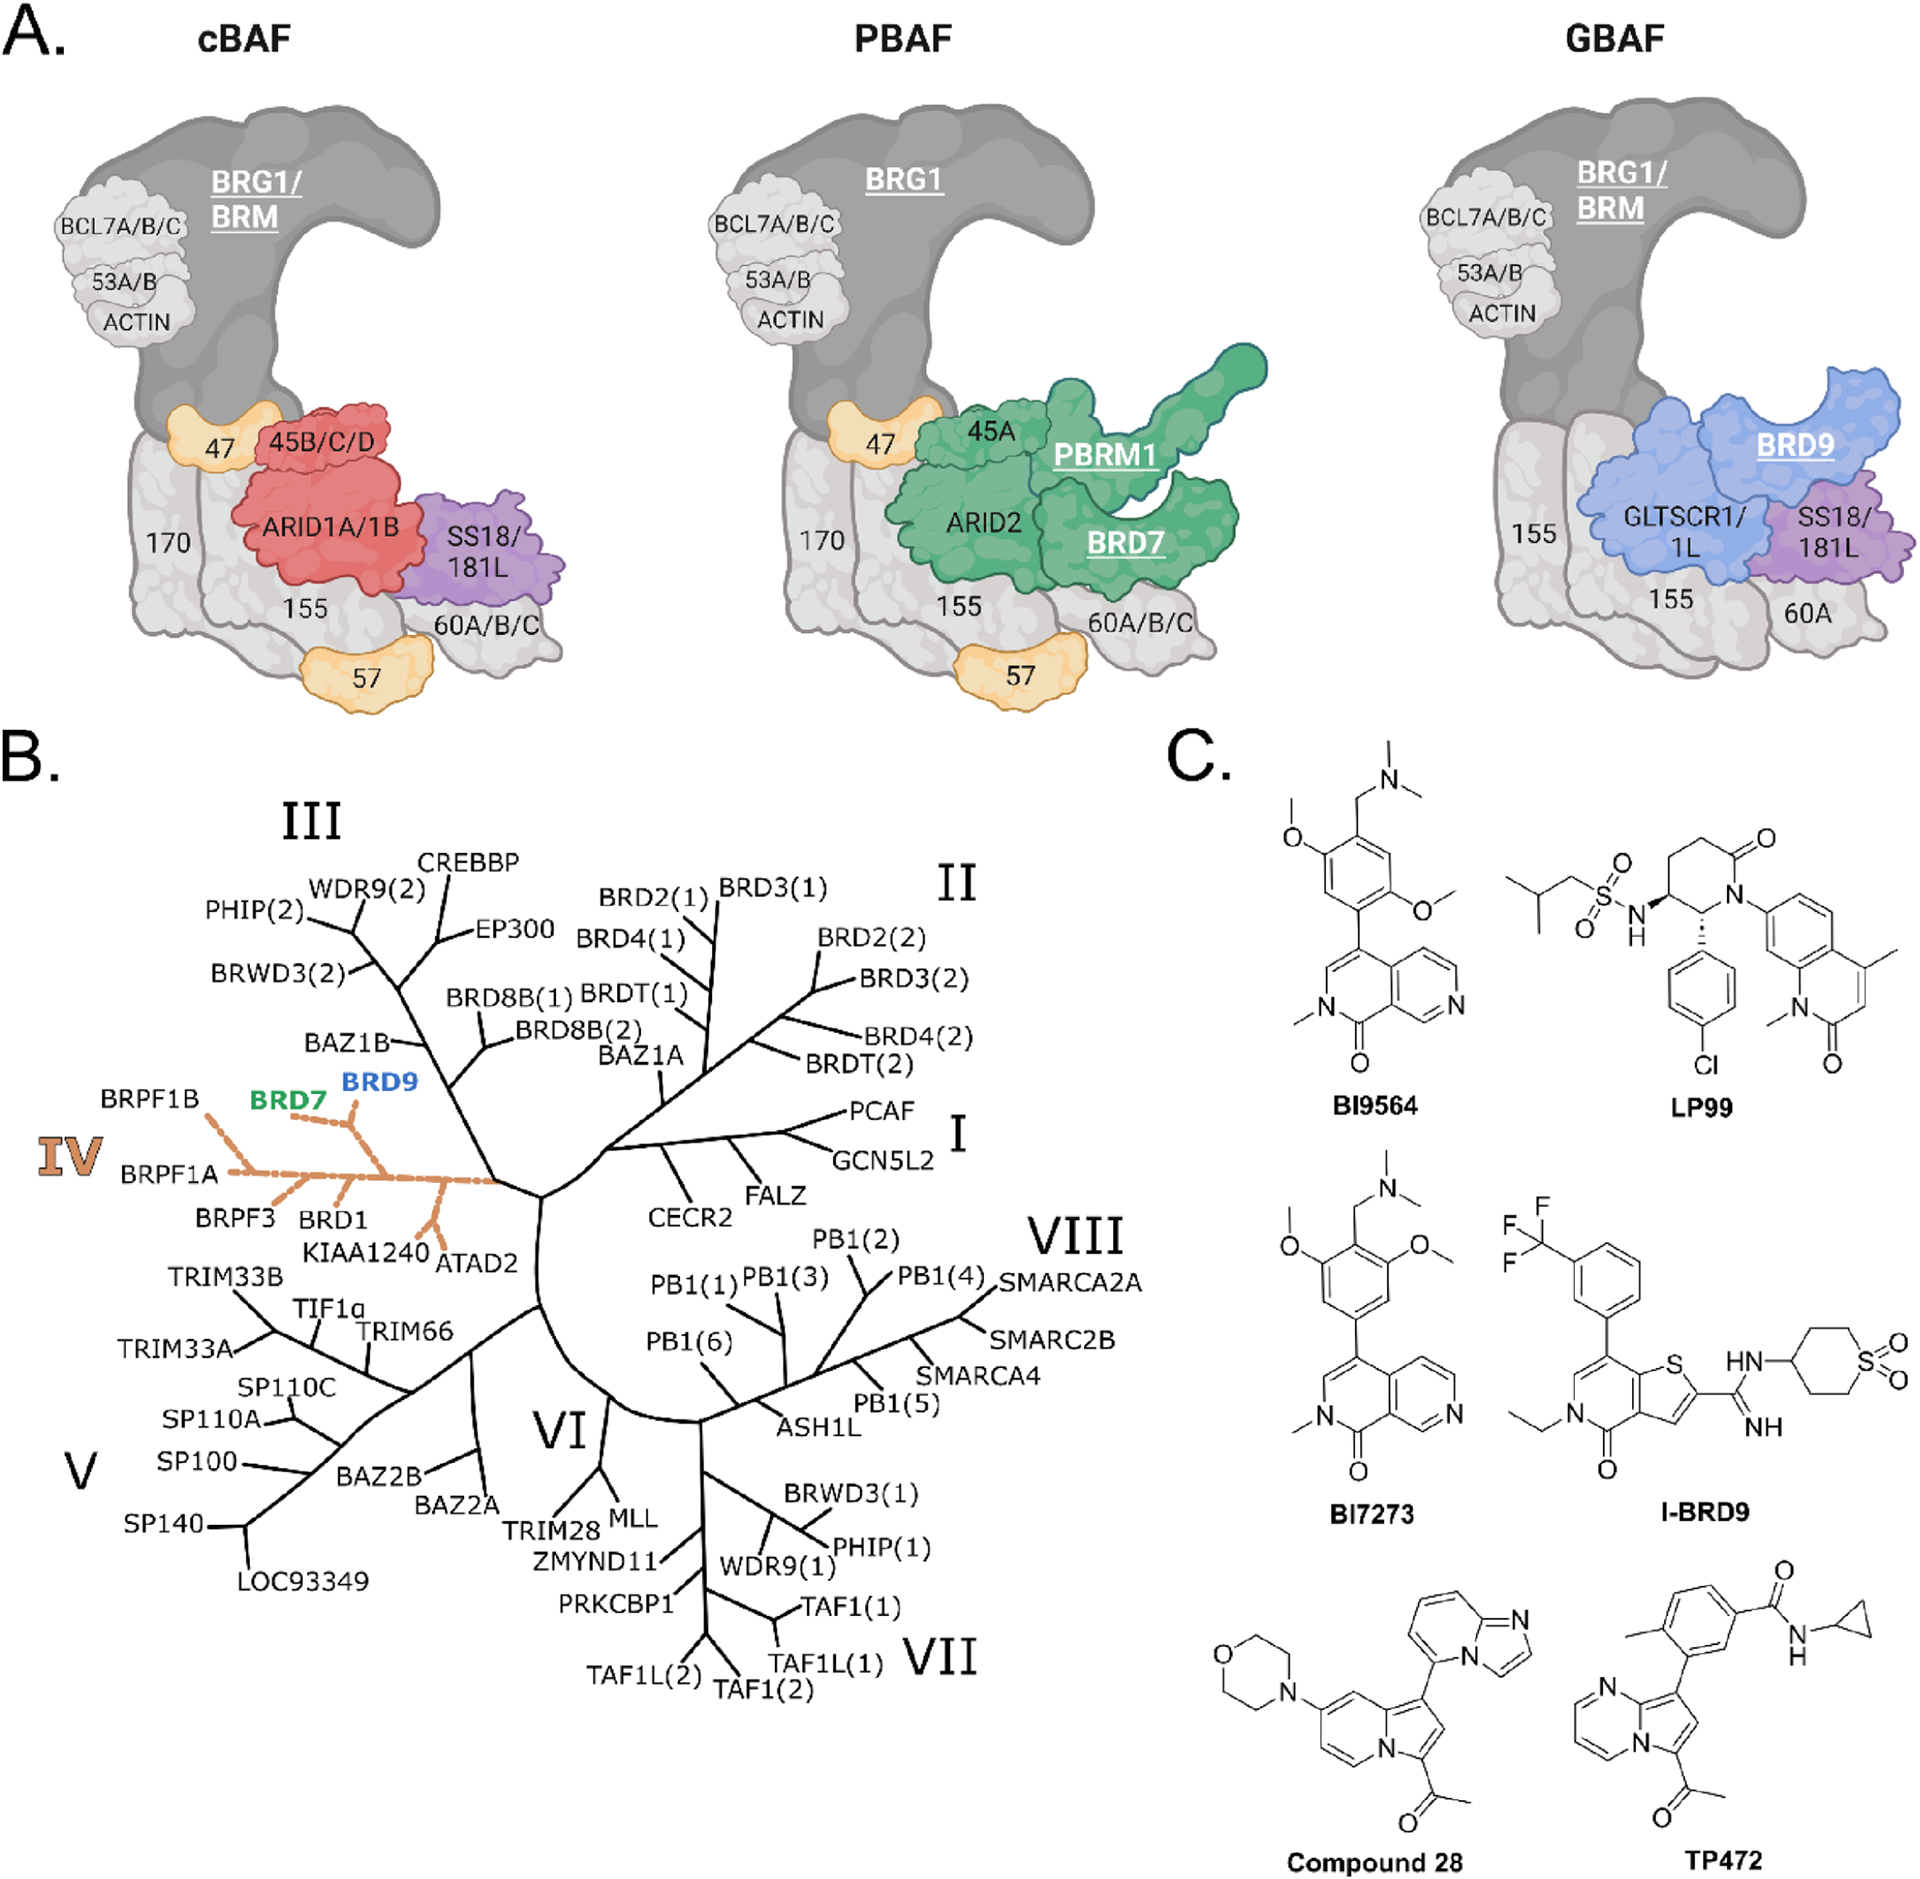
(A) Composition of the three BAF subcomplexes. In dark gray: catalytic subunit; in light gray: subunits shared by all complexes; in yellow: subunits shared by cBAF and PBAF; in purple: subunits shared by BAF and GBAF; in red: cBAF unique subunits; in green: PBAF unique subunits; in blue: GBAF unique subunits. Bromodomain-containing proteins are labeled in underlined white bold font. (B) Phylogenetic BD tree as described by Filippakopoulos et al.28 (C) Reported BRD7/9 ligands with selectivity for BRD9 over BRD7.
In the human proteome, there are 46 bromodomain-containing proteins that are predicted to recognize acetylated Lys in proteins, most commonly histones.28 Bromodomains (BDs) are therapeutic targets in multiple diseases, and several BD inhibitors are currently under phase I, II, or III clinical studies (www.clinicaltrials.gov).29 In the BAF complexes, unique bromodomain-containing subunits, such as bromodomain-containing protein 7 (BRD7) in PBAF or bromodomain-containing protein 9 (BRD9) in GBAF, are likely to mediate a subcomplex-specific function. BRD7 contains a single BD in its structure that belongs to BD family IV (Figure 1B). BRD7 has been reported to be involved in advancing of several types of tumors such as nasopharyngeal carcinoma, osteosarcoma, and colorectal, breast, ovarian, and prostate cancer (PCa), as well as in the regulation of immune response.30–40 Although BRD7 has been implicated in several disease-related roles, there are currently no selective chemical probes to study its potential as a therapeutic target.
Here, we report the development of chemical probes with increased selectivity for BRD7 compared to previously developed ligands for BRD9 (Figure 1C), the closest BD homolog of BRD7 (73.2% sequence identity between the BDs) (Figure S1). We used structure-based drug design and in silico screening to discover two closely related BRD7 BD inhibitors with submicromolar affinity for BRD7. We further validated their efficacy and selectivity in BRD7-dependent PCa cell lines.
RESULTS AND DISCUSSION
Rational Design and Synthesis of BRD7 BD Probes.
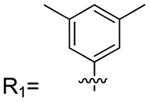
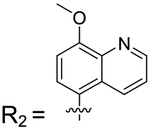
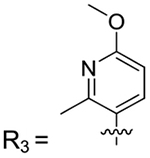
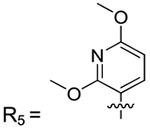
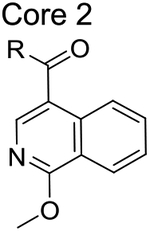
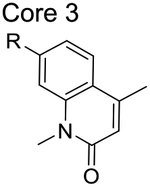
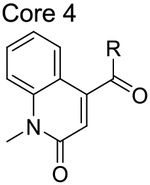
The BRD9 BD inhibitor BI9564 also binds to the closely related BRD7 BD, although with lower affinity (Kd values of 19 and 117 nM, respectively).13 BI9564 forms two hydrogen bonds with BRD9Asn216, a water-mediated hydrogen bond with BRD9Tyr168, a π−π interaction with BRD9Tyr222, a C−H π-interaction with BRD9Ile164, and a T-stacking interaction with BRD9Phe160.13 Although BI9564 also binds to the BRD7 BD, the binding affinity is reduced, potentially due to differences in van der Waals interactions or entropic costs associated with the increased flexibility of BRD7 BD in solution.13,14 To exploit structural differences between the two BDs to develop BRD7-selective inhibitors, we compared the deposited structures of the BRD7 BD (PDB: 5MQ1) and BRD9 BD (PDB: 5F1H) bound to BI9564. We identified an open hydrophobic region adjacent to the acetylated Lys binding pocket in BRD7 BD that is unavailable in BRD9 BD due to the Phe side chain orientation (Figure 2). To achieve selectivity for BRD7 over BRD9, we designed a library of ligands that would accommodate the acetylated Lys binding pocket in a manner similar to known BRD7/9 ligands but also extend into this BRD7-specific binding pocket. The 13 library members contain one of four common cores found in known BRD7/9 ligands, and they were synthesized in one or two steps from commercially available building blocks (Scheme 1). The compounds are summarized in Table 1.
Figure 2.
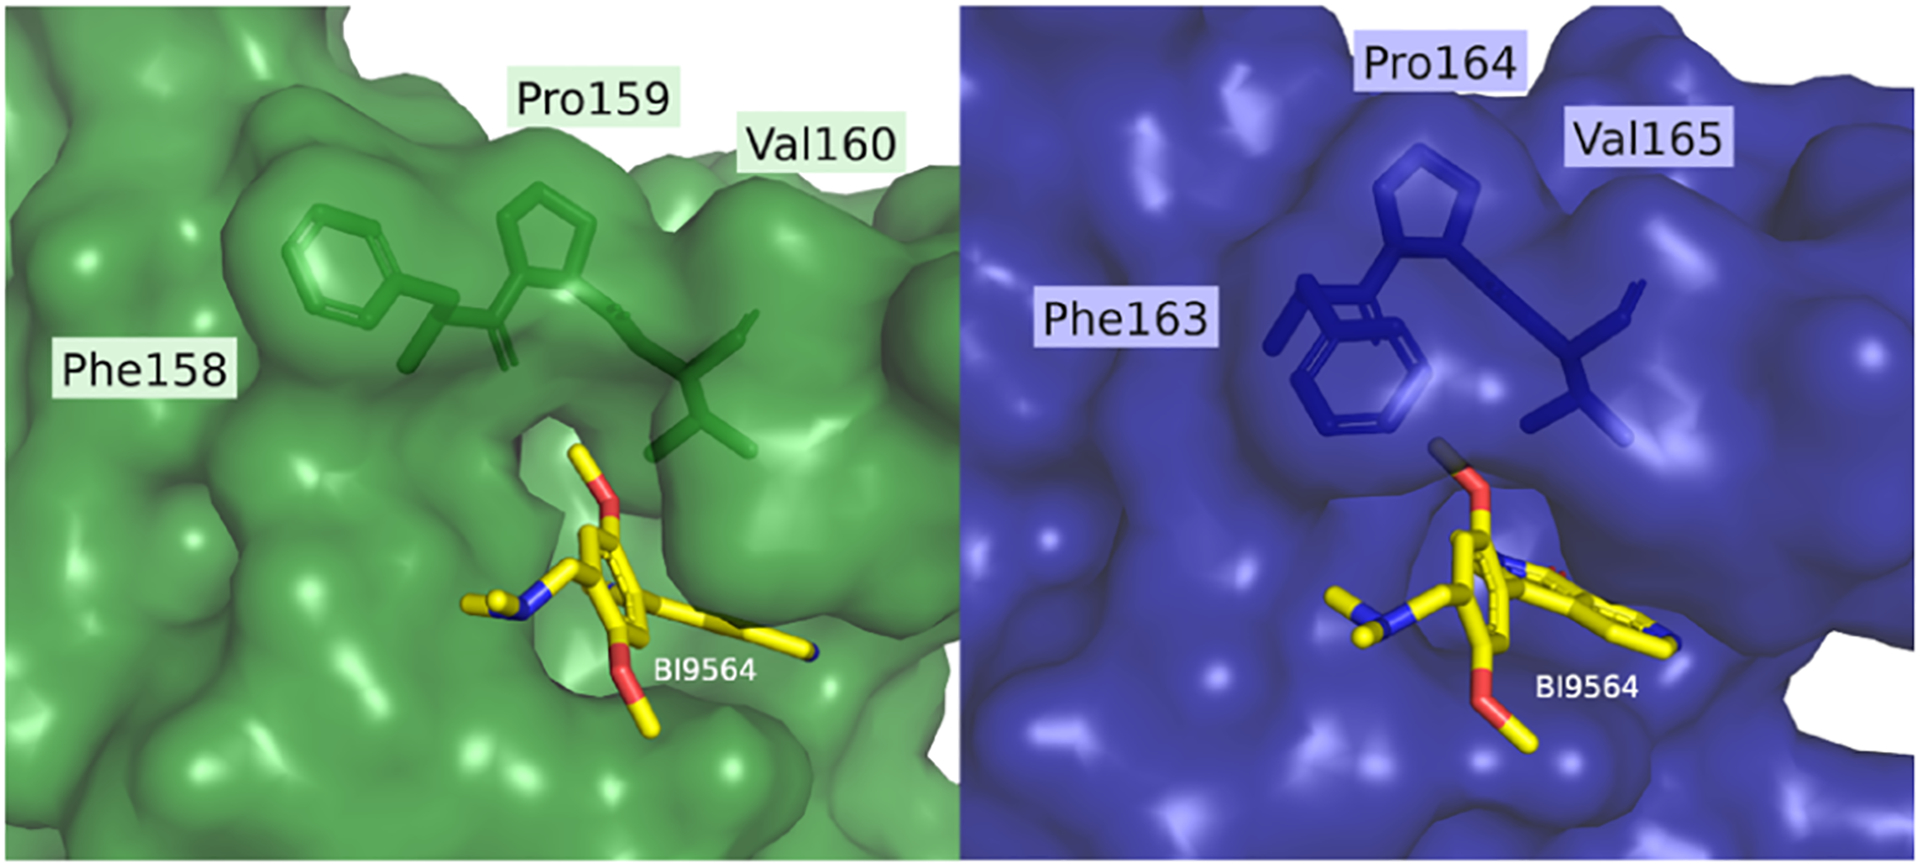
Comparison of the BD binding pockets of BRD7 (left, green; PDB: 5MQ1) and BRD9 (right, blue; PDB: 5F1H) crystallized with BI9564, a known BRD7/9 dual inhibitor. The comparison suggests that BRD7 may allow for a larger hydrophobic moiety than BRD9. Figure created with PyMOL.
Scheme 1.
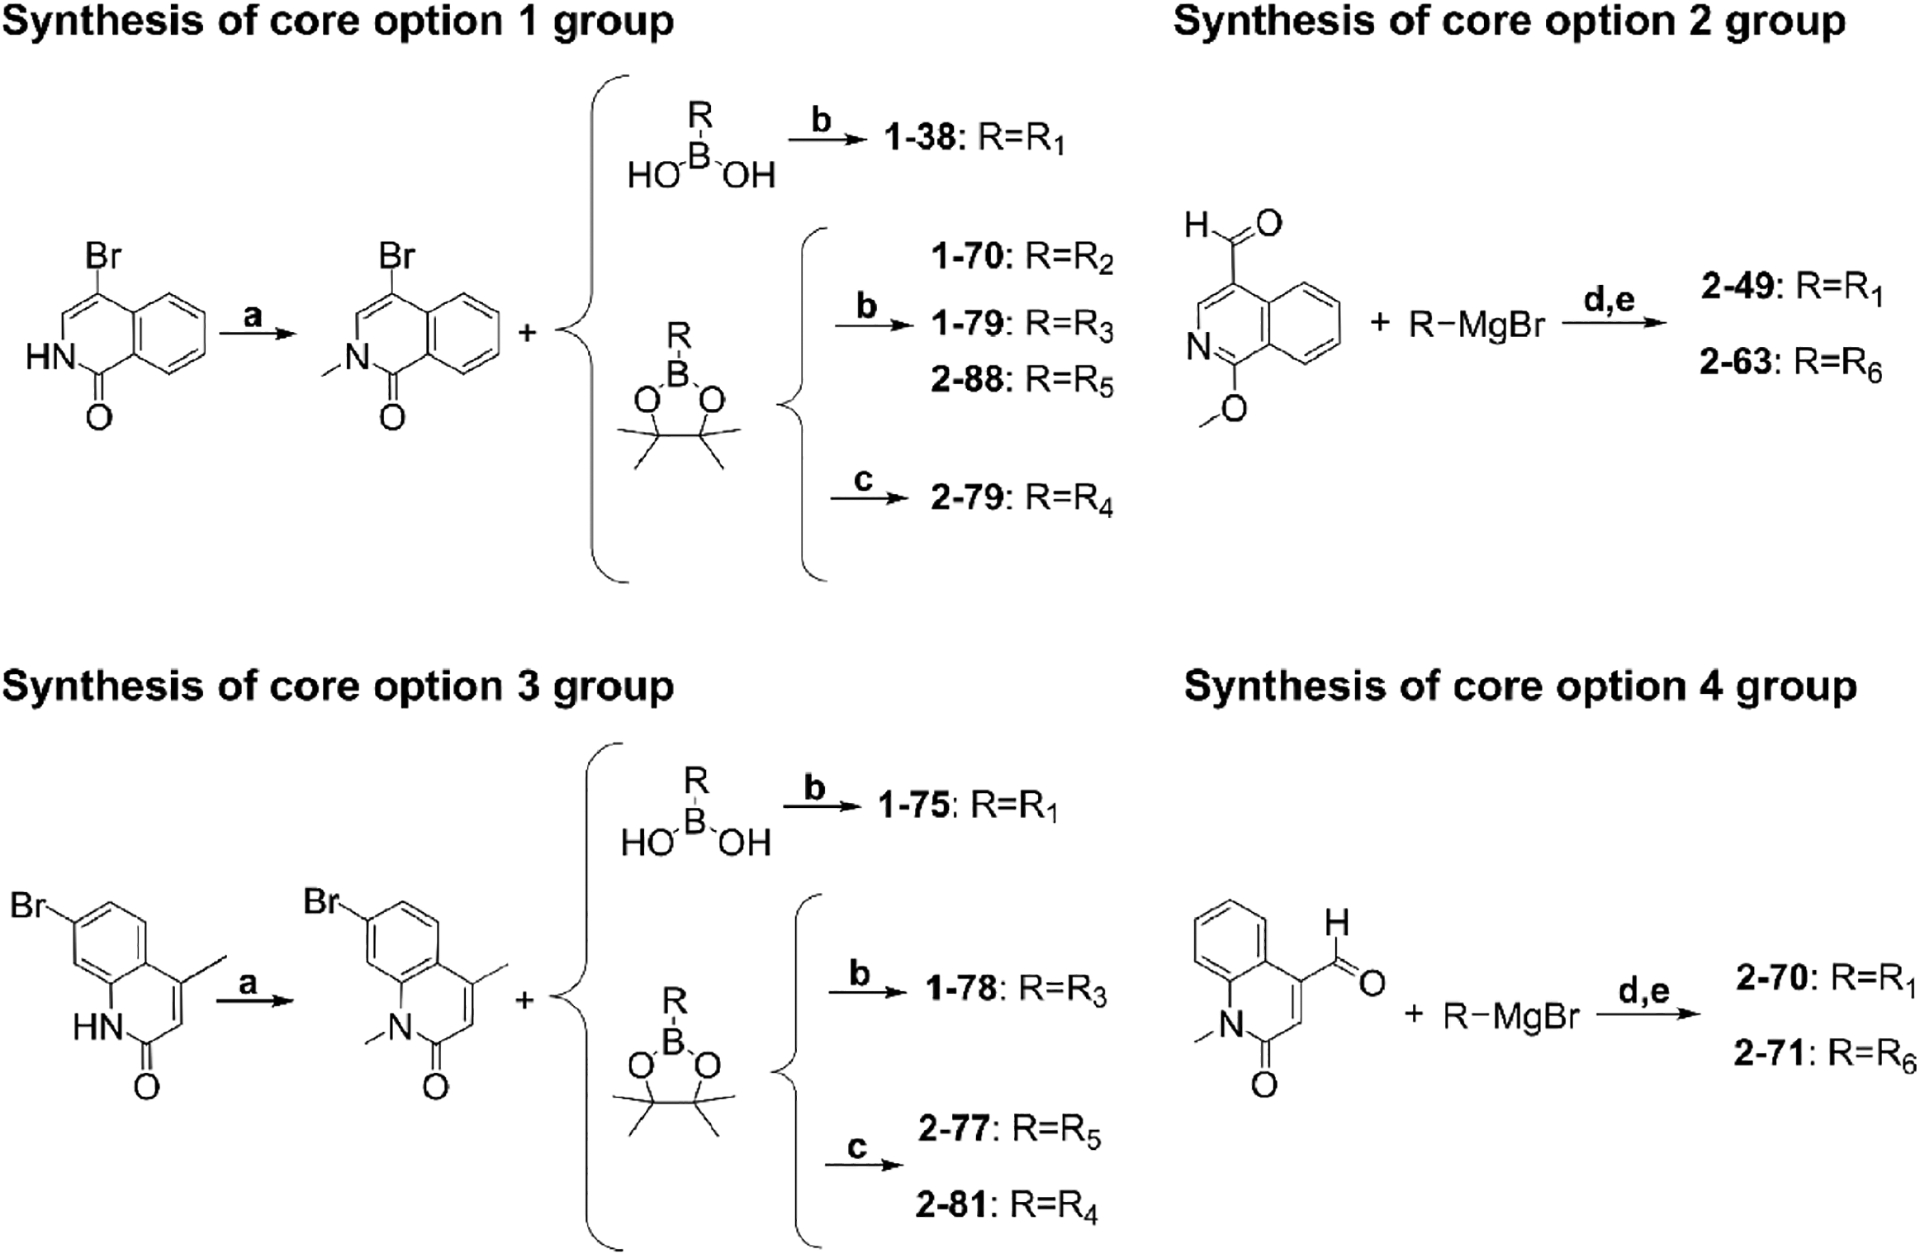
Reagents and Conditions for the Synthesis of Designed BRD7 Inhibitorsa
a(a) NaH, DMF (anhydrous), CH3I at 0 °C warm to rt, 16 h; (b) Pd(dppf)Cl2, Cs2CO3, DMF (anhydrous), reflux, 16 h; (c) Pd(dppf)Cl2, Cs2CO3,, 1,4-dioxane (anhydrous), reflux, 48−72 h; (d) aryl aldehyde in THF at 0 °C, Grignard reagent added over 10 min, then quenched; (e) pyridinium dichromate, DCM.
Table 1.
Structure of the Designed Inhibitors Classified into Four Different Groups
| Group | Compound | R |
|---|---|---|
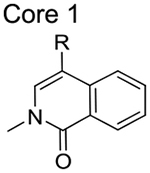
|
1–38 |
|
| 1–70 |
|
|
| 1–79 |
|
|
| 2–79 |

|
|
| 2–88 |
|
|
|
2–49 | R1 |
| 2–63 |

|
|
|
1–75 | R1 |
| 1–78 | R3 | |
| 2–77 | R5 | |
| 2–81 | R4 | |
|
2–70 | R1 |
| 2–71 | R6 |
Thermal Shift Assay (TSA) to Evaluate the Stability of the BRD7 and BRD9 BDs when Bound to the Ligands.
We performed a TSA based on differential scanning fluorimetry to identify compounds that stabilize the BDs and increase the melting temperature (Tm) upon binding. We tested all 13 synthesized compounds along with the dual BRD7/9 inhibitor BI7273, which has a better BRD7 binding profile than BI9564, as a control.13 BI7273 showed binding and stabilization of BRD9 and BRD7 (Figure 3). Of the compounds with core 1, 1–38 stabilized and increased the Tm of BRD7 BD and BRD9 BD, while 2–88 stabilized only BRD9 BD. Of the compounds with cores 2 and 4, none increased the Tm of either of BD. Of the compounds with core 3, 1–78 and 2–77 increased the Tm of BRD7 BD but not BRD9 BD. Therefore, the results from the TSA suggested that 1–78 and 2–77 could bind to BRD7 preferably over BRD9.
Figure 3.
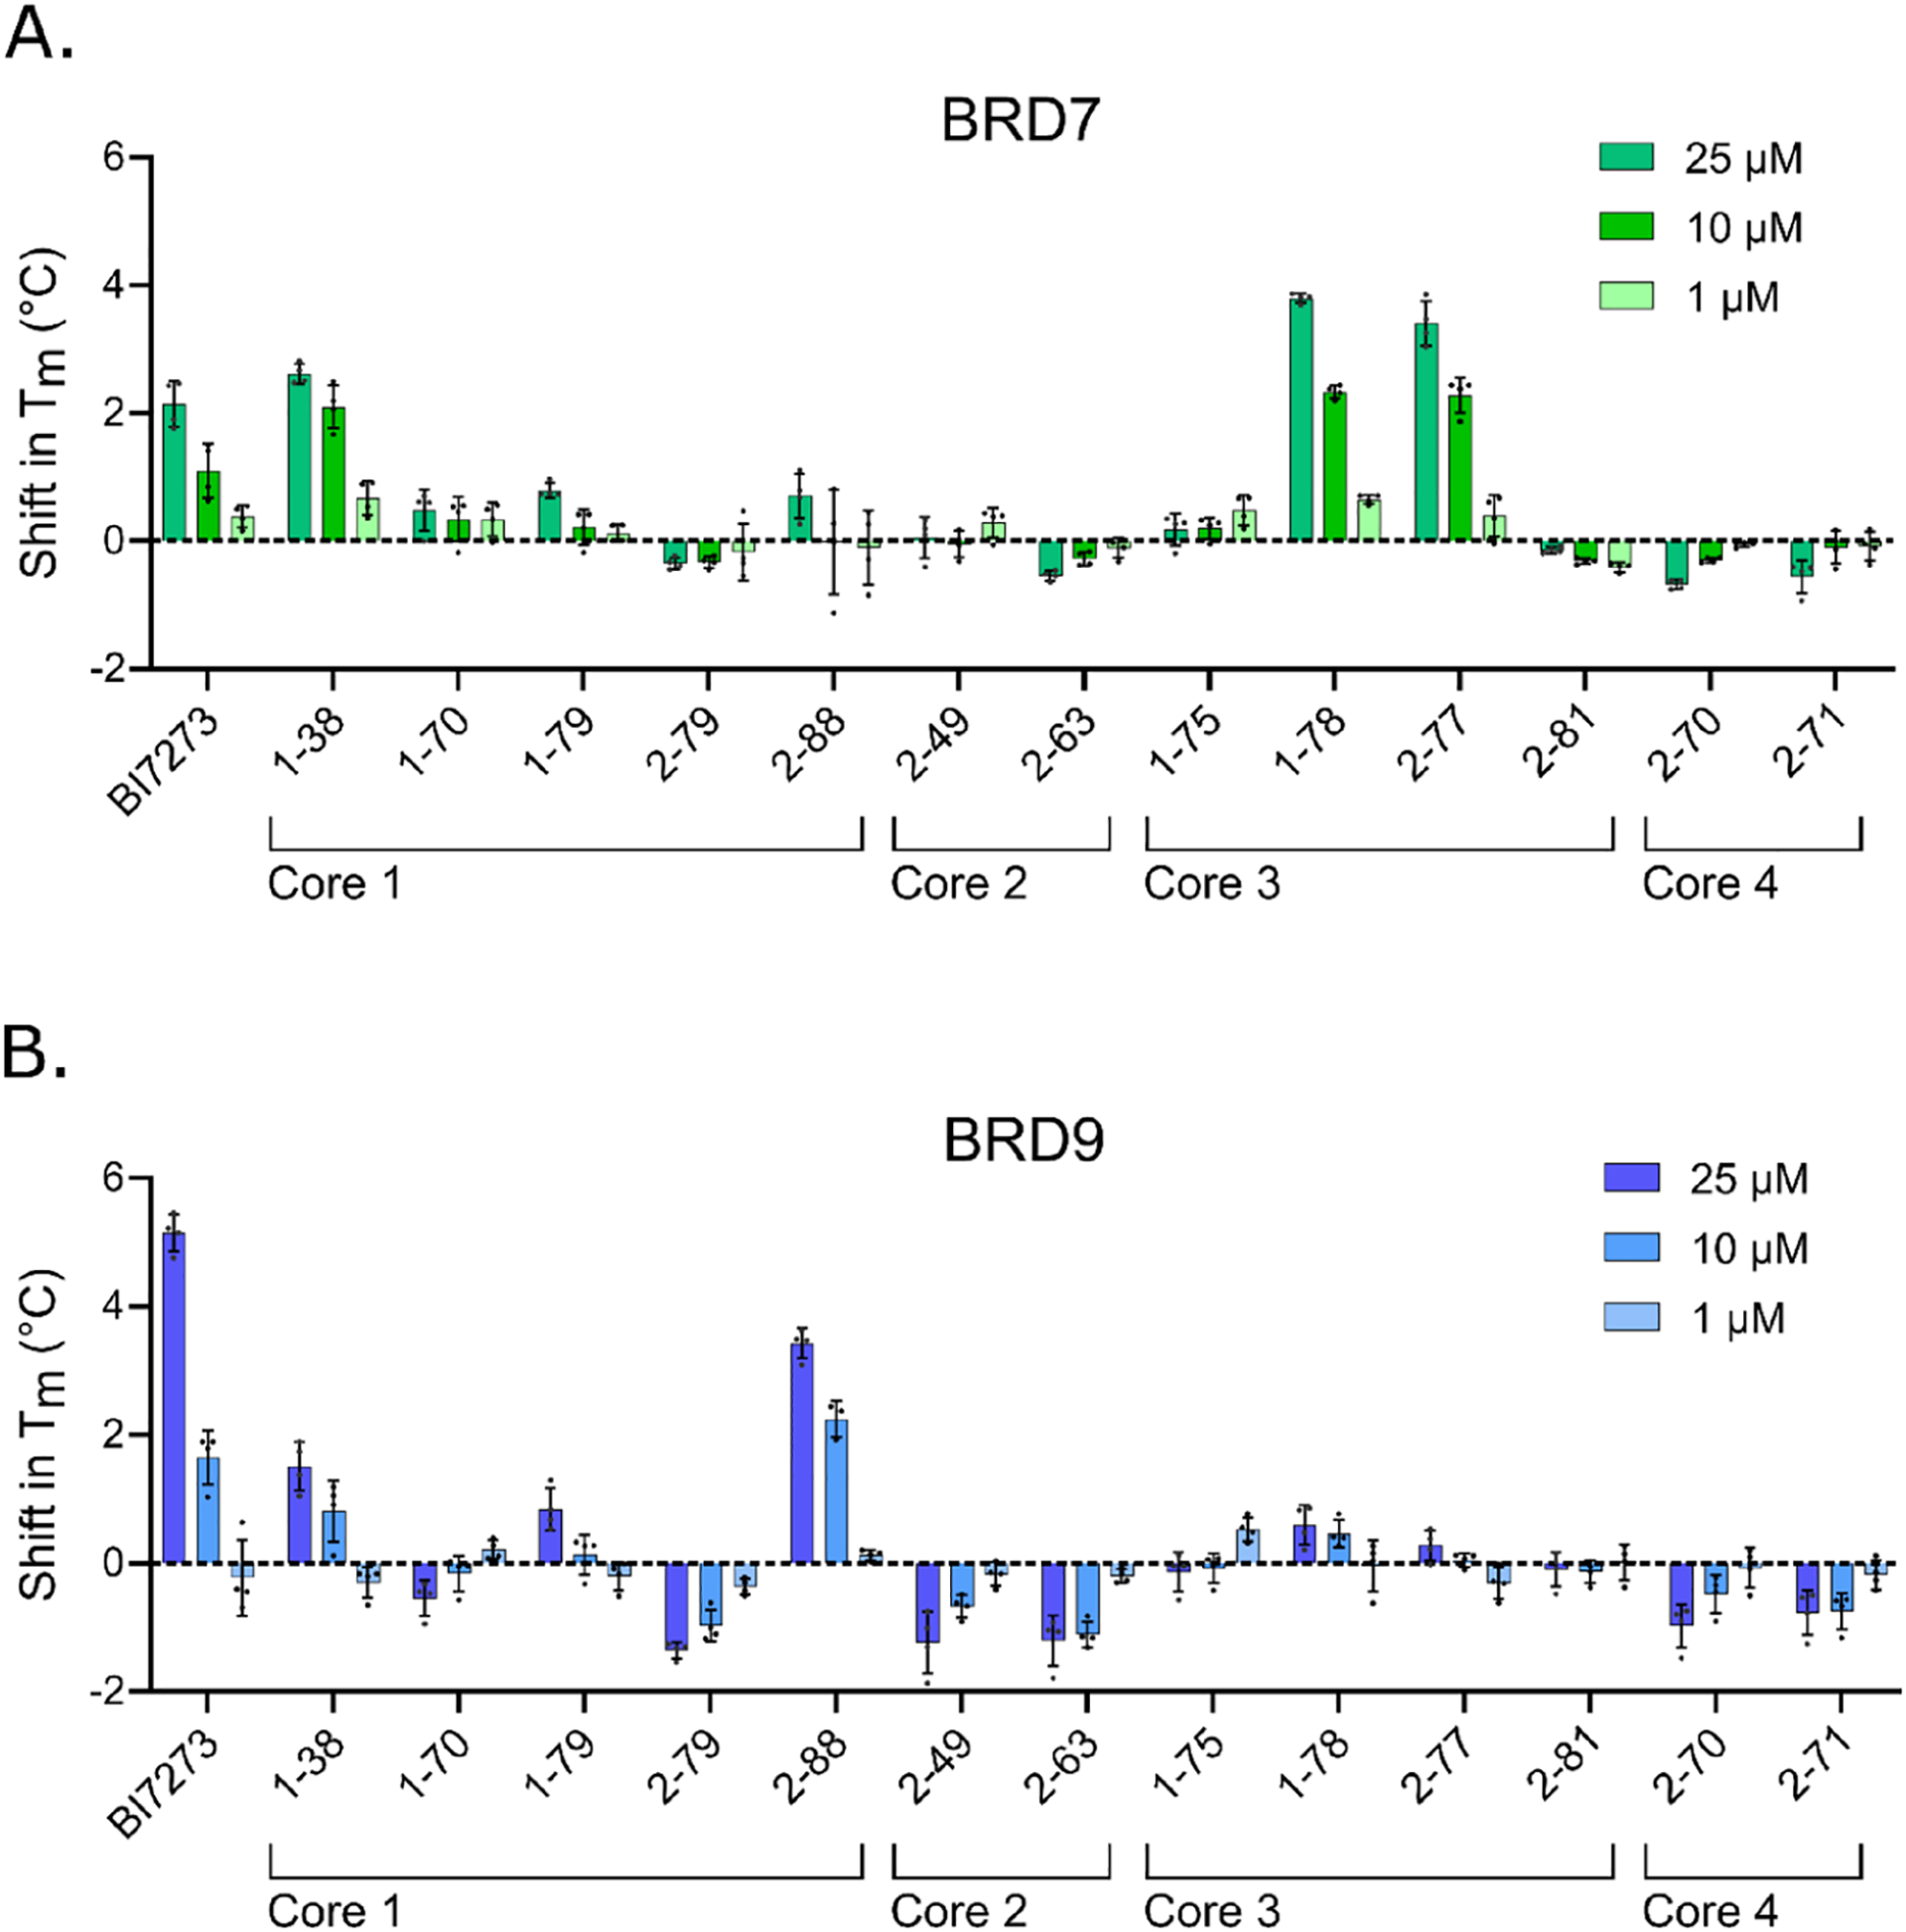
Results from the TSA. Each HIS-tagged BD ((A) BRD7 BD or (B) BRD9 BD) was incubated with the compounds at 25, 10, or 1 μM. The Tm of the proteins was calculated based on differential scanning fluorimetry readings at increasing temperatures from four replicates using nonlinear least squares fit on GraphPad Prism 9. The shift in Tm was calculated with respect to vehicle control.
Competitive Fluorescence Polarization (FP) and Microscale Thermophoresis (MST) Assays Show that 1–78 and 2–77 Are Selective for BRD7 over BRD9.
To further characterize the compounds, we developed a fluorescently labeled probe, BI-FAMa, that consists of BI7273, a 4-carbon linker, and a fluorescein (FAM) label for use in a competitive FP assay (Scheme 2). We characterized BI-FAMa binding to the BRD7 and BRD9 BDs and calculated a Kd of 509 nM for BRD9 and a Kd > 10 μM for BRD7 (Figure 4A,B). For successfully carrying out a competitive FP assay with BRD7, a probe with a lower Kd value was required to saturate the system at a soluble protein concentration. With this in mind, we developed BI-FAMb with a 6-carbon linker to give more flexibility to the molecule (Scheme 2). This fluorescent probe had Kd values of 705 nM for BRD7 and 24 nM for BRD9, which were more comparable to the reported Kd value for BI7273 and suitable for a competitive FP assay (Figure 4C,D). For the competitive assay, we used concentrations of 5 and 0.25 μM of BRD7 BD and BRD9 BD, respectively, to achieve approximately 90% saturation of the FP signal observed in the direct binding experiment. We tested the compounds and BI7273 as a control in decreasing doses starting at 25 μM. Four of the inhibitors bound to both proteins: 1–38 and 2–88 from core 1 and 1–78 and 2–77 from core 3 (Figures S2 and S3). Using representative IC50 values obtained from the competition assay and the apparent Kd of each protein for BI-FAMb, we estimated Ki values for each of the compounds employing the equation reported by Cer et al. (explained in detail in Experimental Section) (Table 2).41 As expected, the calculated Ki of BI7273 was almost 20-fold lower for BRD9 than for BRD7. In addition, compounds 1–38 and 2–88 showed selectivity for BRD9 over BRD7, and 1–78 and 2–77 showed selectivity for BRD7 over BRD9, which aligns with the results obtained from the TSA. We also performed a direct binding assay with fluorescently tagged BRD7 BD and BRD9 BD using MST. The MST measurements show that 1–78 and 2–77 bind to BRD7 with average Kd values of 1.2 and 2.2 μM, respectively, while showing no binding to BRD9 (Figure S4). The results from the FP and MST assays further supported 1–78 and 2–77 as inhibitors with selectivity toward BRD7.
Scheme 2.
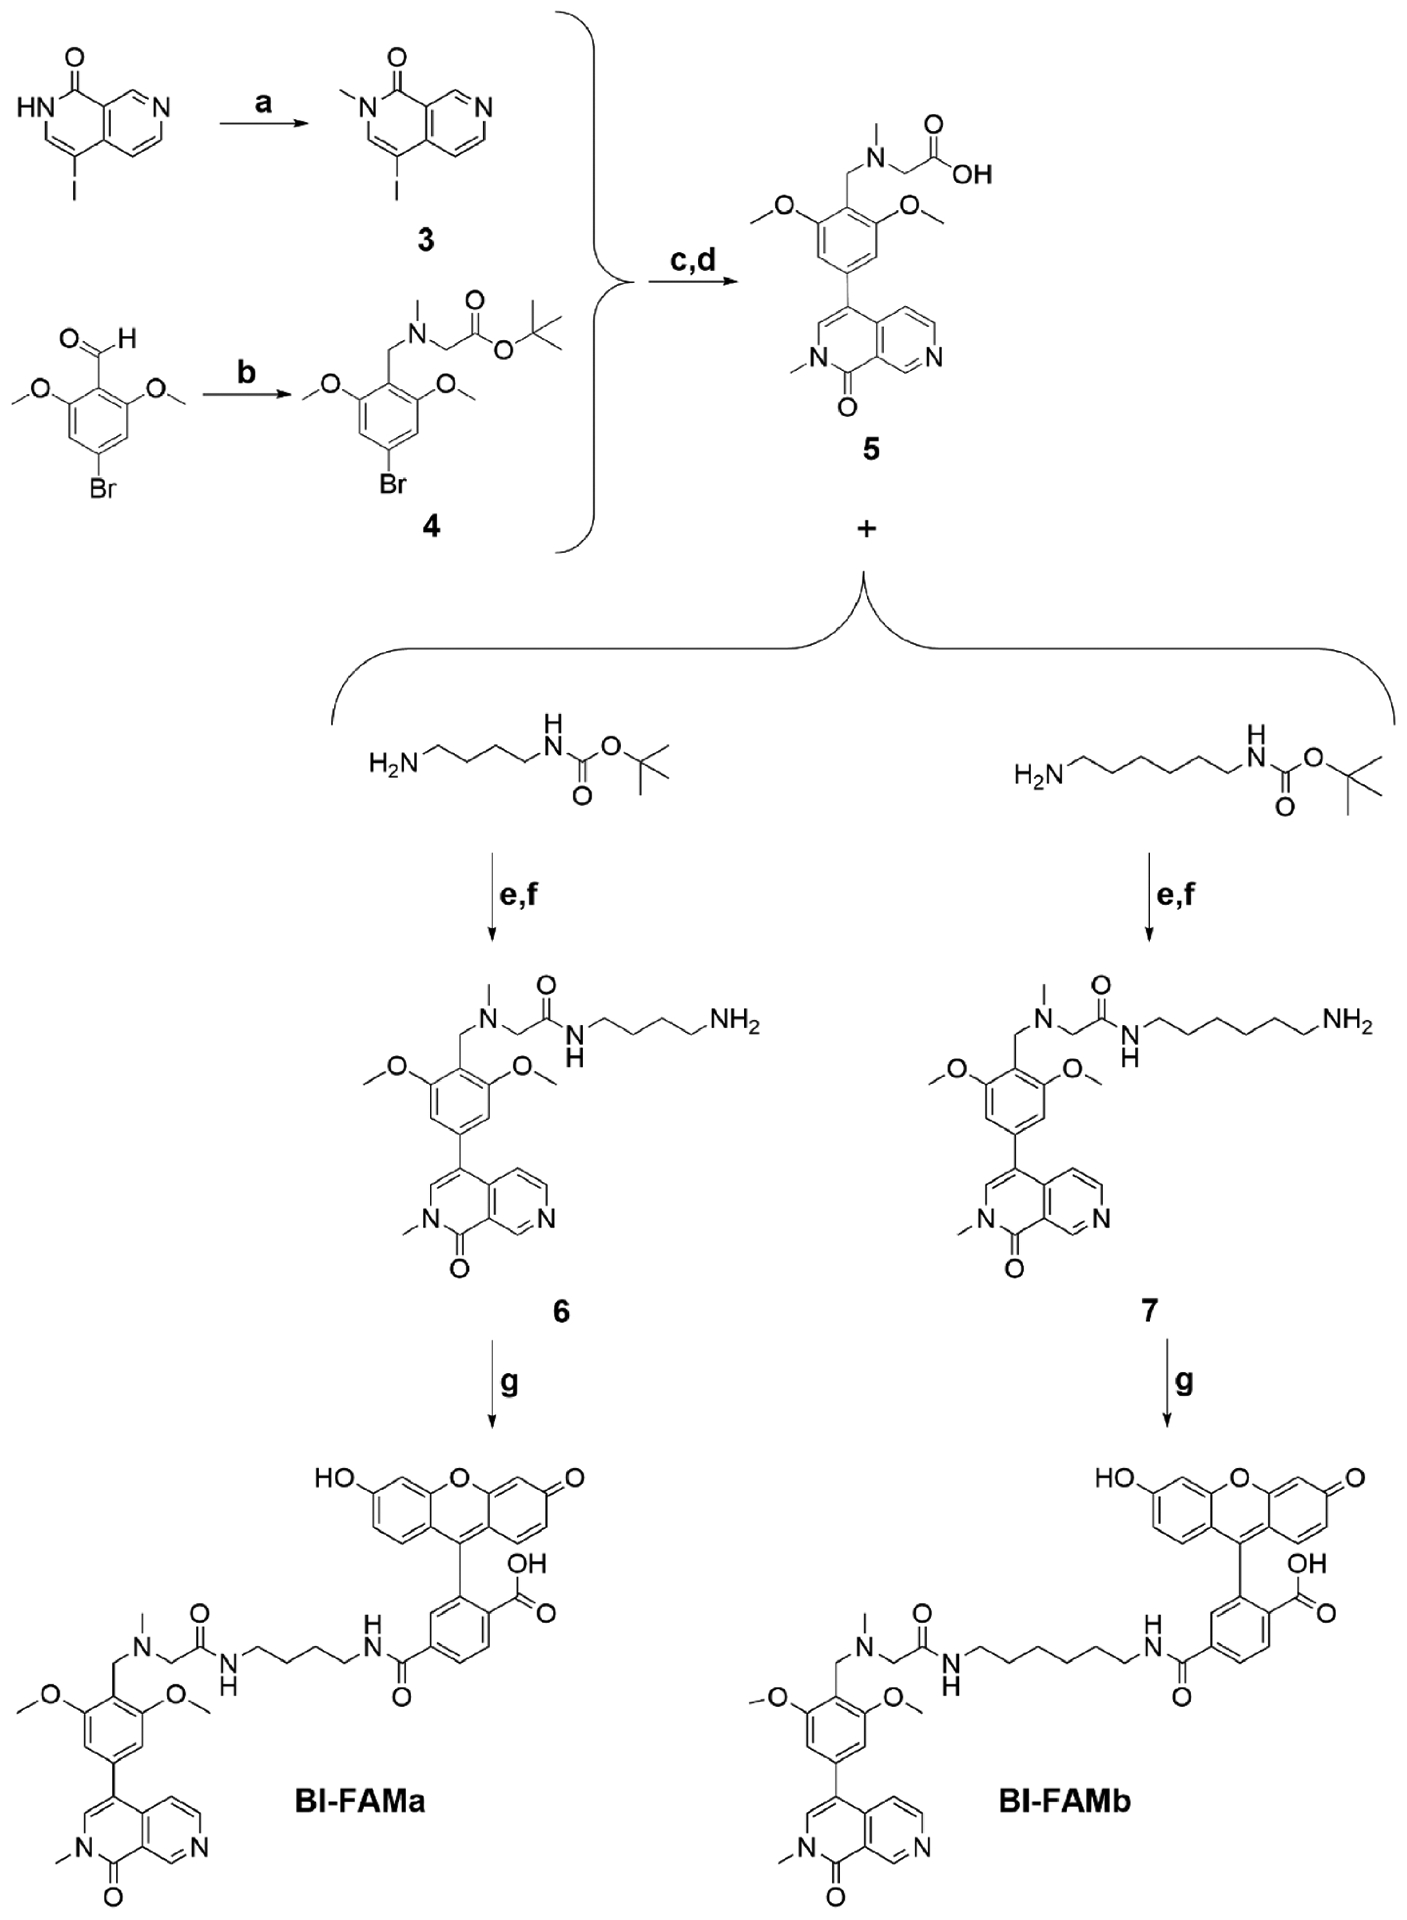
Reagents and Conditions for the Synthesis of BI-FAMa and BI-FAMba
a(a) NaH, DMF (anhydrous), CH3I at 0 °C warm to rt, 16 h; (b) sarcosyl tert-butyl ester hydrochloride, DCM, NaOAc, then acetic acid, NaBH(OAc)3, 18 h, then 1 M K2CO3 to pH = 11; (c) 4, bis(pinacolato)diboron, DMF, KOAc, PdCl2(dppf)CH2Cl2, 16 h, 90 °C, under N2, then 3 and 1 M K2CO3, 80 °C, 16 h; (d) 80% TFA, rt, 2 h; (e) DMF activated with acetic acid/DIC, rt, 12−16 h; (f) 75% TFA, DCM, rt, 16 h; (g) NHS-fluorescein, DMSO/PBS pH = 8.2 1:1, protected from light, rt, 4 h.
Figure 4.
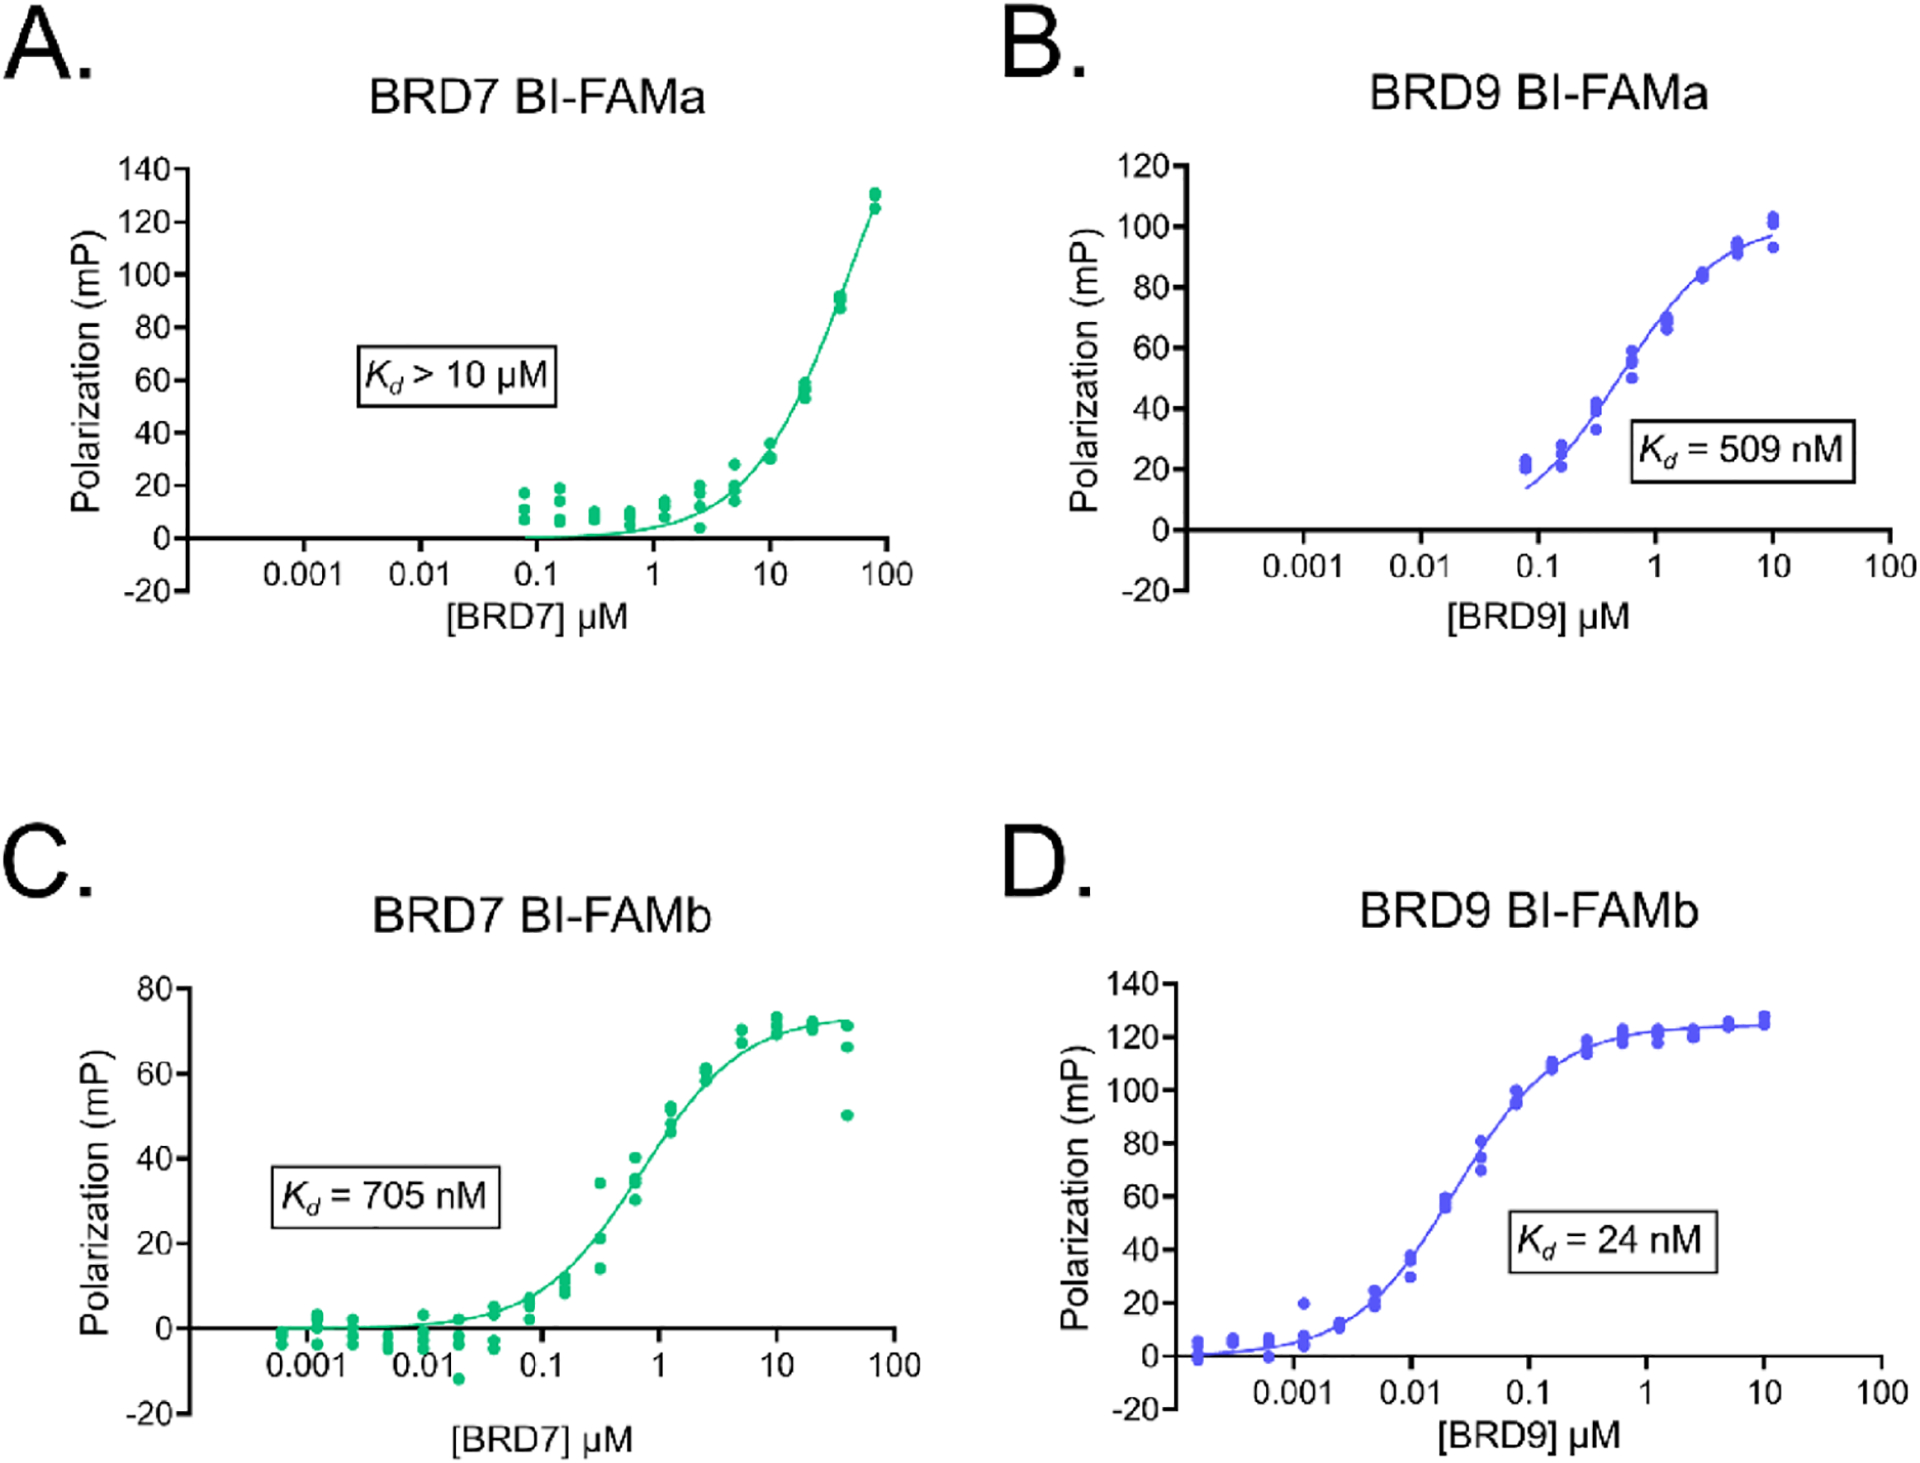
(A) Fluorescence polarization of BI-FAMa with increasing concentrations of BRD7 and (B) BRD9. (C) Fluorescence polarization of BIFAMb with increasing concentrations of BRD7 and (D) BRD9. Approximate Kd values were obtained from nonlinear “one site-specific binding” fit analyses on GraphPad Prism 9.
Table 2.
Binding Affinity of Inhibitors to BRD7 and BRD9
| compound | IC50BRD7 (μM)a | KiBRD7 (μM)b | IC50BRD9 (μM)a | KiBRD9 (μM)b |
|---|---|---|---|---|
| BI7273 | 2.8 | 0.30 | 0.2 | 0.02 |
| 1–38 | 8.1 | 0.86 | 4.0 | 0.34 |
| 1–78 | 1.6 | 0.17 | 2.7 | 0.23 |
| 2–77 | 5.4 | 1.3 | >300 | >20 |
| 2–88 | 2.9 | 0.31 | 1.5 | 0.13 |
The results of the competitive FP assay (Figures S2 and S3) were graphed in GraphPad Prism 9, and a nonlinear “[inhibitor] vs response − variable slope (four parameters)” fit was used to obtain IC50 values of the compounds that showed binding.
Ki values were estimated based on the experimental IC50 as described in Experimental Section.
Binding Mode Analysis of 1–78 and 2–77.
BRD7/9 inhibitors have a pharmacophore that mimics an acetylated Lys and forms a hydrogen bond with the highly conserved Asn in the BD binding pocket (BRD7Asn211 and BRD9Asn216).14,42 More recent crystal structures of BRD9 BD and BRD7 BD indicate that the aromatic systems in BI7273, BI9564, I-BRD9, TP-472, and bromosporine form π−π interactions with BRD7Tyr217 or BRD9Tyr222. In these structures, the hydrophobic pocket in BRD7 (Figure 2, left) is also available in BRD9, indicating that these compounds achieve selectivity through an alternate mechanism than originally proposed (Figure 5A,B and Figure S5).14,42 Using pregenerated receptor grids, we docked 1–78 and 2–77 into the structures of BRD7 and BRD9 BDs crystallized with BI7273 (Figure 5A, PDB: 6V1E, and Figure 5B, PDB: 5EU1, respectively). 2–77 interacts with BRD7 BD to maintain the same key interactions found between BI7273 and BRD7Asn211 and BRD7Tyr217 (Figure 5C). BRD9 BD, however, cannot accommodate the core of 2–77 inside the pocket. Instead, the software docks 2–77 into the BRD9 BD binding pocket via the pyridine moiety of the molecule such that the aromatic ring forms a π−π interaction with BRD9Tyr216, and a hydrogen bond can be formed between the oxygen of the para-methoxy group and BRD7Asn211 (Figure 5D). In contrast, the docking shows that 1–78 maintains the π−π interactions between the pharmacophore and both BRD7Tyr217 and BRD9Tyr216; however, to accommodate the steric bulk of 1–78 in BRD9 BD, the key hydrogen bond between the amide oxygen and BRD9Asn216 is not maintained (Figure 5E,F).
Figure 5.
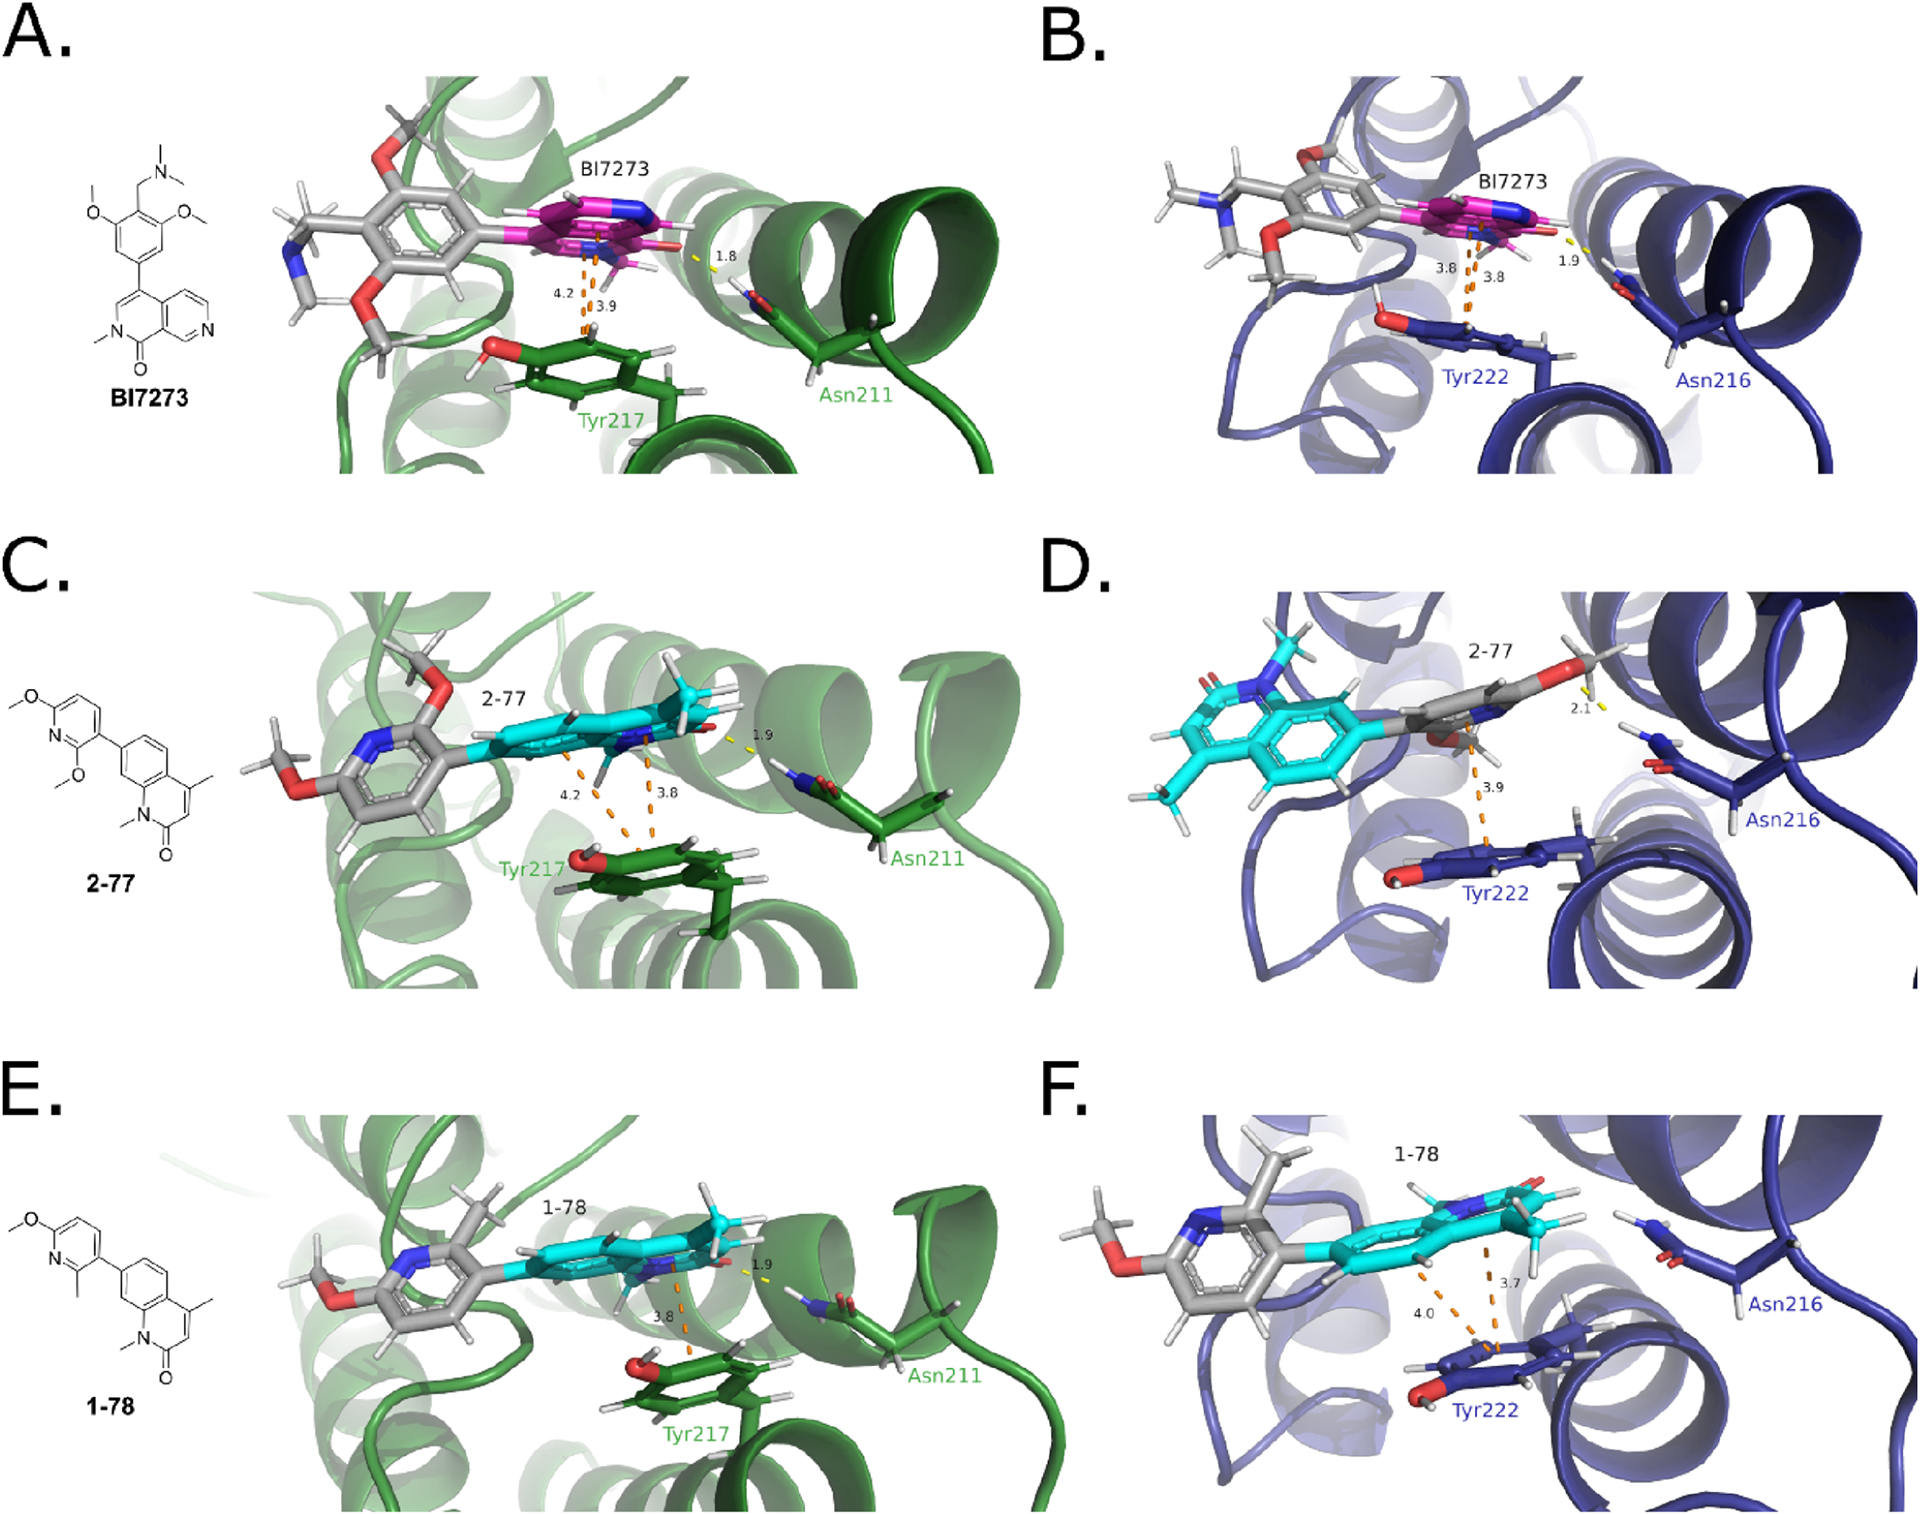
Binding mode analysis of compounds docked against BRD7 BD (PDB: 6V1E) and BRD9 BD (PDB: 5EU1) performed in the Schrödinger Maestro suite. BI7273 was docked into (A) BRD7 BD (green) and (B) BRD9 BD (blue). 2–77 was docked into (C) BRD7 BD (green) and (D) BRD9 BD (blue). 1–78 was docked into (E) BRD7 BD (green) and (F) BRD9 BD (blue). Shown in sticks: the conserved Asn involved in the hydrogen bond and the Tyr involved in the π−π interactions. In magenta in panels (A) and (B): the core of BI7273. In cyan in panels (C)−(F): the core of 2–77 and 1–78. π−π interactions are depicted in orange dotted lines. Hydrogen bonds are depicted in yellow dotted lines. Distance of the interactions given in Å. Figures created in PyMOL.
BROMOscan and bromoKdELECT Profiling of 1–78 and 2–77.
To evaluate the selectivity profile over 40 distinct BDs, we screened 1–78 and 2–77 in the BROMOscan panel (Eurofins DiscoverX Corp.). Both 1–78 and 2–77 showed selectivity for BRD7 over BRD9 at 2 μM concentration (Figure 6A and Table S1). In a separate experiment, we also tested compounds with activity against both BRD7 and BRD9 in the TSA (1–38) (Figure 3A) or with weak binding to BRD7 (2–81) in the BROMOscan and observed no binding to other BDs (Figure S6). We next used the bromoKdELECT platform (Eurofins DiscoverX Corp.) to evaluate the binding affinity of the compounds for BRD7 BD and BRD9 BD. The results showed that 1–78 and 2–77 have Kd average values of 290 and 340 nM for BRD7 and 650 and 655 nM for BRD9, respectively (Figure S7). Unexpectedly, both compounds show off-target binding for the BD of bromodomain and PHD finger-containing protein 1B (BRPF1B) in the BROMOscan, even though the sequence identity between the BDs of BRPF1B and BRD7 is only 38% (Figure S1). Some BRPF1B inhibitors reported in the literature share a core similar to that of 1–78 and 2–77, such as NI-48, with differences in the position of the methyl group with respect to the lactam ring and the position at which the R-group binds to the core (Figure 6B, left).43 We analyzed the interactions between NI-48 and the BRPF1B BD (PDB: 5T4V) and found that the binding mode is similar to that of our compounds (Figure S8). The oxygen of the lactam ring of NI-48 also forms a hydrogen bond with the conserved Asn BRPF1BAsn708, and the core of the compound forms two π−π interactions with BRPF1BPhe714. Additionally, the R-group of NI-48 forms an edge-to-face π−π interaction with BRPF1BPhe714 allowed by the length and flexibility of the chain that connects the R-group to the core.
Figure 6.
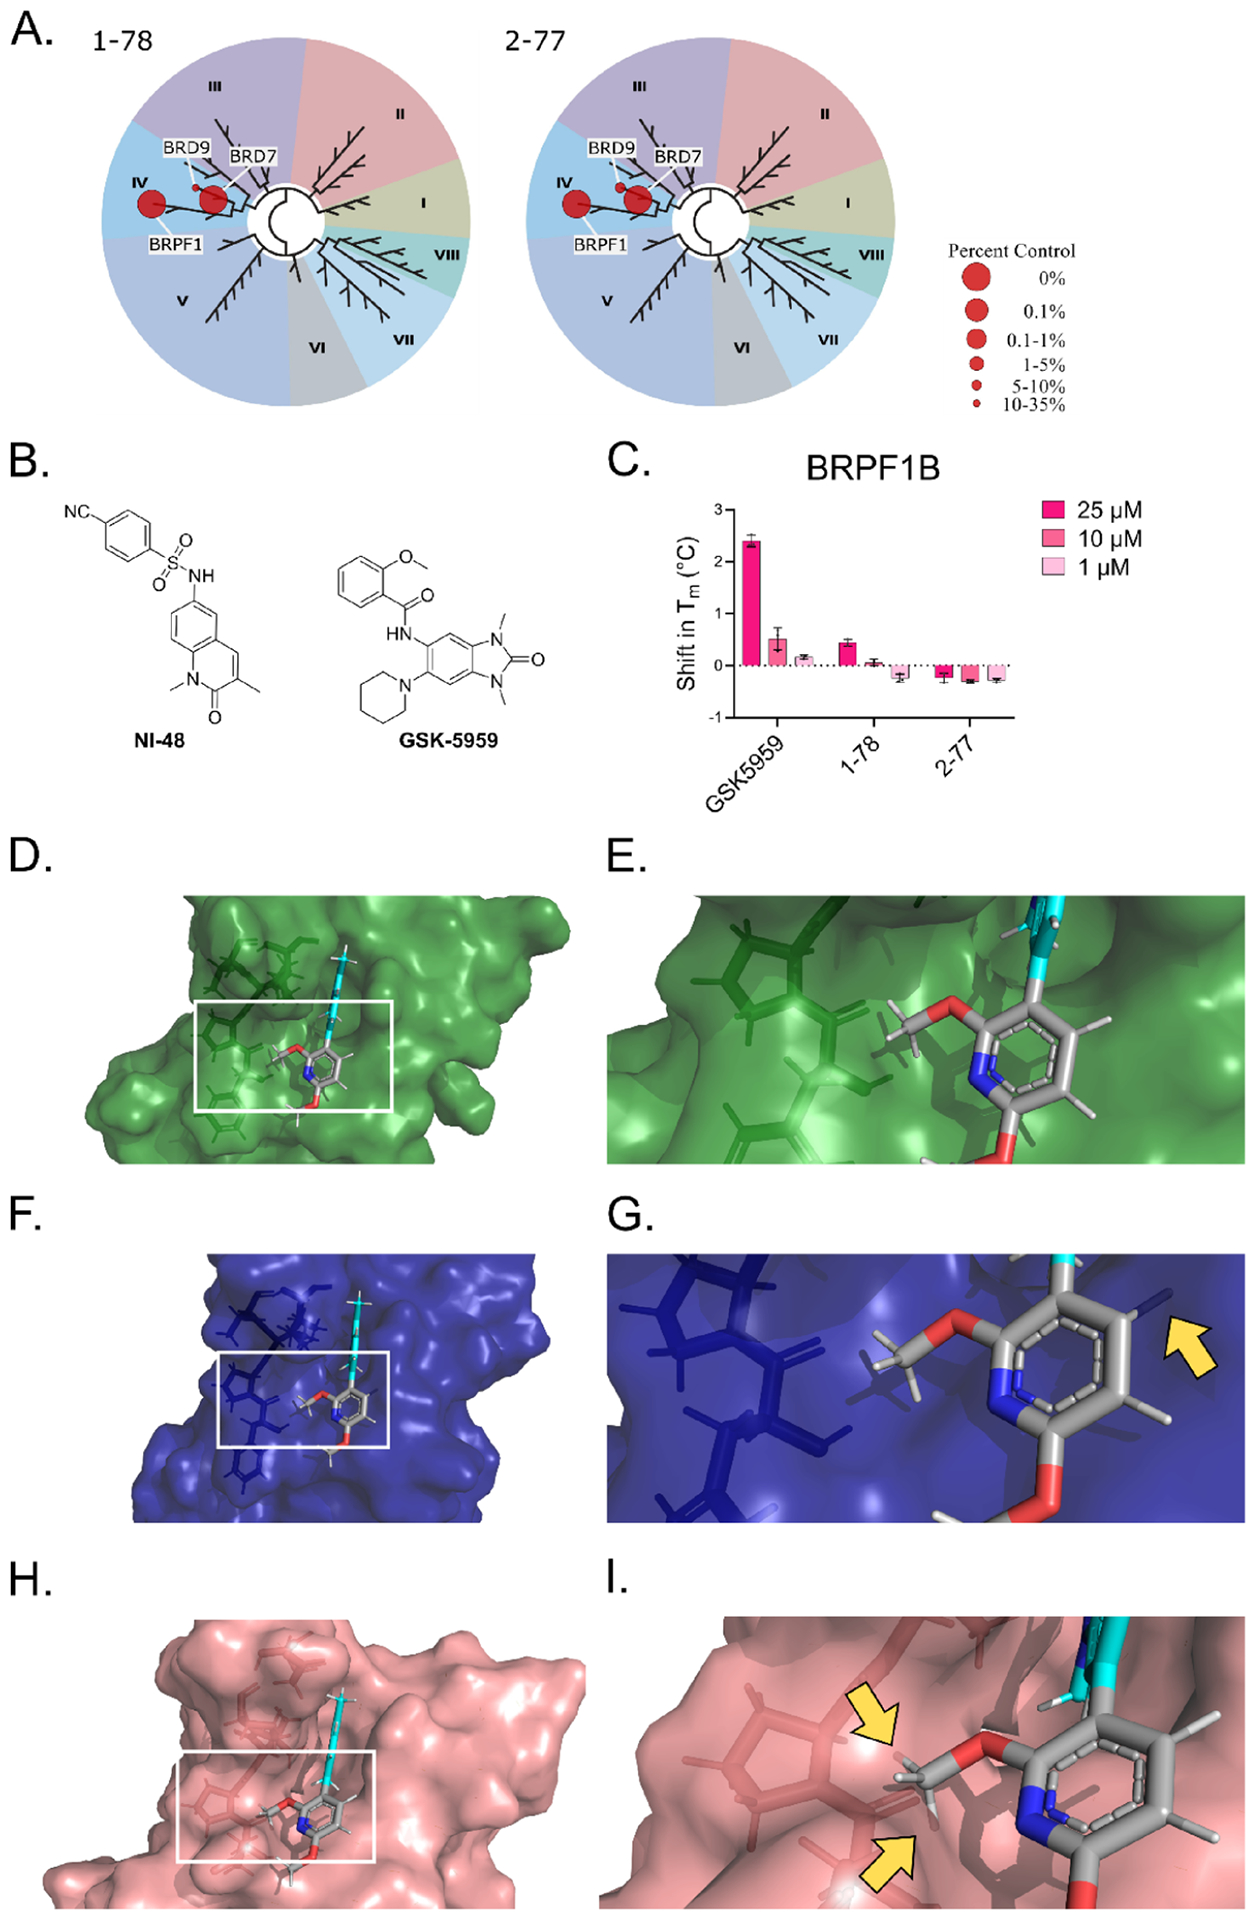
(A) TREEspot interaction maps for 1–78 and 2–77 screened in the BROMOscan platform. The results for binding interactions for the compounds are reported as % of control (DMSO). (B) Structures of the BRPF1B inhibitors NI-48 and GSK-5959. (C) Results from the TSA using HIS-tagged BRPF1B and compounds at 25, 10, or 1 μM. The Tm of the proteins in the different conditions was calculated based on differential scanning fluorimetry readings at increasing temperatures from four replicates using nonlinear least squares fit on GraphPad Prism 9. The shift in Tm was calculated with respect to the vehicle. (D) 2–77 docked against BRD7, showing the surface of the protein and depicting the amino acids involved in the hydrophobic region right outside the binding pocket as sticks. (E) Zoomed-in region indicated in panel (D). (F) The binding pose of 2–77 docked against BRD7 aligned to the binding pocket of BRD9, showing the surface of BRD9 and depicting the amino acids involved in the hydrophobic region right outside the binding pocket as sticks. (G) Zoomed-in region indicated in panel (F). (H) The binding pose of 2–77 docked against BRD7 aligned to the binding pocket of BRPF1B, showing the surface of BRPF1B and depicting the amino acids involved in the hydrophobic region right outside the binding pocket as sticks. (I) Zoomed-in region indicated in panel (H). Yellow arrows in panels (G) and (I) indicate where 2–77 clashes with the binding pocket of BRD9 and BRPF1B, respectively. Figures created with PyMOL.
The BROMOscan is a competitive binding assay and not a direct binding assay; therefore, it is difficult to assess from the BROMOscan alone how well our BRD7 inhibitors bind to BRPF1B. For this reason, we also tested our inhibitors against the BD of BRPF1B using TSA. As a control for this assay, we employed GSK-5959, a BRPF1-selective inhibitor with a different bicyclic system and an IC50 of 98 nM (Figure 6B, right).44 GSK-5959 did not bind to BRD7 or BRD9 but stabilized BRPF1B at concentrations as low as 1 μM (Figure 6C).44 In contrast, 1–78 was the only BRD7 inhibitor to display even modest stabilization of BRPF1B at the highest concentration (25 μM). Even though the compounds can compete with non-selective ligands for BRPF1B binding in the BROMOscan, they are not potent enough to stabilize the BRPF1B BD in vitro at concentrations that stabilize the BRD7 BD.
To better understand why the compounds do not stabilize BRPF1B BD to the same extent as BRD7 BD, we evaluated their binding mode in silico. We docked GSK-5959, 1–78, and 2–77 and into the binding pocket of the BRPF1B BD crystallized with NI-48 (PDB: 5T4V) (Figure S9). As expected, the core of GSK-5959 forms a hydrogen bond with the conserved Asn in BRPF1B (BRPF1BAsn708) and a π−π interaction with BRPF1BPhe714, which is the gatekeeper of the binding pocket in the BRPF1B BD instead of the conserved Tyr in BRD7 and BRD9 (BRD7Tyr217 and BRD9Tyr222, respectively). Even though 1–78 fits in the binding pocket, it lacks the critical hydrogen bond with BRPF1BAsn708, which could explain the reduced BRPF1B stabilization by 1–78 in the TSA. Similar to what we observed when docking 2–77 into BRD9, BRPF1B cannot accommodate 2–77 in its binding pocket while maintaining critical binding interactions.
After inspecting the binding mode of 1–78 and 2–77 to BRD7, BRD9, and BRPF1B in the docking experiments (Figure 2C,E, Figure 2D,F, and Figure S9B,C, respectively), we observed that the structural feature of the proteins that is providing the steric hinderance is not the availability of a hydrophobic pocket. Instead, the width and flexibility of the section that bridges the inner and outer regions of the binding pocket appear to be sterically restricting the binding of the compounds. In an unliganded state, the bridge in BRD7 is in an open disposition, allowing the entrance of small molecules, which closes once the π−π interaction is formed between the core of the inhibitors and BRD7Tyr217. The position of BRD9Tyr222, however, appears to restrict the bridge once it closes and prevents binding to rigid small molecules that cannot easily rotate to adapt to the constricted space, such as 1–78 and 2–77. Similarly, in BRPF1B, the entrance is restricted by BRPF1BPhe714 but is less narrow than in BRD9, which could explain why we still see some competition in the BROMOscan platform. To further explore why BRD9 and BRPF1B cannot bind to 2–77, we aligned the pose of 2–77 bound to BRD7 with the binding pockets of BRD9 and BRPF1B (Figure 6D,E, Figure 6F,G, and Figure 6H,I for BRD7, BRD9, and BRPF1B, respectively). The R-group of 2–77 occupies the hydrophobic region in BRD7 without any steric hindrance (Figure 6E); however, the R-group clashes with the binding pocket of BRD9 and BRPF1B (Figure 6G,I, respectively), explaining the selectivity we observed in the in vitro assays.
In all, we have developed two compounds, 1–78 and 2–77, which are selective for the BRD7 BD in vitro. To validate their use as tools to study the function of BRD7, we next tested them in cellulo.
NanoBRET Target Engagement with BRD7, BRD9, and BRPF1B BDs.
To evaluate the compounds in a cell-based model, we performed a NanoBRET assay to assess intracellular BD engagement by the compounds. To do so, we expressed the BDs of BRD7, BRD9, and BRPF1B fused with luciferase in HEK293T cells and first incubated them with increasing concentrations of NanoBRET BRD Tracer-02 (provided by Promega) designed to generate BRET when bound to the target BDs (Figure S10A). Using these binding profiles, we selected 0.4 μM as the tracer concentration for the NanoBRET assay. We then performed a competition assay by treating the cells with increasing concentrations of 1–78, 2–77, GSK-5959, and BI7273. As expected, BI7273 had a lower IC50 for BRD9 (0.024 μM) than for BRD7 (1.2 μM) or BRPF1B (3.4 μM) (Figure 7A and Figure S10B for second replicate). When treating the cells with 1–78 and 2–77, we observed a lower IC50 for BRD7 (0.8 and 1.2 μM, respectively) than for BRD9 (3.3 and 3.2 μM, respectively) or BRPF1B (2.8 and >10 μM), indicating that the compounds were selective for BRD7 BD over BRD9 BD and BRPF1B BD in cellulo (Figure 7B,C and Figure S10B). GSK-5959 did not bind BRD7 BD or BRD9 BD but potently inhibited BRPF1B BD (0.059 μM) (Figure 7D and Figure S10B). This supports the thermal shift results that indicate that 1–78 and 2–77 bind BRPF1B with significantly reduced affinity compared to known BRPF1B inhibitors.
Figure 7.
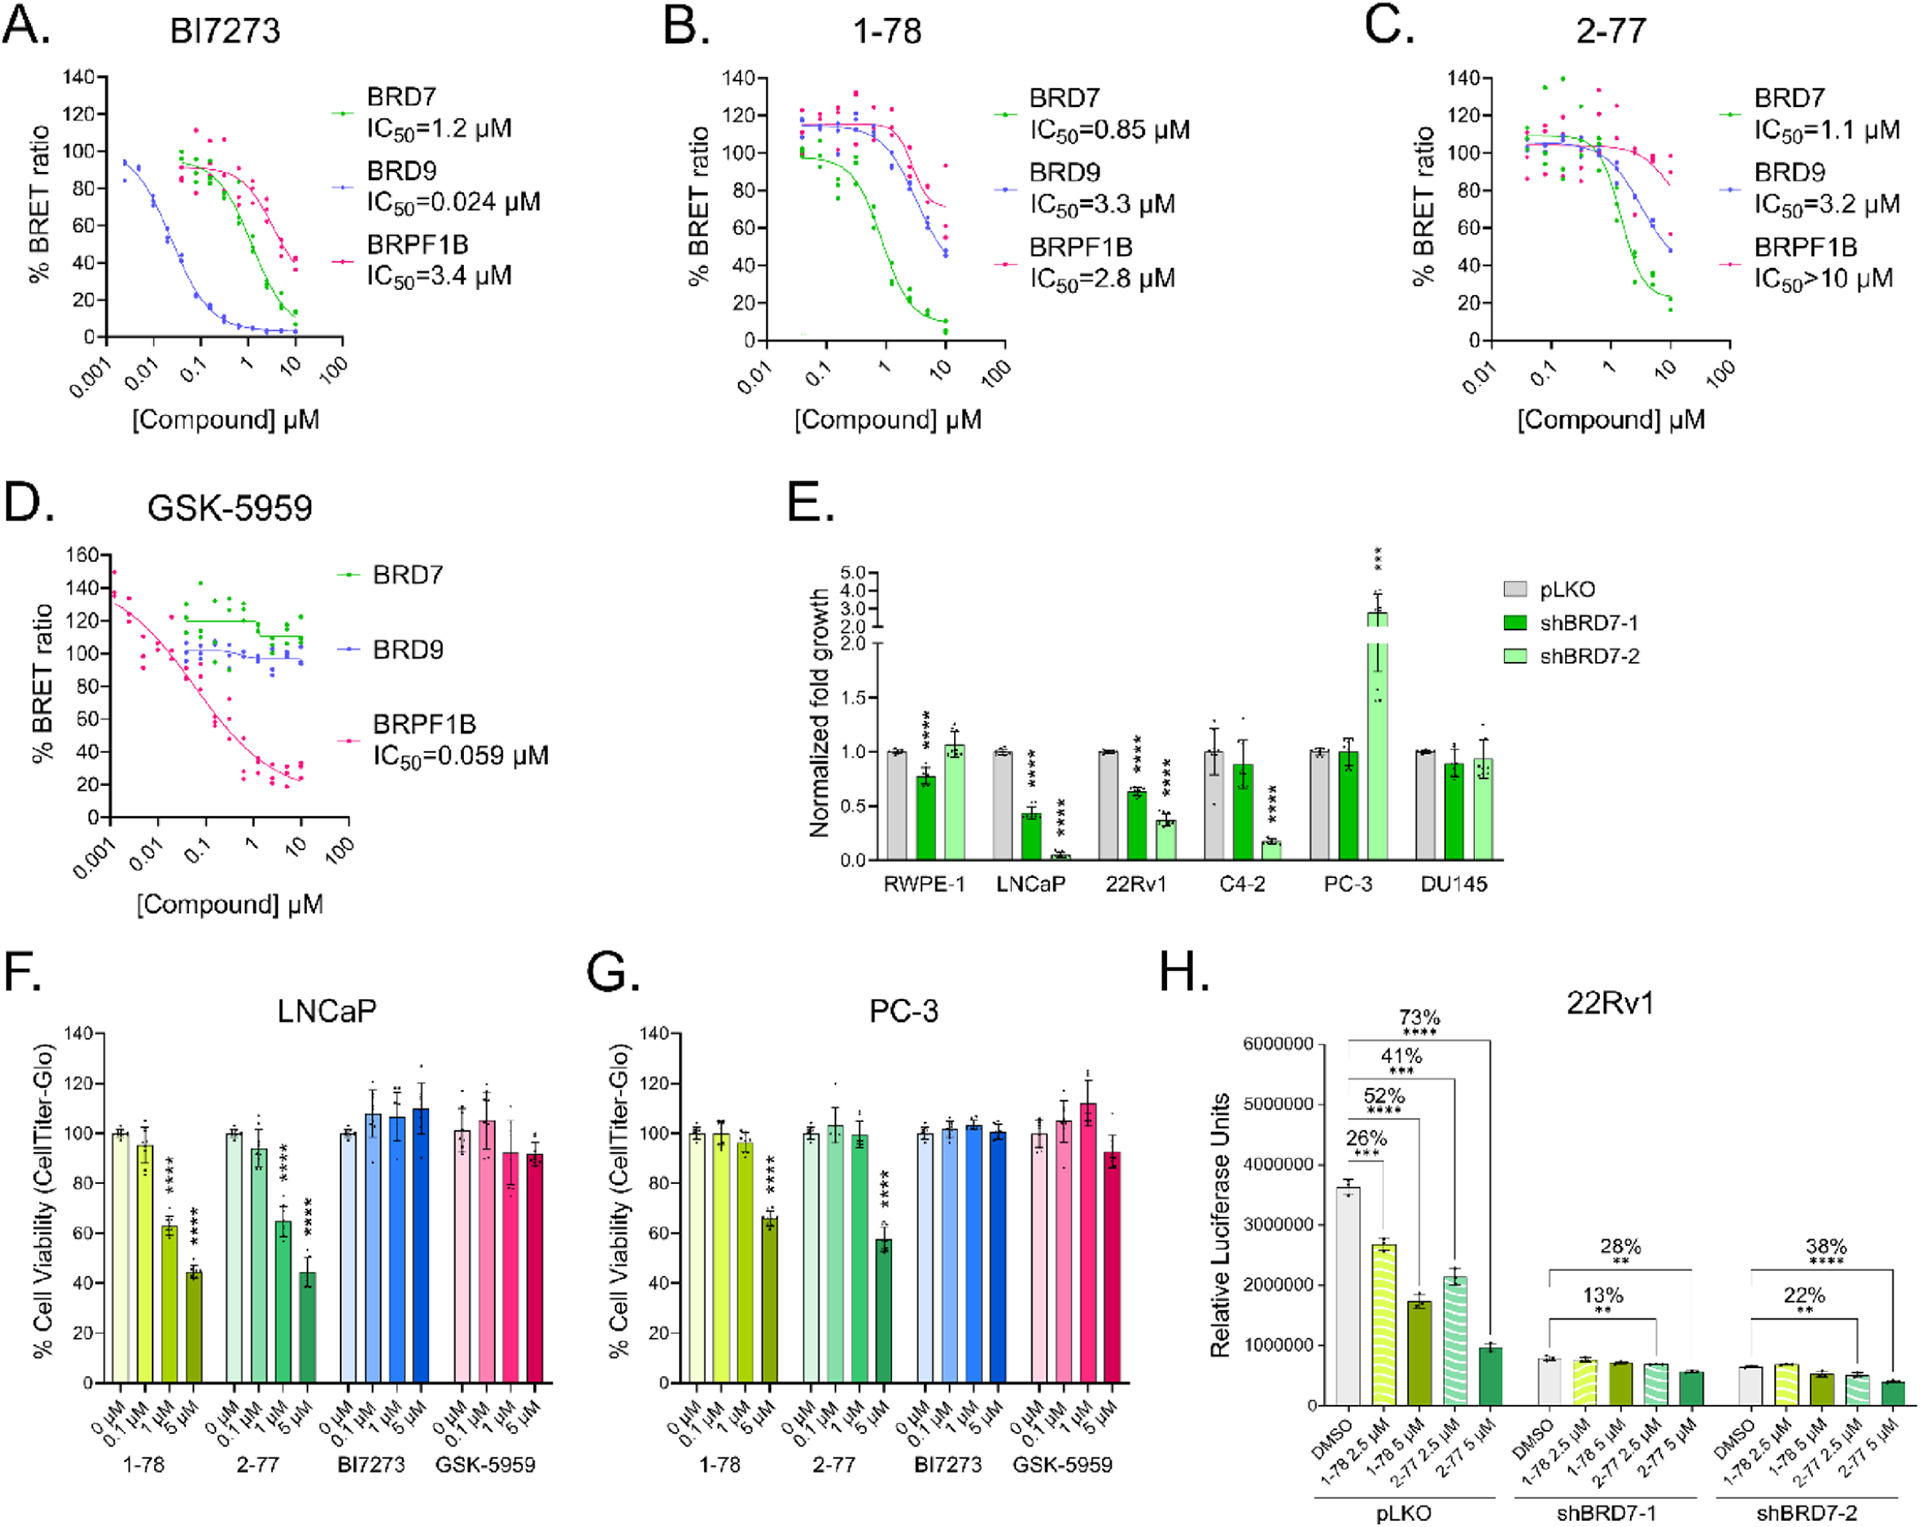
In cellulo assays. (A) NanoBRET assay results treating HEK293T cells for 2 h with increasing concentrations of BI7273, (B) 1–78, (C) 2–77, and (D) GSK-5959. The BRET ratio in milliBRET units (mBu) was calculated as described in Experimental Section. The IC50 was calculated using the nonlinear least squares fit on GraphPad Prism 9. (E) Normalized fold increase in growth after 4 days of incubation of RWPE-1, LNCaP, 22Rv1, C4–2, PC-3, and DU145 cells in which BRD7 has been knocked down with two different constructs. Cell viability was measured with a CellTiter-Glo Luminescent Cell Viability Assay on day 0 and day 4, including 3 replicates each from 3 separate experiments. Error bars represent s.d., n = 9. (F) LNCaP and (G) PC-3 viability after 4 days of incubating the cells with compounds 1–78 and 2–77, the BRD7/9 inhibitor BI7273, and the BRPF1B inhibitor GSK-5959, including 3 replicates each from 3 separate experiments. Cell viability was measured employing a CellTiter-Glo Luminescent Cell Viability Assay. Error bars represent s.d., n = 9. (H) On-target activity assessment. 22Rv1 cells in which BRD7 has been knocked down with two different constructs were treated with 1–78, 2–77, or vehicle. Cell viability given by relative luciferase units measured with a CellTiter-Glo Luminescent Cell Viability Assay. Error bars represent s.d., n = 3. Statistical significance for panels (E)−(G) was determined using multiple t-tests with respect to the empty vector or vehicle. *p ≤ 0.05, **p ≤ 0.01, ***p ≤ 0.001, and ****p ≤ 0.0001.
BRD7 Inhibitors Do Not Displace BRD9 from Chromatin.
PBAF contains a total of eight BDs across three separate subunits. We found previously that a single BD mutation in (or even full deletion of) the polybromo-1 (PBRM1) PBAF subunit can slightly reduce but not abrogate PBAF global chromatin association.4,45,46 In contrast, a single BD mutation or inhibition of the BRD9 subunit completely dissociates GBAF from chromatin.4,47 To determine whether our BRD7 inhibitors can displace BRD9 from chromatin at cellularly active concentrations, we performed a cell fractionation assay. We treated HEK293T cells with 10 μM of the compounds or DMSO and collected nuclear-soluble and chromatin-insoluble fractions. Using western blotting, we evaluated the relative amount of BRD9 still bound to chromatin after inhibitor treatment. I-BRD9 treatment significantly reduced BRD9 from chromatin, while 1–78 and 2–77 did not, indicating that while the NanoBRET assay detects some off-target binding to BRD9 at 10 μM, it is not sufficient to inhibit BRD9 chromatin binding (Figure S11).
BRD7 Inhibition Reduces Cell Proliferation in PCa Cell-Based Models.
PCa is the second leading cause of cancer-associated deaths and the most frequently diagnosed cancer in men in the US, with 34,700 associated deaths and 288,300 new cases estimated for 2023.48 BRD7 has been identified as a prognostic marker and facilitator of PCa progression,35–37 and the depletion of BRD7 reduces expression of testosterone-response genes in HAP1 cells.7 The therapeutic potential of targeting BRD7 in PCa has not been explored, however, in part due to a lack of chemical tools.
PCa can be classified as either hormone-naïve or castration-resistant and either androgen receptor (AR)-positive or AR-negative.49 In our studies, we employed six different cell lines to model the disease: RWPE-1 (normal prostate epithelial cells), LNCaP (hormone-naïve, AR-positive PCa cells), 22Rv1 (castration-resistant, AR-positive PCa cells), C4–2 (castration-resistant, AR-positive PCa cells), PC-3 (castration-resistant, AR-negative PCa cells), and DU145 (castration-resistant, AR-negative PCa cells). To determine PCa dependency on BRD7, we used shRNA-mediated knockdown of BRD7 in all six cell lines (Figure S12A). We observed that reduced expression of BRD7 decreased cell proliferation in AR-positive cells while having little to no effect on normal epithelial prostate cells or AR-negative PCa cells (Figure 7E).This effect is similar to, but more pronounced than, what we previously observed for PBRM1.18 Both 1–78 and 2–77 inhibited the cell growth of LNCaP cells at all three tested concentrations (5, 1, and 0.1 μM) while being active in PC-3 only at the highest concentration (5 μM), in agreement with a greater BRD7 dependency in AR-positive PCa (Figure 7F,G). To evaluate if the activity of the compounds could be related to off-target BRD9 or BRPF1B inhibition, we treated LNCaP and PC-3 cells with BI7273 and GSK-5959 at 5, 1, and 0.1 μM and observed little to no effect with either compound (Figure 7F,G). While we previously observed a dependency on BRD9 in LNCaP cells, it required longer inhibition than 4 days to see effects with BRD9-selective ligands, consistent with our data here.47 Dose curves over 7 days of treatment confirm that LNCaP cells and the castration-resistant derivative C4–2 are 3−6 times more sensitive than PC3 cells to treatment with 1–78 and 2–77 (Figure S12B). We wished to evaluate if BRD7 knockdown can ameliorate the response of prostate cancer cells to 1–78 and 2–77 treatment but were unable to culture viable LNCaP cells with BRD7 knockdown for more than a few days. Instead, we turned to 22Rv1 cells, which are less sensitive to BRD7 knockdown (Figure 7E). We knocked down BRD7 in 22Rv1 cells using two separate shRNA constructs and, after 4 days, treated the cells with single doses of 1–78 or 2–77 for an additional 4 days. The viability of cells with BRD7 knockdown was not significantly affected by 1–78 treatment and was less affected by 2–77 treatment, consistent with on-target activity (Figure 7H).
BRD7 Inhibition Reduces AR Target Gene Expression.
To evaluate how BRD7 BD inhibition by 2–77 affects gene expression in PCa, we performed RNA-Seq on LNCaP cells treated with 1 μM 2–77 or DMSO for 72 h. At this concentration, 2–77 affects LNCaP growth but not PC3 growth (Figure 7F,G) and binds a majority of BRD7 BD but not BRD9 BD in the NanoBRET assay (Figure 7B,C). We identified 661 genes decreased and 859 genes increased in expression with 2–77 treatment using DESeq (padj < 0.05, fold change (FC) > 1.5) (Figure 8A). We then identified significantly enriched MSigDB_Hallmark gene sets in the differentially expressed genes. Androgen response, G2/M checkpoint, and E2F targets were the most significantly enriched pathways in the decreased genes (Figure 8B), which agrees with our findings that BRD7 knockdown affects the growth and viability of only AR-positive PCa cell lines. We next performed gene set enrichment analysis (GSEA) for the Hallmark_Androgen_Response gene set using our full RNA-seq dataset. We found significant and strong negative enrichment of androgen response genes, indicating that 2–77 treatment decreases AR target gene expression in these cells (Figure 8C).
Figure 8.
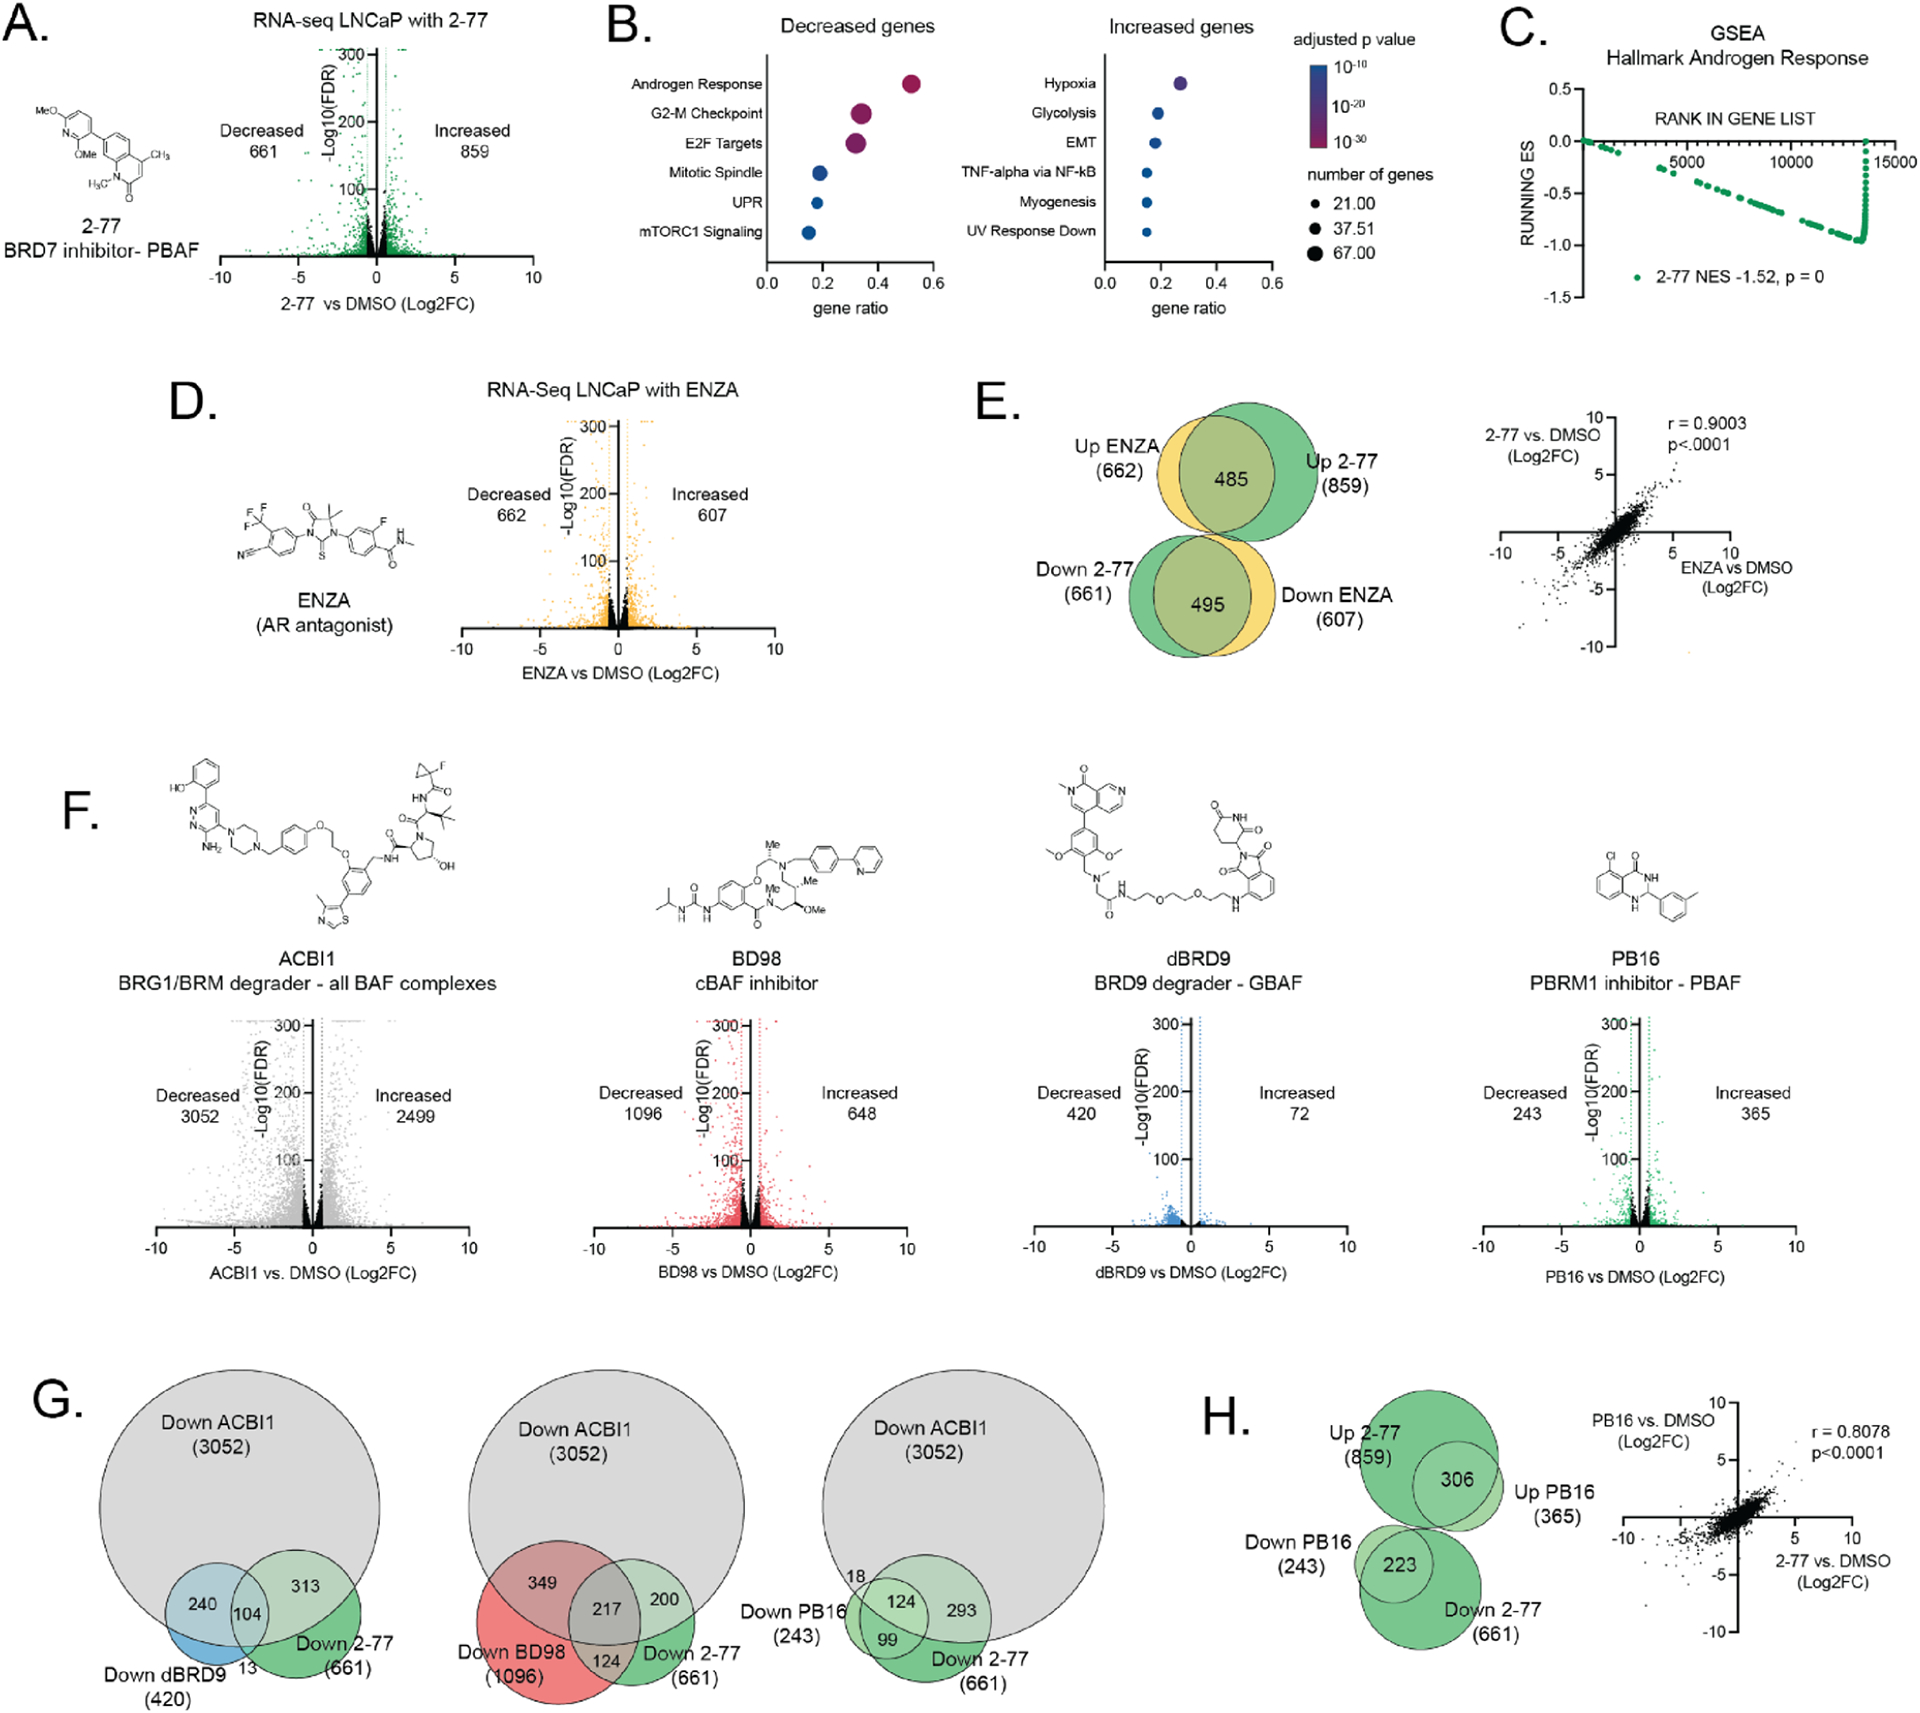
Gene expression analysis. (A) Volcano plot of RNA-seq gene expression changes after treating LNCaP cells for 72 h with 1 μM 2–77 compared to treatment with DMSO. The Log2 FC indicates the mean expression level for each gene. Each dot represents one gene. The differentially expressed genes are shown in green with padj < 0.05 and FC > 1.5. (B) The top six most significantly enriched pathways represented in the genes significantly decreased with 2–77 treatment (left) and significantly increased with 2–77 treatment (right). (C) GSEA analysis of RNA-seq data from LNCaP cells treated with 2–77 using the MsigDB pathway Hallmark_Androgen_Response. (D) RNA-seq after treating LNCaP cells for 72 h with 10 μM ENZA or DMSO. Volcano plot of gene expression changes. The Log2 FC indicates the mean expression level for each gene. Each dot represents one gene. The differentially expressed genes are shown in yellow with padj < 0.05 and FC > 1.5. (E) (left) Overlap of differentially expressed genes in LNCaP cells treated with 2–77 (green) or ENZA (yellow) and (right) correlation of all gene expression changes in cells treated with ENZA (x-axis) or 2–77 (y-axis). (F) Volcano plot of RNA-seq gene expression changes after treating LNCaP cells for 72 h with 0.2 μM ACBI, 2 μM BD98, 0.5 μM dBRD9, or 10 μM PB16 compared to DMSO. The Log2 FC indicates the mean expression level for each gene. Each dot represents one gene. The differentially expressed genes are shown in gray (ACBI1), red (BD98), blue (dBRD9), or light green (PB16) with padj < 0.05 and FC > 1.5. (G) Overlap of differentially decreased (padj < 0.05, FC > 1.5) genes after treatment with ACBI1 (gray), 2–77 (green), and dBRD9 (blue), BD98 (red), or PB16 (light green). (H) (left) Overlap of differentially expressed genes in LNCaP cells treated with 2–77 (green) or PB16 (light green) and (right) correlation of all gene expression changes in cells treated with 2–77 (x-axis) or PB16 (y-axis).
To further explore the relationship between 2–77 and androgen response genes, we performed RNA-seq on LNCaP cells treated with 10 μM of the AR antagonist enzalutamide (ENZA) or DMSO for 72 h. We identified 662 genes decreased and 609 genes increased in expression with ENZA treatment (padj < 0.05, FC > 1.5) (Figure 8D). In agreement with a role for BRD7 in AR target gene expression, we observed a high overlap of differentially expressed genes between 2–77 and ENZA treatment, as well as a high correlation between all gene expression changes induced by treatment with 2–77 or ENZA (Figure 8E).
While few studies have specifically addressed the role of PBAF in PCa gene expression, several have identified shared BAF subunits or subunits from the other subcomplexes (cBAF and GBAF) to be critical for AR target gene expression.47,50–55 Therefore, we also performed RNA-seq with a BRG1/BRM degrader that eliminates all BAF complexes (ACBI1), a cBAF-specific inhibitor (BD98), a BRD9 degrader that eliminates GBAF complexes (dBRD9), and a PBRM1-specific BD inhibitor to target PBAF (PB16) (Figure 8F).10,11,18,25 In agreement with their modes of action, we found the largest changes in gene expression with ACBI1, which eliminates all BAF functions, and the next largest with BD98, which targets the most abundant cBAF subcomplex. In contrast, we found smaller changes in gene expression with dBRD9 or PB16, which target the less abundant GBAF and PBAF subcomplexes, respectively. In agreement with published findings, a decrease in AR target gene expression was observed for inhibitors of all three BAF subcomplexes (Figure S13A). Similarly, the genes differentially expressed with ENZA showed a significant overlap and correlation with genes differentially expressed with the inhibitors of all three individual BAF subcomplexes (Figure S13B). In agreement with what we observed with 2–77, gene expression changes from PBRM1 inhibitor PB16 treatment have a particularly high correlation with gene expression changes from ENZA treatment (Figure S13B).
The cBAF subcomplex also facilitates gene expression driven by FOXA1, ERG and MYC, and GBAF complexes also regulate AR-independent BRD4 target genes; therefore, we hypothesized that each subcomplex would regulate a unique subset of target genes in addition to shared AR target genes.47,50 To evaluate this, we determined the overlap of genes regulated by specific BAF subcomplex inhibitors (2–77, BD98, dBRD9, PB16) and genes regulated by ACBI1, which eliminates all three BAF subcomplexes. We observed correlation and overlap between the genes regulated by ACBI1 and the genes regulated by all four inhibitors tested, with the strongest overlaps observed for genes decreased with treatment, consistent with a general role for BAF in gene activation (Figure S13C). Therefore, we next compared the overlap between genes decreased with ACBI1, genes decreased with 2–77, and genes decreased with subcomplex-specific inhibitors BD98, dBRD9, or PB16 (Figure 8G). As expected, several genes, including AR target genes, were decreased with all drug treatments. Also, as suspected, subsets of genes decreased with ACBI1 were decreased with dBRD9 or BD98 but not 2–77, indicating inhibition of subcomplex-specific gene regulation. In contrast, almost all genes decreased with both ACBI1 and PB16 were also decreased with 2–77, consistent with inhibition of the same subcomplex (PBAF). This trend extended to all the genes differentially regulated by PB16 and those differentially regulated by 2–77, which showed an extremely high overlap and correlation (Figure 8H).
CONCLUSIONS
The BAF family of chromatin remodelers has emerged as a major therapeutic target, with small molecule inhibitors and degraders of the ATPase subunits BRG1/BRM and the GBAF subunit BRD9 currently under clinical development. The PBAF subcomplex has not explicitly been validated as a therapeutic target, and as a result, significantly less effort has been invested into developing inhibitors against this subcomplex. The lack of specific PBAF inhibitors precludes a better understanding of PBAF function and its potential as a therapeutic target. To break this cycle, we require chemical tools that specifically inhibit the PBAF function. In addition to the BRG1, PBAF contains two unique bromodomain-containing subunits, BRD7 and PBRM1, which, based on a recent cryo-EM structure, lie near the Histone H3 tail.56 The second, fourth, and fifth BDs of PBRM1 (BD2, BD4, and BD5, respectively) are most critical for the PBAF function by binding H3K14Ac (BD2 and BD5) and acetylated p53 (BD4), and as such, BD inhibitors have been developed for BD5 and BD2.18,23,45,57,58 The functional role of the BD of BRD7 in PBAF is less defined. PBAF has recently been implicated in prostate and breast cancer progression through response to oxidative stress; however, the contribution of the BRD7 BD is yet to be addressed.36,59
Here, we report the discovery and validation of the first inhibitor with selectivity for BRD7. Using structure-based drug design, we adopted structural components of BRD7/9 ligands to identify a scaffold that can occupy the BRD7 binding pocket in a unique sterically restricted fashion. By exploiting steric interactions, we developed a ligand with significantly reduced affinity to BRD9 BD. While our scaffolds display vastly improved BRD7 selectivity over known BRD7/9 ligands, they only display slightly increased BRD7 affinity. A combination of structural biology and medicinal chemistry in the future can be used to develop inhibitors with further improved affinity and selectivity for BRD7; however, the relative instability of the BRD7 BD may be a limitation due to the entropic penalties of BRD7 binding.13,14 The relative instability of BRD7 BD in vitro also makes the currently available assays for BD binding assessment challenging or impossible. To address this limitation, we developed an FP-based competition assay that eliminates confounding effects from unfolded protein and a cell-based NanoBRET competition assay. Our development of a more selective scaffold and robust biochemical assays will help further facilitate the pursuit of more potent BRD7-selective ligands. In addition, a more selective scaffold may facilitate the development of BRD7-selective PROTACs using the VHL-based BRD7/9 degrader VZ-185 as a starting point.19
We have also developed new cell-based assays of BRD7-dependent function. Using a series of PCa cell lines with differing BRD7 sensitivity, we identified a functional role for the BRD7 BD in facilitating AR target gene expression. We also validated BRD7 as a potential therapeutic target in AR-positive PCa. We have demonstrated that our BRD7 BD inhibitors are cellularly active and selectively inhibit the PBAF function at submicromolar to low micromolar concentrations. These compounds can be used as tools in future efforts to understand the biochemical role of PBAF in PCa gene regulation, particularly in AR-dependent transcription. In addition, they can be used to define the therapeutic potential of targeting PBAF in additional settings, such as in chemo-resistance during metastatic progression or in sensitizing cancers to immunotherapy.33,39,40
EXPERIMENTAL SECTION
Binding Site Analysis.
The binding pockets of the BD of BRD7 bound to BI9564 (PDB: 5MQ1) and the BD of BRD9 bound to BI9564 (PDB: 5F1H) were visualized and compared in the molecular visualization software PyMOL version 2.5.2 (Schrödinger). The same software was used to analyze the binding mode of the ligands in the published crystal structures of BI7273 bound to BRD7 (PDB: 6V1E) and BRD9 (PDB: 5EU1), of BI9564 bound to BRD7 (PDB: 6V1F) and BRD9 (PDB: 5F1H), of I-BRD9 bound to BRD7 (PDB: 6V17) and BRD9 (PDB: 6V1B), of TP-472 bound to BRD7 (PDB: 6V16) and BRD9 (PDB: 6V14), of bromosporine bound to BRD7 (PDB: 6V1H) and BRD9 (PDB: 5IGM), and of NI-48 bound to BRPF1B (PDB: 5T4V).
Docking Studies.
All the molecular docking studies were performed in the Schrödinger Maestro suite. Briefly, the designated ligands were prepared using LigPrep. For the binding pose analysis, a receptor grid was generated for the crystal structures of BRD7 bound to BI7273 (PDB: 6V1E), BRD9 bound to BI7273 (PDB: 5EU1), and BRPF1B bound to NI-48 (PDB: 5T4V). The docking screening was then performed with Glide with the precision set to SP and adding the Epik state penalties to the docking score. The top poses of each ligand for each BD were visualized and analyzed in PyMOL version 2.5.2 (Schrödinger).
Protein Purification.
Recombinant N-terminal His TEV-tagged BRD7 BD (Addgene plasmid no. 98245), N-terminal His TEV-tagged BRD9 BD (Addgene plasmid no. 39012), and His TEV-tagged BRPF1B BD (Addgene plasmid no. 53620) were expressed in BL21(DE3) Escherichia coli cells with kanamycin-containing LB broth agar. Transformed cells were incubated in kanamycin-containing LB broth until OD600 reached 0.6−1, and then IPTG was added to a final concentration of 1 mM. Protein expression was induced for 16 h at 20 °C. The bacteria were then pelleted by centrifugation at 4000g for 10 min at 4 °C and resuspended in HIS binding buffer (150 mM NaCl, 20 mM Tris, pH = 8, 25 mM imidazole, and leupeptin (Cayman), pepstatin A (Cayman), and aprotinin (Cayman) as protease inhibitors). Cells were lysed by sonication and centrifuged at 15,000g for 40 min at 4 °C. The supernatant was incubated for 2 h with HisPur Ni-NTA Resin equilibrated in the binding buffer. The beads were washed three times with binding buffer, and the proteins were then eluted in His elution buffer (150 mM NaCl, 5 mM Tris, 500 mM imidazole, pH = 8, protease inhibitors as described above). SDS-PAGE was used to confirm the purity of the protein.
Thermal Shift Assay Based on Differential Scanning Fluorimetry.
The TSA was performed following a previously reported protocol.60 The reaction was run in 20 μL using a StepOnePlus Real-Time PCR System (Applied Biosystems). The reaction was set up in the following buffer: 10 mM HEPES, pH = 7.0, 150 mM NaCl, 8× SYPRO Orange S6651 Invitrogen (5000× stock), 0.2 mg/mL His-tagged BRD7 BD or His-tagged BRD9 BD in elution buffer, 5% v/v DMSO containing the inhibitors at designated concentrations. Melting curves were obtained using a temperature gradient of 25−75 °C over 120 min with readings every 0.5 °C. Melting curves for His-tagged BRD7 BD, His-tagged BRD9 BD, and His-tagged BRPF1B BD were obtained for four replicates at each ligand concentration, and the Tm values were calculated using the nonlinear least squares fit in GraphPad Prism 9.
Fluorescence Polarization (FP) Assay.
His-tagged BRD7 and BRD9 BDs were purified as described above and dialyzed in the following reaction buffer: 20 mM Tris, 150 mM NaCl, 0.02% v/v Tween 20, pH = 8.0. The assay was completed in 384-well plates (Greiner medium binding Fluotrac or PerkinElmer Optiplate). The reaction volume was kept at 35 μL per well, and four replicates of each reaction were used. The plates were incubated and covered for 5 min before reading them in a Synergy Neo2 HTS multimode microplate reader (Biotek) with a xenon flash lamp as the light source. The excitation was set up at 485/20 nm and the emission at 528/20 nm. The gain was adjusted to a blank buffer or negative control well, and the FP estimates were determined from parallel and perpendicular intensities given in millipolarization (mP) values.
The relative affinity of the BRD7 BD for the FAM-labeled probe was evaluated by direct binding as follows: starting with a concentration of 80 μM of BRD7 BD, two-fold dilutions were performed to a minimum concentration of 1.22 nM while keeping the FAM-labeled probe concentration constant at 100 nM and the DMSO content at a maximum of 1.25% v/v. The same procedure was used for the BRD9 BD but starting with a concentration of 20 μM to a minimum of 0.01 nM.
Based on the relative affinity results, 5 μM BRD7 BD and 250 nM BRD9 BD were used for performing the competitive assay. The FAM-labeled probe was kept constant at 100 nM and the DMSO content at a maximum of 1.25% v/v. Starting with a top concentration of 25 or 50 μM of ligand, two-fold dilutions were performed to a minimum concentration of 24.4 nM. The results of the assays were graphed in GraphPad Prism 9 and analyzed using a “one site-specific binding” fit for the direct binding assay and a nonlinear “[inhibitor] vs response − variable slope (four parameters)” fit for the competitive assay.
Ki estimations based on the experimental IC50 were calculated employing an equation reported in the literature.41,61 Ki = IC50/([L]50/Kd + [P]0/Kd + 1), where IC50 is the concentration of the inhibitor at 50% inhibition, [L]50 is the concentration of the free FAM-labeled probe at 50% inhibition, Kd is the dissociation constant of the protein−FAM-labeled probe complex (obtained from the direct binding assay), and [P]0 is the concentration of the free protein at 0% inhibition.
Microscale Thermophoresis (MST) Assay.
His-tagged BRD7 and BRD9 BDs were purified as described above and dialyzed in the following reaction buffer: 1 mM imidazole, 20 mM Tris, 150 mM NaCl, 0.01% v/v Tween 20, pH = 8.0. A Monolith His-Tag Labeling Kit RED-tris-NTA 2nd Generation (Nanotemper MO-L018) was used to label the proteins with a fluorescent dye for this assay.
The dye was resuspended in 25 μL of reaction buffer to obtain a 5 μM dye solution, and its affinity for the target proteins was evaluated as follows: 200 μL of 50 nM dye was prepared by mixing 2 μL of dye and 198 μL of reaction buffer. Thirty microliters of 4 μM His-tagged protein was prepared and used to perform 15 two-fold 10 μL dilutions in the reaction buffer. Ten microliters of 50 nM dye was added to each well and mixed by pipetting. The reactions were incubated for 30 min at room temperature. Each reaction was loaded to a separate Monolith NT.115 Series capillaries (Nanotemper MO-K022), and the MST of the samples was measured in a MonolithX (Nanotemper MM-231) instrument at 670 nM on 1.5 s time with 100% excitation and medium IR laser power.
Based on the relative affinity results, 500 nM His-tagged BRD7 and 50 nM His-tagged BRD9 were used for performing the MST experiments. The dye final concentration was kept at 50 nM.
To label the proteins, a solution of 100 nM dye was prepared. Based on the relative affinity of the proteins to the dye, the His-tagged BRD7 and BRD9 concentrations were adjusted to 2 μM and 200 nM, respectively. The dye (100 nM) and the protein to be tested were mixed in a 1:1 ratio and incubated for 30 min at room temperature. The reaction was then centrifuged for 10 min at 4 °C and 15,000g, and the supernatant was employed for the binding assay.
To obtain the binding curves, a concentration gradient of the ligand to be tested was prepared in the reaction buffer starting from 50 μM, followed by 15 2-fold dilutions, keeping a DMSO content of 1% v/v. Ten microliters of labeled protein was added to each 10 μL reaction and mixed by pipetting. The final concentrations of His-tagged BRD7 and BRD9 in the assay were 500 and 50 nM, respectively. Each reaction was loaded to a separate Monolith NT.115 Series capillaries (Nanotemper MO-K022), and the samples were measured in a MonolithX (Nanotemper MM-231) instrument at 670 nM on 1.5 s time with 100% excitation and medium IR laser power. The Kd was derived from the MST graphs by MO.Control 2 software, which takes into consideration the concentration of the proteins and the dye in the assay.
BROMOscan Bromodomain Profiling (bromoKdELECT, BromoMAX Panel).
BROMOscan BD profiling was provided by Eurofins DiscoverX Corp. (San Diego, CA, USA, http://www.discoverx.com). Compounds 1–38, 1–78, and 2–77 were tested at 2 μM in a BromoMAX panel; 1–78 and 2–77 were tested in a concentration gradient starting at a top concentration of 10 μM in a bromoKdELECT assay. The results for binding interactions for the compounds are reported as % of control (DMSO).
NanoBRET Assay.
For the NanoBRET screening, the NanoBRET TE Intracellular BRD Assay-02 kit (Promega CS1810C21) was used. NanoLuc fusion BRD7-BD-Luc, BRD9-BD-Luc, and BRPF1-BD-Luc were manufactured by Promega. The assay employed HEK293T cells cultivated as described in Cell Lines. The assay was set up in white, flat-bottom, non-binding surface 96-well plates (Corning 3992), and three wells of each concentration were tested.
On the day before the assay was performed, HEK293T cells were trypsinized and collected to prepare a 15 mL suspension of 200,000 cells/mL per DNA construct in a sterile, conical tube. Lipid:DNA complexes were prepared by first preparing a 10 μg/mL solution of DNA in Opti-MEM without phenol red (Gibco 11058021) containing the following amounts: 9.0 μg/mL Transfection Carrier DNA, 1.0 μg/mL NanoLuc fusion DNA, completed to 730 μL with Opti-MEM without phenol red. After mixing thoroughly, 21.8 μL of FuGENE HD (Promega E2311) was added. The solution was mixed by inversion for 5−10 times and incubated at room temperature for 20 min. The lipid:DNA mix was then added to the cell suspension and mixed by inverting 5 times. The cells mixed with the lipid:DNA complex were then incubated in a 10 cm plate at least for 24 h to allow expression.
To evaluate the relative affinity of the NanoLuc fusion proteins for the NanoBRET Tracer, we performed a direct binding assay (Figure S9). Starting with a top concentration of 400 μM, two-fold dilutions of NanoBRET Tracer were performed to a concentration of 1.56 μM in DMSO to make 100× Tracer solutions. One part of 100× NanoBRET Tracer was mixed with 4 parts NanoBRET Tracer Dilution Buffer to generate 20× NanoBRET Tracer dilutions. A “no tracer” solution was prepared by mixing 1 part DMSO with 4 parts NanoBRET Tracer Dilution Buffer. The cells were then trypsinized, neutralized with regular media, and centrifuged at 250g for 5 min. The cells were then resuspended in Opti-MEM without phenol red, and the cell density was adjusted to 200,000 cells/mL. Sixty-eight microliters of cell suspension per well was added into a white, non-binding surface, 96-well plate. Four microliters per well of each 20× NanoBRET Tracer dilution or “no tracer” solution was added to three wells containing suspended cells. The plate was then mixed on an orbital shaker for 15 s at 500 rpm with 1 mm diameter of shaking (GloMax Discover plate reader, Promega). A 10× “no inhibitor” solution was prepared by mixing 1 part DMSO with 9 parts Opti-MEM without phenol red. Eight microliters of “no inhibitor” dilution was added to each well. The plate was then mixed on an orbital shaker for 15 s at 500 rpm with 1 mm diameter of shaking (GloMax Discover plate reader, Promega) and incubated at 37 °C in a 5% CO2 incubator for 2 h. The plate was allowed to cool down to room temperature for 15 min before adding the 3× complete NanoBRET Nano-Glo mix as described below.
Less than 2 h before BRET measurements, the 3× complete NanoBRET Nano-Glo mix was prepared in Opti-MEM without phenol red. This mixture consisted of a 1:166 dilution of NanoBRET Nano-Glo Substrate plus a 1:500 dilution of Extracellular NanoLuc Inhibitor in Opti-MEM without phenol red, which were mixed gently by inversion for 5−10 times in a conical tube. Forty microliters of 3× complete NanoBRET NanoGlo mix was added to each well, and the plate was incubated for 2−3 min at room temperature. The donor and acceptor emissions were measured at 450 and 610 nm, respectively, in a SpectraMax iD5 plate reader employing the LUM-Dual Color Endpoint readout protocol, with an integration time of 1000 ms and a read height of 1 mm from the plate. The BRET ratio in mBU with background correction was calculated employing the equation BRET ratio = [(acceptorsample/donorsample) − (acceptorno tracer control/donorno tracer control)] × 1000, where acceptorsample and donorsample are respectively the acceptor and donor emissions of each well. Acceptor no tracer control and donor no tracer control are respectively the average of the acceptor and donor emissions of the three wells where the “no tracer” solution was added.
Based on the direct binding assay results, a final concentration of 0.4 μM of tracer was used for performing the competitive assay. A 100× NanoBRET Tracer solution (40 μM) was prepared in DMSO. One part of 100× NanoBRET Tracer was mixed with 4 parts NanoBRET Tracer Dilution Buffer to generate the 20× NanoBRET Tracer dilution (8 μM). A “no tracer” solution was prepared by mixing 1 part DMSO to 4 parts NanoBRET Tracer Dilution Buffer. Cells were trypsinized, centrifuged, and resuspended in Opti-MEM, and their density was adjusted to 200,000 cells/mL as described above. Sixty-eight microliters of cell suspension per well was added into a white, non-binding surface, 96-well plate. Four microliters per well of 20× NanoBRET Tracer dilution was added to wells containing suspended cells; 4 μL of “no tracer” solution was added to three wells containing suspended cells. The plate was then mixed on an orbital shaker for 15 s at 500 rpm with 1 mm diameter of shaking (GloMax Discover plate reader, Promega). Starting with a top concentration of 10 mM, two-fold dilutions of the 1000× inhibitor were performed to a minimum concentration of 20 μM in DMSO. 10× solutions were prepared by mixing 1 part 1000× solution with 9 parts Opti-MEM without phenol red. A “no inhibitor” mixture was prepared by mixing 1 part DMSO with 9 parts Opti-MEM without phenol red. Eight microliters of each concentration per well was added to wells containing cells with 1× tracer. For the controls, 8 μL of “no inhibitor” mixture was added to the three wells containing “no tracer” solution and three other wells containing 1× tracer. The plate was then mixed on an orbital shaker for 15 s at 500 rpm with 1 mm diameter of shaking (GloMax Discover plate reader, Promega) and incubated at 37 °C in a 5% CO2 incubator for 2 h. The plate was allowed to cool down to room temperature for 15 min before adding the 3× complete NanoBRET Nano-Glo mix as described above. The donor and acceptor emissions were measured at 450 and 610 nm, respectively, in a SpectraMax iD5 plate reader following the protocol described above. The BRET ratio in mBU was calculated as described above, where acceptorno tracer control and donorno tracer control are respectively the average of the acceptor and donor emissions of the three wells where the “no tracer” and “no compound” solutions were added.
The results of the assays were graphed in GraphPad Prism 9 and analyzed using a nonlinear “one site-specific binding” fit for the direct binding assay and a nonlinear “[inhibitor] vs response − variable slope (four parameters)” fit for the competitive assay.
Cell Lines.
HEK293T (RRID:CVCL_0063), LNCaP (clone FGC; RRID:CVCL_1379), PC-3 (RRID:CVCL_0035), RWPE-1 (RRID:CVCL_3791), DU145 (RRID:CVCL_0105), 22Rv1 (RRID: CVCL_1045), and C4–2 (RRID:CVCL_4782) cells were purchased from ATCC. PC-3 cells were cultured in F12K media supplemented with 10% v/v FBS, 100 U/mL penicillin, 100 g/mL streptomycin, 2 mM l-alanyl-l-glutamine (Corning Glutagro), and 2.5 μg/mL Plasmocin (InvivoGen). HEK293T cells were cultured in DMEM media and 1 mM sodium pyruvate and supplemented as above. LNCaP and 22Rv1 cells were cultured in RPMI-1640 with 1× MEM non-essential amino acids, 1 mM sodium pyruvate, and 0.1 M HEPES (Cytiva) and supplemented as above. RWPE-1 cells were cultured in Keratinocyte SFM (Gibco 17005−042, Thermo Fisher Scientific) supplemented with 0.05 mg/mL Bovine Pituitary Extract (Gibco 13028–014), 0.005 μg/mL EGF Human Recombinant (Gibco 10450–013), 100 U/mL penicillin, 100 g/mL streptomycin, and 2.5 μg/mL Plasmocin (InvivoGen). DU145 and C4–2 cells were cultured following ATCC suggestions supplemented with 100 U/mL penicillin, 100 g/mL streptomycin, and 2.5 μg/mL Plasmocin (InvivoGen).
Cell Fractionation Assay.
The cell fractionation assay was performed based on previously reported protocols.4,62 After 24 h of treatment with vehicle, 10 μM I-BRD9, 10 μM 1–78, or 10 μM 2–77, 20 million HEK293T cells were harvested for processing. Cells were washed twice with cold phosphate-buffered saline and then resuspended in 500 μL of Buffer A (0.05 mM EDTA, 25 mM HEPES, 5 mM MgCl2, 10% v/v glycerol, 25 mM KCl, 0.1% v/v NP40) and incubated for 8 min on ice. The samples were then centrifuged at 1300g for 5 min at 4 °C; supernatant 1 was collected (cytosolic fraction) and pellet 1 (nuclei) was resuspended in 500 μL of Buffer 2 (3 mM EDTA, 0.2 mM EGTA, 150 mM NaCl, 5 mM Tris, pH = 6.9). The nuclear-soluble fraction was then collected after centrifugation at 20,000g for 15 min at 4 °C. The pellet (chromatin fraction) was resuspended in 500 μL of Buffer L (125 mM Tris, 140 mM SDS, 20% v/v glycerol, 10% v/v β-mercaptoethanol, 2 mM MgCl2, pH = 6.9). Two microliters of benzonase endonuclease was added to each sample to release the chromatin-bound proteins, and the samples were then incubated shaking at 500 rpm for 16 h at 37 °C. The supernatant containing the chromatin-bound proteins was collected for immunoblot analysis. The inhibitors were added to a final concentration of 10 μM to each buffer. DTT was added to a final concentration of 1 mM. A cocktail of protease inhibitors as described above was also added to the buffers right before each step.
For immunoblot analysis, the chromatin-bound protein samples were diluted in a 1:3 ratio with a mixture of β-mercaptoethanol and 4× Bolt LDS Sample Buffer (Invitrogen) in a 1:9 ratio and then boiled at 95 °C for 30 min to reduce viscosity. Equal volumes of the samples were loaded to the 4−12% SDS-polyacrylamide gel (Invitrogen).
Whole cell lysates were prepared as well for immunoblot analysis. After 24 h of treatment with vehicle, 10 μM I-BRD9, 10 μM 1–78, or 10 μM 2–77, HEK293T cells were harvested for processing. Cells were washed once with phosphate-buffered saline buffer and then resuspended in RIPA buffer (50 mM Tris pH = 8, 150 mM NaCl, 1% v/v NP40, 0.1% w/v SDS, 0.5% w/v sodium deoxycholate). A cocktail of protease inhibitors was added to the buffer right before use. The samples were then incubated for 20 min on ice and centrifuged at 15,000g for 30 min at 4 °C. The samples were prepared for immunoblotting by mixing them in a 1:3 ratio with a mixture of β-mercaptoethanol and 4× Bolt LDS Sample Buffer (Invitrogen) in a 1:9 ratio and then boiling them at 95 °C for 15 min. Equal amounts of protein from the samples were loaded into the 4−12% SDS-polyacrylamide gel (Invitrogen).
Immunoblotting.
Cell lysate samples were denatured for at least 5 min at 95 °C, electrophoresed on 4−12% SDS-polyacrylamide gels (Invitrogen), and transferred onto Immobilon-FL PVDF membranes (Millipore Sigma). The membranes were then blocked for 30 min in Immobilon Signal Enhancer (Millipore Sigma) and stained overnight with primary antibodies. For secondary antibody staining, the membranes were washed with Tris-buffered saline buffer with 0.1% v/v Tween-20 and incubated for 1 h with infrared dye-labeled goat anti-mouse or anti-rabbit antibodies (LICOR Biotechnology). Images were obtained using an Odyssey Clx imager (LICOR Biotechnology).
Antibodies.
β-Actin (Santa Cruz Biotechnology sc-47778; 1:2000), BRD7 (B-8) (Santa Cruz Biotechnology sc-376180; 1:250), BRD9 (Bethyl Laboratories A303–781A; 1:1000), GAPDH (6C5) (Santa Cruz Biotechnology sc-32233; 1:500), Histone H3 (Active Motif 39064; 1:10,000), and TATA binding protein (TBP) (Abcam ab818; 1:2000) were used in this study.
Lentiviral Production.
A total of 20,000,000 HEK293T cells were cultured overnight and transfected after 16 h with pLKO.1 puro empty vector (Addgene plasmid #8453), shBRD7–1 (TRCN0000151186), shBRD7–2 (TRCN0000154102), or shPBRM1 (TRCN0000015994) knockdown constructs in addition to the packaging vectors pMD2.G (Addgene plasmid #12259) and psPAX2 (Addgene plasmid #12260). After 16 h of incubation, the media were changed. Forty-eight hours of incubation after medium change, the supernatant was ultracentrifuged at 17,500g for 2 h at 4 °C. The pellet was then resuspended in 200 μL of phosphate-buffered saline and stored at −80 °C.
Knockdown Experiments.
A total of 500,000−600,000 cells were seeded in 6 cm plates and incubated for 24−72 h such that the cells were 50−80% confluent before adding 5 μL of lentivirus containing pLKO.1 puro empty vector, shBRD7–1, or shBRD7−2. Twenty-four hours after transduction, cells were selected by treatment with puromycin (2 μg/mL) for 48 h. Cells were then counted, seeded in a 96-well plate in a density of 5000 cells per well, and incubated for 4 days. Cell viability was measured with a CellTiter-Glo kit (Promega) in a GloMax Discover plate reader (Promega) on day 0 and day 4. The fold increase in growth was calculated and reported relative to the empty vector control.
To evaluate the efficacy of the constructs, cells were transduced with lentivirus containing pLKO.1 puro empty vector, shBRD7–1, or shBRD7−2 and selected for 48 h with puromycin (2 μg/mL) after transduction. Cells were collected, resuspended in Buffer A (0.05 mM EDTA, 25 mM HEPES, 5 mM MgCl2 , 10% v/v glycerol, 25 mM KCl, 0.1% v/v NP40), and incubated for 15 min on ice. The samples were then centrifuged at 600g for 5 min at 4 °C. The pellet was resuspended in Buffer B (20 mM HEPES, 150 mM NaCl, 7.5 mM MgCl2, 1% v/v Triton X-100) and incubated while rotating for 30 min at 4 °C. A cocktail of protease inhibitors as described above was added to the buffers right before each step. The samples were then centrifuged at 10,000g for 10 min at 4 °C. The protein content of the supernatant of each sample was obtained with a Pierce BCA Protein Assay Kit (Thermo Fisher Scientific). The samples were prepared for immunoblotting by mixing them in a 1:3 ratio with a mixture of β-mercaptoethanol and 4× Bolt LDS Sample Buffer (Invitrogen) in a 1:9 ratio and then boiling them at 95 °C for 15 min. Equal amounts of protein from the samples were loaded into a 4−12% SDS-polyacrylamide gel (Invitrogen) for immunoblot analysis.
Growth Inhibition Experiments.
Cells were seeded in a 96-well plate (no. 655098, Greiner Bio-One) with a density of 5000 cells per well. Treatment with inhibitors at 5, 1, or 0.1 μM started the day after seeding with a final content of 0.1% v/v DMSO in the media. Media with treatment were changed every 48 h. Cell viability was measured with a CellTiter-Glo kit (Promega) in a GloMax Discover plate reader (Promega) 4 days after starting the treatment and reported as a percent of DMSO control.
For obtaining IC50 curves, 5000 LNCaP, 22Rv1, or C4–2 cells or 2000 PC-3 cells per well were seeded in a 96-well plate (no. 655098, Greiner Bio-One). Starting with a top concentration of 10 μM, cells were treated with two-fold dilutions performed to a concentration of 0.04 μM of 1–78 or 2–77 in media with 0.1% v/v DMSO. Media with treatment were changed every 48 h. Cell viability was measured with a CellTiter-Glo kit (Promega) in a GloMax Discover plate reader (Promega) 7 days after starting the treatment and reported as a percent of DMSO control.
On-Target Activity Assessment In Cellulo.
A total of 500,000 22Rv1 cells were seeded in 6 cm plates and incubated for 24 h before adding 5 μL of lentivirus containing pLKO.1 puro empty vector, shBRD7–1, or shBRD7–2. Twenty-four hours after transduction, cells were selected by treatment with puromycin (2 μg/mL) for 48 h. Cells were then counted and seeded in a 96-well plate (no. 655098, Greiner Bio-One) in a density of 5000 cells per well. Twenty-four hours after seeding, treatment with 2.5 or 5 μM 1–78 or 2–77 or vehicle was started in media with 0.1% v/v DMSO. Media with treatment were changed every 48 h. Cell viability was measured with a CellTiter-Glo kit (Promega) in a GloMax Discover plate reader (Promega) 4 days after starting the treatment and reported as relative luciferase units.
RNA-Seq Library Prep and Data Analysis.
LNCaP cells were treated in triplicate with 1 μM 2–77, 10 μM ENZA, 0.2 μM ACBI, 2 μM BD98, 10 μM PB16, or DMSO for 72 h on 10 cm plates in RPMI growth media with 10% v/v FBS. After 72 h of drug treatment, cells were trypsinized and RNA was extracted using TRIzol (Invitrogen 15596026). Next, TRIzol was further purified by column purification using PureLin Genomic RNA Mini Kit (Invitrogen 12183018A) with on-column PureLin DNase treatment (Invitrogen 12185010). The RNA quality and concentration were determined using a Thermo Fisher Qubit fluorimeter and Agilent Bioanalyzer, and all samples had a RIN score of 9.5 or greater. DNA libraries were generated using the Illumina Stranded mRNA Prep kit (20040534) with sets of IDT for Illumina RNA UD Indexes (20040553), and the concentration was determined using an Agilent Bioanalyzer. Libraries were pooled with equimolar amounts using cluster numbers obtained from MiSeq and sent for 150 bp paired-end sequencing on the NovaSeq 6000 platform (Novogen, Sacramento, CA). Sequencing data were processed using Partek workflow. Read alignment to the human genome build hg38 was performed with STAR 2.7.8a,63 the Partek E/M model was used to assemble gene level expression data from filtered alignments, and differential gene expression analysis was conducted using DESeq2.64 Differential gene expression from LNCaP cells treated with 0.5 μM dBRD9 for 3 days was previously published.47 Correlations were calculated using GraphPad Prism 9. Pathway analysis was performed using enrichr for 2020_MSigDB_Hallmark gene sets. Enrichments of gene sets were performed using GSEA. Quantitative overlap analysis was performed using eulerr.65 Sequencing data were deposited into GEO with accession number GSE228587.
Chemistry.
Chemistry General Information.
All solvents and reagents, unless otherwise noted, were obtained from commercial sources and used without further purification. Reaction monitoring was done by TLC and visualized under UV light or stained with iodine or by mass spectrometry using an Advion ExpressION CMS instrument. Columns for chromatography were prepared using silica gel 0.060−0.200 mm, 40 Å (Acros Organics). 1H NMR and 13C NMR data were recorded in CDCl3 on a Bruker AV-III-500-HD spectrometer. The NMR spectra are provided in Figure S14, and the results are reported as follows: chemical shift (δ) in ppm, multiplicity (s = singlet, d = doublet, t = triplet, dd = doublet of doublets, dt = doublet of triplets, m = multiplet, and br = broad signal), integration, and coupling constant (J) in hertz. The mass spectra of the small molecule inhibitors were obtained on an Agilent 1260 HPLC coupled to an Agilent 6550 Quadrupole Time-of-Flight (Q-TOF) Mass Spectrometer. All compounds are >95% pure by HPLC.
For purification and characterization of BI-FAMa and BI-FAMb, analytical HPLC separations were completed using an Agilent 1100 system with detection at 215 nm using a water/MeCN gradient containing 0.1% v/v TFA. Preparative HPLC separations were conducted using a Varian ProStar system with detection at 215 and 254 nm using a water/MeOH gradient containing 0.1% TFA. ESI-LCMS was completed using a Waters Acquity UPLC with SQD2 mass spectrometer, equipped with a C18 reverse phase column, or an Agilent LC/MSD iQ (Agilent #G6160A, single quadrupole). Eluents of MeCN and water (each with 0.1% v/v formic acid) were used as linear gradients (% v/v MeCN in water) of 5% to 95% (0.5 to 6 min), 95% to 5% (6 to 6.5 min), and 5% (6.5 to 7.0 min). Flash column chromatography was performed using Sorbent Technologies 70 Å silica gel (40−75 μm particle size).
4-Bromo-2-methylisoquinolin-1(2H)-one (1).
4-Bromoisoquinolin-1-ol (1 equiv) was dissolved in THF (anhydrous, 10−15 mL) and cooled to 0 °C. Cesium carbonate (3 equiv) was then added followed by methyl iodide (1.2 equiv). The reaction was allowed to warm to room temperature over 16 h, then concentrated, and resuspended in DCM. The mixture was then filtered through a plug of Celite and washed with DCM (2 × 20 mL) and water (2 × 20 mL). The organic layer was extracted and washed with water (3 × 20 mL) and brine (2 × 20 mL). The organic layer was then concentrated and dried to give 1. Yield: 95%.13
7-Bromo-1,4-dimethylquinolin-2(1H)-one (2).
7-Bromo-4-methyl-quinolin-2(1H)-one (1 equiv) was dissolved in DMF (anhydrous, 10−15 mL) and cooled to 0 °C. Methyl iodide (1.2 equiv) was then added followed by sodium hydride (1.3 equiv). The reaction was allowed to warm to room temperature over 16 h and quenched with sodium hydroxide (1 M). The mixture was then diluted with water/ethyl acetate, and the organic layer was extracted, dried, and concentrated to give 2. Yield: 95%.15
General Method A: For Compounds 1–38, 1–70, 1–79, and 2–88 (Core 1) and 1–75 and 1–78 (Core 3).
Aryl bromide (1 equiv) was dissolved in DMF (anhydrous, 10−15 mL) under argon. Then, Pd(dppf)Cl2 (15%), cesium carbonate (5 equiv), and pinacol ester or boronic acid (1.2 eq) were added to the reaction flask. The reaction was stirred for 12−16 h under reflux. Once completed, the mixture was filtered through a plug of Celite and washed with ethyl acetate (2 × 20 mL). The filtrate was washed with water (2 × 20 mL) and brine (2 × 20 mL). The organic layer was dried with anhydrous sodium sulfate and concentrated. The resulting crude product was purified by column chromatography to yield the desired product.
4-(3,5-Dimethylphenyl)-2-methylisoquinolin-1(2H)-one (1–38).
Aryl bromide: 1. Boronic acid/pinacol ester: (3,5-dimethylphenyl)-boronic acid. Column: 20−50% ethyl acetate in hexanes; yield = 35%. 1H NMR (500 MHz, chloroform-d) δ 8.52 (d, J = 7.4 Hz, 1H), 7.62−7.55 (m, 2H), 7.53−7.48 (m, 1H), 7.06 (s, 1H), 7.03 (d, J = 1.8 Hz, 3H), 3.65 (s, 3H), 2.38 (s, 6H). 13C NMR (126 MHz, CDCl3) δ 162.20, 138.23, 136.54, 136.16, 131.92, 131.27, 129.30, 128.02, 127.74, 126.82, 125.87, 124.83, 119.80, 37.03, 29.72, 21.35. HRMS calcd for C18H17NO [M + H]+, 264.13728; found, 264.1339.
4-(8-Methoxyquinolin-5-yl)-2-methylisoquinolin-1(2H)-one (1–70).
Aryl bromide: 1. Boronic acid/pinacol ester: 8-methoxy-5-(4,4,5,5-tetramethyl-1,3,2-dioxaborolan-2-yl)quinoline. Column: 20% ethyl acetate in hexanes; yield = 6.2%. 1H NMR (500 MHz, CDCl3) δ 8.96 (dd, J = 5.0, 2.7 Hz, 1H), 8.24 (dd, J = 8.6, 2.0 Hz, 1H), 7.51−7.36 (m, 7H), 7.12 (d, J = 2.4 Hz, 1H), 4.14 (s, 3H), 4.10 (s, 3H). HRMS calcd for C20H16N2O2 [M + H]+, 317.12728; found, 317.0786.
4-(6-Methoxy-2-methylpyridin-3-yl)-2-methylisoquinolin-1(2H)-one (1–79).
Aryl bromide: 1. Boronic acid/pinacol ester: 6-methoxy-2-methyl-3-(4,4,5,5-tetramethyl-1,3,2-dioxaborolan-2-yl)pyridine. Column: 20−30% ethyl acetate in hexanes; yield = 53%. 1H NMR (500 MHz, chloroform-d) δ 8.52 (d, J = 8.0 Hz, 1H), 7.57 (t, J = 8.2 Hz, 1H), 7.51 (t, J = 7.5 Hz, 1H), 7.40 (d, J = 8.3 Hz, 1H), 7.10 (d, J = 7.9 Hz, 1H), 6.66 (d, J = 8.3 Hz, 1H). 13C NMR (126 MHz, CDCl3) δ 163.42, 162.29, 155.87, 141.58, 136.82, 132.19, 131.91, 128.09, 127.02, 125.89, 124.57, 123.00, 116.75, 107.58, 53.51, 37.08, 22.79. HRMS calcd for C17H16N2O2 [M + H]+, 281.12728; found, 281.1077.
4-(2,6-Dimethoxypyridin-3-yl)-2-methylisoquinolin-1(2H)-one (2–88).
Aryl bromide: 1. Boronic acid/pinacol ester: 2,6-dimethoxy-3-(4,4,5,5-tetramethyl-1,3,2-dioxaborolan-2-yl)pyridine. Column: 20−50% ethyl acetate in hexanes; yield = 34%. 1H NMR (500 MHz, chloroform-d) δ 8.50 (d, J = 7.9 Hz, 1H), 7.56 (t, J = 8.1 Hz, 1H), 7.49 (t, J = 7.5 Hz, 1H), 7.46 (s, 1H), 7.21 (d, J = 7.1 Hz, 1H), 7.00 (s, 1H), 6.42 (d, J = 7.9 Hz, 1H), 3.99 (s, 3H), 3.88 (s, 3H), 3.64 (s, 3H). 13C NMR (126 MHz, CDCl3) δ 163.10, 160.74, 143.20, 136.80, 132.34, 131.75, 127.86, 126.74, 124.81, 109.71, 100.91, 53.71, 53.53, 37.07. HRMS calcd for C17H16N2O3 [M + H]+, 297.12728; found, 297.1022.
7-(3,5-Dimethylphenyl)-1,4-dimethylquinolin-2(1H)-one (1–75).
Aryl bromide: 2. Boronic acid/pinacol ester: (3,5-dimethylphenyl)-boronic acid. Column: 10−30% ethyl acetate in hexanes; yield = 68%. 1H NMR (500 MHz, chloroform-d) δ 7.74 (d, J = 8.2 Hz, 1H), 7.52 (d, J = 1.7 Hz, 1H), 7.47 (d, J = 9.8 Hz, 1H), 7.26 (d, J = 1.9 Hz, 2H), 7.07 (s, 1H), 6.61 (d, J = 1.4 Hz, 1H), 3.77 (s, 3H), 2.92 (d, J = 34.6 Hz, 1H), 2.48 (d, J = 1.2 Hz, 3H), 2.42 (s, 6H), 2.33 (s, 1H). 13C NMR (126 MHz, CDCl3) δ 162.47, 146.44, 143.90, 140.40, 140.08, 138.64, 129.85, 125.55, 125.34, 121.34, 120.67, 120.46, 112.95, 29.42, 21.45, 18.97. HRMS calcd for C19H19NO [M + H]+, 278.15728; found, 278.1472.
7-(6-Methoxy-2-methylpyridin-3-yl)-1,4-dimethylquinolin-2(1H)-one (1–78).
Aryl bromide: 2. Boronic acid/pinacol ester: 6-methoxy-2-methyl-3-(4,4,5,5-tetramethyl-1,3,2-dioxaborolan-2-yl)pyridine. Column: 20−40% ethyl acetate in hexanes; yield = 45%. 1H NMR (500 MHz, chloroform-d) δ 7.73 (d, J = 8.2 Hz, 1H), 7.48 (d, J = 8.3 Hz, 1H), 7.20 (d, J = 9.6 Hz, 1H), 6.67 (d, J = 8.3 Hz, 1H). 13C NMR (126 MHz, CDCl3) δ 163.03, 162.28, 153.26, 146.24, 142.65, 140.13, 139.83, 128.93, 125.17, 123.26, 121.04, 120.27, 115.12, 107.68, 53.53, 29.30, 24.86, 23.16, 18.97. HRMS calcd for C18H18N2O2 [M + H]+, 295.14728; found, 295.1236.
General Method B: For Compounds 2–79 (Core 1) and 2–77 and 2–81 (Core 3).
Aryl bromide (1 equiv) was dissolved in 1,4-dioxane (anhydrous, 10−15 mL), and Pd(dppf)Cl2, cesium carbonate, and pinacol ester were added. The reaction was stirred for 48 h (2–79) or 72 h (2–77 and 2–81) under reflux. Once completed, the mixture was filtered through a plug of Celite and washed with ethyl acetate (3 × 20 mL) and DCM (1 × 25 mL). The organic layer was dried with anhydrous Na2SO4 and concentrated. The resulting crude product was purified by column chromatography to yield the desired product.
4-(2-Methoxynaphthalen-1-yl)-2-methylisoquinolin-1(2H)-one (2–79).
Aryl bromide: 1. Pinacol ester: 2-(7-methoxynaphthalen-1-yl)-4,4,5,5-tetramethyl-1,3,2-dioxaborolane. Column: 10−50% ethyl acetate in hexanes; yield = less than 15%. 1H NMR (500 MHz, chloroform-d) δ 7.97 (d, J = 1.5 Hz, 1H), 7.91 (d, J = 1.1 Hz, 1H), 7.88−7.82 (m, 2H), 7.75 (d, J = 8.1 Hz, 1H), 7.49−7.39 (m, 2H), 7.34−7.09 (m, 3H), 3.92 (s, 3H), 3.77 (d, J = 1.9 Hz, 3H). HRMS calcd for C21H17NO2 [M + H]+, 316.13728; found, 316.1093.
7-(2,6-Dimethoxypyridin-3-yl)-1,4-dimethylquinolin-2(1H)-one (2–77).
Aryl bromide: 2. Pinacol ester: 2,6-dimethoxy-3-(4,4,5,5-tetramethyl-1,3,2-dioxaborolan-2-yl)pyridine. Column: 20−40% ethyl acetate in hexanes; yield = 47%. 1H NMR (500 MHz, chloroform-d) δ 7.71 (d, J = 8.3 Hz, 1H), 7.65 (d, J = 8.0 Hz, 1H), 7.54 (s, 1H), 7.41 (d, J = 8.2 Hz, 1H), 6.58 (s, 1H), 6.45 (d, J = 8.0 Hz, 1H), 3.99 (s, 6H), 3.74 (s, 3H), 2.47 (s, 3H). 13C NMR (126 MHz, CDCl3) δ 162.76, 159.41, 146.19, 141.55, 139.79, 139.35, 124.88, 122.93, 120.89, 120.13, 114.81, 114.72, 101.64, 53.74, 53.63, 29.31, 18.96. HRMS calcd for C18H18N2O3 [M + H]+, 311.13728; found, 311.1267.
7-(2-Methoxynaphthalen-1-yl)-1,4-dimethylquinolin-2(1H)-one (2–81).
Aryl bromide: 2. Pinacol ester: 2-(7-methoxynaphthalen-1-yl)-4,4,5,5-tetramethyl-1,3,2-dioxaborolane. Column: 20−30% ethylacetate in hexanes; yield = 32%. 1H NMR (500 MHz, chloroform-d) δ 7.94 (d, J = 9.1 Hz, 1H), 7.88−7.82 (m, 2H), 7.47 (d, J = 6.6 Hz, 1H), 7.41 (d, J = 6.1 Hz, 2H), 7.38−7.34 (m, 2H), 7.29 (d, J = 8.1 Hz, 1H), 6.66 (s, 1H), 3.87 (s, 3H), 3.68 (s, 3H), 2.54 (s, 3H). 13C NMR (126 MHz, CDCl3) δ 162.35, 153.76, 146.43, 139.88, 139.28, 133.33, 129.81, 128.97, 128.07, 126.76, 125.03, 124.83, 124.16, 123.76, 120.98, 120.50, 117.01, 113.47, 56.67, 29.36, 24.64, 19.04. HRMS calcd for C22H19NO2 [M + H]+, 330.14728; found, 330.1244.
General Method C: For Compounds 2–49 and 2–63 (Core 2) and 2–70 and 2–71 (Core 4).
Step 1: Aryl aldehyde (0.5 mmol) was dissolved in THF under argon and cooled to 0 °C. The Grignard reagent (5 equiv) was added dropwise over 10 min. The reaction was stirred until completion and allowed to warm to room temperature over 8−16 h. Once the reaction was complete, the mixture was cooled to 0 °C and quenched by slowly adding water. The mixture was then extracted with ethyl acetate (2 × 20 mL), where the organic fractions were collected, dried with anhydrous sodium sulfate, and concentrated. Step 2: The crude product from step 1 was dissolved in DCM, and pyridinium dichromate (3 equiv) was added. The reaction was allowed to stir for 12−16 h at room temperature. Following completion, the reaction mixture was flushed through a plug of Celite and concentrated. The product was purified by column chromatography.
(3,5-Dimethylphenyl)(1-methoxyisoquinolin-4-yl)methanone (2–49).
Aryl aldehyde: 1-methoxyisoquinoline-4-carbaldehyde. Grignard reagent: (3,5-dimethylphenyl)magnesium bromide. Column: 5−10% ethyl acetate in hexanes; yield = 35% over two steps. 1H NMR (500MHz, chloroform-d) δ 8.38 (d, J = 8.5 Hz, 1H), 8.34 (d, J = 7.9 Hz, 1H), 8.24 (s, 1H), 7.74 (t, J = 8.4 Hz, 1H), 7.60 (t, J = 8.1 Hz, 1H), 7.48 (s, 2H), 7.24 (s, 1H), 4.20 (s, 3H), 2.37 (s, 6H). 13C NMR (126MHz, CDCl3) δ 196.45, 162.93, 145.15, 139.01, 138.09, 136.02, 134.59, 131.81, 128.05, 127.28, 125.09, 124.36, 124.02, 119.51, 54.26, 21.24. HRMS calcd for C19H17NO2 [M + H]+, 292.13728; found, 292.1099.
(4-Methoxy-3,5-dimethylphenyl)(1-methoxyisoquinolin-4-yl)-methanone (2–63).
Aryl aldehyde: 1-methoxyisoquinoline-4-carbaldehyde. Grignard reagent: (4-methoxy-3,5-dimethylphenyl)magnesium bromide. Column: 10−20% ethyl acetate in hexanes; yield = 88%. 1H NMR (500 MHz, chloroform-d) δ 8.31 (d, J = 9.4 Hz, 2H), 8.22 (s, 1H), 7.72 (t, J = 8.4 Hz, 1H), 7.58 (d, J = 15.1 Hz, 3H), 4.19 (s, 3H), 3.77 (s, 3H), 2.31 (s, 6H). 13C NMR (126 MHz, CDCl3) δ 195.43, 162.80, 161.26, 144.53, 136.00, 134.39, 131.72, 131.34, 131.14, 127.26, 125.02, 124.35, 124.11, 119.50, 59.72, 54.22, 16.25. HRMS calcd for C20H19NO3 [M + H]+, 322.14728; found, 322.1367.
4-(3,5-Dimethylbenzoyl)-1-methylquinolin-2(1H)-one (2–70).
Aryl aldehyde: 1-methyl-2-oxo-1,2-dihydroquinoline-4-carbaldehyde. Grignard reagent: (3,5-dimethylphenyl)magnesium bromide. Column: 20−60% ethyl acetate in hexanes; yield = 42% over two steps. 1H NMR (500 MHz, chloroform-d) δ 7.62−7.56 (m, 1H), 7.52 (s, 3H), 7.44 (d, J = 8.5 Hz, 1H), 7.26 (s, 1H), 7.17 (t, J = 8.1 Hz, 1H), 6.68 (s, 1H), 3.77 (s, 3H), 2.32 (s, 7H), 1.21 (s, 14H). 13C NMR (126 MHz, CDCl3) δ 195.11, 161.39, 147.73, 140.30, 138.69, 136.39, 135.86, 131.41, 127.96, 127.06, 122.67, 120.12, 118.25, 114.75, 77.37, 77.11, 76.86, 75.03, 29.77, 24.82, 21.16. HRMS calcd for C19H17NO2 [M + H]+, 292.13728; found, 292.115.
4-(4-Methoxy-3,5-dimethylbenzoyl)-1-methylquinolin-2(1H)-one (2–71).
Aryl aldehyde: 1-methyl-2-oxo-1,2-dihydroquinoline-4-carbaldehyde. Grignard reagent: (4-methoxy-3,5-dimethylphenyl)magnesium bromide. Column: 10−30% ethyl acetate in hexanes; yield = 55% over two steps. 1H NMR (500 MHz, chloroform-d) δ 7.69 (d, J = 8.1 Hz, 1H), 7.47 (t, J = 7.8 Hz, 1H), 7.23 (d, J = 8.5 Hz, 1H), 7.13 (t, J = 7.5 Hz, 1H), 7.02 (d, J = 2.9 Hz, 3H), 6.96 (s, 1H), 6.02 (s, 1H), 3.69 (s, 2H), 3.66 (s, 3H), 3.51 (s, 3H), 2.24 (s, 3H), 2.20 (s, 6H). 13C NMR (126 MHz, CDCl3) δ 162.55, 156.81, 156.11, 151.08, 140.05, 139.86, 136.26, 131.29, 130.71, 130.26, 127.70, 126.23, 125.85, 122.08, 119.01, 114.61, 74.08, 72.31, 62.85, 59.67, 59.62, 36.25, 29.38, 29.33, 29.26, 16.16. HRMS calcd for C20H19NO3 [M + H]+, 322.14728; found, 322.1212.
Synthesis of BI-FAMa and BI-FAMb. 4-Iodo-2-methyl-2,7-naphthyridin-1(2H)-one (3).
A 0.2 M solution of 4-iodo-2,7-naphthyridin-1(2H)-one (1 equiv) in DMF was cooled down to 0 °C and mixed with sodium hydride (2 equiv) for 30 min. Iodomethane (1.6 equiv) was added, and the mixture was stirred at 0 °C for 5 h. Water was then added to precipitate the product, which was filtered and dried to obtain a pale-yellow solid. Yield = 94%.19
tert-Butyl 2-((2,6-Dimethoxy-4-(2-methyl-1-oxo-1,2-dihydro-2,7-naphthyridin-4-yl)benzyl)(methyl)amino)acetate (4).
Sarcosyl tert-butyl ester hydrochloride (1.5 equiv) was dissolved in DCM (8 mL) with sodium acetate (1.5 equiv). Acetic acid (1 equiv) was added along with 4-bromo-2,6-dimethoxybenzaldehyde, and the mixture was stirred for 10 min. Sodium triacetoxyborohydride (2 equiv) was then added, and the reaction was stirred for 18 h. Once the stirring was completed, a 1 M potassium carbonate solution was added dropwise until achieving pH = 11. The mixture was extracted with DCM (4 × 10 mL), where the organic fractions were collected, washed with water (1 × 10 mL) and brine (1 × 10 mL), and dried with anhydrous sodium sulfate. The crude product was then concentrated and purified by column chromatography. Column: 0−10% ethyl acetate in hexanes; yield = 57%.25
2-((2,6-Dimethoxy-4-(2-methyl-1-oxo-1,2-dihydro-2,7-naphthyridin-4yl)benzyl)(methyl)amino)acetic Acid (5).
Compound 4 (1 equiv) and bis(pinacolato)diboron were dissolved in DMF (5 mL). Potassium acetate (5 equiv) and PdCl2(dppf)CH2Cl2 were then added to the mixture. The reaction was stirred for 16 h under reflux (90 °C), under nitrogen. Next, 3 (1 equiv) and 1 M potassium carbonate (2 equiv) were added and the reaction was stirred under reflux (80 °C) for 16 h. The crude product was flushed through a plug of Celite and washed with DCM (3 × 50 mL). The filtrates were then washed with water (2 × 20 mL) and brine (2 × 20 mL) and dried with anhydrous magnesium sulfate. The organic fraction was concentrated and column-purified to obtain tert-butyl 2-((2,6-dimethoxy-4-(2-methyl-1-oxo-1,2-dihydro-2,7-naphthyridin-4yl)-benzyl)(methyl)amino)acetate. Column: 0−20% methanol in DCM. Yield = 20%. The product was then stirred in 80% TFA in DCM at room temperature for 2 h to obtain 5. Yield = quantitative yield.25
N-(4-Aminobutyl)-2-((3,5-dimethoxy-4-(2-methyl-1-oxo-1,2-di-hydro-2,7-naphthyridin-4-yl)benzyl)(methyl)amino)acetamide (6) and N-(6-Aminohexyl)-2-((3,5-dimethoxy-4-(2-methyl-1-oxo-1,2-dihydro-2,7-naphthyridin-4-yl)benzyl)(methyl)amino)acetamide (7).
Compound 5 (1 equiv) was dissolved in 100 μL of DMF and activated with acetic acid/DIC. Boc-1,4-diaminebutane (3 equiv) or tert-butyl-1,6-diaminehexane (5 equiv) were dissolved in 100 μL of DMF and added to the mixture. The reaction was stirred for 12−16 h at room temperature. The crude products were purified by HPLC and then dissolved in 1 mL of 75% TFA in DCM for 16 h at room temperature. TFA was removed, and the crude product was purified by HPLC to obtain 6 or 7, respectively.
4-((4-(2-((3,5-Dimethoxy-4-(2-methyl-1-oxo-1,2-dihydro-2,7-naphthyridin-4-yl)benzyl)(methyl)amino)acetamido)butyl)-carbamoyl)-2-(6-hydroxy-3-oxo-3H-xanthen-9-yl)benzoic Acid (BIFAMa) and 4-((6-(2-((3,5-Dimethoxy-4-(2-methyl-1-oxo-1,2-dihydro-2,7-naphthyridin-4-yl)benzyl)(methyl)amino)acetamido)-hexyl)carbamoyl)-2-(6-hydroxy-3-oxo-3H-xanthen-9-yl)benzoic Acid (BI-FAMb).
Compounds 6 or 7 (1 equiv) and NHS-Fluorescein (5 equiv) were dissolved in 500 μL of a mixture of DMSO and phosphate-buffered saline (pH = 8.2) at 1:1 ratio. The reaction was incubated without light exposure at room temperature for 4 h. The crude product was then purified by HPLC to give BI-FAMa or BIFAMb, respectively, which was validated by LCMS (see Figures S15 and S16 for the spectra).
Supplementary Material
ACKNOWLEDGMENTS
This research was supported by grants from the NIH (U01CA207532) for ECD and NIH (R35GM128840) to B.C.S. S.C.O. was supported by the the SIRG Graduate Research Assistantships Award, and S.S. was supported by the Yeshwant A. Gore Graduate Grant from the Purdue University Institute for Cancer Research, P30CA023168. B.P.S. was supported by the NIH training grant 5T32GM125620. L.F.B L. was supported by the Undergraduate Research Experience at Purdue-Colombia (UREP-C) program. The authors acknowledge the use of the Chemical Genomics Facility, a core facility of the Purdue Institute for Drug Discovery and the NIH-funded Indiana Clinical and Translational Sciences Institute, and the support of Purdue University’s Metabolite Profiling Facility in the acquisition and analysis of mass spectrometry data. This work was supported in part by the Research Instrumentation Center in the Department of Chemistry at Purdue University.
ABBREVIATIONS USED
- AR
androgen receptor
- Ala
alanine
- Asn
asparagine
- BAF
BRG1-associated factors
- BD
bromodomain
- BRD7
bromo-domain-containing protein 7
- BRD9
bromodomain-containing protein 9
- BRG1
brahma-related gene 1
- BRM
human brahma protein
- BRPF1B
bromodomain and PHD finger-containing protein 1B
- cBAF
canonical BAF
- ERG
ETS Transcription Factor ERG
- ENZA
enzalutamide
- FAM
fluorescein
- FOXA1
Forkhead Box A1
- FP
fluorescence polarization
- GBAF
GLTSCR1/like-containing BAF
- Glu
glutamic acid
- GSEA
gene set enrichment analysis
- Ile
isoleucine
- Lys
lysine
- mBu
milliBRET
- mP
millipolarization
- MST
microscale thermophoresis
- MYC
MYC Proto-Oncogene
- PBAF
polybromo-associated BAF
- PBRM1
polybromo-1
- PCa
prostate cancer
- Phe
phenylalanine
- PROTAC
proteolysis targeting chimera
- shRNA
short hairpin RNA
- TSA
thermal shift assay
- Tyr
tyrosine
- T m
melting temperature
- Val
valine
Footnotes
Complete contact information is available at: https://pubs.acs.org/10.1021/acs.jmedchem.3c00671
The authors declare no competing financial interest.
Contributor Information
Sandra C. Ordonez-Rubiano, Department of Medicinal Chemistry and Molecular Pharmacology, College of Pharmacy, Purdue University, West Lafayette, Indiana 47907, United States;
Chad A. Maschinot, Department of Medicinal Chemistry and Molecular Pharmacology, College of Pharmacy, Purdue University, West Lafayette, Indiana 47907, United States
Sijie Wang, Department of Medicinal Chemistry and Molecular Pharmacology, College of Pharmacy, Purdue University, West Lafayette, Indiana 47907, United States.
Surbhi Sood, Department of Medicinal Chemistry and Molecular Pharmacology, College of Pharmacy, Purdue University, West Lafayette, Indiana 47907, United States.
Luisa F. Baracaldo-Lancheros, Department of Medicinal Chemistry and Molecular Pharmacology, College of Pharmacy, Purdue University, West Lafayette, Indiana 47907, United States
Brayden P. Strohmier, Department of Medicinal Chemistry and Molecular Pharmacology, College of Pharmacy, Purdue University, West Lafayette, Indiana 47907, United States
Alexander J. McQuade, Department of Medicinal Chemistry and Molecular Pharmacology, College of Pharmacy, Purdue University, West Lafayette, Indiana 47907, United States
Brian C. Smith, Department of Biochemistry, Program in Chemical Biology, Medical College of Wisconsin, Milwaukee, Wisconsin 53226, United States;
Emily C. Dykhuizen, Department of Medicinal Chemistry and Molecular Pharmacology, College of Pharmacy, Purdue University, West Lafayette, Indiana 47907, United States; Purdue Center for Cancer Research, College of Pharmacy, Purdue University, West Lafayette, Indiana 47907, United States;
REFERENCES
- (1).Clapier CR; Iwasa J; Cairns BR; Peterson CL Mechanisms of Action and Regulation of ATP-Dependent Chromatin-Remodelling Complexes. Nat. Rev. Mol. Cell Biol 2017, 18, 407–422. [DOI] [PMC free article] [PubMed] [Google Scholar]
- (2).Mashtalir N; D’Avino AR; Michel BC; Luo J; Pan J; Otto JE; Zullow HJ; McKenzie ZM; Kubiak RL; St Pierre R; Valencia AM; Poynter SJ; Cassel SH; Ranish JA; Kadoch C Modular Organization and Assembly of SWI/SNF Family Chromatin Remodeling Complexes. Cell 2018, 175, 1272–1288.e20. [DOI] [PMC free article] [PubMed] [Google Scholar]
- (3).Alpsoy A; Dykhuizen EC Glioma Tumor Suppressor Candidate Region Gene 1 (GLTSCR1) and Its Paralog GLTSCR1-like Form SWI/SNF Chromatin Remodeling Subcomplexes. J. Biol. Chem 2018, 293, 3892–3903. [DOI] [PMC free article] [PubMed] [Google Scholar]
- (4).Gatchalian J; Malik S; Ho J; Lee D-S; Kelso TWR; Shokhirev MN; Dixon JR; Hargreaves DC A Non-Canonical BRD9-Containing BAF Chromatin Remodeling Complex Regulates Naive Pluripotency in Mouse Embryonic Stem Cells. Nat. Commun 2018, 9, 5139. [DOI] [PMC free article] [PubMed] [Google Scholar]
- (5).Wang X; Wang S; Troisi EC; Howard TP; Haswell JR; Wolf BK; Hawk WH; Ramos P; Oberlick EM; Tzvetkov EP; Ross A; Vazquez F; Hahn WC; Park PJ; Roberts CWM BRD9 Defines a SWI/SNF Sub-Complex and Constitutes a Specific Vulnerability in Malignant Rhabdoid Tumors. Nat. Commun 2019, 10, 1881. [DOI] [PMC free article] [PubMed] [Google Scholar]
- (6).Kadoch C; Hargreaves DC; Hodges C; Elias L; Ho L; Ranish J; Crabtree GR Proteomic and Bioinformatic Analysis of MSWI/SNF (BAF) Complexes Reveals Extensive Roles in Human Malignancy. Nat. Genet 2013, 45, 592–601. [DOI] [PMC free article] [PubMed] [Google Scholar]
- (7).Schick S; Rendeiro AF; Runggatscher K; Ringler A; Boidol B; Hinkel M; Májek P; Vulliard L; Penz T; Parapatics K; Schmidl C; Menche J; Boehmelt G; Petronczki M; Müller AC; Bock C; Kubicek S Systematic Characterization of BAF Mutations Provides Insights into Intracomplex Synthetic Lethalities in Human Cancers. Nat. Genet 2019, 51, 1399–1410. [DOI] [PMC free article] [PubMed] [Google Scholar]
- (8).Schick S; Grosche S; Kohl KE; Drpic D; Jaeger MG; Marella NC; Imrichova H; Lin J-MG; Hofstätter G; Schuster M; Rendeiro AF; Koren A; Petronczki M; Bock C; Müller AC; Winter GE; Kubicek S Acute BAF Perturbation Causes Immediate Changes in Chromatin Accessibility. Nat. Genet 2021, 53, 269–278. [DOI] [PMC free article] [PubMed] [Google Scholar]
- (9).Iurlaro M; Stadler MB; Masoni F; Jagani Z; Galli GG; Schübeler D Mammalian SWI/SNF Continuously Restores Local Accessibility to Chromatin. Nat. Genet 2021, 53, 279–287. [DOI] [PubMed] [Google Scholar]
- (10).Farnaby W; Koegl M; Roy MJ; Whitworth C; Diers E; Trainor N; Zollman D; Steurer S; Karolyi-Oezguer J; Riedmueller C; Gmaschitz T; Wachter J; Dank C; Galant M; Sharps B; Rumpel K; Traxler E; Gerstberger T; Schnitzer R; Petermann O; Greb P; Weinstabl H; Bader G; Zoephel A; Weiss-Puxbaum A; Ehrenhöfer-Wölfer K; Wöhrle S; Boehmelt G; Rinnenthal J; Arnhof H; Wiechens N; Wu M-Y; Owen-Hughes T; Ettmayer P; Pearson M; McConnell DB; Ciulli A BAF Complex Vulnerabilities in Cancer Demonstrated via Structure-Based PROTAC Design. Nat. Chem. Biol 2019, 15, 672–680. [DOI] [PMC free article] [PubMed] [Google Scholar]
- (11).Chory EJ; Kirkland JG; Chang C-Y; D’Andrea VD; Gourisankar S; Dykhuizen EC; Crabtree GR Chemical Inhibitors of a Selective SWI/SNF Function Synergize with ATR Inhibition in Cancer Cell Killing. ACS Chem. Biol 2020, 15, 1685–1696. [DOI] [PMC free article] [PubMed] [Google Scholar]
- (12).Papillon JPN; Nakajima K; Adair CD; Hempel J; Jouk AO; Karki RG; Mathieu S; Möbitz H; Ntaganda R; Smith T; Visser M; Hill SE; Hurtado FK; Chenail G; Bhang H-EC; Bric A; Xiang K; Bushold G; Gilbert T; Vattay A; Dooley J; Costa EA; Park I; Li A; Farley D; Lounkine E; Yue QK; Xie X; Zhu X; Kulathila R; King D; Hu T; Vulic K; Cantwell J; Luu C; Jagani Z Discovery of Orally Active Inhibitors of Brahma Homolog (BRM)/SMARCA2 ATPase Activity for the Treatment of Brahma Related Gene 1 (BRG1)/SMARCA4-Mutant Cancers. J. Med. Chem 2018, 61, 10155–10172. [DOI] [PubMed] [Google Scholar]
- (13).Martin LJ; Koegl M; Bader G; Cockcroft X-L; Fedorov O; Fiegen D; Gerstberger T; Hofmann MH; Hohmann AF; Kessler D; Knapp S; Knesl P; Kornigg S; Müller S; Nar H; Rogers C; Rumpel K; Schaaf O; Steurer S; Tallant C; Vakoc CR; Zeeb M; Zoephel A; Pearson M; Boehmelt G; McConnell D Structure-Based Design of an in Vivo Active Selective BRD9 Inhibitor. J. Med. Chem 2016, 59, 4462–4475. [DOI] [PMC free article] [PubMed] [Google Scholar]
- (14).Karim RM; Chan A; Zhu J-Y; Schönbrunn E Structural Basis of Inhibitor Selectivity in the BRD7/9 Subfamily of Bromodomains. J. Med. Chem 2020, 63, 3227–3237. [DOI] [PMC free article] [PubMed] [Google Scholar]
- (15).Clark PGK; Vieira LCC; Tallant C; Fedorov O; Singleton DC; Rogers CM; Monteiro OP; Bennett JM; Baronio R; Müller S; Daniels DL; Méndez J; Knapp S; Brennan PE; Dixon DJ LP99: Discovery and Synthesis of the First Selective BRD7/9 Bromodomain Inhibitor. Am. Ethnol 2015, 54, 6217–6221. [DOI] [PMC free article] [PubMed] [Google Scholar]
- (16).Clegg MA; Bamborough P; Chung C; Craggs PD; Gordon L; Grandi P; Leveridge M; Lindon M; Liwicki GM; Michon A-M; Molnar J; Rioja I; Soden PE; Theodoulou NH; Werner T; Tomkinson NCO; Prinjha RK; Humphreys PG Application of Atypical Acetyl-Lysine Methyl Mimetics in the Development of Selective Inhibitors of the Bromodomain-Containing Protein 7 (BRD7)/Bromodomain-Containing Protein 9 (BRD9) Bromodomains. J. Med. Chem 2020, 63, 5816–5840. [DOI] [PubMed] [Google Scholar]
- (17).Mason LD; Chava S; Reddi KK; Gupta R The BRD9/7 Inhibitor TP-472 Blocks Melanoma Tumor Growth by Suppressing ECM-Mediated Oncogenic Signaling and Inducing Apoptosis. Cancers 2021, 13, 5516. [DOI] [PMC free article] [PubMed] [Google Scholar]
- (18).Shishodia S; Nuñez R; Strohmier BP; Bursch KL; Goetz CJ; Olp MD; Jensen DR; Fenske TG; Ordonez-Rubiano SC; Blau ME; Roach MK; Peterson FC; Volkman BF; Dykhuizen EC; Smith BC Selective and Cell-Active PBRM1 Bromodomain Inhibitors Discovered through NMR Fragment Screening. J. Med. Chem 2022, 65, 13714–13735. [DOI] [PMC free article] [PubMed] [Google Scholar]
- (19).Zoppi V; Hughes SJ; Maniaci C; Testa A; Gmaschitz T; Wieshofer C; Koegl M; Riching KM; Daniels DL; Spallarossa A; Ciulli A Iterative Design and Optimization of Initially Inactive Proteolysis Targeting Chimeras (PROTACs) Identify VZ185 as a Potent, Fast, and Selective von Hippel−Lindau (VHL) Based Dual Degrader Probe of BRD9 and BRD7. J. Med. Chem 2019, 62, 699–726. [DOI] [PMC free article] [PubMed] [Google Scholar]
- (20).Wanior M; Preuss F; Ni X; Krämer A; Mathea S; Göbel T; Heidenreich D; Simonyi S; Kahnt AS; Joerger AC; Knapp S Pan-SMARCA/PB1 Bromodomain Inhibitors and Their Role in Regulating Adipogenesis. J. Med. Chem 2020, 63, 14680–14699. [DOI] [PubMed] [Google Scholar]
- (21).Taylor AM; Bailey C; Belmont LD; Campbell R; Cantone N; Côté A; Crawford TD; Cummings R; DeMent K; Duplessis M; Flynn M; Good AC; Huang H-R; Joshi S; Leblanc Y; Murray J; Nasveschuk CG; Neiss A; Poy F; Romero FA; Sandy P; Tang Y; Tsui V; Zawadzke L; Sims RJ III; Audia JE; Bellon SF; Magnuson SR; Albrecht BK; Cochran AG GNE-064: A Potent, Selective, and Orally Bioavailable Chemical Probe for the Bromodomains of SMARCA2 and SMARCA4 and the Fifth Bromodomain of PBRM1. J. Med. Chem 2022, 65, 11177–11186. [DOI] [PubMed] [Google Scholar]
- (22).Gerstenberger BS; Trzupek JD; Tallant C; Fedorov O; Filippakopoulos P; Brennan PE; Fedele V; Martin S; Picaud S; Rogers C; Parikh M; Taylor A; Samas B; O’Mahony A; Berg E; Pallares G; Torrey AD; Treiber DK; Samardjiev IJ; Nasipak BT; Padilla-Benavides T; Wu Q; Imbalzano AN; Nickerson JA; Bunnage ME; Müller S; Knapp S; Owen DR Identification of a Chemical Probe for Family VIII Bromodomains through Optimization of a Fragment Hit. J. Med. Chem 2016, 59, 4800–4811. [DOI] [PMC free article] [PubMed] [Google Scholar]
- (23).Myrianthopoulos V; Gaboriaud-Kolar N; Tallant C; Hall M-L; Grigoriou S; Brownlee PM; Fedorov O; Rogers C; Heidenreich D; Wanior M; Drosos N; Mexia N; Savitsky P; Bagratuni T; Kastritis E; Terpos E; Filippakopoulos P; Müller S; Skaltsounis A-L; Downs JA; Knapp S; Mikros E Discovery and Optimization of a Selective Ligand for the Switch/Sucrose Non-fermenting-Related Bromodomains of Polybromo Protein-1 by the Use of Virtual Screening and Hydration Analysis. J. Med. Chem 2016, 59, 8787–8803. [DOI] [PMC free article] [PubMed] [Google Scholar]
- (24).Mélin L; Gesner E; Attwell S; Kharenko OA; van der Horst EH; Hansen HC; Gagnon A Design and Synthesis of LM146, a Potent Inhibitor of PB1 with an Improved Selectivity Profile over SMARCA2. ACS Omega 2021, 6, 21327–21338. [DOI] [PMC free article] [PubMed] [Google Scholar]
- (25).Remillard D; Buckley DL; Paulk J; Brien GL; Sonnett M; Seo H-S; Dastjerdi S; Wühr M; Dhe-Paganon S; Armstrong SA; Bradner JE Degradation of the BAF Complex Factor BRD9 by Heterobifunctional Ligands. Angew. Chem., Int. Ed 2017, 56, 5738–5743. [DOI] [PMC free article] [PubMed] [Google Scholar]
- (26).Brien GL; Remillard D; Shi J; Hemming ML; Chabon J; Wynne K; Dillon ET; Cagney G; Van Mierlo G; Baltissen MP; Vermeulen M; Qi J; Fröhling S; Gray NS; Bradner JE; Vakoc CR; Armstrong SA Targeted Degradation of BRD9 Reverses Oncogenic Gene Expression in Synovial Sarcoma. eLife 2018, 7, No. e41305. [DOI] [PMC free article] [PubMed] [Google Scholar]
- (27).Hay DA; Rogers CM; Fedorov O; Tallant C; Martin S; Monteiro OP; Müller S; Knapp S; Schofield CJ; Brennan PE Design and Synthesis of Potent and Selective Inhibitors of BRD7 and BRD9 Bromodomains. MedChemComm 2015, 6, 1381–1386. [Google Scholar]
- (28).Filippakopoulos P; Picaud S; Mangos M; Keates T; Lambert J-P; Barsyte-Lovejoy D; Felletar I; Volkmer R; Müller S; Pawson T; Gingras A-C; Arrowsmith CH; Knapp S Histone Recognition and Large-Scale Structural Analysis of the Human Bromodomain Family. Cell 2012, 149, 214–231. [DOI] [PMC free article] [PubMed] [Google Scholar]
- (29).Cochran AG; Conery AR; Sims RJ III Bromodomains: A New Target Class for Drug Development. Nat. Rev. Drug Discovery 2019, 18, 609–628. [DOI] [PubMed] [Google Scholar]
- (30).Peng C; Liu HY; Zhou M; Zhang LM; Li XL; Shen SR; Li GY BRD7 Suppresses the Growth of Nasopharyngeal Carcinoma Cells (HNE1) through Negatively Regulating β-Catenin and ERK Pathways. Mol. Cell. Biochem 2007, 303, 141–149. [DOI] [PubMed] [Google Scholar]
- (31).Liu Y; Zhao R; Wei Y; Li M; Wang H; Niu W; Zhou Y; Qiu Y; Fan S; Zhan Y; Xiong W; Zhou Y; Li X; Li Z; Li G; Zhou M BRD7 Expression and C-Myc Activation Forms a Double-Negative Feedback Loop That Controls the Cell Proliferation and Tumor Growth of Nasopharyngeal Carcinoma by Targeting Oncogenic MiR-141. J. Exp. Clin. Cancer Res 2018, 37, 64. [DOI] [PMC free article] [PubMed] [Google Scholar]
- (32).Hu K; Liao D; Wu W; Han A-J; Shi H-J; Wang F; Wang X; Zhong L; Duan T; Wu Y; Cao J; Tang J; Sang Y; Wang L; Lv X; Xu S; Zhang R-H; Deng W-G; Li S-P; Zeng Y-X; Kang T Targeting the Anaphase-Promoting Complex/Cyclosome (APC/C)- Bromodomain Containing 7 (BRD7) Pathway for Human Osteosarcoma. Oncotarget 2014, 5, 3088–3100. [DOI] [PMC free article] [PubMed] [Google Scholar]
- (33).Niu W; Luo Y; Zhou Y; Li M; Wu C; Duan Y; Wang H; Fan S; Li Z; Xiong W; Li X; Li G; Ren C; Li H; Zhou M BRD7 Suppresses Invasion and Metastasis in Breast Cancer by Negatively Regulating YB1-Induced Epithelial-Mesenchymal Transition. J. Exp. Clin. Cancer Res 2020, 39, 30. [DOI] [PMC free article] [PubMed] [Google Scholar]
- (34).Park Y-A; Lee J-W; Kim H-S; Lee Y-Y; Kim T-J; Choi CH; Choi J-J; Jeon H-K; Cho YJ; Ryu JY; Kim B-G; Bae D-S Tumor Suppressive Effects of Bromodomain-Containing Protein 7 (BRD7) in Epithelial Ovarian Carcinoma. Clin. Cancer Res 2014, 20, 565–575. [DOI] [PubMed] [Google Scholar]
- (35).Liang Y; Dong B; Shen J; Ma C; Ma Z Clinical Significance of Bromodomain-containing Protein 7 and Its Association with Tumor Progression in Prostate Cancer. Oncol. Lett 2019, 17, 849–856. [DOI] [PMC free article] [PubMed] [Google Scholar]
- (36).Hagiwara M; Fushimi A; Yamashita N; Bhattacharya A; Rajabi H; Long MD; Yasumizu Y; Oya M; Liu S; Kufe D MUC1-C Activates the PBAF Chromatin Remodeling Complex in Integrating Redox Balance with Progression of Human Prostate Cancer Stem Cells. Oncogene 2021, 40, 4930–4940. [DOI] [PMC free article] [PubMed] [Google Scholar]
- (37).Kikuchi M; Okumura F; Tsukiyama T; Watanabe M; Miyajima N; Tanaka J; Imamura M; Hatakeyama S TRIM24 Mediates Ligand-Dependent Activation of Androgen Receptor and Is Repressed by a Bromodomain-Containing Protein, BRD7, in Prostate Cancer Cells. Biochim. Biophys. Acta, Mol. Cell Res 2009, 1793, 1828–1836. [DOI] [PubMed] [Google Scholar]
- (38).Zhao R; Liu Y; Wu C; Li M; Wei Y; Niu W; Yang J; Fan S; Xie Y; Li H; Wang W; Zeng Z; Xiong W; Li X; Li G; Zhou M BRD7 Promotes Cell Proliferation and Tumor Growth Through Stabilization of C-Myc in Colorectal Cancer. Front. Cell Dev. Biol 2021, 9, No. 659392. [DOI] [PMC free article] [PubMed] [Google Scholar]
- (39).Pan D; Kobayashi A; Jiang P; de Andrade LF; Tay RE; Luoma AM; Tsoucas D; Qiu X; Lim K; Rao P; Long HW; Yuan G-C; Doench J; Brown M; Liu XS; Wucherpfennig KW A Major Chromatin Regulator Determines Resistance of Tumor Cells to T Cell−Mediated Killing. Science 2018, 359, 770–775. [DOI] [PMC free article] [PubMed] [Google Scholar]
- (40).Loo C-S; Gatchalian J; Liang Y; Leblanc M; Xie M; Ho J; Venkatraghavan B; Hargreaves DC; Zheng Y A Genome-Wide CRISPR Screen Reveals a Role for the Non-Canonical Nucleosome-Remodeling BAF Complex in Foxp3 Expression and Regulatory T Cell Function. Immunity 2020, 53, 143–157. [DOI] [PMC free article] [PubMed] [Google Scholar]
- (41).Cer RZ; Mudunuri U; Stephens R; Lebeda FJ IC50-to-Ki: A Web-Based Tool for Converting IC50 to Ki Values for Inhibitors of Enzyme Activity and Ligand Binding. Nucleic Acids Res. 2009, 37, W441–W445. [DOI] [PMC free article] [PubMed] [Google Scholar]
- (42).Wang L; Wang Y; Zhao J; Yu Y; Kang N; Yang Z Theoretical Exploration of the Binding Selectivity of Inhibitors to BRD7 and BRD9 with Multiple Short Molecular Dynamics Simulations. RSC Adv. 2022, 12, 16663–16676. [DOI] [PMC free article] [PubMed] [Google Scholar]
- (43).Igoe N; Bayle ED; Fedorov O; Tallant C; Savitsky P; Rogers C; Owen DR; Deb G; Somervaille TCP; Andrews DM; Jones N; Cheasty A; Ryder H; Brennan PE; Müller S; Knapp S; Fish PV Design of a Biased Potent Small Molecule Inhibitor of the Bromodomain and PHD Finger-Containing (BRPF) Proteins Suitable for Cellular and in Vivo Studies. J. Med. Chem 2017, 60, 668–680. [DOI] [PubMed] [Google Scholar]
- (44).Demont EH; Bamborough P; Chung C; Craggs PD; Fallon D; Gordon LJ; Grandi P; Hobbs CI; Hussain J; Jones EJ; Le Gall A; Michon A-M; Mitchell DJ; Prinjha RK; Roberts AD; Sheppard RJ; Watson RJ 1,3-Dimethyl Benzimidazolones Are Potent, Selective Inhibitors of the BRPF1 Bromodomain. ACS Med. Chem. Lett 2014, 5, 1190–1195. [DOI] [PMC free article] [PubMed] [Google Scholar]
- (45).Porter EG; Dykhuizen EC Individual Bromodomains of Polybromo-1 Contribute to Chromatin Association and Tumor Suppression in Clear Cell Renal Carcinoma. J. Biol. Chem 2017, 292, 2601–2610. [DOI] [PMC free article] [PubMed] [Google Scholar]
- (46).De Silva SM; Dhiman A; Sood S; Mercedes KF; Simmons WJ; Henen MA; Vögeli B; Dykhuizen EC; Musselman CA PBRM1 Bromodomains Associate with RNA to Facilitate Chromatin Association. Nucleic Acids Res. 2023, 51, 3631–3649. [DOI] [PMC free article] [PubMed] [Google Scholar]
- (47).Alpsoy A; Utturkar SM; Carter BC; Dhiman A; Torregrosa-Allen SE; Currie MP; Elzey BD; Dykhuizen EC BRD9 Is a Critical Regulator of Androgen Receptor Signaling and Prostate Cancer Progression. Cancer Res. 2021, 81, 820–833. [DOI] [PMC free article] [PubMed] [Google Scholar]
- (48).Siegel RL; Miller KD; Wagle NS; Jemal A Cancer Statistics, 2023. CA- Cancer J. Clin 2023, 73, 17–48. [DOI] [PubMed] [Google Scholar]
- (49).Wang G; Zhao D; Spring DJ; DePinho RA Genetics and Biology of Prostate Cancer. Genes Dev. 2018, 32, 1105–1140. [DOI] [PMC free article] [PubMed] [Google Scholar]
- (50).Xiao L; Parolia A; Qiao Y; Bawa P; Eyunni S; Mannan R; Carson SE; Chang Y; Wang X; Zhang Y; Vo JN; Kregel S; Simko SA; Delekta AD; Jaber M; Zheng H; Apel IJ; McMurry L; Su F; Wang R; Zelenka-Wang S; Sasmal S; Khare L; Mukherjee S; Abbineni C; Aithal K; Bhakta MS; Ghurye J; Cao X; Navone NM; Nesvizhskii AI; Mehra R; Vaishampayan U; Blanchette M; Wang Y; Samajdar S; Ramachandra M; Chinnaiyan AM Targeting SWI/SNF ATPases in Enhancer-Addicted Prostate Cancer. Nature 2022, 601, 434–439. [DOI] [PMC free article] [PubMed] [Google Scholar]
- (51).Sandoval GJ; Pulice JL; Pakula H; Schenone M; Takeda DY; Pop M; Boulay G; Williamson KE; McBride MJ; Pan J; St Pierre R; Hartman E; Garraway LA; Carr SA; Rivera MN; Li Z; Ronco L; Hahn WC; Kadoch C Binding of TMPRSS2-ERG to BAF Chromatin Remodeling Complexes Mediates Prostate Oncogenesis. Mol. Cell 2018, 71, 554–566. [DOI] [PMC free article] [PubMed] [Google Scholar]
- (52).Marshall TW; Link KA; Petre-Draviam CE; Knudsen KE Differential Requirement of SWI/SNF for Androgen Receptor Activity. J. Biol. Chem 2003, 278, 30605–30613. [DOI] [PubMed] [Google Scholar]
- (53).van de Wijngaart DJ; Dubbink HJ; Molier M; de Vos C; Trapman J; Jenster G Functional Screening of FxxLF-Like Peptide Motifs Identifies SMARCD1/BAF60a as an Androgen Receptor Cofactor That Modulates TMPRSS2 Expression. Mol. Endocrinol 2009, 23, 1776–1786. [DOI] [PMC free article] [PubMed] [Google Scholar]
- (54).Dai Y; Ngo D; Jacob J; Forman LW; Faller DV Prohibitin and the SWI/SNF ATPase Subunit BRG1 Are Required for Effective Androgen Antagonist-Mediated Transcriptional Repression of Androgen Receptor-Regulated Genes. Carcinogenesis 2008, 29, 1725–1733. [DOI] [PMC free article] [PubMed] [Google Scholar]
- (55).Ertl IE; Brettner R; Kronabitter H; Mohr T; Derdak S; Jeitler M; Bilban M; Garstka N; Shariat SF The SMARCD Family of SWI/SNF Accessory Proteins Is Involved in the Transcriptional Regulation of Androgen Receptor-Driven Genes and Plays a Role in Various Essential Processes of Prostate Cancer. Cell 2023, 12, 124. [DOI] [PMC free article] [PubMed] [Google Scholar]
- (56).Yuan J; Chen K; Zhang W; Chen Z Structure of Human Chromatin-Remodelling PBAF Complex Bound to a Nucleosome. Nature 2022, 605, 166–171. [DOI] [PubMed] [Google Scholar]
- (57).Cai W; Su L; Liao L; Liu ZZ; Langbein L; Dulaimi E; Testa JR; Uzzo RG; Zhong Z; Jiang W; Yan Q; Zhang Q; Yang H PBRM1 Acts as a P53 Lysine-Acetylation Reader to Suppress Renal Tumor Growth. Nat. Commun 2019, 10, 5800. [DOI] [PMC free article] [PubMed] [Google Scholar]
- (58).Slaughter MJ; Shanle EK; McFadden AW; Hollis ES; Suttle LE; Strahl BD; Davis IJ PBRM1 Bromodomains Variably Influence Nucleosome Interactions and Cellular Function. J. Biol. Chem 2018, 293, 13592–13603. [DOI] [PMC free article] [PubMed] [Google Scholar]
- (59).Yamashita N; Morimoto Y; Fushimi A; Ahmad R; Bhattacharya A; Daimon T; Haratake N; Inoue Y; Ishikawa S; Yamamoto M; Hata T; Akiyoshi S; Hu Q; Liu T; Withers H; Liu S; Shapiro GI; Yoshizumi T; Long MD; Kufe D MUC1-C Dictates PBRM1-Mediated Chronic Induction of Interferon Signaling, DNA Damage Resistance, and Immunosuppression in Triple-Negative Breast Cancer. Mol. Cancer Res 2023, 21, 274–289. [DOI] [PMC free article] [PubMed] [Google Scholar]
- (60).Vivoli M; Novak HR; Littlechild JA; Harmer NJ Determination of Protein-Ligand Interactions Using Differential Scanning Fluorimetry. J. Visualized Exp 2014, 91, No. e51809. [DOI] [PMC free article] [PubMed] [Google Scholar]
- (61).Nikolovska-Coleska Z; Wang R; Fang X; Pan H; Tomita Y; Li P; Roller PP; Krajewski K; Saito NG; Stuckey JA; Wang S Development and Optimization of a Binding Assay for the XIAP BIR3 Domain Using Fluorescence Polarization. Anal. Biochem 2004, 332, 261–273. [DOI] [PubMed] [Google Scholar]
- (62).Méndez J; Stillman B Chromatin Association of Human Origin Recognition Complex, Cdc6, and Minichromosome Maintenance Proteins during the Cell Cycle: Assembly of Prereplication Complexes in Late Mitosis. Mol. Cell. Biol 2000, 20, 8602–8612. [DOI] [PMC free article] [PubMed] [Google Scholar]
- (63).Dobin A; Davis CA; Schlesinger F; Drenkow J; Zaleski C; Jha S; Batut P; Chaisson M; Gingeras TR STAR: Ultrafast Universal RNA-Seq Aligner. Bioinformatics 2013, 29, 15–21. [DOI] [PMC free article] [PubMed] [Google Scholar]
- (64).Love MI; Huber W; Anders S Moderated Estimation of Fold Change and Dispersion for RNA-Seq Data with DESeq2. Genome Biol. 2014, 15, 550. [DOI] [PMC free article] [PubMed] [Google Scholar]
- (65).Larsson J; Godfrey A; Jonathan R; Gustafsson Peter; Eberly David H.; Huber Emanuel; Privé Florian. Eulerr: Area-Proportional Euler and Venn Diagrams with Ellipses. R Package Version 7.0.0; 2022. https://cran.r-project.org/web/packages/eulerr/index.html.
Associated Data
This section collects any data citations, data availability statements, or supplementary materials included in this article.


