


Keywords: mitochondrial function, muscle atrophy, muscle contractility, protein turnover, skeletal muscle
Abstract
Cancer cachexia is clinically defined by involuntary weight loss >5% in <6 mo, primarily affecting skeletal muscle. Here, we aimed to identify sex differences in the onset of colorectal cancer cachexia with specific consideration to skeletal muscle contractile and metabolic functions. Eight-weeks old BALB/c mice (69 males, 59 females) received subcutaneous C26 allografts or PBS vehicle. Tumors were developed for 10-, 15-, 20-, or 25 days. Muscles and organs were collected, in vivo muscle contractility, protein synthesis rate, mitochondrial function, and protein turnover markers were assessed. One-way ANOVA within sex and trend analysis between sexes were performed, P < 0.05. Gastrocnemius and tibialis anterior (TA) muscles became atrophic in male mice at 25 days, whereas female mice exhibited no significant differences in muscle weights at endpoints despite presenting hallmarks of cancer cachexia (fat loss, hepatosplenomegaly). We observed lowered muscle contractility and protein synthesis concomitantly to muscle mass decay in males, with higher proteolytic markers in muscles of both sexes. mRNA of Opa1 was lower in TA, whereas Bnip3 was higher in gastrocnemius after 25 days in male mice, with no significant effect in female mice. Our data suggest relative protections to skeletal muscle in females compared with males despite other canonical signs of cancer cachexia and increased protein degradation markers; suggesting we should place onus upon nonmuscle tissues during early stages of cancer cachexia in females. We noted potential protective mechanisms relating to skeletal muscle contractile and mitochondrial functions. Our findings underline possible heterogeneity in onset of cancer cachexia between biological sexes, suggesting the need for sex-specific approaches to treat cancer cachexia.
NEW & NOTEWORTHY Our study demonstrates biological-sex differences in phenotypic characteristics of cancer cachexia between male and female mice, whereby females display many common characteristics of cachexia (gonadal fat loss and hepatosplenomegaly), protein synthesis markers alterations, and common catabolic markers in skeletal muscle despite relatively preserved muscle mass in early-stage cachexia compared with males. Mechanisms of cancer cachexia appear to differ between sexes. Data suggest need to place onus of early cancer cachexia detection and treatment on nonmuscle tissues in females.
BACKGROUND
Cachexia is a multifactorial wasting syndrome associated with chronic or end-stage diseases (1). Cachexia is typically characterized by systemic weight loss primarily as result of the wasting of muscle mass; additional hallmarks of cachexia include depletion of adipose tissue concurrent with hepatosplenomegaly (1–3). Cancer cachexia (CC) was defined by Fearon et al. (4) in 2011, proposing specific clinical diagnostic criteria for identifying cachexia based on body mass index and percent weight loss over a time period. Most publications before 2011 were made in male subjects only with limited exploration of cachexia in females, whereas many works including both sexes did not assess sex-specific differences (4). Therefore, the consensus cachexia definition does not directly account for biological sex considerations (4). Specifically, the current consensus definition of CC focuses on a loss of skeletal muscle, which may or may not occur with concomitant loss of fat mass (4). Conventional nutrition support alone is insufficient to prevent or reverse CC, and the loss of skeletal muscle functional capacity can result in a reduced quality of life, decreased ability to handle anticancer drugs, and reduced survival (4–6). However, the complexity of CC has generated substantial discussion as to the diagnostic framework to identify its onset. As a result, much of the research focus surrounding CC has revolved around early diagnostic criteria and interventional therapies (1, 4, 5, 7–13). Moreover, due to the multifactorial and multisystemic nature of the condition, identification of the pre-cachectic state is challenged by the wide variety of symptoms observed during the initial stages that can depend upon the type of cancer present in the body and particularly due to emerging insights into the role of biological sex differences (5, 14–19). Furthermore, CC leads to an energy crisis in skeletal muscle affecting protein balance and mitochondrial function, among others (14, 20–22). Muscle metabolic plasticity helps to compensate the energy expenditure through protein dysregulation, favoring protein breakdown and muscle wasting (20–22). In addition, our laboratory and others have recently observed detriments to skeletal muscle function and mitochondrial dysfunction before the onset of a cachectic phenotype in males that were largely absent in females, suggesting biological sex variations (15, 17, 18, 23, 24). Despite evidence indicating the influence of biological sex on the development and progression of a variety of diseases, the vast majority of preclinical investigations of cachexia focus primarily on males [as previously reviewed by us (19)]. There is a paucity of research into these topics including investigations of females, and even fewer making direct comparisons between sexes (25). Therefore, the specifics about differences related to metabolic and skeletal muscle functional data regulated by biological sex are underexplored, creating a gap in the literature with little prior examination to compare development of cachexia across biological sexes. This is true even when expanding the scope of the research to cachexia, irrespective of the instigating condition (23). Therefore, to better understand the onset of CC across biological sexes, it is necessary to gauge the negative protein balance and mitochondrial aberrations in skeletal muscle.
To address this gap in the literature, we have sought to characterize the sex differences at the onset of CC utilizing a C26 colorectal carcinoma model in a time course approach. The C26 carcinoma model is well established in male mice, which has not been as thoroughly investigated in females. Recent work in other CC animal models from our laboratory and others indicates female mice may exhibit protective mechanisms against CC. These mechanisms appear to differ from previous observations in male tumor-bearing mice, particularly during the initial stages of tumor development. Notably, female mice exhibit preserved mitochondrial function, reduced oxidative damage, IL-6-independent early-stage cachexia progression, and delayed muscle wasting with elevated levels of activin inhibitors (6, 15, 16, 18, 26, 27). While in the ApcMin/+ mouse, data suggest development of cachexia only in females who became acyclic indicating a potential significant role of hormones in this protection (28, 29). However, these conclusions are primarily based upon qualitative comparison mostly of separately conducted studies. Moreover, given the heterogeneity of the various CC models it is important to evaluate the development of the condition in different cancer types. Therefore, the purpose of this study was to identify sex differences at the onset and early progression of CC and characterize the extent of sex-dependent protective mechanisms relating to skeletal muscle contractile and metabolic functions. Based upon the data presented here, as well as prior works, we suggest females exhibit relative protections of skeletal muscle compared with males despite displaying other hallmarks of cachexia, and propose the onus of the early-stage cachectic phenotype should be placed on nonmuscle tissues in females moving forward.
METHODS
Animal Interventions
All animal methods were approved by the Institutional Animal Care and Use Committee of the University of Arkansas. One hundred twenty-eight BALB/c mice (69 males and 59 females) were purchased from Jackson Laboratory (Bar Harbor, ME; Stock No.: 001026), an a priori power analysis was performed to calculate the required sample size, and additional animals were used in some cases to account for potential attrition. Animals were housed in a temperature-controlled environment maintained on a 12:12-h light-dark cycle. The mice received ad libitum access to water and chow for the duration of the study. Eight-week-old mice were subcutaneously given bilateral injections of either Colon-26 Carcinoma [C26, National Cancer Institute, originally derived from a female BALB/c mouse (30)] cells (5 × 10⁵ to each side, for a total of 1 × 10⁶ cells) suspended in 100 μL of sterile phosphate-buffered saline (PBS) or equal volume of sterile PBS as a control per prior publications (2, 31–33). Tumors were allowed to develop for 10-, 15-, 20-, or 25 days (n = 11–20/condition/sex). Euthanasia and tissue collections were performed at the designated endpoints (10-, 15-, 20-, or 25 days), with tissue from the PBS control mice collected at 25 days after saline injection. This design created a total of five experimental groups per sex. Tissues were weighed, snap-frozen in liquid nitrogen, and stored at −80°C for further analysis. Data were calculated to include indices of body size (tumor-free weight and tibia length) to account for variations. Body size indices were not seen to contribute to statistical effects and thus were left out for final presentation as normalized ratios. Tibia length was measured as a surrogate of body size and accounts for variations due to animal growth and changes in body size during the time course. Body, muscle, and organ weights have been represented as means of raw weights and additionally as percent change relative to PBS control to visually compare changes across sexes despite inherent difference in size between sexes.
In Vivo Muscle Contractility
Approximately 48 h before tissue collection, measures of skeletal muscle electrophysiology of the anterior crural muscles were performed as described previously by our laboratory (15) and others (34–36). Torque-frequency curves were assessed using an Aurora Dual-Mode Lever System (Model 300B-LR, Aurora Scientific, ON, Canada). Mice were anesthetized using 3% isoflurane in O2 with an isoflurane vaporizer. The left hindlimb was shaved, and betadine and ethanol pads were utilized to clean the skin. The animals were placed in a supine position on a heating pad to maintain body temperature at 37°C. The left knee was positioned at a 90° angle to the foot, and the leg perpendicular to the force pedal. The animal’s foot was attached and secured to the footplate with the heel set in the groove and the toes firmly planted. Two electrode needles (Model E2-12, Grass Technologies, West Warwick, RI) were subcutaneously placed on the left common peroneal nerve within few millimeters apart. Twitch contractions were monitored in real-time using the Dynamic Muscle Control and Analysis (DMC) Software (615A, Aurora Scientific Inc., ON, Canada). An initial stimulus was measured at 150 Hz to ensure appropriate placement of the electrodes. After 1-min rest period, torque and M-wave as a function of stimulation frequency were measured during 12 isometric contractions with the duration of 150 ms at various stimulation frequencies (10, 20, 30, 40, 60, 80, 100, 125, 150, 200, 250, and 300 Hz) and 60 s of rest between contractions to determine hindlimb motor unit recruitment (35). After 4 min of resting, mice received one stimulus/second followed by 500 ms of rest, for up to 120 stimuli total at 40 Hz to measure fatigability. After 10 min of rest, a recovery stimulus was measured using the same parameter for the initial stimulus (35). After the fatigability test, animal’s behavior and ambulatory capacity were closely monitored to determine any injuries during the in vivo muscle contractility test. Half relaxation time (½ RT) and time to maximum contraction were assessed at 150 Hz torque stimulation. To determine if differences in torque were likely due to intrinsic alterations to the muscle or associated with changes in muscle size, data are presented as raw torque, and to account for differences in body size among experimental mice, torques (N·mm) were subsequently normalized by tumor-free body weight (TF-BW) as previously performed by others (36), as the functional assessment includes use of all anterior crural muscles and would not be appropriately reflected by muscle size of any one of these muscles. Muscle fatigability was determined as percentage from peak torque, where peak torque was 100%, and lowest torque contraction was calculated to be zero. Area under the curve (AUC) was then calculated from peak and normalized to number of contractions to account for variance in number of contractions completed after peak, as previously done (37). Data were measured in real-time using the Dynamic Muscle Control and Analysis Software (615A, Aurora Scientific Inc., ON, Canada) and analyzed using the Dynamic Muscle Data Acquisition and Analysis System (605A, Aurora Scientific Inc., ON, Canada). Electrophysiology measures were consistently performed by the same trained investigator.
Deuterium Administration and 24 h Fractional Protein Synthesis Rate
To determine fractional protein synthesis rate (FSR) and to attain ∼2% of body enrichment, mice were given an intraperitoneal injection of 99.9% deuterium oxide (D2O) (Cat. No. 151882-1L, Millipore Sigma) at 20 μL/g of body weight 24 h before tissue collection. Drinking water was then supplemented with 4% D2O to maintain plasma enrichment (38). FSR was assessed in soleus, mixed gastrocnemius, and tibialis anterior (TA) muscles using gas chromatography-mass spectrometry (GCMS; 7890A and 5977A, Agilent) and analyzed as described previously (15, 39). Briefly, ∼15 mg of muscle was powdered and homogenized in ice-cold 10% trichloroacetic acid (TCA). After 30 min, samples were centrifuged at 14,000 g for 30 min at 4°C. Sample pellets were resuspended and washed three times with 300 μL of ice-cold TCA for 15-min centrifugations to eliminate cytosolic amino acids. Finally, the sample pellet was resuspended with 300 μL of 6 N HCl and incubated overnight at 100°C to hydrolyze proteins. The hydrolysate was placed at the heating block at 100°C for 1 h to allow the HCl to evaporate. An equal amount of 3:2:1 solution (methyl-8, methanol, and acetonitrile) was added to determine 2H labeling of alanine. Samples were loaded onto the GCMS analyzer as previously described (15, 39). An aliquot of 1 μL was injected into an HP-5ms capillary column in the gas chromatography as a split injection at a ratio of 20:1. Temperature of the column was set at 240°C, with a constant helium flow of 1 mL/min. Peak abundances of ions 99 (alanine) and 100 (deuterated-alanine) were extracted from chromatograms. The ratio 100/99 was used to calculate percent enrichment of protein bound alanine using a regression formula generated by [2H] alanine standards (r2 = 0.999). Deuterium incorporation into protein synthesis is relative to deuterated plasma enrichment. Plasma samples were obtained from heparinized-cardiac-puncture-blood during tissue collection. To transfer deuterium from plasma water (2H2O) to acetone, 10 N NaOH and 5% acetone in acetonitrile was added. After overnight incubation at room temperature, n-hexane was added to extract acetone from the solution. Inorganic layer was loaded onto the GCMS, and acetone was analyzed at a 20:1 split as previously described (15). FSR of mixed proteins were calculated using the equation EA × [EBW × 3.7 × t (h)] − 1 × 100, where EA represents the amount of protein-bound [2H] alanine (mol% excess), EBW is the quantity of 2H2O in body water (mol% excess), 3.7 represents the exchange of 2H between body water and alanine (3.7 of 4 carbon-bound hydrogens of alanine exchange with water), and t (h) represents the time the label was present in hours (15, 39).
Real-Time PCR
To obtain data representing muscles of various fiber types and metabolic phenotypes, soleus, mixed gastrocnemius, and tibialis anterior (TA) samples were homogenized and mRNA isolated as previously described (15, 40) using a commercial kit (Thermo Fisher, PureLink RNA Mini Kit, Cat. No. 12183025). Tissues were powdered using a stainless-steel tissue cryopulverizer and ∼15–20 mg of frozen powdered tissue were suspended in 1 mL of cold TRIzol (10296-028, Invitrogen, Carlsbad, CA) and homogenized. Homogenized solution was transferred to a 1.5-mL Eppendorf tube and allowed to sit for 15 min at room temperature. Organic phase separation was induced by adding 200 μL of 100% chloroform and then shaken vigorously for 15 s. After 3 min at room temperature, tubes were centrifuged for 25 min at 15,000 rpm at 4°C to obtain total phase separation. Supernatant (∼400–700 μL) was transferred to a new sterile tube, and an equal amount of 70% diethyl pyrocarbonate (DEPC) ethanol was added to facilitate RNA precipitation. Solution was transferred to a RNeasy column and spun for 30 s at 8,070 rpm. The filtered flow-through was discarded, and 700 μL of Wash Buffer I was added into column. Tubes were spun for 15 s at 10,000 rpm. Column was transferred to a new collection tube, and 500 μL of Wash Buffer II was added. Samples were spun for 15 s at 10,000 rpm. After a 1-min incubation period at room temperature, they were dried by spinning once again for 1 min at 10,000 rpm. Twenty microliters of RNase free water was added into the column, and a new recovery tube was placed. After 1 min at room temperature, RNA samples were eluted after spinning for 1 min at 10,000 rpm. A 260/280 nm ratio > 1.8 was measured for RNA concentrations using Take3 micro-volume plate reader and gen5 software (BioTek Instruments, VT). RNA samples were stored at −80°C until further use.
cDNA was synthesized by reverse transcription using 4 μL of cDNA SuperScript VILO Master Mix (11755500, Thermo Fisher Scientific) and 1 μg/μL of RNA sample as described before (23, 40). The final solution was filled with sterile filtered deionized water (ddH2O) to a final volume of 20 μL per sample. Thermocycler was set at 25°C for 10 min, 42°C for 50 min, and 70°C for 15 min. Dilutions (1:100) with ddH2O were made and stored at −20°C until further use for RT-PCR.
cDNA quantification through cycle threshold (Ct) was measured using QuantStudio 3 Real-Time PCR system (Applied Biosystems, MA). PCR reaction mix for TaqMan probes was prepared with 10× TaqMan Fast Advanced Master Mix (Applied Biosystems, 4444558), 1× of TaqMan Gene Expression Assay (FAM) (Applied Biosystems, 4331182), 1× of ddH2O, and 8× of cDNA 1:100 dilution sample, to attain a 25 μL of final volume reaction, as previously described (40). The amplification protocol required an incubation time of 2 min at 50°C and 95°C for 10 min, followed by 45 cycles of denaturation at 95°C for 15 s, and annealing and extension at 60°C for 1 min. Following the previously described amplification protocol, 18S probe (Applied Biosystems, ID Mm03928990_g1) was used to measure each sample’s 18S RNA gene expression as a housekeeping gene reaction. The ΔCt values for each sample were calculated as the difference between the targeted gene Ct value and 18S RNA Ct value (target – 18S). Final quantification of gene expression was estimated using the ΔΔCt method. ΔΔCt values were calculated by the difference between the sample ΔCt and the average of group’s ΔCt (ΔCt – average of ΔCt). Relative quantification was calculated as 2−ΔΔCt, as previously described (5, 9). The fluoresce-labeled TaqMan probes used in this study were the following: Tnf-α (Mm00443258_m1), Il-6 (Mm00446190_m1), Ddit4 (Redd1; Mm00512504_g1), Deptor (Mm01195339_m1), Ubc (Mm02525934_g1), Gadd45a (Mm00432802_m1), Fbxo32 (Atrogin1; Mm00499523_m1), Trim63 (Murf1; Mm01185221_m1), Ldha (Mm01612132_g1), Ldhb (Mm01267402_m1), Ryr1 (Mm01175211_m1), Serca (Dm01820194_g1), Opa1 (Mm01349707_g1), Bnip3 (Mm01275600_g1), and Rn18s (18S; Mm03928990_g1). Fis1 Ct value was measured using a SYBR green PCR probe. Primers were designed as described before by Greene and collaborators (40). PCR reaction mix was prepared with 10× Power SYBR Green PCR Master Mix (Applied Biosystems, 4367659), 1× of reverse primmer 1:10 dilution (primer sequence AACCAGGCACCAGGCATATT), 1× of forward primmer 1:10 dilution (primer sequence ACGAAGCTGCAAGGAATTTTGA), and 8× of cDNA 1:100 dilution sample, to attain a 25 μL of final volume reaction; and then following the previously described amplification protocol. All targets were normalized to the 18S Ct value, which did not differ between groups. Corrected-final fold change for each group was reported as the relationship between each group’s fold change and the average fold change from PBS/control group.
Mitochondrial Oxygen Consumption
Mitochondrial oxygen consumption was measured polarographically in permeabilized fiber bundles using a respiration chamber (Oxygraph+, Hansatech Instruments, UK) with a method adapted from Min et al. (41), as described previously (5, 15). Plantaris and white head of the gastrocnemius (white gastrocnemius) were used to evaluate mitochondrial oxygen consumption in white and mixed fiber muscles, respectively. Red type muscle, such as soleus, was not utilized due to limited tissue availability. Plantaris and white gastrocnemius were separately placed in ice-cold buffer X (60 mM K-MES, 35 mM KCl, 7.23 mM K2EGTA, 2.77 mM CaK2EGTA, 20 mM imidazole, 0.5 mM DTT, 20 mM taurine, 5.7 mM ATP, 15 mM phosphocreatine, and 6.56 mM MgCl2 at pH 7.1). Connective tissue was removed and muscles were separated into near-single fiber bundles using sharp-forceps under a stereoscope (Fisher Scientific, Waltham, MA). Fiber bundles were permeabilized in 1 mL of cold saponin (50 μg/mL of buffer X) for 30 min; followed by three washes of 5 min in cold buffer Z (110 mM K-MES, 35 mM KCl, 1 mM EGTA, 5 mM K2HPO4, 3 mM MgCl2, 0.005 mM glutamate, 0.02 mM malate, and 0.5 mg/mL BSA at pH 7.1), as previously described (15).
Mitochondrial respiration was performed in a respiration chamber at 37°C. State 2 was induced in the permeabilized bundles by adding 10 μL of 5 mM of malate and 10 μL of 5 mM of pyruvate into 965 μL of phosphocreatine buffer (20 mM dissolved in buffer Z). After 2 min of incubation, 0.25 mM ADP was added to stimulate maximal respiration rate (state 3). After 5 min of incubation, 10 μL of oligomycin (10 μg/mL) were added to inhibit ATP synthase and induced state 4 respiration rate (non-ADP-stimulated, leak respiration) for 10 min and account for membrane proton leaking. State 3 was inferred by a 30-s interval of the steepest slope of the oxygen consumption curve after ADP addition, whereas state 4 was during 1-min interval of the shallowest slope of the curve after oligomycin incorporation. Ratio of state 3 and 4 was calculated to determine mitochondrial respiratory control ratio (RCR) as an index measure of how coupled mitochondrial respiration is. State 3 and 4 respiration rates were normalized to dried tissue weight.
Statistics
All data were analyzed using the PROC MIXED and LSMESTIMATE in SAS software (Cary, NC). To evaluate within-sex differences, a one-way ANOVA was utilized. If the global F test was significant, pair-wise comparisons were evaluated with a Tukey-adjusted P value. Significance was denoted at P < 0.05. Phenotypic data are graphed as raw (Fig. 1) and percent difference from control animals (Fig. 2) to provide multiple representations of the outcomes. Raw tissue weights were covaried on tibia length to account for potential differences in body size between animals and between sexes. In addition, we completed an additional supplemental analysis on body weights. To consider possible maturation of control animals while also comparing relative differences between males and females, we analyzed body weight data by normalizing body weight change to z-scores. The difference between initial body weight (at day 0) and final body weight in PBS controls within each sex as a “reference population.” From there, we calculated a z-score for each individual animal per standard formulas (value-reference population mean)/reference population standard deviation. This analysis allows for correction to any natural growth in the PBS control.
Figure 1.

Unnormalized phenotypic characteristics of cancer cachexia across time points following C26-tumor implantation. Tumor-free body weight (g) and initial body weight (change to z-score) (A); wet weights of gastrocnemius, tibialis anterior (TA), soleus, plantaris, and extensor digitorum longus (EDL) (B); gonadal fat, spleen, liver, and heart—(mg) (C). Weights were analyzed covaried to tibia length to statistically account for any variance in body size between experimental groups. All values are represented as least square means ± standard error of the mean (SEM). Labeling with different letters represents one-way ANOVA statistical differences of each group comparison at Tukey-adjusted with α value set at P < 0.05 within each sex. No statistically significant differences between groups within each sex are found if the label shares a common letter. If groups are marked by different letters the groups are statistically different from one another. Blue letters represent differences within male groups and pink letters represent differences within female groups. Trend across time points for each sex is represented by *(linear), Ω(quadratic), or ns (no significance). The overall interaction by trend analysis between biological sexes (males and females) is represented by a connector and by *(linear), Ω(quadratic) or ns(no significance). n = 11–20/group. PBS, phosphate-buffered saline. The boxed numbers represent the weight differences and the percent change between PBS and 25-day group for males (blue squares) and females (pink squares). Tissue and organ weights are recorded as wet weights. Connecting lines between groups are utilized solely for representational purposes, as each time point was evaluated in a distinct cohort of mice.
Figure 2.

Phenotypical characterization of cancer cachexia across time points following C26-tumor implantation. A: percent difference in tumor-free body weight (TF-BW) and tumor mass (mg) compared with phosphate-buffered saline (PBS) control of each sex. B: percent difference of gastrocnemius, tibialis anterior, soleus, plantaris, and extensor digitorum longus (EDL) compared to PBS control of each sex. C: percent difference of gonadal fat, spleen, liver, and heart compared with PBS control of each sex. All tissue and organ weights were analyzed covaried to tibia length. All values are represented as least square means ± standard error of the mean (SEM). Labeling with different letters represents one-way ANOVA statistical differences of each group comparison at Tukey-adjusted with α value set at P < 0.05 within each sex. No statistically significant differences between groups within each sex are found if the label shares a common letter. If groups are marked by different letters the groups are statistically different from one another. Blue letters represent differences within male groups and pink letters represent differences within female groups. Trend across time points for each sex are represented by *(linear) or ns(no significance). The overall interaction by trend analysis between biological sexes (males and females) is represented by a connector and by *(linear) or ns(no significance). n = 11–20/group. Tissue and organ weights are recorded as wet weights. Connecting lines between groups are utilized solely for representational purposes, as each time point was evaluated in a distinct cohort of mice.
To determine differences in CC trajectory between sexes, trend analysis was completed with an interaction effect of sex × time. Briefly, trend analysis is used to determine patterns of the data that may not reach pairwise statistical significance, indirectly comparing differential progressions of CC. A linear trend shows progressive content of the variable through the time points, a quadratic trend is found with a parabolic behavior (showing peaks), and a cubic trend appears when two inflection points are shown (12, 23, 42). As trajectory of variables measured herein are not necessarily expected to change with a linear course over time, this trend analysis enabled ability to better detect the nature of difference across the measured timepoints. If the trend interaction (linear, quadratic, or cubic) was significant, then within-sex trends were analyzed to determine data patterns within biological sexes, as we have previously described (12, 23, 42). Trends were considered significant at P < 0.01. An example of the statistical code used for the analysis is available in Supplemental File S1 (https://doi.org/10.6084/m9.figshare.22331191). Figures were compiled using GraphPad Prism 9.5.0 (GraphPad Software, La Jolla, CA). Data are expressed as least square means ± SE.
RESULTS
Biological Sex Differences in the Phenotypic Characterization of Colorectal Cancer Cachexia
To describe biological sex dimorphisms in phenotypic characteristics during CC onset and progression, wet tissue and organ weights were assessed at each time point. Unnormalized weights analyzed covaried to tibia length to statistically account for any variance in body size between experimental groups are presented as in Supplemental Table S1 (https://doi.org/10.6084/m9.figshare.23621094) and graphed in Fig. 1. Figure 2 represents data as normalized to PBS control as percent change across time points. Tumor-free body weight (TF-BW) was −14.75% (−3.9 mg, P < 0.0001) lower in male mice, while not significantly different in female mice (−3.79%/−1.5 mg, P = 0.8) at 25 days following tumor allograft compared with PBS controls, with a linear interaction between biological sexes (P < 0.0001) (Fig. 1A and Fig. 2A). Furthermore, we analyzed body weight data by normalizing body weight change to z-scores (Fig. 1A). The difference between initial body weight (at day 0) and final body weight in PBS controls within each sex was set as a reference population, accounting for possible growth in the PBS controls during the course of the experiment. Data revealed negative z scores in both male and female tumor-bearing mice. At 20 days, males and females exhibited z scores of −3.3 and −2.7, respectively, whereas at 25 days, males had z scores of −6.8 and females of −3.0. In male mice, gastrocnemius and TA muscle weights were different from PBS control, with −13.49% (−18.4 mg) and −17.06% (−7.6 mg) lower mass, respectively by 25 days of tumor development (P < 0.0003), whereas plantaris was ∼13.47% (−2.6 mg) lower at the same time point without reaching significance (P = 0.077); while female mice showed no significant differences across time points when compared with PBS control (Fig. 1B and Fig. 2B). Furthermore, an interaction denoting differential patterns between biological sexes was observed in gastrocnemius (P = 0.004) and TA (P < 0.001) muscles (Fig. 2B). Notably, females displayed no statistically significant differences in muscle masses between PBS control and 25 days of tumor-bearing conditions for any muscle measured. Lower fat mass was evident after 20 days of tumor implantation in male mice (−100.6 mg/−26.05%, P = 0.005), and −49.21% lower (−220.8 mg, P < 0.0001) after 25 days of tumor implantation. Female mice had similarly lower fat mass than male mice at this time point (−49.82%/−116.8 mg, P = 0.035) when compared with PBS control (Fig. 1C and Fig. 2C). Spleen weight was significantly greater in male and female mice after 20- [+74.9 mg/77.86% and +55.8 mg/58.71%, respectively (P < 0.0001)] and 25 days [+142.8 mg/+154.47% and +114.9 mg/+120.96%, respectively (P < 0.0001]) following tumor implantation when compared with PBS control (Fig. 1C and Fig. 2C). Female mice exhibited greater liver mass after 25 days of tumor implantation (+163.6 mg/+20.12% higher liver mass, P = 0.001), whereas male mice had lower heart mass after 20- and 25 days of tumor implantation (−10.2 mg/−8.96%, P = 0.015 and −17.6 mg/−11.92%, P = 0.0001, respectively) when compared with their PBS controls (Fig. 1C and Fig. 2C). There was an interaction denoting differential patterns between biological sexes for fat and spleen (P < 0.0001) (Fig. 2C). Overall, while males displayed canonical cachexia effects including lower muscle and fat masses with splenomegaly, females exhibited no statistically significant effects on muscle masses at 25 days of tumor-bearing compared with PBS control despite other canonical signs of cachexia (fat loss and hepatosplenomegaly).
Contractile Torque Was Altered in Cachectic Male Mice, but Not in Female Mice
Skeletal muscle contractility was measured by in vivo isometric torque to estimate the muscular force response of each of the groups. Absolute torque for male mice in the 10-days group was ∼23% lower at frequencies between 150 and 250 Hz (P < 0.05). Similarly, 25-days group torque was ∼28–33% lower at 200–300 Hz when compared with control (P < 0.01). Female absolute muscle torque of 25-days group was ∼29% lower than 10-days group at frequencies between 150 and 300 Hz (P < 0.05) although not statistically significant from control (Fig. 3A). When torque frequency was normalized by TF-BW, fewer statistical differences were observed between groups (Fig. 3A). Torque frequency in male mice 10-days group was 33% lower than 15-days group (P = 0.022) at 30 Hz, and ∼38% lower than 25-days group (P = 0.012) at 40–60 Hz. Female mice in the 15-days group had ∼40% lower force when compared with 10-days group at 30–60 Hz (P = 0.047), and ∼28% less in 20-days group when compared with 10-days group at 200 Hz (P = 0.047) (Fig. 3A). No differences against control were observed following normalization in both sexes.
Figure 3.

Skeletal muscle contractility across time points following C26-tumor implantation. A: isometric torque-frequency curve measured in mN·m for common peroneal nerve stimulation of plantar flexion in male and female experimental animal groups, and isometric torque-frequency curve measured in mN·m/kg for male and female experimental animal groups normalized to tumor-free body weight. +One-way ANOVA statistical differences observed between experimental groups at each frequency and at Tukey adjusted with a value set at P < 0.05. B: torque frequency at 250 Hz measured in mN·m for male and female experimental groups. Different letters represent one-way ANOVA statistical differences of each group comparison against phosphate-buffered saline (PBS) at Tukey-adjusted with α value set at P < 0.05 within each sex. C: fatigability curve represented as percentage from peak torque, where peak torque was 100%, and lowest torque contraction was calculated to be zero for males and females. D: area under the curve (AUC) of fatigability curve calculated from peak and normalized to number of contractions to account for variance in number of contractions completed after peak for male and female experimental animal groups. Labeling with different letters represents one-way ANOVA statistical differences of each group comparison at Tukey-adjusted with α value set at P < 0.05 within each sex. No statistically significant differences between groups within each sex are found if the label shares a common letter. If groups are marked by different letters the groups are statistically different from one another. Trend across time points for each sex are represented by *(linear) or ns (no significance). The overall interaction by trend analysis between biological sexes (males and females) is represented by a connector and by *(linear). n = 8–12 animals/group. Connecting lines between groups are utilized solely for representational purposes, as each time point was evaluated in a distinct cohort of mice.
Since most experimental groups achieved peak torque at 250 Hz, it was used as representation of differences between groups. Absolute torque-frequency (without normalization) at 250 Hz was significantly lower in 10- and 25-days groups compared with PBS in male mice (−10.5%, P = 0.046; and −24.3%, P = 0.006) (Fig. 3B). Female mice showed a statistical difference at 250 Hz between 10-days group and 25-days group (−29.0%, P = 0.044) (Fig. 3B). There was a linear trend between biological sexes (P = 0.0005). After normalizing to TF-BW, differences were not observed for both sexes (Supplemental Fig. S1A: https://doi.org/10.6084/m9.figshare.22331203). Other physiological measurements such as time to maximum and half relaxation time were assessed, and no statistical significances were noted (Supplemental Fig. S1, B and C: https://doi.org/10.6084/m9.figshare.22331203). To assess common signaling in excitation-contraction signaling, we measured mRNA content of Serca and Ryr1; no significant differences were found (Supplemental Fig. S2: https://doi.org/10.6084/m9.figshare.22331206).
Muscle fatigability is demonstrated in Fig. 3, C and D. Statistical comparisons were made using AUC following peak torque and normalized to number of contractions to account for variance in number of contractions completed after peak. From peak to end, male mice had significantly lower AUC/contraction in 25-days group compared with PBS control (Fig. 3D) (−13.2%, P = 0.027) with a significant trend between biological sexes (P = 0.029). In comparison, no statistical difference was observed for fatigability between female groups. Overall, our results show a lowered skeletal muscle contractility during CC that appears to be proportional to skeletal muscle mass loss.
Alterations to Regulators of Muscle Protein Synthesis
Protein synthesis was measured by deuterium oxide incorporation and presented in the fractional protein synthetic rate (FSR) in soleus, gastrocnemius, and TA muscles. We detected no differences in the FSR between time points in either male or female solei muscles (Fig. 4A). However, FSR in the male gastrocnemius was significantly lower in the 25-days group when compared with PBS controls (−34.2%, P = 0.003), 10-days (−43.5%, P < 0.0001), and 15-days groups (−38.8%, P = 0.0002). In addition, the 20-days group was significantly lower than the 10-days group (−26.6%, P = 0.01) (Fig. 4A). In the female groups, the 25-days group was not significantly different from control (P = 0.408) although it was significantly lower than the 10-days (−62.2%, P = 0.0001), 15-days (−57.2%, P = 0.002), and 20-days group (−52.5%, P = 0.02). In addition, gastrocnemius FSR in the 10-days female group was significantly higher than PBS control (64.8%, P = 0.032) (Fig. 4A). A significant quadratic trend was observed in gastrocnemius muscle between biological sexes (P < 0.0001). Similarly, in the TA, there was significantly lower FSR in male muscles at the 25 days time point when compared with control (−39.2%, P = 0.02), 10-days (−41.0%, P = 0.008), and 15-days group (−36.6%, P = 0.041). No statistical significance was observed across the time points in female TA despite having a trend between sexes (P = 0.003) (Fig. 4A).
Figure 4.
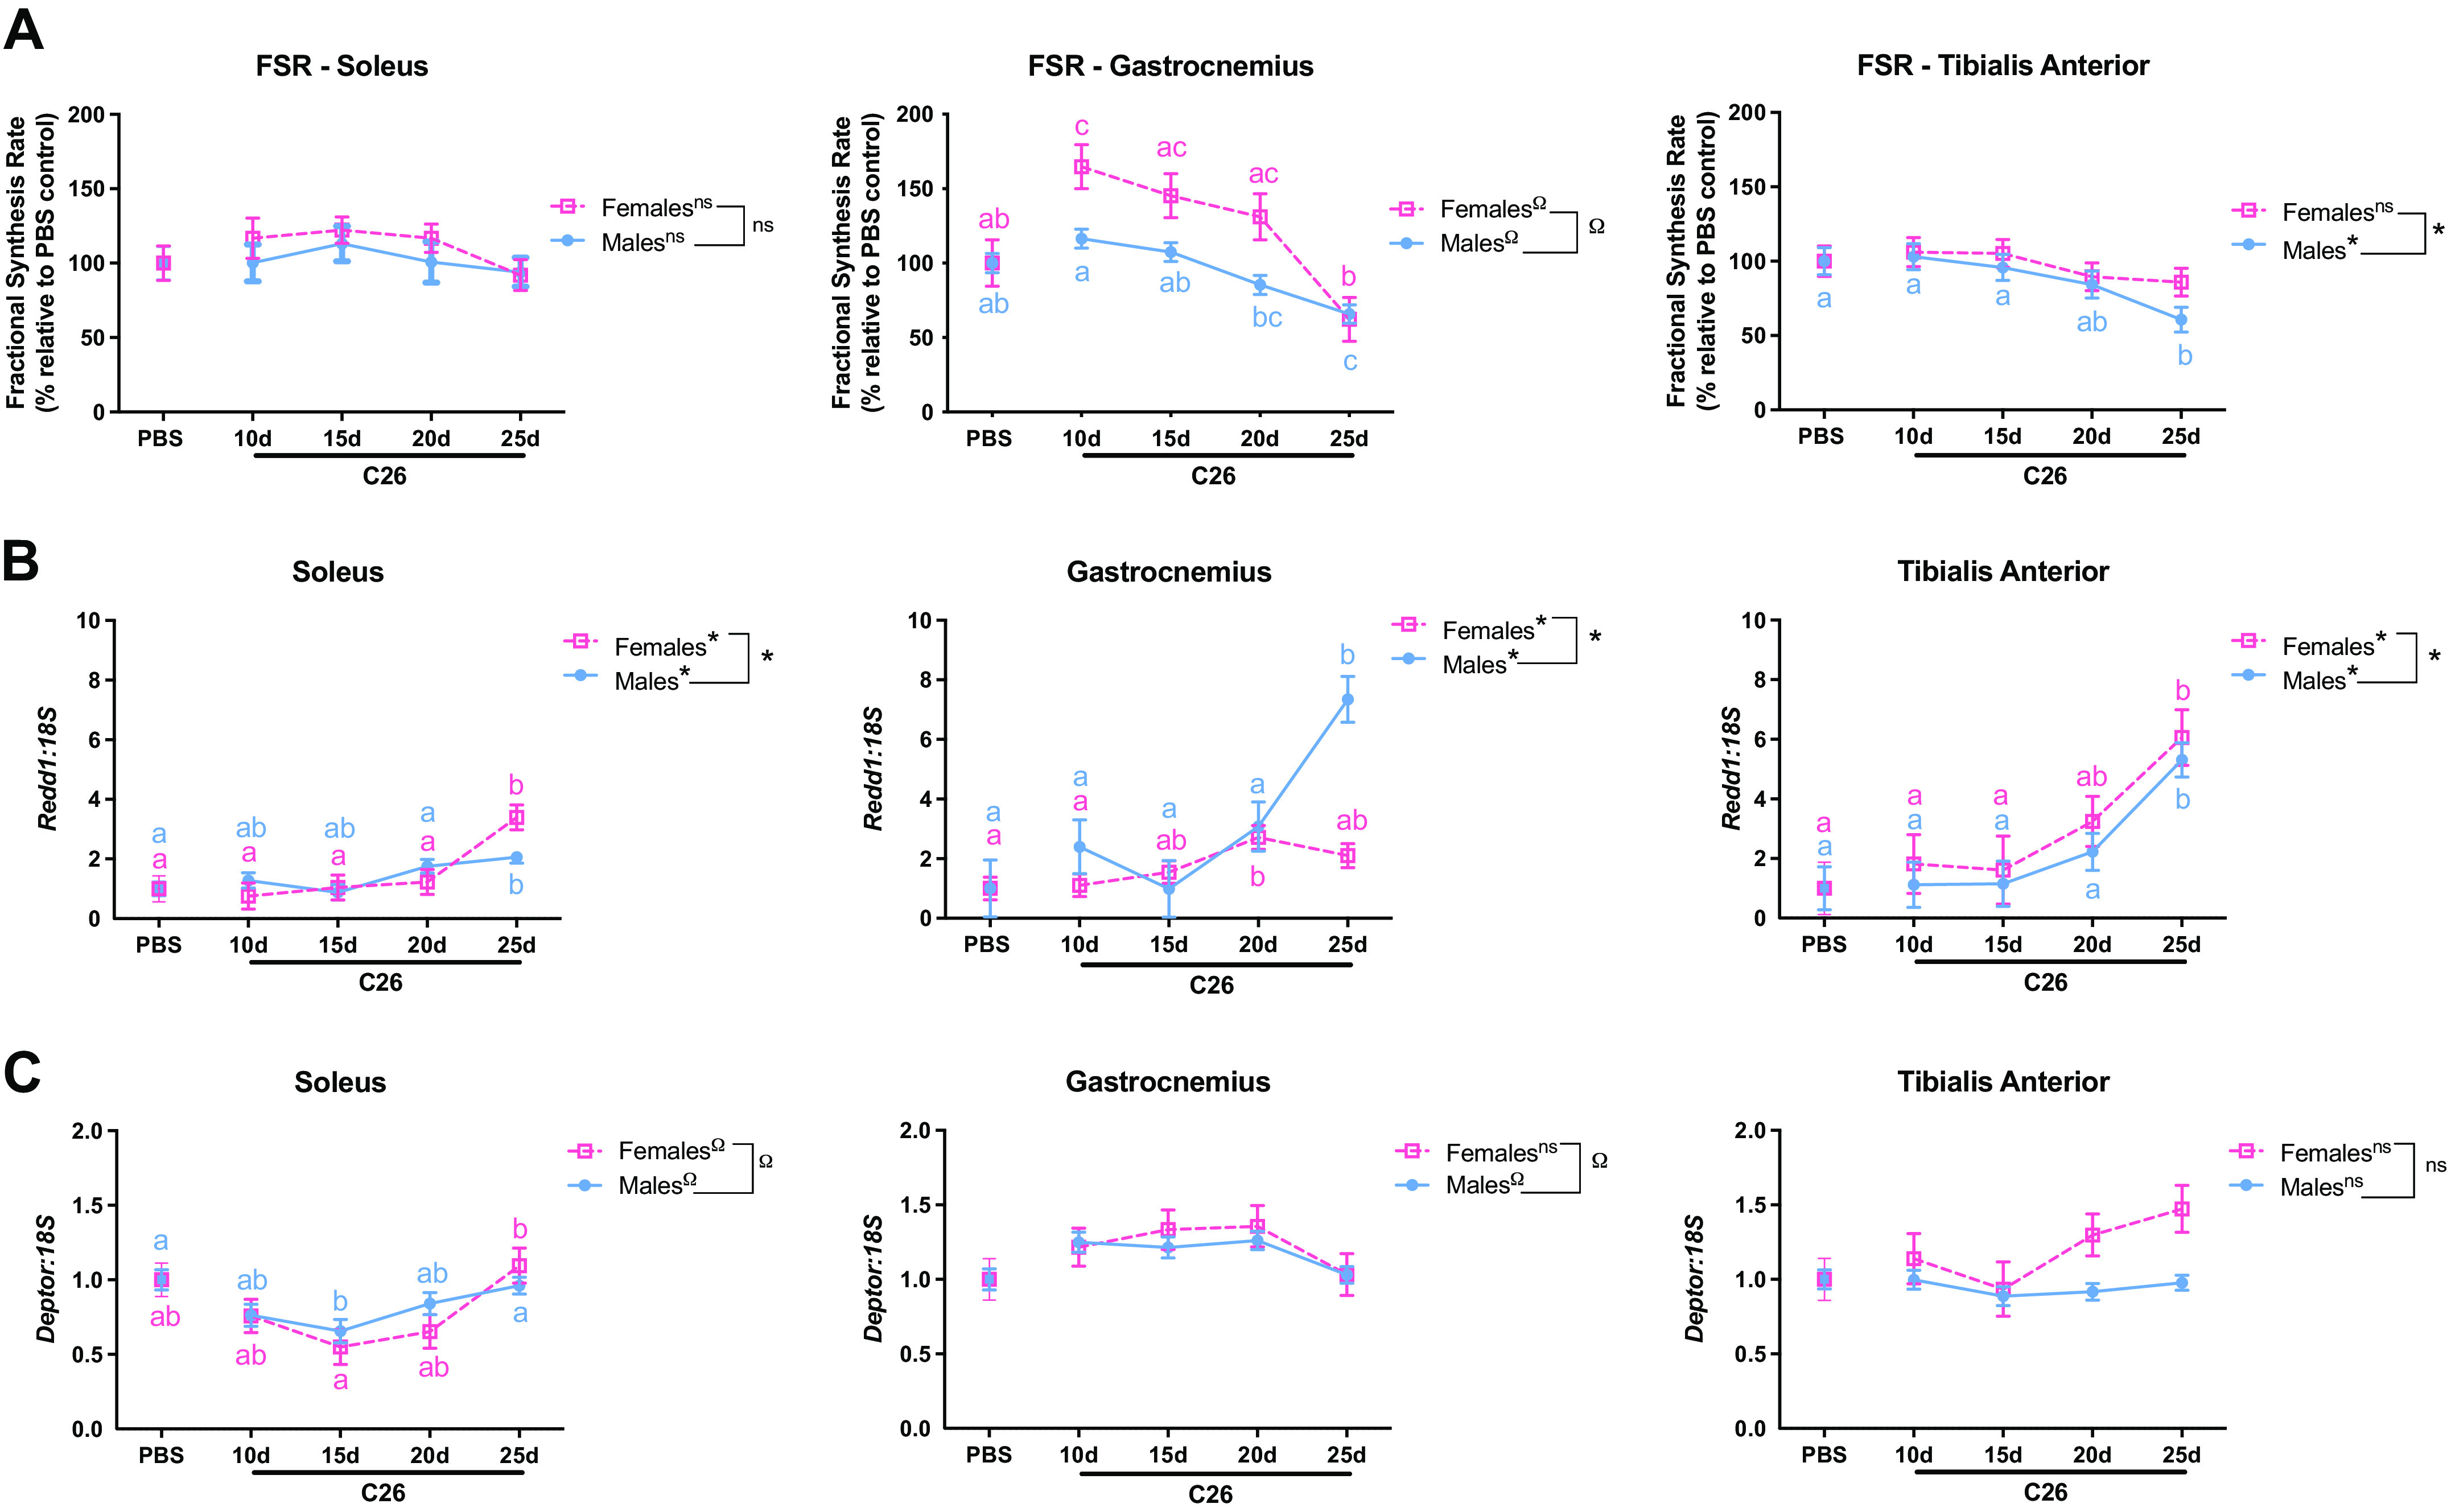
Fractional synthesis rate (FSR) and protein synthesis markers across time points following C26-tumor implantation. A: soleus, mixed gastrocnemius, and tibialis anterior fractional synthesis rate (FSR, %/h) after ∼ 2% of body enrichment of deuterium oxide (D2O). mRNA content of Redd1 (B) and Deptor (C) for soleus, mixed gastrocnemius, and tibialis anterior muscles of male and female experimental groups. mRNA content is relative to 18S abundance and presented as fold change from phosphate-buffered saline (PBS) control. All values are represented as least square means ± standard error of the mean (SEM). Labeling with different letters represents one-way ANOVA statistical differences of each group comparison at Tukey-adjusted with α value set at P < 0.05 within each sex. No statistically significant differences between groups within each sex are found if the label shares a common letter. If groups are marked by different letters the groups are statistically different from one another. Blue letters represent differences within male groups and pink letters represent differences within female groups. Trend across time points for each sex are represented by *(linear), Ω (quadratic), or ns(no significance). The overall interaction by trend analysis between biological sexes (males and females) is represented by a connector and by *(linear), Ω (quadratic), or ns(no significance). n = 8–16/group. Connecting lines between groups are utilized solely for representational purposes, as each time point was evaluated in a distinct cohort of mice.
Next, mRNA content of mTORC1 inhibitors, Redd1 (Ddit4) and Deptor, were measured to assess regulation of protein synthesis. Redd1 mRNA content in male mice was 2.1-fold (P = 0.008), 7.4-fold (P < 0.0001), and 5.3-fold (P = 0.0002) higher in soleus, gastrocnemius, and TA muscles, respectively, after 25 days of tumor implantation when compared with PBS control (Fig. 4B). In female mice, Redd1 mRNA content was significantly higher in soleus and TA muscles by 3.4-fold (P = 0.002) and 6.1-fold (P = 0.003), respectively, in 25-days group compared with control. No significant differences were observed in gastrocnemius after 25 days compared with PBS controls (Fig. 4B). There was an interaction between biological sexes (P < 0.0001) for the three studied muscles (Fig. 4B). No significant differences were observed in Deptor mRNA content in male or female mice after 25 days of tumor implantation compared with PBS group in any of the three studied muscles. There was an interaction between biological sexes for soleus (P < 0.0001) and gastrocnemius (P = 0.0007) (Fig. 4C).
C26-Induced Cachexia Induces Il-6 Expression and Proteolytic Markers in Males and Females
Interleukin-6 (Il-6) is among the proinflammatory cytokines associated with muscle wasting in colorectal CC (43–45). Il-6 mRNA content in male soleus was ∼2.5-fold higher in 25-days group when compared with 10-, 15-days, and PBS groups (P < 0.037). In female mice, soleus muscle Il-6 was 2.3-, 3.8-, and 2.5-fold higher in 25-days group when compared with 10-, 15-days, and PBS groups, respectively (P < 0.02) (Fig. 5A). Il-6 mRNA content in male mice gastrocnemius was ∼2.2-fold higher in 25-days group when compared with 10-, 15-days, and control groups (P < 0.0002). Whereas in female mice, gastrocnemius Il-6 was ∼2.5-fold higher in 25-days group when compared with 20-days group and control (P < 0.006), and 4.5- (P < 0.0001) and 3.7-fold higher (P = 0.0001) when compared with 10- and 15-days group, respectively (Fig. 5A). In male TA, Il-6 was 2.8- (P = 0.019) and 3.3-fold higher (P = 0.009) in 25-days group, when compared with PBS and 10-days groups, respectively (Fig. 5A) with no statistical differences in TA female mice. The interaction between biological sexes had a significant lineal trend for all three muscles (P < 0.002). Tnf-α mRNA content was not significantly different between experimental groups in either biological sex (Supplemental Fig. S3: https://doi.org/10.6084/m9.figshare.22331212).
Figure 5.

Inflammation and protein turnover markers across time points following C26-tumor implantation. mRNA content of Il-6 (A), Atrogin1 (B), Murf1 (C), Gadd45 (D), and Ubc (E) for soleus, mixed gastrocnemius, and tibialis anterior muscles of male and female experimental groups. mRNA content is relative to 18S abundance and presented as fold change from phosphate-buffered saline (PBS) control. All values are represented as least square means ± standard error of the mean (SEM). Labeling with different letters represents one-way ANOVA statistical differences of each group comparison at Tukey-adjusted with α value set at P < 0.05 within each sex. No statistically significant differences between groups within each sex are found if the label shares a common letter. If groups are marked by different letters the groups are statistically different from one another. Blue letters represent differences within male groups and pink letters represent differences within female groups. Trend across time points for each sex are represented by *(linear), Ω (quadratic), or ns(no significance). The overall interaction by trend analysis between biological sexes (males and females) is represented by a connector and by *(linear) or Ω (quadratic). n = 8–16/group. Connecting lines between groups are utilized solely for representational purposes, as each time point was evaluated in a distinct cohort of mice.
To evaluate proteolytic markers, we measured mRNA content of known mediators of muscle atrophy Atrogin1 (Fbxo32), Murf1 (Trim63), Gadd45, and Ubc mRNA in soleus, gastrocnemius, and TA muscles. In male mice, Atrogin1 mRNA content was 1.6-fold (P = 0.0003), 5.4-fold (P < 0.0001), and 5.1-fold (P = 0.0004) greater in soleus, gastrocnemius, and TA, respectively after 25 days of tumor implantation when compared with control (Fig. 5B). Atrogin1 content in female mice was significantly greater (6.8-fold, P = 0.009) in TA after 25 days of tumor implantation when compared with control (Fig. 5B). The interaction observed between biological sexes exhibited a significant trend in soleus, gastrocnemius, and TA (P < 0.0001).
Murf1 mRNA content in male mice was 1.6-fold (P = 0.0001), 5.0-fold (P = 0.001), 3.5-fold (P = 0.0004) greater in soleus, gastrocnemius, and TA, respectively after 25 days of tumor implantation when compared with PBS control (Fig. 5C). In female mice, Murf1 mRNA content was 1.9-fold (P = 0.019) higher in TA after 20 days of tumor implantation and 2.1-fold (P = 0.0001) and 2.4-fold (P = 0.0002) higher after 25 days in soleus and TA, respectively. The interaction between biological sexes had a significant trend for all three muscles (P < 0.003) (Fig. 5C).
In male mice, Gadd45a mRNA content was not significantly different from PBS control in soleus muscle after 25 days of tumor implantation, whereas in gastrocnemius and TA was 3.4-fold (P < 0.0001) and 1.9-fold (P = 0.0001) higher, respectively, when compared with control (Fig. 5D). Gadd45a mRNA content in female mice soleus and gastrocnemius was not significantly different from control after 25 days of tumor implantation, whereas TA was 2.2-fold higher (P = 0.01) (Fig. 5D). The interaction between biological sexes had a significant trend in for all three muscles (P < 0.0001).
Ubc mRNA content in male mice was 1.8-fold (P = 0.0004), 2.5-fold (P = 0.0004), and 2.1-fold (P < 0.0001), larger in soleus, gastrocnemius, and TA, respectively after 25 days of tumor implantation when compared with PBS control (Fig. 5E). Ubc mRNA content in female mice was 2.1-fold (P = 0.044) and 2.0-fold (P = 0.008) higher after 25 days of tumor implantation in gastrocnemius and TA, respectively, and without significant change in soleus when compared with PBS control (Fig. 5E). The interaction between biological sexes was linear in all three muscles (P < 0. 0011).
Alterations to Regulators of Mitochondrial Quality
Mitochondrial function was measured in permeabilized fibers of plantaris and the white gastrocnemius (Fig. 6, A and B). State 3 mitochondrial respiration in male plantaris was ∼49% significantly greater in 20-days group when compared with PBS control (P = 0.001) and 31% greater when compared with 25-days group (P = 0.02); whereas in female plantaris, significant differences were observed in state 3 by ∼50% greater state 3 respiration in 10- and 15 days of tumor allograft compared with control (P < 0.01), and ∼53% and ∼34% lower state 3 respiration in 20- and 25-days groups, respectively, compared with 10- and 15-days groups (P < 0.012) (Fig. 6A). In the white gastrocnemius, male 25-days group had ∼66% lower state 3 respiration than 20-days group (P = 0.008), without significant differences against PBS control. In 20-days group for female gastrocnemius, state 3 respiration was ∼46% lower compared with control and 10-days groups (P < 0.0082), other differences in state 3 respiration in female gastrocnemius were 20-days group ∼51% lower than 15-days group (P = 0.019) and 25-days group ∼60% lower than 10-days group (P = 0.023). There was an interaction between biological sexes for plantaris (P < 0.0001) and gastrocnemius state 3 (P = 0.0002) (Fig. 6A).
Figure 6.

Mitochondrial function and markers across time points following C26-tumor implantation. Mitochondrial oxygen consumption measured in permeabilized plantaris and white gastrocnemius muscles of male and female experimental groups normalized to dry fiber weight (O2 nmol/min/μg). A: state 3—ADP-induced maximal respiration. B: state 4—oligomycin-induced proton leakage. Opa1 (C) and Bnip3 (D) mRNA content of soleus, mixed gastrocnemius, and tibialis anterior muscles for male and female experimental groups. mRNA content is relative to 18S abundance and presented as fold change from phosphate-buffered saline (PBS) control. All values are represented as least square means ± standard error of the mean (SEM). Labeling with different letters represents one-way ANOVA statistical differences of each group comparison at Tukey-adjusted with α value set at P < 0.05 within each sex. No statistically significant differences between groups within each sex are found if the label shares a common letter. If groups are marked by different letters the groups are statistically different from one another. Blue letters represent differences within male groups and pink letters represent differences within female groups. Trend across time points for each sex are represented by *(linear), Ω (quadratic), or ns(no significance). The overall interaction by trend analysis between biological sexes (males and females) is represented by a connector and by *(linear), Ω (quadratic), or ns(no significance). n = 5–16/group. Connecting lines between groups are utilized solely for representational purposes, as each time point was evaluated in a distinct cohort of mice.
State 4 mitochondrial respiration exhibited a similar pattern to state 3 (Fig. 6B). State 4 respiration in the 20-days group in male plantaris was ∼84% higher than 25-days group (P = 0.0003) and ∼105% higher than PBS control (P < 0.0001). In female plantaris, state 4 respiration of 10- and 15-dasy groups were ∼150% higher than 20-days group (P < 0.0001), and ∼55% higher than 25-days and PBS groups (P < 0.007). An interaction between sexes was observed in plantaris state 4 respiration (P = 0.0007) (Fig. 6B). In the white gastrocnemius, state 4 respiration in the male 25-days group was ∼77% lower than 20-days group (P = 0.0003) and ∼17% lower than PBS control (P = 0.021). State 4 respiration in the 20-days group for female white gastrocnemius were ∼39% lower than PBS control group (P = 0.019). Other significant differences in female state 4 respiration of the white gastrocnemius were 10-days group ∼27% higher than 15-days group (P = 0.028), ∼108% higher than 20-days group (P < 0.0001), and ∼88% higher than 25-days group (P < 0.0001). Likewise, white gastrocnemius state 4 respiration in the 15-days group was ∼64% higher than 20-days group (P = 0.005) and ∼47% higher than 25-days group (P = 0.029) (Fig. 6B). An interaction between sexes was observed in gastrocnemius state 4 respiration (P = 0.0006) (Fig. 6B). Respiratory control ratio (RCR) was not significant in either muscle or sex (Supplemental Fig. S4A: https://doi.org/10.6084/m9.figshare.22331221).
Based on prior observations in our laboratory (5, 15), Opa1, Fis1, and Bnip3 mRNA contents were specifically measured as markers to evaluate mitochondrial dynamics and quality control (Fig. 6, C and D). Opa1 mRNA content in male mice was 26% (P = 0.0001) lower in TA muscle, without significant changes in soleus and gastrocnemius after 25 days of tumor implantation when compared with PBS control (Fig. 6C). In female mice, Opa1 mRNA was significantly lower than control in soleus muscles after 10- (48.6%, P = 0.006), 15- (55.4%, P = 0.001), and 20 days (55.1%, P = 0.001) of tumor implantation, with no significant difference observed after 25 days. No significant differences were observed in gastrocnemius or TA. The interaction between biological sexes was quadratic (P < 0.0001) for soleus muscle (Fig. 6C). Fis1 mRNA content in 15-days group in male mice soleus was 30% lower than control (P = 0.003); and 15- and 25-days groups in male mice gastrocnemius were ∼20% lower than 10-days group (P < 0.04) without significant differences against control. No significant differences were observed in TA male mice or any of the investigated muscles in female mice (Supplemental Fig. S4B: https://doi.org/10.6084/m9.figshare.22331221).
In male mice, Bnip3 mRNA content was significantly lower than control in soleus muscles after 10- (25.3%, P = 0.008) and 15 days (30.5%, P = 0.001) of tumor implantation, with no significant difference observed after 20 days; whereas in gastrocnemius, it was 85% (P = 0.001) higher than control after 25 days of tumor implantation (Fig. 6D). No significant differences were observed in TA for male mice and in any of the three evaluated muscles for female mice. The interaction between biological sexes was quadratic for soleus and linear for gastrocnemius (P < 0.0001) (Fig. 6D). In addition, Ldha and Ldhb mRNA content was also assessed (Supplemental Fig. S5: https://doi.org/10.6084/m9.figshare.22331224) with no statistical differences found.
DISCUSSION
Mechanisms of CC are known to be heterogeneous between tumor types (46). To date, although there have been indications for heterogeneity of CC between biological sex during its development in both preclinical and clinical studies, few investigations have made direct comparisons between the biological sexes (6, 15, 25, 26). To our knowledge, this is among the first investigations to directly evaluate sex differences during the initial development of C26 colorectal cancer-induced cachexia. Importantly, although the consensus definition of CC places the onus for wasting on loss of skeletal muscle mass (4), our data suggest the need to consider whether this is the most appropriate for females in early-stage cachexia. Specifically, despite other classic signs of cachexia being similar (fat loss, splenomegaly) or even exacerbated (hepatomegaly) in females, the muscles remain relatively protected when compared with males at the matched-time point (study end point). These data provide evidence for heterogeneity between biological sexes in the initial development of CC, which must be further considered in defining mechanisms of cachexia and identifying potentially efficacious treatments for this condition.
Relative Preservation of Muscle Weights in Female Mice during Systemic Cancer Cachexia
We have shown not only do males and females experience the onset of CC differently, but females exhibit relative resistance to cachexia-induced muscle wasting compared with males in early-stage cachexia within 25 days of tumor implantation, despite other canonical signs of cachexia. Both sexes exhibited markers consistent with the onset of CC, including similar loss of gonadal fat mass and marked splenomegaly, consistent with that reported for pancreatic cancer-bearing mice by Zhong et al. (25). However, while male mice showed significant reductions in TF-BW by 20 days, female mice did not experience a significant reduction in body mass at any time point compared with healthy same-sex controls. Both male and female mice demonstrated a negative z score for weight change compared with same-sex controls, which was exacerbated in males further validating early-stage cachexia in both sexes which appeared further advanced in males. This is of particular interest to the development of C26 colorectal tumors, as the tumors in both sexes grew to a palpable mass between 10 and 15 days, and the tumor mass increased more so in the males through the 20 days and 25 days. However, despite female mice demonstrating canonical cachectic phenotypes with equivalent muscle inflammation markers (Il-6) than male mice we cannot discount that the lower tumor burden may impact the cachectic phenotype of muscle in our current study. In other CC models utilizing subcutaneous allograft implantation, this is not uncommon. In our prior work using Lewis lung carcinoma (LLC) cells (5, 15), tumor size was greater in male mice than females after 4 wk of tumor implantation. Although the lower final tumor mass in females may be a complicating factor and might be associated to cachexia severity (47), we noted that females presented near equivalent effects to males on nonmuscle tissues in the development of cachexia, such as degree of fat loss and splenomegaly, or even exacerbated effects, such as hepatomegaly.
In our examination of skeletal muscle, female mice exhibited a relative resistance to skeletal muscle atrophy compared with males in early-stage cachexia. Although the highly oxidative soleus and plantaris exhibit some protection from cancer-induced muscle loss regardless of sex, only males experienced significant atrophy in other hindlimb muscles by 25 days of tumor-bearing state. These muscle alterations are similar to observations by Zhong et al. (25) in early-stage GEMM KPC mice, in which only gastrocnemius exhibited atrophy among measured muscles in females despite significantly lower masses of all measured muscle groups in males at this phase. Furthermore, despite the lack of statistically significant muscle atrophy in early-stage cachectic females, these females did display overt gonadal fat loss and hepatosplenomegaly. Although we expect further tumor growth to associate with eventual muscle loss in females at later time points, similar to the work by Zhong et al. (25), this does not rule out that cancer-induced muscle loss appears delayed in females, resulting in muscle mass preservation during the early stages of cachexia considered here, compared with males. The equivalence of fat loss and splenomegaly in both sexes or exacerbated hepatomegaly in females only, without changes to skeletal muscle tissues over 25 days in female mice, is highly suggestive of relative protections to muscle mass during early onset of cachexia compared with male mice. Based upon the data presented here, the data from Zhong et al. (25), and other observations within each biological sex (5, 15, 18, 26), it is possible to speculate that female mice in later stages will eventually experience statistically significant muscle wasting, indicating that the observed protection in females may be primarily a delay in muscle loss. Therefore, we suggest primary focus of early-stage cachexia in females be placed upon effects on nonmuscle tissues as opposed to a canonical consideration of the skeletal muscles.
Ultimately, the mice utilized in this study were 8-12 wk old, representing a growing younger age group. To gain a more comprehensive understanding of the importance of this consideration, future investigations should replicate these models in older mice after establishing a baseline using the younger cohort. This would provide insights into whether active growth influences the observed outcomes presented here. Furthermore, it is crucial to investigate at later time points to assess the extent to which female mice with C26 allografts will experience muscle atrophy in future studies.
Skeletal Muscle Weakness Concurrent to Muscle Mass Loss in Male Mice
CC is known to impact skeletal muscle contractile function (15, 17). Our in vivo peak isometric torque showed a significantly smaller isometric peak after 10 days following tumor allograft in male mice; this marked skeletal muscle weakness was further evident at 25 days with the onset of phenotypic cachexia. However, these effects are lost when normalized to TF-BW. Our results are similar to reports in BALB/c and CD2F1 C26 tumor-bearing mice in wasted extensor digitorum longus (EDL), soleus, and quadriceps muscles (48–50), in which absolute force is significantly lower with cachexia but not specific force. These findings suggest weakness might be due primarily to muscle atrophy rather than an intrinsic alteration to muscle contractile function. On the other hand, Delfinis et al. (50) also found specific force production remained low in diaphragm after normalization, implying a heterogenic muscle response to cachexia (50). Moreover, female mice did not exhibit significant changes in torque production at any frequency between control and later time point tumor-bearing groups, supporting the notion that the observed torque-frequency changes in males are largely driven by significant muscle atrophy that was not present in females. We do note an elevated torque measured in our 10-day females, it is possible this represents a compensatory effect in response to the tumor-bearing state, however, at this time authors feel any speculation with regards to this observation should be taken with caution. In addition, we observe biological sex differences in fatigability, in which cachectic male mice exhibit greater fatigability with the development of cachexia, which is not seen in females. Greater muscle fatigability seen in male mice is similar to prior in situ work in male ApcMin/+ mice (17), whereas maintained muscular endurance in females is similar to other prior works (15, 51). Together, these data suggest a potential sex-dependent protective mechanism relating to skeletal muscle contractile function during cancer cachexia.
Muscles with Significant Differences in Wet Weight Displayed Concomitant Alterations in Protein Synthesis Regulators and Proteolytic Markers
We next examined muscle protein synthesis across three muscle groups to reflect classically oxidative (soleus), mixed (gastrocnemius), and glycolytic (TA) muscle phenotypes. In the soleus muscle, there were no differences in FSR at any time point for both males and females, reflecting the resistance to atrophy seen in solei wet muscle masses in response to CC-induced atrophy (52). However, in males, lower gastrocnemius and TA masses were matched by repressed anabolic rates reflective of the role of protein synthesis in CC. This notion is further supported by induction of the mTOR inhibitor Redd1 in the gastrocnemius of male mice and TA of both sexes, concomitant with a reduction of protein synthesis rates in males at the 25 days time point. Redd1 has been reported to be upregulated in C26 tumor xenograft (53), and others have shown the role of Redd1 in muscle loss associated to cachexia (54, 55). The induction of Redd1 in female TAs may signal toward early stages of anabolic repression leading to eventual muscle loss in these animals, similar to the delayed muscle phenotype in the study by Zhong et al. (25). In addition, a second mTOR repressor, Deptor, was not affected in C26 mice. The lack of significant differences in Deptor mRNA content among groups is in direct contrast to our works in male (26) and female (15) LLC bearing mice, wherein Deptor was significantly and strongly induced. These data suggest anabolic repression during C26-induced cachexia is mediated by Redd1, differing from the apparent role of Deptor in LLC models, likely suggesting a difference in mechanisms mediating anabolic repression between these forms of CC.
Furthermore, most of the common markers of protein degradation measured (Atrogin1, Murf1, Gadd45a, and Ubc) in the three muscles of male mice were significantly higher than PBS controls, suggesting enhanced muscle protein degradation. These higher values are concomitant with the tissue wasting observed and similar to previous investigations (26, 44, 56). Peculiarly, despite relative preservation of skeletal muscle and body weights in female mice compared with males in this early stage, common markers of protein degradation were significantly induced, especially within the TA muscle. Overall, regardless of biological sex, primary regulators of muscle protein catabolism are induced during development of cachexia in a manner congruent with a negative protein balance. It appears these effects within the females likely precede development of overt muscle loss.
Inflammatory cytokines have been regularly associated with muscle wasting, repressed protein anabolism, and induction of protein catabolism (57). Our observed induction of Il-6 without a concomitant induction of Tnf-α mRNA is reflective of the known role of Il-6 in male colorectal cancer-induced cachexia (2, 43, 45), whereas data have suggested colorectal cancer-induced cachexia may be independent of a required role of Il-6 in females (43, 44) which would reflect observations herein. Although the role of chronic Il-6 in the induction of protein catabolism and suppression of protein anabolism is well known, we suggest a potential mechanistic link between Il-6 induction and Redd1 induction observed here. Specifically, prior work shows lower basal Redd1 in mice lacking the muscle Il-6 receptor GP130 (58) whereas other works suggest a link between acute Il-6-mediated STAT3 signaling and Redd1 (57, 59). This potential mechanistic link for cachexia-induced anabolic repression deserves further direct consideration. Regardless, these data are in support of the Il-6 role in inducing cachectic muscle loss specifically in male, but not in female mice, at least in early stages of cachexia.
Mitochondrial Dynamics Markers Are Altered in Wasted Muscles
Altered mitochondrial health has been reported during CC and it is believed mitochondrial impairments might be a trigger event initiating cachexia-induced muscle loss (5). Therefore, we next examined mitochondrial function during the onset of cachexia. Interestingly, in cachectic mice (25 days following tumor implantation) no significant alterations in state 3 or state 4 of mitochondrial respiratory function were observed. We previously reported degeneration to the mitochondrial network in male mice preceding both LLC-induced cachexia and disuse-induced muscle atrophy, which is not observed in females until following onset of marked muscle atrophy (5, 15, 23). Here, we observed sexual dimorphisms in mitochondrial respiration during development of cachexia. Within a similar study design, Delfinis et al. (50) recently reported mitochondrial respiration in quadriceps of male CD2F1 mice with C26 tumors, with lower state 3 respiration levels after 2 wk of C26 implantation that was reversed after 4 wk, suggesting high plasticity and a compensatory mechanism independent of mitochondrial content (50). In the current work, we observe a significantly elevated state 3 and state 4 respiration in male 20-days plantaris, whereas females at 20 days exhibit lower state 3 and state 4 respiration in plantaris and significant lower levels in white gastrocnemius. Both observations would appear to implicate mitochondrial stress in these stages shortly before onset of cachexia itself. Moreover, the alterations seen in 20-days groups of both tissues might suggest an hormetic adaptation to regulate energy requirements preceding cachexia, as proposed by Delfinis et al. (50). Moreover, both state 3 and state 4 respiration trends had a similar direction of change maintaining constant the RCR across time points. Based on our findings, we hypothesize the mitochondrial respiration’s hyper- or hypo-compensation is mediated by mechanisms specific to each sex and mouse strain.
Mitochondrial dynamics systems are responsible for maintaining a healthy balance between mitochondrial fission and fusion to maintain a healthful mitochondrial network (60). Unbalanced mitochondrial dynamics can be deleterious as it can contribute to accumulation of damaged mitochondria or excessive mitophagy (60). In this study, we measured Opa1 mRNA content as a mitochondrial fusion marker. In other CC models, we found Opa1 dysregulated before muscle wasting, which was specific to males (5, 15). Here, we found Opa1 was lower in TA muscle of male mice and there was a trend of lower values in gastrocnemius across the 25 days of tumor implantation. For female mice, Opa1 mRNA levels were significantly different only in soleus muscle, in which 10- to 20-days groups fold change was significantly lower than control. However, the fold change in 25-days group was no different than control. We previously observed reduced expression of Opa1 preceding cancer-induced cachexia in gastrocnemius of LLC tumor-bearing males (5) but not in females (15). The contrast between timing of Opa1 content loss in LLC-bearing males previously reported and C26 bearing here is suggestive of variations in mechanisms of mitochondrial dysregulation between forms of cancer. Moreover, studies using knockout models of Opa1 have reported body weight loss, muscle atrophy, and muscle weakness in adult mice, while Opa1-overexpressing mice show some protection from muscle atrophy (61, 62). Taken together, the lack of Opa1 alterations in female muscles after 25 days of tumor implantation and their relative musculoskeletal mass preservation across time points compared with males, along with previous reports in other CC models (5, 15), might suggest Opa1 as a modulator of muscle size during exposure to CC stimuli and may suggest differences between C26 and LLC models. However, the role of Opa1 in maintenance of muscle health needs to be further tested. In addition, fragmented mitochondria have been associated with increased mitophagy (63). Our research group has previously demonstrated dysregulated mitophagy markers during LLC-induced cachexia (5, 15). Bnip3 induction was noted at both mRNA and protein levels in LLC-bearing males preceding and during the onset of CC while for females this elevation did not occur until after CC developed (5, 15). Bnip3 has also been reported elevated in gastrocnemius muscle of LLC and TA muscle of C26 tumor-bearing mice models accompanied of muscle loss (16, 64). However, in this study, we observed higher Bnip3 mRNA levels only in gastrocnemius muscle in male mice after 25 days of cancer allograft, without statistically significant changes in Bnip3 in females across time points. Considering our findings and the variations across studies using different cancer-induced cachexia models, it appears that Bnip3 alterations are concurrent with muscle loss, and conservancy of mitochondrial dynamics might be necessary to sustain muscle mass.
In conclusion, we find altered trajectories of muscle alterations during the progression and development of cancer cachexia in a C26 model. Specifically, although males exhibit canonical muscle atrophy, in comparison females appear relatively resistant to muscle loss at early stages despite the occurrence of other common aspects of the cachectic phenotype, such as fat loss and hepatosplenomegaly. Moreover, females maintained skeletal muscle size through the end point of this study (no statistically significant difference between PBS and 25 days tumor bearing) despite inductions of common protein degradative pathways, suggesting muscle protections are primarily reflective of delayed muscle loss at early time points. Regardless, we suggest in early stages the onus of cachexia in females may be placed on these nonmuscle tissues, which may in fact aid in identification of proper stages in which protective interventions may be used. As females maintained various metrics of mitochondrial quality control, it is plausible muscle phenotypic differences between males and females were moderated by mitochondrial quality mechanisms. However, this hypothesis warrants further investigation. Regardless, our data demonstrate biological sex dimorphisms in the etiology of cancer-associated cachexia that will need to be accounted for in the future development of therapeutics to attenuate cachexia development and extend quality of life.
Perspectives and Significance
This study contributed a broader picture of the sex differences in the onset and progression of CC utilizing a C26 colorectal carcinoma model. We find differences in the phenotypic alterations between male and female mice, suggesting the onus of early cachexia diagnosis and potential treatment should be placed on nonmuscle tissues in females, especially in early stages when preventive efforts are more likely to be effective. Phenotypic differences between males and females are accompanied by differences in signaling and regulation of cellular pathways involved in protein turnover and regulation of energy requirements, such as mitochondrial respiration and dynamics during the pre-cachectic state. All of the aforementioned underlines the complexity of CC and how biological sex-dependent mechanisms likely contribute to muscle wasting in a singular manner. Future studies are needed to explore more in depth the cellular alterations that trigger the events reported here.
DATA AVAILABILITY
Data will be made available upon reasonable request.
SUPPLEMENTAL DATA
Supplemental Table S1: https://doi.org/10.6084/m9.figshare.23621094;
Supplemental File S1: https://doi.org/10.6084/m9.figshare.22331191;
Supplemental Fig. S1: https://doi.org/10.6084/m9.figshare.22331203;
Supplemental Fig. S2: https://doi.org/10.6084/m9.figshare.22331206;
Supplemental Fig. S3: https://doi.org/10.6084/m9.figshare.22331212;
Supplemental Fig. S4: https://doi.org/10.6084/m9.figshare.22331221;
Supplemental Fig. S5: https://doi.org/10.6084/m9.figshare.22331224.
GRANTS
This study was funded by the National Institute of Arthritis and Musculoskeletal and Skin Diseases of the National Institutes of Health R01AR075794-01A1/AR/NIAMS (to N.P.G.), by the National Institute of General Medical Sciences of the National Institutes of Health under Award Number P20GM125503, and by the Office of the Director, National Institutes of Health, K12HD051959.
DISCLOSURES
No conflicts of interest, financial or otherwise, are declared by the authors.
AUTHOR CONTRIBUTIONS
J.W.D., T.A.W., and N.P.G. conceived and designed research; A.R.C., J.W.D., S.L., F.M.d.S., E.R.S., L.W.S., and M.P.W. performed experiments; A.R.C., J.W.D., M.E.R.-C., N.P.G. analyzed data; A.R.C., J.W.D., and N.P.G. interpreted results of experiments; A.R.C. and J.W.D. prepared figures; A.R.C. and J.W.D. drafted manuscript; A.R.C., J.W.D., S.L., F.M.d.S., E.R.S., L.W.S., S.T., M.E.R.-C., and M.P.W., T.A.W., and N.P.G. edited and revised manuscript; A.R.C., J.W.D., S.L., F.M.d.S., E.R.S., L.W.S., S.T., M.E.R.-C., M.P.W., T.A.W., and N.P.G. approved final version of manuscript.
ACKNOWLEDGMENTS
The authors thank all the faculty, staff, and students of the Exercise Science Research Center at the University of Arkansas, and Dr. Aaron Caldwell for support and contributions herein. Graphical abstract was created with a licensed version of BioRender.com.
REFERENCES
- 1. Peixoto da Silva S, Santos JMO, Costa e Silva MP, Gil da Costa RM, Medeiros R. Cancer cachexia and its pathophysiology: links with sarcopenia, anorexia and asthenia. J Cachexia Sarcopenia Muscle 11: 619–635, 2020. doi: 10.1002/jcsm.12528. [DOI] [PMC free article] [PubMed] [Google Scholar]
- 2. Bonetto A, Aydogdu T, Kunzevitzky N, Guttridge DC, Khuri S, Koniaris LG, Zimmers TA. STAT3 activation in skeletal muscle links muscle wasting and the acute phase response in cancer cachexia. PLoS One 6: e22538, 2011. doi: 10.1371/journal.pone.0022538. [DOI] [PMC free article] [PubMed] [Google Scholar]
- 3. Bielecka-Dabrowa A, Ebner N, Santos MR, Ishida J, Hasenfuss G, Haehling S. Cachexia, muscle wasting, and frailty in cardiovascular disease. Eur J Heart Fail 22: 2314–2326, 2020. doi: 10.1002/ejhf.2011. [DOI] [PubMed] [Google Scholar]
- 4. Fearon KP, Strasser FP, Anker SDP, Bosaeus IP, Bruera EP, Fainsinger RLP, Jatoi AP, Loprinzi CP, MacDonald NP, Mantovani GP, Davis MP, Muscaritoli MP, Ottery FMD, Radbruch LP, Ravasco PMD, Walsh DP, Wilcock AMD, Kaasa SP, Baracos VEP. Definition and classification of cancer cachexia: an international consensus. Lancet Oncol 12: 489–495, 2011. doi: 10.1016/S1470-2045(10)70218-7. [DOI] [PubMed] [Google Scholar]
- 5. Brown JL, Rosa-Caldwell ME, Lee DE, Blackwell TA, Brown LA, Perry RA, Haynie WS, Hardee JP, Carson JA, Wiggs MP, Washington TA, Greene NP. Mitochondrial degeneration precedes the development of muscle atrophy in progression of cancer cachexia in tumour-bearing mice. J Cachexia Sarcopenia Muscle 8: 926–938, 2017. doi: 10.1002/jcsm.12232. [DOI] [PMC free article] [PubMed] [Google Scholar]
- 6. Zhong X, Zimmers TA. Sex differences in cancer cachexia. Curr Osteoporos Rep 18: 646–654, 2020. doi: 10.1007/s11914-020-00628-w. [DOI] [PMC free article] [PubMed] [Google Scholar]
- 7. Fearon KC, Glass DJ, Guttridge DC. Cancer cachexia: mediators, signaling, and metabolic pathways. Cell Metab 16: 153–166, 2012. doi: 10.1016/j.cmet.2012.06.011. [DOI] [PubMed] [Google Scholar]
- 8. Hardee JP, Counts BR, Carson JA. Understanding the role of exercise in cancer cachexia therapy. Am J Lifestyle Med 13: 46–60, 2019. doi: 10.1177/1559827617725283. [DOI] [PMC free article] [PubMed] [Google Scholar]
- 9. Lim S, Dunlap KR, Rosa-Caldwell ME, Haynie WS, Jansen LT, Washington TA, Greene NP. Comparative plasma proteomics in muscle atrophy during cancer-cachexia and disuse: the search for atrokines. Physiol Rep 8: e14608, 2020. doi: 10.14814/phy2.14608. [DOI] [PMC free article] [PubMed] [Google Scholar]
- 10. Onesti JK, Guttridge DC. Inflammation based regulation of cancer cachexia. BioMed Res Int 2014: 168407–168407, 2014. doi: 10.1155/2014/168407. [DOI] [PMC free article] [PubMed] [Google Scholar]
- 11. Roeland EJ, Bohlke K, Baracos VE, Bruera E, Del Fabbro E, Dixon S, Fallon M, Herrstedt J, Lau H, Platek M, Rugo HS, Schnipper HH, Smith TJ, Tan W, Loprinzi CL. Management of cancer cachexia: ASCO guideline. J Clin Oncol 38: 2438–2453, 2020. doi: 10.1200/JCO.20.00611. [DOI] [PubMed] [Google Scholar]
- 12. Rosa-Caldwell ME, Brown JL, Lee DE, Wiggs MP, Perry RA Jr, Haynie WS, Caldwell AR, Washington TA, Lo W-J, Greene NP. Hepatic alterations during the development and progression of cancer cachexia. Appl Physiol Nutr Metab 45: 500–512, 2020. doi: 10.1139/apnm-2019-0407. [DOI] [PMC free article] [PubMed] [Google Scholar]
- 13. Solheim TS, Laird BJA, Balstad TR, Bye A, Stene G, Baracos V, Strasser F, Griffiths G, Maddocks M, Fallon M, Kaasa S, Fearon K. Cancer cachexia: rationale for the MENAC (Multimodal—Exercise, Nutrition and Anti-inflammatory medication for Cachexia) trial. BMJ Support Palliat Care 8: 258–265, 2018. doi: 10.1136/bmjspcare-2017-001440. [DOI] [PubMed] [Google Scholar]
- 14. Sadeghi M, Keshavarz-Fathi M, Baracos V, Arends J, Mahmoudi M, Rezaei N. Cancer cachexia: diagnosis, assessment, and treatment. Crit Rev Oncol Hematol 127: 91–104, 2018. doi: 10.1016/j.critrevonc.2018.05.006. [DOI] [PubMed] [Google Scholar]
- 15. Lim S, Deaver JW, Rosa-Caldwell ME, Haynie WS, Morena da Silva F, Cabrera AR, Schrems ER, Saling LW, Jansen LT, Dunlap KR, Wiggs MP, Washington TA, Greene NP. Development of metabolic and contractile alterations in development of cancer cachexia in female tumor-bearing mice. J Appl Physiol (1985) 132: 58–72, 2022. doi: 10.1152/japplphysiol.00660.2021. [DOI] [PMC free article] [PubMed] [Google Scholar]
- 16. da Silva FM, Lim S, Cabrera AR, Schrems ER, Jones RG, Rosa-Caldwell M, Washington TA, Murach KA, Greene NP. The time-course of cancer cachexia onset reveals biphasic transcriptional disruptions in female skeletal muscle distinct from males. BMC Genomics 24: 374, 2023. doi: 10.1186/s12864-023-09462-7. [DOI] [PMC free article] [PubMed] [Google Scholar]
- 17. VanderVeen BN, Hardee JP, Fix DK, Carson JA. Skeletal muscle function during the progression of cancer cachexia in the male ApcMin/+ mouse. J Appl Physiol (1985) 124: 684–695, 2018. doi: 10.1152/japplphysiol.00897.2017. [DOI] [PMC free article] [PubMed] [Google Scholar]
- 18. Hetzler KL, Hardee JP, Puppa MJ, Narsale AA, Sato S, Davis JM, Carson JA. Sex differences in the relationship of IL-6 signaling to cancer cachexia progression. Biochim Biophys Acta 1852: 816–825, 2015. doi: 10.1016/j.bbadis.2014.12.015. [DOI] [PMC free article] [PubMed] [Google Scholar]
- 19. Rosa-Caldwell ME, Greene NP. Muscle metabolism and atrophy: let's talk about sex. Biol Sex Differ 10: 43–43, 2019. doi: 10.1186/s13293-019-0257-3. [DOI] [PMC free article] [PubMed] [Google Scholar]
- 20. Ballarò R, Lopalco P, Audrito V, Beltrà M, Pin F, Angelini R, Costelli P, Corcelli A, Bonetto A, Szeto HH. Targeting mitochondria by SS-31 ameliorates the whole body energy status in cancer-and chemotherapy-induced cachexia. Cancers 13: 850, 2021. doi: 10.3390/cancers13040850. [DOI] [PMC free article] [PubMed] [Google Scholar]
- 21. Deval C, Calonne J, Coudy-Gandilhon C, Vazeille E, Bechet D, Polge C, Taillandier D, Attaix D, Combaret L. Mitophagy and mitochondria biogenesis are differentially induced in rat skeletal muscles during immobilization and/or remobilization. Int J Mol Sci 21: 3691, 2020. doi: 10.3390/ijms21103691. [DOI] [PMC free article] [PubMed] [Google Scholar]
- 22. Rohm M, Zeigerer A, Machado J, Herzig S. Energy metabolism in cachexia. EMBO Rep 20: e47258, 2019. doi: 10.15252/embr.201847258. [DOI] [PMC free article] [PubMed] [Google Scholar]
- 23. Rosa‐Caldwell ME, Lim S, Haynie WA, Brown JL, Deaver JW, Morena Da Silva F, Jansen LT, Lee DE, Wiggs MP, Washington TA, Greene NP. Female mice may have exacerbated catabolic signalling response compared to male mice during development and progression of disuse atrophy. J Cachexia Sarcopenia Muscle 12: 717–730, 2021. doi: 10.1002/jcsm.12693. [DOI] [PMC free article] [PubMed] [Google Scholar]
- 24. Rosa-Caldwell ME, Lim S, Haynie WS, Jansen LT, Westervelt LC, Amos MG, Washington TA, Greene NP. Altering aspects of mitochondrial quality to improve musculoskeletal outcomes in disuse atrophy. J Appl Physiol (1985) 129: 1290–1303, 2020. doi: 10.1152/japplphysiol.00407.2020. [DOI] [PMC free article] [PubMed] [Google Scholar]
- 25. Zhong X, Narasimhan A, Silverman LM, Young AR, Shahda S, Liu S, Wan J, Liu Y, Koniaris LG, Zimmers TA. Sex specificity of pancreatic cancer cachexia phenotypes, mechanisms, and treatment in mice and humans: role of Activin. J Cachexia Sarcopenia Muscle 13: 2146–2161, 2022. doi: 10.1002/jcsm.12998. [DOI] [PMC free article] [PubMed] [Google Scholar]
- 26. Brown JL, Lee DE, Rosa-Caldwell ME, Brown LA, Perry RA, Haynie WS, Huseman K, Sataranatarajan K, Van Remmen H, Washington TA, Wiggs MP, Greene NP. Protein imbalance in the development of skeletal muscle wasting in tumour-bearing mice. J Cachexia Sarcopenia Muscle 9: 987–1002, 2018. [Erratum in J Cachexia Sarcopenia Muscle 10: 712, 2019]. doi: 10.1002/jcsm.12354. [DOI] [PMC free article] [PubMed] [Google Scholar]
- 27. Blackwell TA, Cervenka I, Khatri B, Brown JL, Rosa-Caldwell ME, Lee DE, Perry RA, Brown LA, Haynie WS, Wiggs MP, Bottje WG, Washington TA, Kong BC, Ruas JL, Greene NP. Transcriptomic analysis of the development of skeletal muscle atrophy in cancer-cachexia in tumor-bearing mice. Physiol Genomics 50: 1071–1082, 2018. doi: 10.1152/physiolgenomics.00061.2018. [DOI] [PMC free article] [PubMed] [Google Scholar]
- 28. Hetzler KL, Hardee JP, LaVoie HA, Murphy EA, Carson JA. Ovarian function’s role during cancer cachexia progression in the female mouse. Am J Physiol Endocrinol Physiol 312: E447–E459, 2017. doi: 10.1152/ajpendo.00294.2016. [DOI] [PMC free article] [PubMed] [Google Scholar]
- 29. Counts BR, Fix DK, Hetzler KL, Carson JA. The effect of estradiol administration on muscle mass loss and cachexia progression in female Apc Min/+ mice. Front Endocrinol (Lausanne) 10: 720, 2019. doi: 10.3389/fendo.2019.00720. [DOI] [PMC free article] [PubMed] [Google Scholar]
- 30. Corbett TH, Griswold DP Jr, Roberts BJ, Peckham JC, Schabel FM Jr.. Tumor induction relationships in development of transplantable cancers of the colon in mice for chemotherapy assays, with a note on carcinogen structure. Cancer Res 35: 2434–2439, 1975. [PubMed] [Google Scholar]
- 31. Bonetto A, Rupert JE, Barreto R, Zimmers TA. The colon-26 carcinoma tumor-bearing mouse as a model for the study of cancer cachexia. JoVE e54893, 2016. doi: 10.3791/54893. [DOI] [PMC free article] [PubMed] [Google Scholar]
- 32. Delfinis LJ, Bellissimo CA, Gandhi S, DiBenedetto SN, Rosa-Caldwell ME, Rahman FA, Wiggs MP, Schlattner U, Quadrilatero J, Greene NP, Perry CGR. Muscle weakness precedes atrophy during cancer cachexia and is associated with muscle-specific mitochondrial stress. JCI Insights 7: e155147, 2022. doi: 10.1172/jci.insight.155147. [DOI] [PMC free article] [PubMed] [Google Scholar]
- 33. Xu H, Crawford D, Hutchinson KR, Youtz DJ, Lucchesi PA, Velten M, McCarthy DO, Wold LE. Myocardial dysfunction in an animal model of cancer cachexia. Life Sci 88: 406–410, 2011. doi: 10.1016/j.lfs.2010.12.010. [DOI] [PMC free article] [PubMed] [Google Scholar]
- 34. Baltgalvis KA, Call JA, Nikas JB, Lowe DA. Effects of prednisolone on skeletal muscle contractility in mdx mice. Muscle Nerve 40: 443–454, 2009. doi: 10.1002/mus.21327. [DOI] [PMC free article] [PubMed] [Google Scholar]
- 35. Call JA, McKeehen JN, Novotny SA, Lowe DA. Progressive resistance voluntary wheel running in the mdx mouse. Muscle Nerve 42: 871–880, 2010. doi: 10.1002/mus.21764. [DOI] [PMC free article] [PubMed] [Google Scholar]
- 36. Nichenko AS, Sorensen JR, Southern WM, Qualls AE, Schifino AG, McFaline-Figueroa J, Blum JE, Tehrani KF, Yin H, Mortensen LJ, Thalacker-Mercer AE, Greising SM, Call JA. Lifelong Ulk1-mediated autophagy deficiency in muscle induces mitochondrial dysfunction and contractile weakness. Int J Mol Sci 22: 1937, 2021. doi: 10.3390/ijms22041937. [DOI] [PMC free article] [PubMed] [Google Scholar]
- 37. Leuchtmann AB, Furrer R, Steurer SA, Schneider-Heieck K, Karrer-Cardel B, Sagot Y, Handschin C. Interleukin-6 potentiates endurance training adaptation and improves functional capacity in old mice. J Cachexia Sarcopenia Muscle 13: 1164–1176, 2022. doi: 10.1002/jcsm.12949. [DOI] [PMC free article] [PubMed] [Google Scholar]
- 38. Gasier HG, Riechman SE, Wiggs MP, Previs SF, Fluckey JD. A comparison of 2H2O and phenylalanine flooding dose to investigate muscle protein synthesis with acute exercise in rats. Am J Physiol Endocrinol Physiol 297: E252–E259, 2009. doi: 10.1152/ajpendo.90872.2008. [DOI] [PMC free article] [PubMed] [Google Scholar]
- 39. Lim S, Deaver JW, Rosa-Caldwell ME, Lee DE, Morena da Silva F, Cabrera AR, Schrems ER, Saling LW, Washington TA, Fluckey JD, Greene NP. Muscle miR-16 deletion results in impaired insulin sensitivity and contractile function in a sex-dependent manner. Am J Physiol Endocrinol Physiol 322: E278–E292, 2022. doi: 10.1152/ajpendo.00333.2021. [DOI] [PMC free article] [PubMed] [Google Scholar]
- 40. Greene NP, Lee DE, Brown JL, Rosa ME, Brown LA, Perry RA, Henry JN, Washington TA. Mitochondrial quality control, promoted by PGC-1α, is dysregulated by Western diet-induced obesity and partially restored by moderate physical activity in mice. Physiol Rep 3: e12470, 2015. doi: 10.14814/phy2.12470. [DOI] [PMC free article] [PubMed] [Google Scholar]
- 41. Min K, Smuder AJ, Kwon O, Kavazis AN, Szeto HH, Powers SK. Mitochondrial-targeted antioxidants attenuate immobilization-induced skeletal muscle atrophy. FASEB J 24: lb670, 2010. doi: 10.1096/fasebj.24.1_supplement.lb670. [DOI] [PMC free article] [PubMed] [Google Scholar]
- 42. Rosa-Caldwell ME, Lim S, Haynie WS, Brown JL, Lee DE, Dunlap KR, Jansen LT, Washington TA, Wiggs MP, Greene NP. Mitochondrial aberrations during the progression of disuse atrophy differentially affect male and female mice. J Cachexia Sarcopenia Muscle 12: 2056–2068, 2021. doi: 10.1002/jcsm.12809. [DOI] [PMC free article] [PubMed] [Google Scholar]
- 43. Baltgalvis KA, Berger FG, Pena MMO, Davis JM, Muga SJ, Carson JA. Interleukin-6 and cachexia in Apc Min/+ mice. Am J Physiol Regul Integr Comp Physiol 294: R393–R401, 2008. doi: 10.1152/ajpregu.00716.2007. [DOI] [PubMed] [Google Scholar]
- 44. Baltgalvis KA, Berger FG, Peña MMO, Davis JM, White JP, Carson JA. Muscle wasting and interleukin-6-induced atrogin-I expression in the cachectic Apc Min/+ mouse. Pflugers Arch 457: 989–1001, 2009. doi: 10.1007/s00424-008-0574-6. [DOI] [PMC free article] [PubMed] [Google Scholar]
- 45. Bonetto A, Aydogdu T, Jin X, Zhang Z, Zhan R, Puzis L, Koniaris LG, Zimmers TA. JAK/STAT3 pathway inhibition blocks skeletal muscle wasting downstream of IL-6 and in experimental cancer cachexia. Am J Physiol Endocrinol Physiol 303: E410–E421, 2012. doi: 10.1152/ajpendo.00039.2012. [DOI] [PMC free article] [PubMed] [Google Scholar]
- 46. Rosa-Caldwell ME, Fix DK, Washington TA, Greene NP. Muscle alterations in the development and progression of cancer-induced muscle atrophy: a review. J Appl Physiol (1985) 128: 25–41, 2020. doi: 10.1152/japplphysiol.00622.2019. [DOI] [PMC free article] [PubMed] [Google Scholar]
- 47. Banh T, Snoke D, Cole RM, Angelotti A, Schnell PM, Belury MA. Higher tumor mass and lower adipose mass are associated with colon-26 adenocarcinoma-induced cachexia in male, female and ovariectomized mice. Oncol Rep 41: 2909–2918, 2019. doi: 10.3892/or.2019.7079. [DOI] [PMC free article] [PubMed] [Google Scholar]
- 48. Aulino P, Berardi E, Cardillo VM, Rizzuto E, Perniconi B, Ramina C, Padula F, Spugnini EP, Baldi A, Faiola F, Adamo S, Coletti D. Molecular, cellular and physiological characterization of the cancer cachexia-inducing C26 colon carcinoma in mouse. BMC Cancer 10: 363, 2010. doi: 10.1186/1471-2407-10-363. [DOI] [PMC free article] [PubMed] [Google Scholar]
- 49. Gorselink M, Vaessen SFC, van der Flier LG, Leenders I, Kegler D, Caldenhoven E, van der Beek E, van Helvoort A. Mass-dependent decline of skeletal muscle function in cancer cachexia. Muscle Nerve 33: 691–693, 2006. doi: 10.1002/mus.20467. [DOI] [PubMed] [Google Scholar]
- 50. Delfinis LJ, Bellissimo CA, Gandhi S, DiBenedetto SN, Garibotti MC, Thuhan AK, Tsitkanou S, Rosa-Caldwell ME, Rahman FA, Cheng AJ. Muscle weakness precedes atrophy during cancer cachexia and is linked to muscle-specific mitochondrial stress. JCI Insight 7: e155147, 2022. doi: 10.1172/jci.insight.155147. [DOI] [PMC free article] [PubMed] [Google Scholar]
- 51. Greenman AC, Albrecht DM, Halberg RB, Diffee GM. Sex differences in skeletal muscle alterations in a model of colorectal cancer. Physiol Rep 8: e14391, 2020. doi: 10.14814/phy2.14391. [DOI] [PMC free article] [PubMed] [Google Scholar]
- 52. Alves CRR, Eichelberger EJ, das Neves W, Ribeiro MAC, Bechara LRG, Voltarelli VA, de Almeida NR, Hagen L, Sharma A, Ferreira JCB, Swoboda KJ, Slupphaug G, Brum PC. Cancer-induced muscle atrophy is determined by intrinsic muscle oxidative capacity. FASEB J 35: e21714, 2021. doi: 10.1096/fj.202100263R. [DOI] [PubMed] [Google Scholar]
- 53. Niu M, Li L, Su Z, Wei L, Pu W, Zhao C, Ding Y, Wazir J, Cao W, Song S, Gao Q, Wang H. An integrative transcriptome study reveals Ddit4/Redd1 as a key regulator of cancer cachexia in rodent models. Cell Death Dis 12: 652–12, 2021. doi: 10.1038/s41419-021-03932-0. [DOI] [PMC free article] [PubMed] [Google Scholar]
- 54. Hain BA, Xu H, Waning DL. Loss of REDD1 prevents chemotherapy-induced muscle atrophy and weakness in mice. J Cachexia Sarcopenia Muscle 12: 1597–1612, 2021. doi: 10.1002/jcsm.12795. [DOI] [PMC free article] [PubMed] [Google Scholar]
- 55. Hain BA, Xu H, VanCleave AM, Gordon BS, Kimball SR, Waning DL. REDD1 deletion attenuates cancer cachexia in mice. J Appl Physiol (1985) 131: 1718–1730, 2021. doi: 10.1152/japplphysiol.00536.2021. [DOI] [PMC free article] [PubMed] [Google Scholar]
- 56. Yuan L, Han J, Meng Q, Xi Q, Zhuang Q, Jiang Y, Han Y, Zhang B, Fang J, Wu G. Muscle-specific E3 ubiquitin ligases are involved in muscle atrophy of cancer cachexia: an in vitro and in vivo study. Oncol Rep 33: 2261–2268, 2015. doi: 10.3892/or.2015.3845. [DOI] [PubMed] [Google Scholar]
- 57. Pinno J, Bongartz H, Klepsch O, Wundrack N, Poli V, Schaper F, Dittrich A. Interleukin-6 influences stress-signalling by reducing the expression of the mTOR-inhibitor REDD1 in a STAT3-dependent manner. Cell Signal 28: 907–916, 2016. doi: 10.1016/j.cellsig.2016.04.004. [DOI] [PubMed] [Google Scholar]
- 58. Puppa MJ, Gao S, Narsale AA, Carson JA. Skeletal muscle glycoprotein 130’s role in Lewis lung carcinoma-induced cachexia. FASEB J 28: 998–1009, 2014. doi: 10.1096/fj.13-240580. [DOI] [PMC free article] [PubMed] [Google Scholar]
- 59. Köhler N, Wundrack N, Schulz S, Bartonitz F, Schaper F, Dittrich A. Non-canonical STAT3 function reduces REDD1 transcription. FEBS J 290: 1765–1781, 2023. doi: 10.1111/febs.16679. [DOI] [PubMed] [Google Scholar]
- 60. Romanello V, Sandri M. The connection between the dynamic remodeling of the mitochondrial network and the regulation of muscle mass. Cell Mol Life Sci 78: 1305–1328, 2021. doi: 10.1007/s00018-020-03662-0. [DOI] [PMC free article] [PubMed] [Google Scholar]
- 61. Romanello V, Scalabrin M, Albiero M, Blaauw B, Scorrano L, Sandri M. Inhibition of the fission machinery mitigates OPA1 impairment in adult skeletal muscles. Cells 8: 597, 2019. doi: 10.3390/cells8060597. [DOI] [PMC free article] [PubMed] [Google Scholar]
- 62. Varanita T, Soriano ME, Romanello V, Zaglia T, Quintana-Cabrera R, Semenzato M, Menabò R, Costa V, Civiletto G, Pesce P, Viscomi C, Zeviani M, Di Lisa F, Mongillo M, Sandri M, Scorrano L. The OPA1-dependent mitochondrial cristae remodeling pathway controls atrophic, apoptotic, and ischemic tissue damage. Cell Metab 21: 834–844, 2015. doi: 10.1016/j.cmet.2015.05.007. [DOI] [PMC free article] [PubMed] [Google Scholar]
- 63. Szabo A, Sumegi K, Fekete K, Hocsak E, Debreceni B, Setalo G, Kovacs K, Deres L, Kengyel A, Kovacs D, Mandl J, Nyitrai M, Febbraio MA, Gallyas F, Sumegi B. Activation of mitochondrial fusion provides a new treatment for mitochondria-related diseases. Biochem Pharmacol 150: 86–96, 2018. doi: 10.1016/j.bcp.2018.01.038. [DOI] [PubMed] [Google Scholar]
- 64. Penna F, Ballarò R, Martinez-Cristobal P, Sala D, Sebastian D, Busquets S, Muscaritoli M, Argilés JM, Costelli P, Zorzano A. Autophagy exacerbates muscle wasting in cancer cachexia and impairs mitochondrial function. J Mol Biol 431: 2674–2686, 2019. doi: 10.1016/j.jmb.2019.05.032. [DOI] [PubMed] [Google Scholar]
Associated Data
This section collects any data citations, data availability statements, or supplementary materials included in this article.
Supplementary Materials
Supplemental Table S1: https://doi.org/10.6084/m9.figshare.23621094;
Supplemental File S1: https://doi.org/10.6084/m9.figshare.22331191;
Supplemental Fig. S1: https://doi.org/10.6084/m9.figshare.22331203;
Supplemental Fig. S2: https://doi.org/10.6084/m9.figshare.22331206;
Supplemental Fig. S3: https://doi.org/10.6084/m9.figshare.22331212;
Supplemental Fig. S4: https://doi.org/10.6084/m9.figshare.22331221;
Supplemental Fig. S5: https://doi.org/10.6084/m9.figshare.22331224.
Data Availability Statement
Data will be made available upon reasonable request.