Abstract
For the capture of CO2 from mixed gas streams, materials for increased gas exchange are necessary. Efficient gas exchange systems already exist in the form of vascularized lung-tissue. Herein we report a fabrication technique for the synthesis of three-dimensional microvascular gas exchange units capable of removing CO2 from flowing gas created using the recently reported Vaporization of a Sacrificial Component (VaSC) technique. We demonstrate the spatiotemporal pattern of CO2 reactivity in the microvascular gas exchange unit using colorimetric, pH sensitive dyes. Control over three-dimensional placement of channels is shown to increase capture efficiencies. A computational finite element model validates and explains the experimental observations.
Introduction
Carbon capture and sequestration (CCS) technologies are receiving considerable attention as a means of reducing CO2 emissions. Increasing the exchange of CO2 from mixed gas streams with low energy requirements remains a challenge. A number of different solutions have emerged to address this problem including hollow-fiber membrane contactors, metal–organic frameworks, solid sorbents, and an array of liquid capture agents.1–7 Several issues arise with these systems including the 3D positioning of reactants, need for pressurizing the system, and use of scarce elements. Highly efficient methods for gas exchange already exist in natural systems.8 The vascularization of lung-tissue creates three dimensional solid/liquid composites with high surface areas, continuous flow, and intimate optimized contact between gasses and capture fluids. This natural design motif inspired us to apply the principles of natural systems to carbon capture. Using conventional top-down lithographic techniques, it would be difficult to replicate the lung’s 3D microstructure. Here we show a new 3D microfabrication technique based on the Vaporization of a Sacrificial Component (VaSC) technique to create a bio-inspired 3D microvascular gas exchange unit capable of carbon dioxide capture that operates over a range of pressures.
In this study, we have constructed both two and three-dimensional microvascular exchange units using the VaSC technique and demonstrated increased capture rates of 3D structures composed of hollow cylindrical channels. We were able to vary numerous geometrical parameters including surface area, channel separation, and channel patterning through this technique.9 Furthermore, we developed a computational finite element model to validate and explain our observed data.10 In order to visualize the reactivity of CO2 in our structures, pH-sensitive dyes were included, allowing us to observe the spatiotemporal pattern of CO2 reacting within a micro channel. Finally, we show that our microvascular exchange units are capable of removing CO2 from streams of lower concentration, containing only 10 vol% CO2 (balance N2).
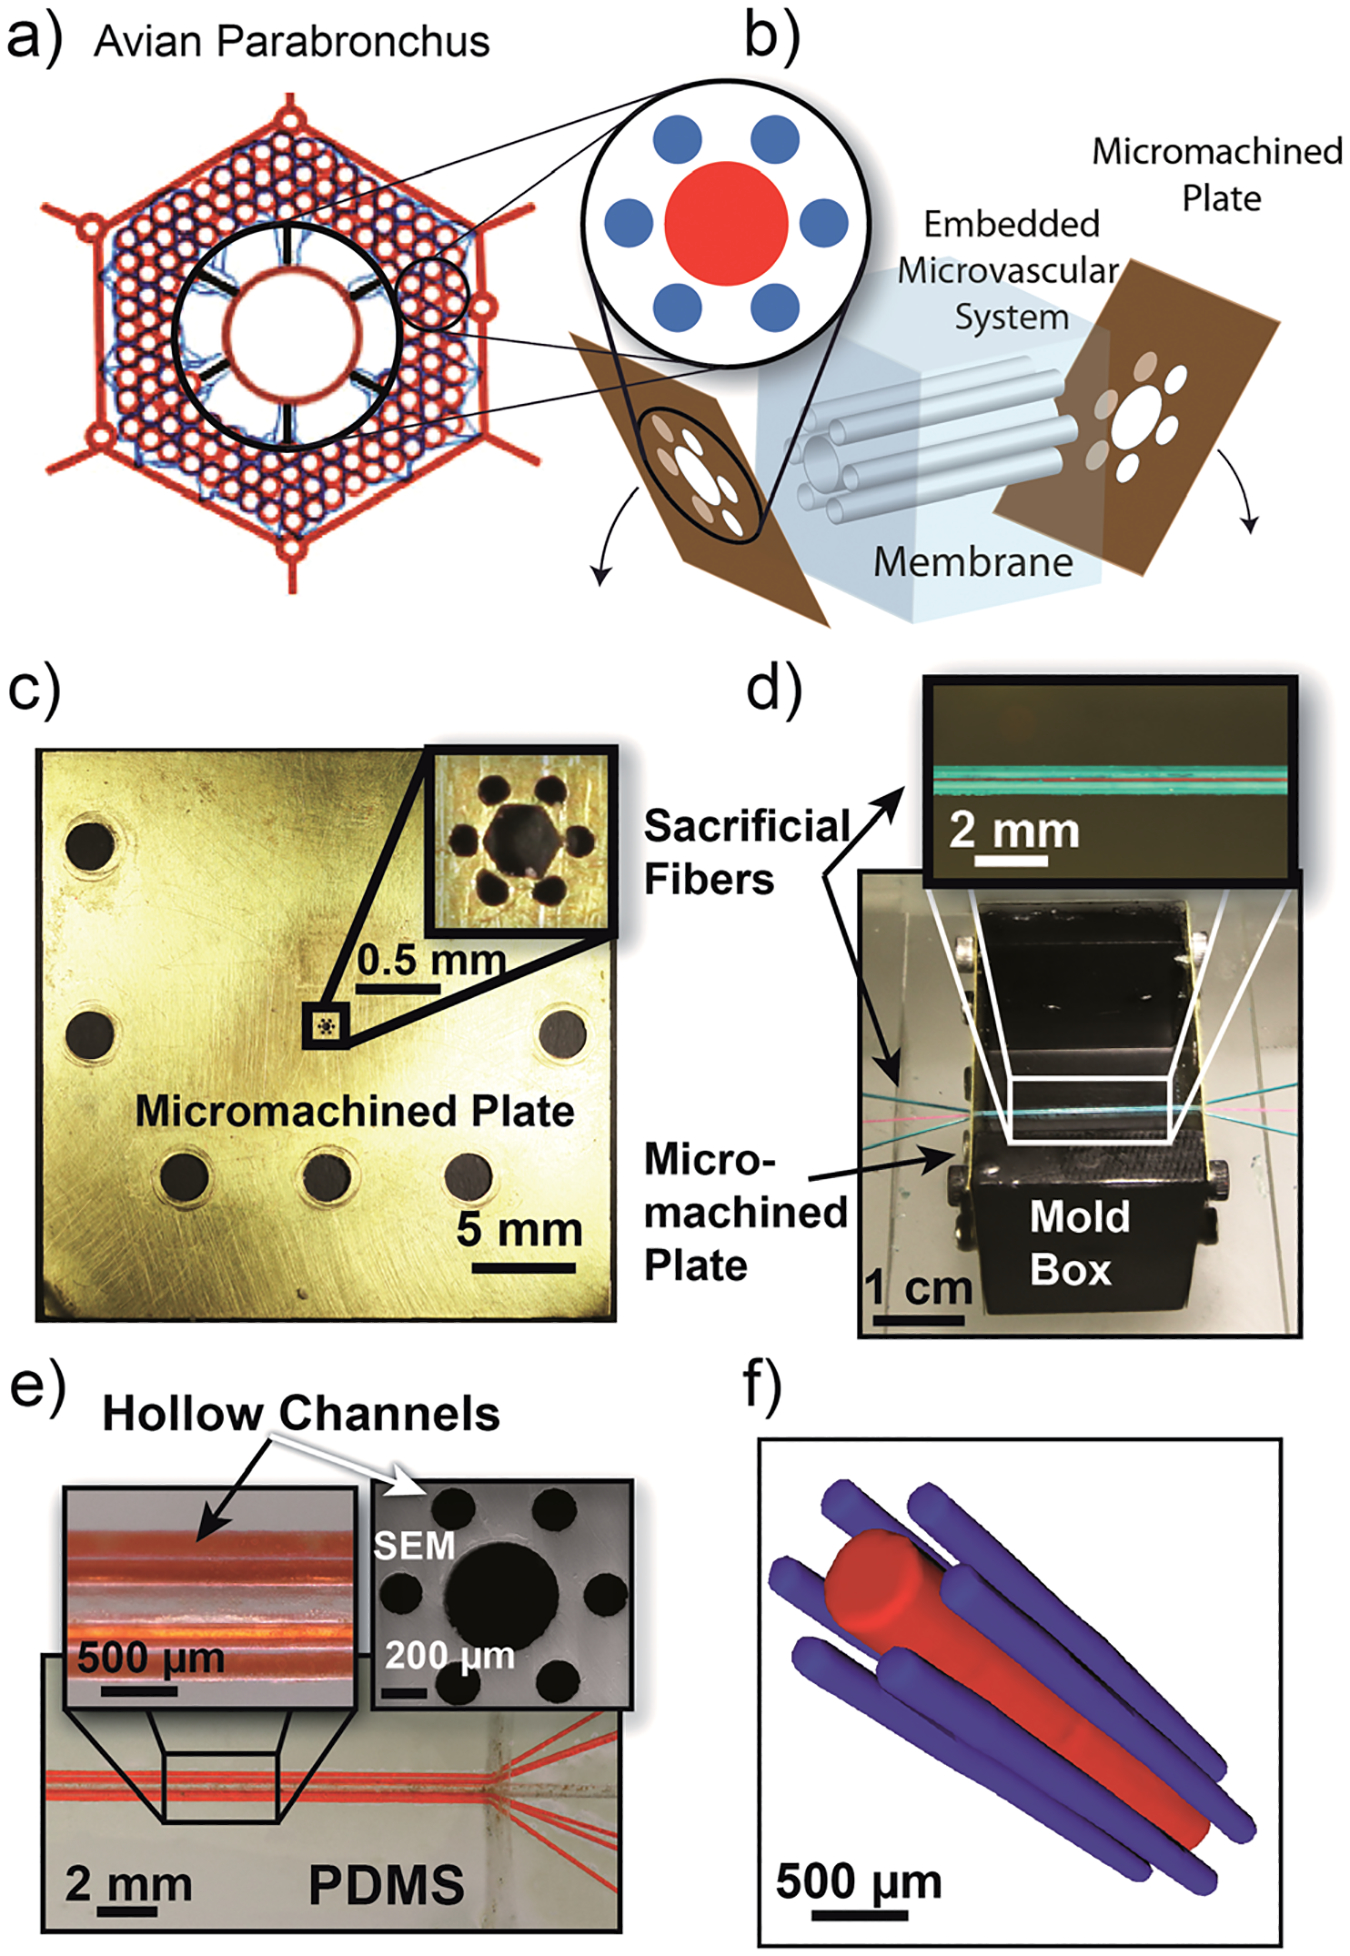
In looking to natural designs, the avian lung provides an excellent starting point as it has one of the most efficient gas-exchange-to-weight ratios owing to its use in flight. A bird’s lung captures gas using a unidirectional flow, making it well suited for capturing CO2 from point source emissions.11 The avian parabronchus is composed of a hierarchical array of hexagonally patterned vascular units allowing for both structural stability and high rates of gas exchange (Fig. 1a).12 We sought to mimic this structural feature in our designs by creating hexagonally patterned microvascular exchange units (Fig. 1b).
Fig. 1.

Inspiration, development, and synthesis of 3D microvascular exchange unit. a) Anatomic schematic of avian parabronchi hexagonal airflow passages. Gas exchange occurs with unidirectional flow through a hierarchical array of hexagonal units composed of air and blood capillaries. b) Synthetic method for creating parabronchus-like capture units using VaSC. Channels are arranged in a hexagonal pattern via laser micromachined end-caps. c) A laser etched micromachined end-cap used for fiber patterning. d) Sacrificial fibers patterned with micromachined end-caps. Identical plates are on either side of a mold box which is then filled with PDMS. e) A representative sample composed of hexagonally arranged channels (outer channels are filled with orange dye for visual clarity) inset with a cross-sectional SEM image. The PDMS sample shown is composed of a 500 μm central channel, 200 μm outer channels, and 50 μm separations. f) Representative mCT image of a 3D microvascular gas exchange unit with 200 μm outer channels, a 500 μm central channel, and 50 μm separations. Image is of channels filled with liquid gallium. The matrix (PDMS) was excluded for clarity.
Experimental
Each structural unit was created using VaSC. This recently reported fabrication process allows for the scalable construction of patterned microchannels utilizing macroscale techniques with unprecedented control over three dimensional positioning of channels. The process begins with the patterning of sacrificial fibers. The position, length, diameter, and relative orientation of the fibers can be varied to meet design criteria. The space between the fibers is then filled with a low-viscosity thermosetting resin and cured. Poly(lactic) acid (PLA) fibers are currently used owing to their mechanical durability and ability to depolymerize at 200 °C. While PLA normally depolymerizes above 280 °C, this temperature is lowered by infusing the fibers with a tin oxalate (SnOx) catalyst. Once incorporated into the resin, the fibers are removed by heating the system above 200 °C while under vacuum. The result is hollow patterns that are inverse replicas of the original fiber patterns.
To create a single microvascular exchange unit, the sacrificial fibers were strung through patterns created by laser-etched micromachined brass plates containing a hexagonal pattern (Fig. 1c,d). Two brass plates were used as end caps and attached to a central box. The box was then filled with polydimethylsiloxane (PDMS). PDMS was selected as the initial resin material because of its high CO2 permeability (3800 Barrer) and selectivity for CO2 (9.5 CO2/N2) as well as its optical transparency.13 While it is possible that MEA can permeate through the membrane, it does not appear to permeate on the time scale of the experiments. A second stage of PDMS molding is then performed with a larger mold box to spread the hexagonal pattern, allowing for easier loading of channels (Supporting Information, section II). The sacrificial fibers were removed via VaSC leaving a hexagonal pattern of channels within the mold and a PDMS membrane in the inter-channel regions (Fig. 1e). The microvascular structures were confirmed by both cross-sectional scanning electron microscopy (SEM) and X-ray computed tomography (μCT) imaging techniques (Fig. 1e and 1f) (Supporting Information, section I). While there are minor imperfections in the channels, the membrane is nonporous on the order of microns. Utilizing this process, a number of samples were constructed to examine the effect of different geometric parameters including channel width, separation, and number of surrounding channels on the exchange abilities of a single microvascular unit.
Results and discussion
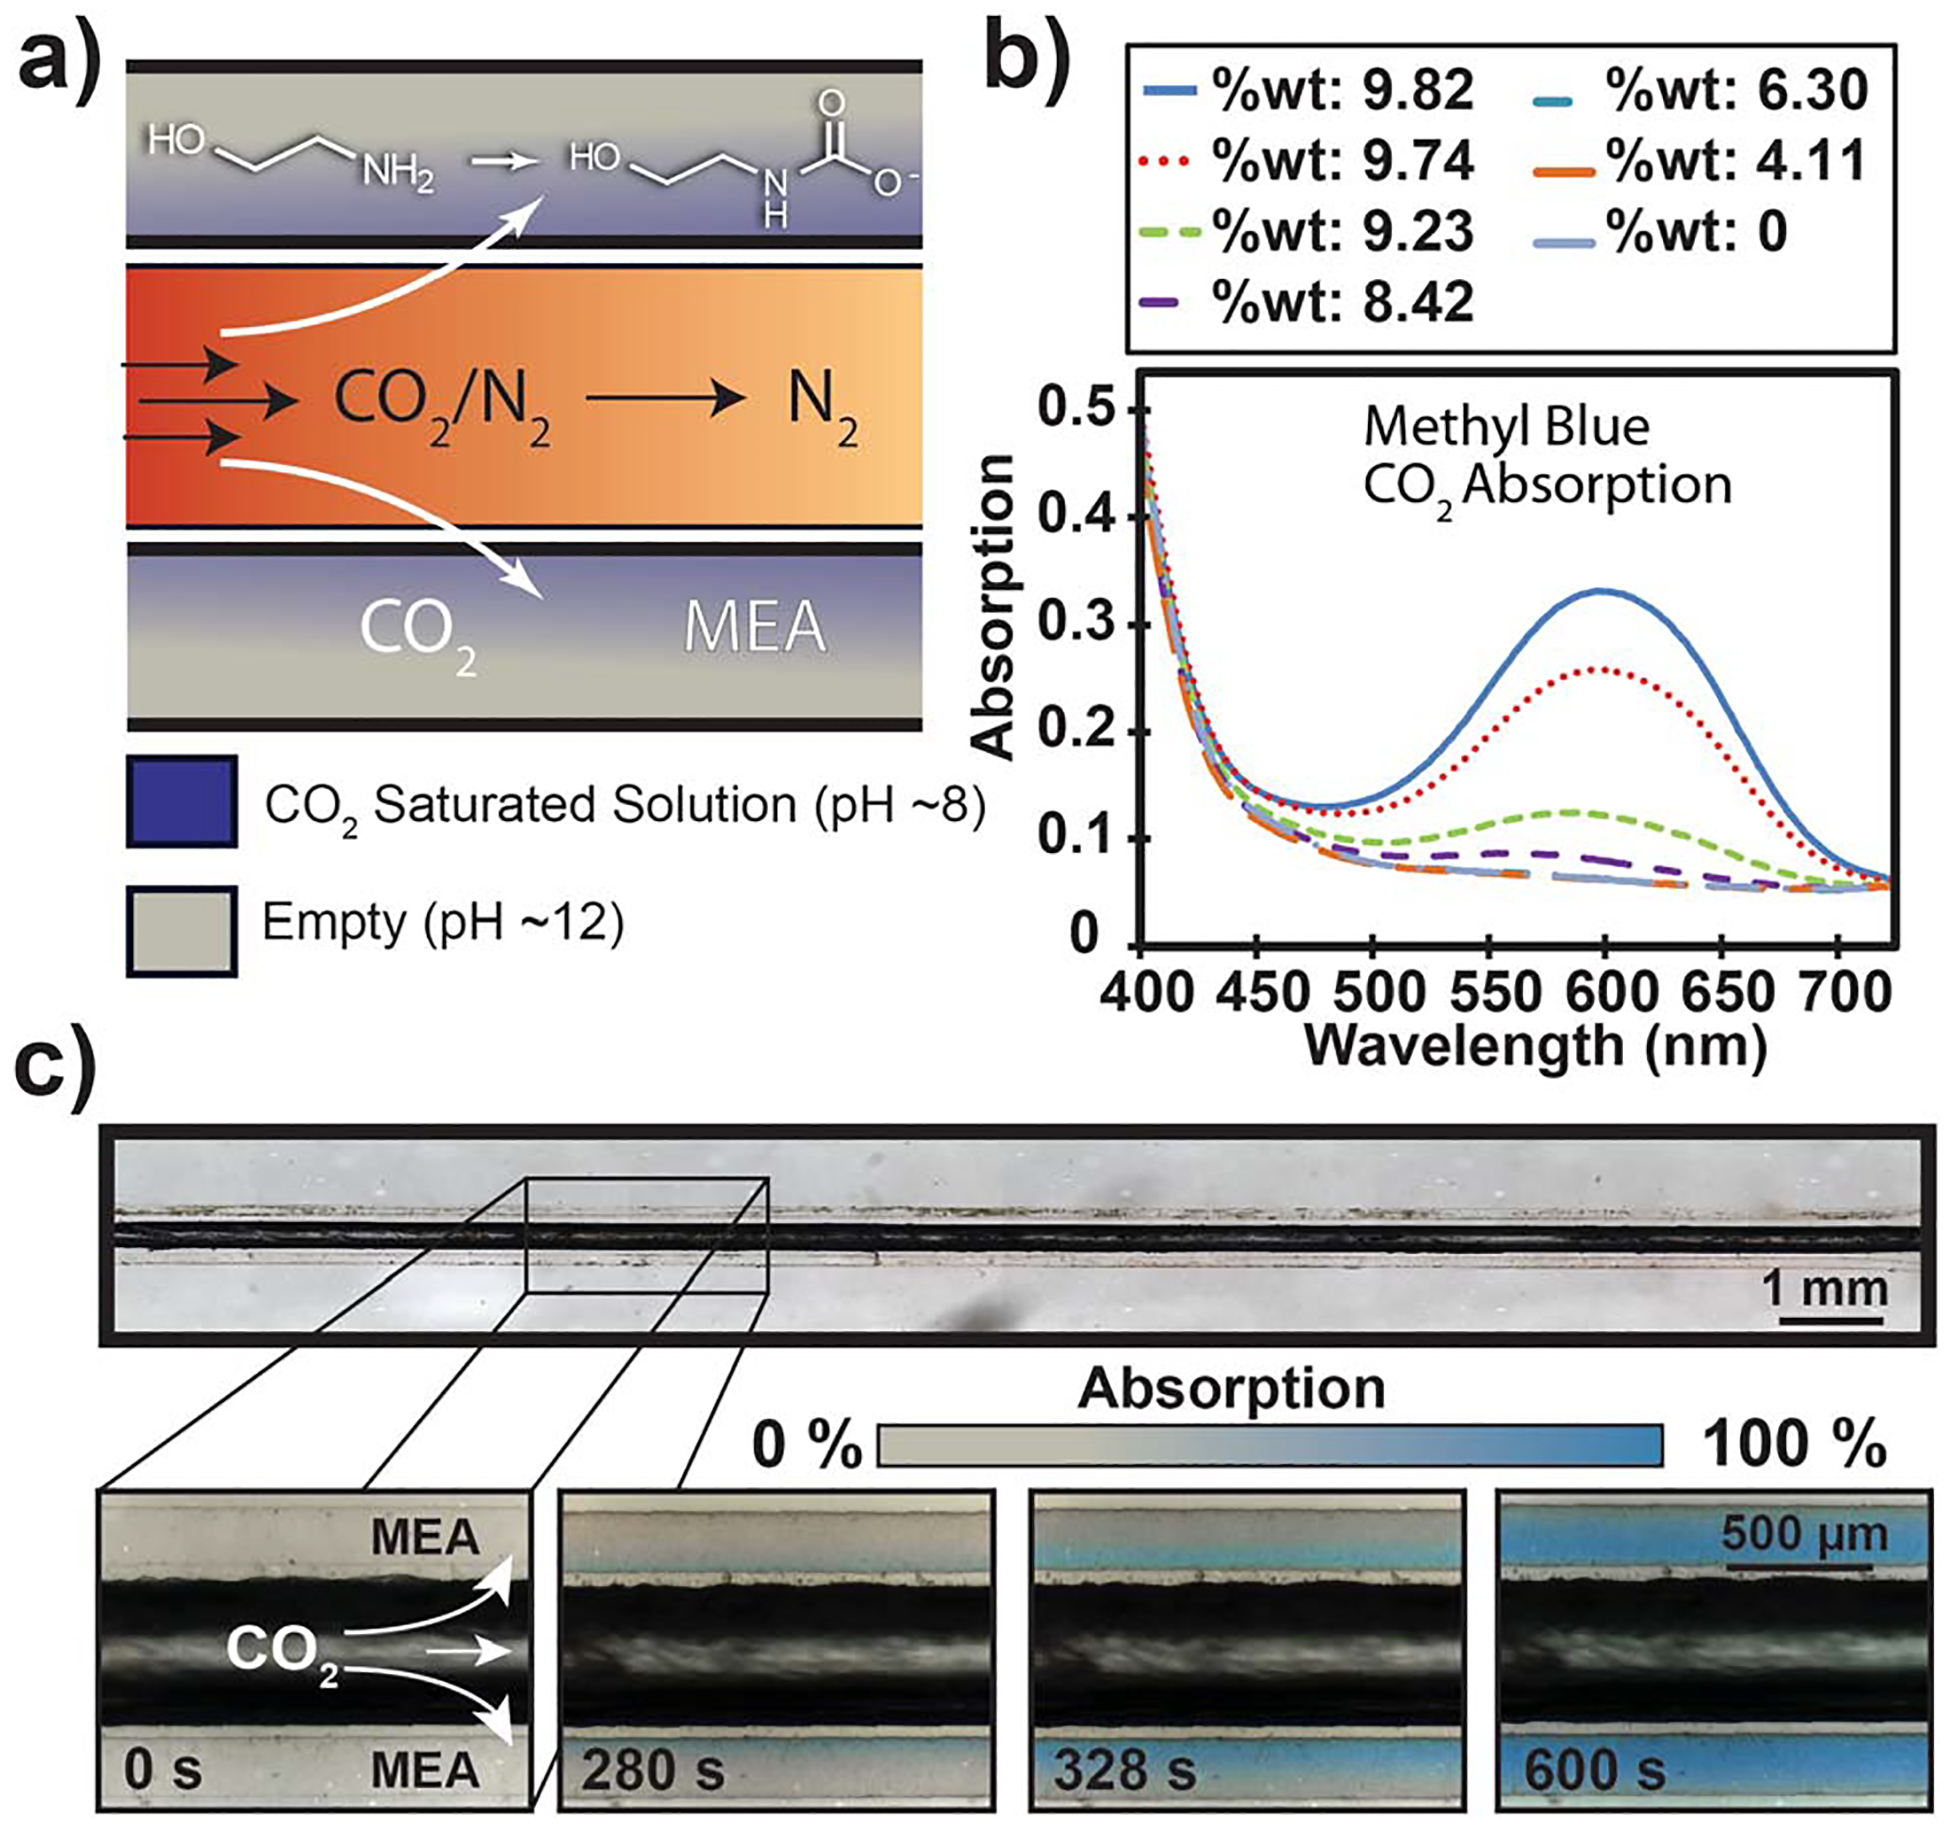
For the initial ‘blood’ of the system, a 30/70 wt/wt% mono-ethanolamine (MEA)/water solution was selected, as it is the current industrial standard for CO2 scrubbing.14 For all experiments, MEA was loaded into the channels and remained stationary in the outer, flanking channels while CO2 flowed through the central channel at a rate of 0.1 L min−1 (Fig. 2a). The reaction of CO2 with MEA was indirectly visualized by adding methyl blue (Poirriers blue), a pH sensitive dye, to the MEA solution. As MEA reacted with CO2 forming a carbamic acid, the solution underwent a pH shift (from ~12 to ~8) resulting in the color of the fluid changing from clear to blue (light yellow to blue in bulk) (Fig. 2b).15 The measured saturation weight of 9.82% matches stoichiometrically with a MEA loading ratio of 0.5 mol CO2/mol MEA. The pH of the solutions in the channels, and therefore the time to reach saturation, could then be measured optically with a microscope while exposed to CO2. A unique spatiotemporal absorption pattern of CO2 into the MEA solution was observed and measured (Fig. 2c). A clear pattern of the carbamic acid formation radiating from the inner to outer channel edge of the flanking channels was observed. We confirmed the color shift of MEA solutions by measuring the wt % of CO2 in the solution followed by taking a UV-Vis spectrum of the solution, quantifying the degree of color change. Phenolphthalein (shift red-to-clear) was also used to visualize CO2 absorption (Supporting Information, section IV).16
Fig. 2.

Experimental capture process and visualization of CO2 reactivity. a) Schematic of the overall reaction taking place as CO2 permeates through the membrane and reacts with MEA. b) UV-Vis spectrum of MEA with indicating dye over absorption range of 0–10% weight of CO2 in solution measured by weight gain with an analytic balance. c) Time-lapsed visualization of capture process with sample consisting of a 500 μm central channel, 200 μm flanking channels, and 50 μm separations. The dye in MEA shifts from clear yellow to blue as CO2 is absorbed due to the pH change. When absorption has reached 100%, MEA in solution has fully saturated with CO2 at ~10 wt%. A clear spatiotemporal pattern moving through the channel radiating from the central CO2 source is exhibited.
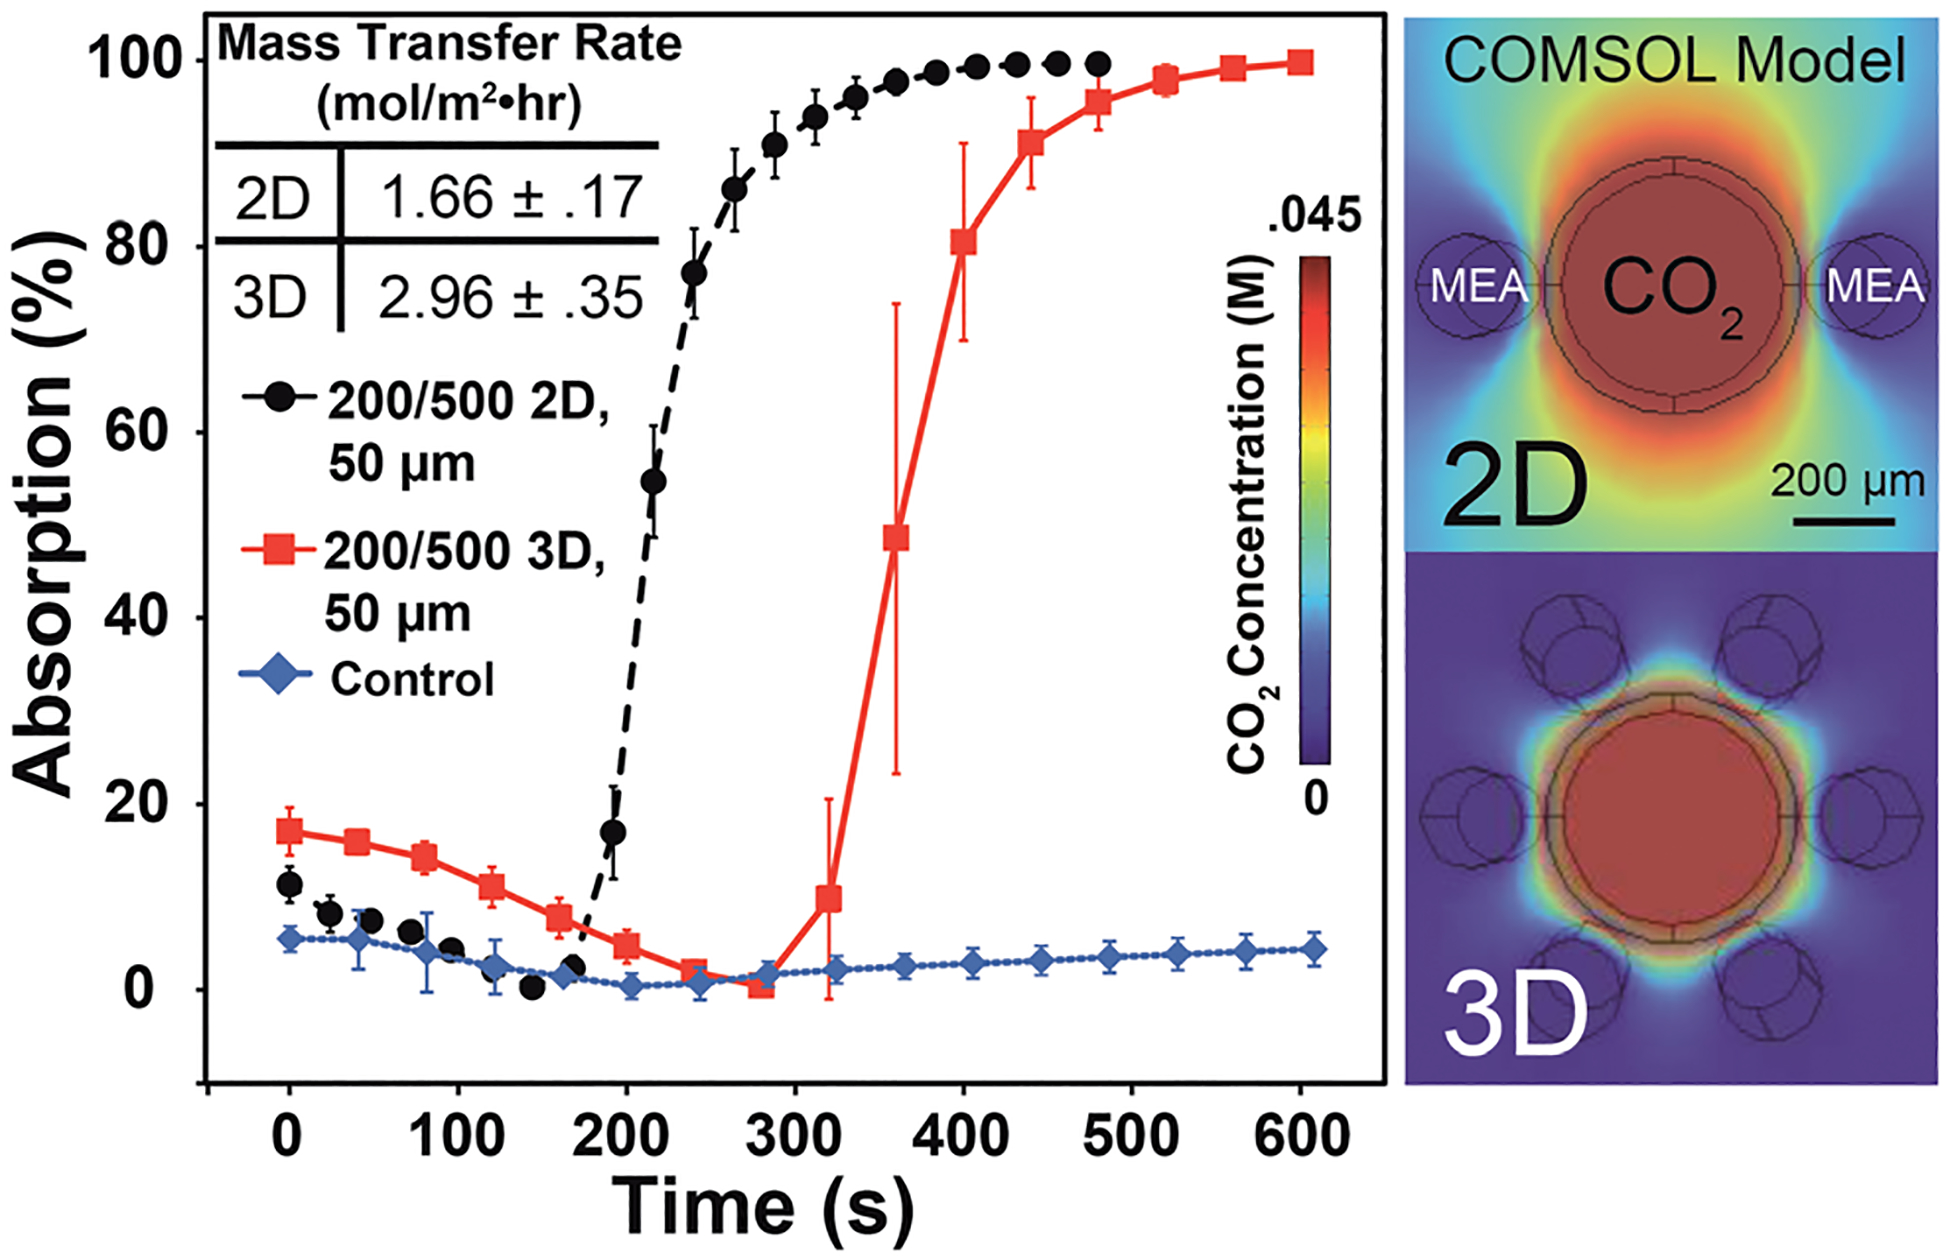
Next, we explored the influence of channel geometry on absorption efficiency and gas exchange. Gas exchange devices have been constructed in PDMS using 2D photo-lithographic and machining techniques.17,18 The avian lung utilizes a hexagonal geometry of channel placement thereby providing a third dimension to transport phenomenon. Interested in seeing how 2D and 3D patterns would compare, we examined two geometric patterns: a central channel with two flanking channels (2D) and a central channel surrounded by a hexagonal arrangement of channels (3D). The central channel had a diameter of 500 μm while the flanking channels had a diameter of 200 μm with an interchannel separation of 50 μm and 100% CO2 flowing through the central channel. The VaSC procedure allows for channel sizes below 100 μm and separations under 20 μm for future optimizations. This single-unit prototype pattern was calculated to have a specific surface area of 2418 m2 m−3 which enters the upper range of membrane contactors.19 Hypothetically, expanding the pattern into a larger hierarchy similar to the parabronchus can increase the specific surface area to 2834 m2 m−3. From our observations, the 3D pattern took longer to reach saturation than the 2D, but had a greater overall rate of absorption due to the increased number of channels (Fig. 3). Our computer model was able to explain this discrepancy by showing that the 2D structure had CO2 moving through the PDMS in the vertical direction, allowing for more contact with the absorbing side channels. This blooming effect may go unnoticed in a fully two dimensional structure and certainly results in loss of potential gas exchange. In contrast, the model showed that each channel in the 3D pattern had access to less overall gas, but was much more efficient at absorbing the total transmitted gas. This matched our observed experiments and highlighted the importance of three-dimensional geometric parameters on overall gas exchange efficiency.
Fig. 3.

Comparison of 2D and 3D pattern absorption using a 500 μm central channel, 200 μm flanking channels, 50 μm channel separation, and 100% CO2. Inset are average capture rates calculated using channel volume with saturation time and the COMSOL® visualization of CO2 concentrations in the systems. The blooming of CO2 in the vertical direction for the 2D unit results in a quicker saturation time. Capture rates are averaged from 80% absorption time, indicating a weight increase of ~10% due to absorbed CO2. Control run used the 2D 200/500, 50 μm pattern with no gas flow.
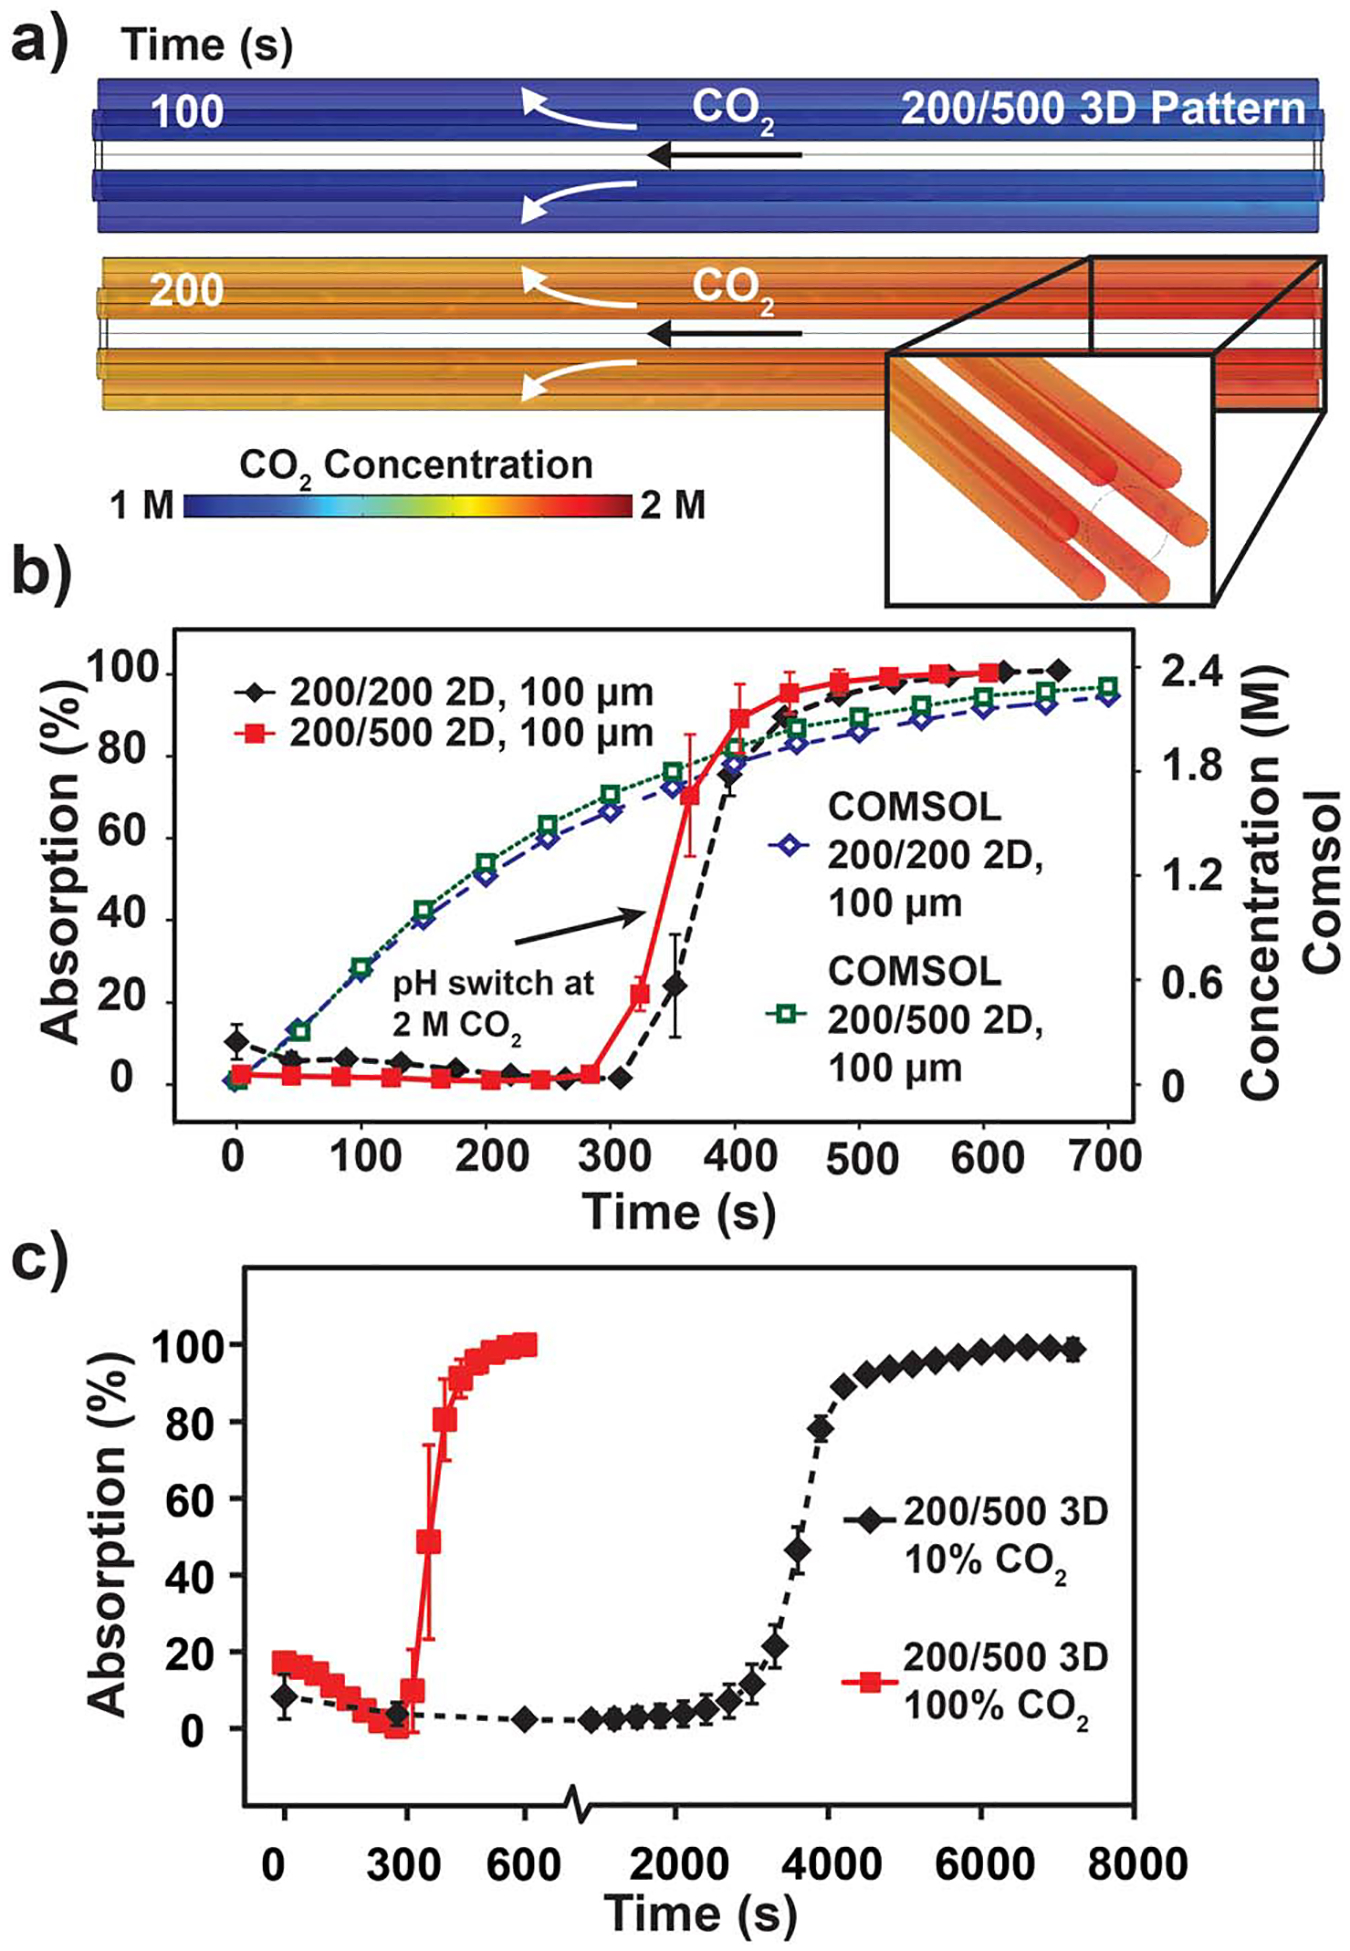
Our computer model of each microvascular exchange unit was built using COMSOL® Multiphysics simulation software which utilizes a finite element system. To create the model, several assumptions were used (Supporting Information, section V). Velocity driven laminar flow determined the flow of fluids in the model.20 A diffusion coefficient of 7.08 e–10 m2 s−1 was used for CO2 in PDMS to determine the transport properties of the model. Diffusion coefficients of CO2 taken from literature in air and water were used for the central and flanking channels respectively.21–23 The reaction rate of CO2 with MEA was approximated using a 1st order reaction and calculated as R = 6550*[MEA] where R is the rate in mol m−3 s−1 using literature values.24–27 The model confirmed the same patterns that were present in the experiments. Additionally, similar saturation concentrations and rates were found as those determined experimentally. The model also captured the visualization of CO2 concentration in all domains. This visualization demonstrated the blooming effect in the 2D pattern and explained the discrepancy in saturation time between the 2D and 3D patterns (Fig. 4a).
Fig. 4.

a) Time-lapsed model of CO2 concentration from 3D pattern using 500 μm central channel, 200 μm flanking channels, 50 μm channel separation, and 100% CO2. b) Saturation data for 100 μm inter-channel distances with 200 and 500 μm central channel diameters with model comparison.31 c) Comparison between 100% and 10% CO2 saturation rates using a 500 μm central channel, 200 μm flanking channels, and 50 μm channel separation. Saturation time increases by roughly a factor of 10 using 10% CO2 (balance N2) compared to 100% CO2.
As the relationship between 2D and 3D channel positioning had been established, the effects of channel diameter and membrane thickness were examined using 2D exchange units. Two additional units were created: a 2D pattern with a central channel of 500 μm and flanking channels of 200 μm diameters separated by inter-channel distances of 100 μm and a 2D pattern with a 200 μm diameter for each channel separated by 100 μm. In comparison to the 200/500 2D, 50 μm sample, the 200/500 2D, 100 μm sample demonstrated a clear increase in saturation time (Fig. 3, Fig. 4b-red). Unsurprisingly, due to the larger separation, it took more time for CO2 to move through the membrane. This result suggests that decreasing the inter-channel distance will lead to an acceleration of CO2 absorption. Intriguingly, when the diameter of the central channel was decreased to 200 μm and the inter-channel distance remained the same, it resulted in no significant changes in saturation time (Fig. 4b-black). The equality of gas exchange with the change in size indicates that future exchange units can be made smaller, creating a higher specific surface area. For this experiment, the observed data were graphed alongside the model simulation (Fig. 4b-blue/green). In the experimental data, there is an s-shaped curve due to the methyl blue pH indication switching on at ~9 wt% CO2 (2 M CO2 reacted). The time to reach this concentration using the model has excellent agreement with the data. Utilizing the variable nature of the VaSC process, future microvascular capture units can be made with smaller central channel diameters to decrease the size of the overall footprint of each individual unit.
While 100% CO2 was used to characterize the geometric parameters, it was important to confirm that the system can be used in conditions with lower concentrations of CO2. 10 vol% CO2 (balance N2) was flowed through the central channel and saturation measurements were made using phenolphthalein. While industrial flue gas has concentrations slightly higher than 10% and contains contaminants including H2O, O2, and SOx, utilizing 10 vol% CO2 serves as an initial step towards simulating a flue stream. Using the 3D structure with a 500 μm central channel and 50 μm channel separation, it was observed that the saturation time increased by roughly a factor of 10 using 10 vol% CO2 (Fig. 4c). From the time to reach 50% absorption, it was calculated that the mass transfer rate was 0.33 ± 0.04 mol m−2 hr−1. While this rate is lower when compared to hollow fiber membrane contactor rates of ~2 mol m−2 hr−1, it is important to note that the rates for the contactors include flowing MEA, as well as slightly higher concentrations of CO2 (14%).28
Conclusions
In conclusion, we have demonstrated a bio-mimetic gas exchange unit created via a new 3D microchannel fabrication technique using the recently reported VaSC technique. With this synthetic method, we can control geometric parameters of a carbon capturing gas exchange unit in all three dimensions. We have shown that control of 3D position can drastically increase capture efficiency. Looking towards the future, the VaSC method is amenable to different materials and capture fluids. We anticipate further development of this approach will utilize optimized combinations of gas exchange units, membrane polymer, capture fluid and hierarchical geometry.29,30 Future synthetic parabronchi and alveoli may also be used for oxygen exchange in breath-assisting devices. Concurrently demonstrated is a colorimetric method for the spatiotemporal mapping of CO2 reactivity in microchannels and the observation that reactivity is directional and dependent on membrane thickness. This may aid in understanding this important reaction and allow optimization of our 3D exchange unit, while also assisting in the design of future hollow-fiber membrane contactor systems. Natural systems have much to show us in terms of gas exchange, and we expect further developments in this area.
Supplementary Material
Acknowledgements
The authors would like to acknowledge Lalisa Stutts and Dan Tao for helpful discussion relating to this project. The authors thank Jian-Guo Zheng and Wytze Van Der Veer for use of the Calit2 Microscopy Center and Laser Spectroscopy Facility at the University of California, Irvine. Sabra Djomehri is acknowledged for assistance with mCT imaging. Hodge Harland and the UCI Physical Sciences Machine Shop are acknowledged for the fabrication of tools. The poly(lactic) acid fibers were generously provided by Teijin Monofilament. AEK acknowledges the AFOSR for a Young Investigator Award.
Footnotes
Electronic supplementary information (ESI) available: Details on sample fabrication, spatiotemporal saturation data, UV-Vis, COMSOL model construction, capture rate calculations and experimental section. See DOI: 10.1039/c2lc00033d
References
- 1.Fehder, Quantitative carbon dioxide detector. U.S. Patent 4 994 117, February 19, 1991.
- 2.Britt D, Furukawa H, Wang B, Glover TG and Yaghi OM, Proc. Natl. Acad. Sci. U. S. A, 2009, 106, 20637–20640. [DOI] [PMC free article] [PubMed] [Google Scholar]
- 3.Li H, Eddaoudi M, O’Keeffe M and Yaghi OM, Nature, 1999, 402, 276–279. [Google Scholar]
- 4.Millward AR and Yaghi OM, J. Am. Chem. Soc, 2005, 127, 17998–17999. [DOI] [PubMed] [Google Scholar]
- 5.Fehder, Carbon dioxide indicator device. U.S. Patent 4 728 499, March 1, 1988.
- 6.Lively RP, Chance RR, Kelley BT, Deckman HW, Drese JH, Jones CW and Koros W, Ind. Eng. Chem. Res, 2009, 48, 7314–7324. [Google Scholar]
- 7.Figueroa JD, Fout T, Plasynski S, McIlvried H and Srivastava RD, Int. J. Greenhouse Gas Control, 2008, 2, 9–20. [Google Scholar]
- 8.Olah GA, Prakash GKS and Goeppert A, J. Am. Chem. Soc, 2011, 133, 12881–12898. [DOI] [PubMed] [Google Scholar]
- 9.Esser-Kahn AP, Thakre PR, Dong H, Patrick JF, Vlasko-Vlasov VK, Sottos NR, Moore JS and White SR, Adv. Mater, 2011, 23, 3654–3658. [DOI] [PubMed] [Google Scholar]
- 10.Multiphysics Modeling and Simulation Software – COMSOL, 2011, http://www.comsol.com/.
- 11.Makanya AN and Djonov V, J. Appl. Physiol, 2009, 106, 1959–1969. [DOI] [PubMed] [Google Scholar]
- 12.Maina JN, Jimoh SA and Hosie M, J. Anat, 2010, 217, 597–608. [DOI] [PMC free article] [PubMed] [Google Scholar]
- 13.Reijerkerk SR, Knoef MH, Nijmeijer K and Wessling M, J. Membr. Sci, 2010, 352, 126–135. [Google Scholar]
- 14.Danckwerts PV, Chem. Eng. Sci, 1979, 34, 443–446. [Google Scholar]
- 15.Sabnis RW Handbook of acid–base indicators; CRC Press, 2007. [Google Scholar]
- 16.Penny DE and Ritter T, J. Chem. Soc., Faraday Trans. 1, 1983, 79, 2103. [Google Scholar]
- 17.Yuen PK and DeRosa ME, Lab Chip, 2011, 11, 3249–3255. [DOI] [PubMed] [Google Scholar]
- 18.Potkay JA, Magnetta M, Vinson A and Cmolik B, Lab Chip, 2011, 11, 2901–2909. [DOI] [PubMed] [Google Scholar]
- 19.Kumar PS, Hogendoorn JA, Feron PHM and Versteeg GF, Chem. Eng. Sci, 2002, 57, 1639–1651. [Google Scholar]
- 20.Batchelor G, An introduction to fluid dynamics; 1. Cambridge Math. Library ed, 11th print. ed. Cambridge Univ. Press, Cambridge, 2009. [Google Scholar]
- 21.Webb K, Fluid Phase Equilib, 1999, 158–160, 1029–1034. [Google Scholar]
- 22.Merkel TC, Bondar VI, Nagai K, Freeman BD and Pinnau I, J. Polym. Sci., Part B: Polym. Phys, 2000, 38, 415–434. [Google Scholar]
- 23.Versteeg GF, Blauwhoff PMM and van Swaaij WPM, Chem. Eng. Sci, 1987, 42, 1103–1119. [Google Scholar]
- 24.Maceiras R, Álvarez E and Cancela MÁ, Chem. Eng. J, 2008, 138, 295–300. [Google Scholar]
- 25.Plaza JM, Wagener DV and Rochelle GT, Energy Proc, 2009, 1, 1171–1178. [Google Scholar]
- 26.Blauwhoff PMM, Versteeg GF and Van Swaaij WPM, Chem. Eng. Sci, 1983, 38, 1411–1429. [Google Scholar]
- 27.Sakwattanapong R, Aroonwilas A and Veawab A, Energy Proc, 2009, 1, 217–224. [Google Scholar]
- 28.ping Yan S, Fang M-X, Zhang W-F, Wang S-Y, Xu Z-K, Luo Z-Y and Cen K-F, Fuel Process. Technol, 2007, 88, 501–511. [Google Scholar]
- 29.Hicks JC, Drese JH, Fauth DJ, Gray ML, Qi G and Jones CW, J. Am. Chem. Soc, 2008, 130, 2902–2903. [DOI] [PubMed] [Google Scholar]
- 30.D’Alessandro DM, Smit B and Long JR, Angew. Chem., Int. Ed, 2010, 49, 6058–6082. [DOI] [PubMed] [Google Scholar]
- 31. Experimental data has a rapid absorption switch due to pH indicating dye rapidly shifting color.
Associated Data
This section collects any data citations, data availability statements, or supplementary materials included in this article.


