


Keywords: American ginseng, AOM/DSS model, falcarinol, macrophages, natural compounds
Abstract
Currently available colorectal cancer (CRC) therapies have limited efficacy and severe adverse effects that may be overcome with the alternative use of natural compounds. We previously reported that panaxynol (PA), a bioactive component in American ginseng, possesses anticancer properties in vitro and suppresses murine colitis through its proapoptotic and anti-inflammatory properties. Because colitis is a predisposing factor of CRC and inflammation is a major driver of CRC, we sought to evaluate the therapeutic potential of PA in CRC. Azoxymethane-dextran sodium sulfate (AOM/DSS) mice (C57BL/6) were administered 2.5 mg/kg PA or vehicle 3 times/wk via oral gavage over 12 wk. PA improved clinical symptoms (P ≤ 0.05) and reduced tumorigenesis (P ≤ 0.05). This improvement may be reflective of PA’s restorative effect on intestinal barrier function; PA upregulated the expression of essential tight junction and mucin genes (P ≤ 0.05) and increased the abundance of mucin-producing goblet cells (P ≤ 0.05). Given that macrophages play a substantial role in the pathogenesis of CRC and that we previously demonstrated that PA targets macrophages in colitis, we next assessed macrophages. We show that PA reduces the relative abundance of colonic macrophages within the lamina propria (P ≤ 0.05), and this was consistent with a reduction in the expression of important markers of macrophages and inflammation (P ≤ 0.05). We further confirmed PA’s inhibitory effects on macrophages in vitro under CRC conditions (P ≤ 0.05). These results suggest that PA is a promising therapeutic compound to treat CRC and improve clinical symptoms given its ability to inhibit macrophages and modulate the inflammatory environment in the colon.
NEW & NOTEWORTHY We report that panaxynol (PA) reduces colorectal cancer (CRC) by improving the colonic and tumor environment. Specifically, we demonstrate that PA improves crypt morphology, upregulates crucial tight junction and mucin genes, and promotes the abundance of mucin-producing goblet cells. Furthermore, PA reduces macrophages and associated inflammation, important drivers of CRC, in the colonic environment. This present study provides novel insights into the potential of PA as a therapeutic agent to ameliorate CRC tumorigenesis.
INTRODUCTION
Colorectal cancer (CRC) remains the third most commonly diagnosed cancer and the second leading cause of cancer-related death worldwide (1). Currently available therapies and treatment strategies including cytotoxic chemotherapeutics, radiation, and surgery have limited efficacy and many adverse effects (2, 3). Indeed, the mainstay of treatment for CRC (stage III) is surgery followed by adjuvant chemotherapy, which is only effective in 20% of these patients (4). Furthermore, many patients receiving chemotherapy experience issues of nonspecific toxicity, pervasive off-target effects, and acquired drug resistance, resulting in reduced quality of life, treatment cessation, or the need for alternative treatment regimens (5). Thus, safer, and more efficacious therapies are needed for the treatment of CRC.
To this, a significant number of individuals with CRC seek alternative treatments in the hopes of alleviating disease symptoms, preventing off-target toxicities, and maintaining remission (6). It is estimated that ∼30–75% of patients with CRC resort to unconventional therapies, including herbal medicines and vitamin therapy (6). Indeed, natural compounds have shown great promise preclinically in treating CRC and associated symptoms, with little to no off-target toxicity, by modulating inflammation and immune function (7, 8). More specifically, natural compounds that target macrophages—which play an important role in various cancers to promote tumor cell proliferation, growth, and invasiveness through the secretion of cytokines/chemokines and upregulation of oncogenic, inflammatory, and proliferative pathways (9, 10)—have consistently been found to reduce tumor growth and improve cancer prognosis (11, 12). Despite this, the use of natural compounds to target tumor-associated macrophages in CRC has not been utlilized in the clinic.
One of the most widely used herbal medicines and best-selling natural products throughout the world is ginseng (13). American ginseng (AG) is a plant rich in bioactive phytochemicals with its active components (ginsenosides) documented to exert immunomodulatory, anti-inflammatory, anticancer, and chemoprotective effects (14, 15). In fact, we have shown that AG suppresses colitis, a major CRC risk factor (16), and CRC itself (17) in mice without toxicity through its antioxidant and anti-inflammatory properties (18, 19). To determine the bioactive components mediating its anticolitis and anti-CRC effects, we isolated the hexane fraction of AG (HAG) and reported that it exhibited more potent antioxidant and proapoptotic properties and was more effective in suppressing murine colitis (20) and CRC (21, 22) than its parent compound AG. Moreover, we further fractionated HAG and found the most abundant, potent molecule to be panaxynol (PA), which was effective in suppressing murine colitis and associated disease symptoms through modulating immune responses, reducing oxidative stress and inflammation, and promoting apoptosis (23, 24). More specifically, PA appeared to target macrophages for DNA damage and apoptosis to treat colitis and associated symptoms (23). However, PA’s impact on CRC has not yet been explored.
Given its success in reducing colitis, a predisposing factor of CRC, and its suppressive effects on major drivers of CRC (i.e., inflammation and macrophages), we sought to extend our previous findings and evaluate the therapeutic potential of PA in CRC. To do so, we used the established azoxymethane-dextran sodium sulfate (AOM/DSS) murine model to examine PA’s effects on the inflammatory environment, with a particular focus on macrophages. Herein, we highlight the ability of PA to significantly reduce CRC tumorigenesis, which is mediated, at least in part, by its suppression of macrophages and associated inflammatory cytokines in the colon. Overall, these findings suggest that PA is a promising therapeutic compound for the treatment of CRC and should be further developed in this regard.
MATERIALS AND METHODS
Animals
Mice (C57BL/6) were purchased from Jackson laboratories and cared for in the Department of Laboratory Animal Resources (DLAR) at the University of South Carolina’s School of Medicine. Mice were housed 3–5/cage, maintained on a 12:12-h light-dark cycle in a low-stress environment (22°C, 50% humidity, low noise), and given food and water ad libitum. Mice were kept in a biohazard room and were only handled by the primary investigators. All mice were fed an AIN-76A diet (Bioserv, Frenchtown, NJ; Catalog No. F1515), a purified, balanced diet that is phytoestrogen free (25, 26). Dietary phytoestrogens have been shown to influence anxiety-related behaviors, fat deposition, blood insulin, leptin, and thyroid levels as well as lipogenesis and lipolysis in adipocytes, all of which could nonspecifically impact tumorigenesis (27). Body weight, food, and water consumption were monitored on a weekly basis for the duration of the study. The Institutional Animal Care and Usage Committee of the University of South Carolina approved all experiments, and all methods were performed in accordance with the American Association for Laboratory Animal Science.
AOM/DSS Mouse Model
Using the AOM/DSS protocol, CRC was chemically induced as illustrated in Fig. 1A. Briefly, a total of fifty 11-wk-old C57BL/6 female (n = 25) and male (n = 25) mice were randomly divided into three different groups for each sex: cancer-free (n = 5/sex; CF), AOM/DSS + Vehicle (n = 10/sex; AOM/DSS + VEH), and AOM/DSS + Panaxynol (n = 10/sex; AOM/DSS + PA). At 11–12 wk of age (baseline week 0), mice received either a single intraperitoneal injection of the carcinogen AOM (10 mg/kg; Sigma) diluted in PBS or PBS alone (CF control). Mice that were administered AOM were subjected to three cycles of DSS-supplemented water (36–50 kDa; MP Biomedical) at final concentrations of 1.5%, 1%, and 1% at weeks 1, 4, and 7, respectively. Each DSS cycle lasted for a 1-wk period and was followed by a 2-wk period of regular drinking water. To allow for greater tumor development, mice were euthanized 5 wk after the final DSS cycle.
Figure 1.

Panaxynol improves clinical symptoms and reduces inflammation in colon cancer. A: experimental design to induce azoxymethane-dextran sodium sulfate (AOM/DSS)-induced colorectal cancer (CRC) using 11-wk-old C57BL/6 female (n = 20) and male (n = 20) for 12 wk. B: probability of survival. C: overall symptom score accounting for percent body weight loss, stool consistency, and rectal bleeding. Significance was determined by multiple paired Student’s t tests between AOM/DSS-treated mice. D: circulating white blood cells (WBCs), lymphocytes (LYM), monocytes (MON), and neutrophils (NEU) determined in whole blood using VetScan HM5. Significance determined using ordinary one-way ANOVAs with Tukey multiple comparison test. E: neutrophil to lymphocyte ratio determined in whole blood. Significance determined using one-way ANOVA with Tukey multiple comparison test. For all data: *P ≤ 0.05; **P ≤ 0.005; and ***P ≤ 0.0005. PA, panaxynol; VEH, vehicle.
Panaxynol Preparation
Panaxynol (PA; C17H24O) was purchased from Biopurify Pytochemicals, Ltd., in sealed 5 mg/mL vials in pure 95% ethanol and stored at −20°C. PA was prepared fresh on the day of treatment by diluting in H2O to 1 mg/mL for administration (orally) at a dosage of 2.5 mg/kg. This dosage was chosen following a pilot dose-response study to determine PA’s efficacy. PA or VEH was administered 3 times/week via oral gavage using flexible plastic tubing gavage needles (Instech, Cat. No. FTP-20) for a total of 12 wk.
Symptom Monitoring and Scoring
All mice (n = 20/group for AOM/DSS groups and n = 10 for CF) underwent the same symptom monitoring and scoring. Body weights and symptom scores were determined 1 time/week to quantify the disease state, with a higher score indicative of a worsened disease state. Symptom scores were calculated by scoring percent body weight loss, stool consistency, and rectal bleeding as previously described (12). Briefly, fresh colonic evacuates were smeared onto “Hemoccult” tape (Beckman Coulter) to assess the severity of diarrhea and were tested with a developer (Beckman Coulter) to assess rectal bleeding. Stool consistency was scored as follows: solid cylinder (0), soft cylinder and easily spreadable (2), and noncylindrical or runny (4). Bleeding was scored as follows: no positive detection of blood (0), detection of blood but not grossly visible (2), and gross visibility of blood (4). Body weight was calculated as percent body weight loss: 0–5% (0), 6%–10% (1), 11%–15% (2), 15%–20% (3), 20%–25% (4), and >25% (5). Scores of all three categories were summed to obtain an overall symptom score for each mouse.
Colonoscopies
Before euthanasia, colonoscopies were performed (n = 3/group) to visualize the colonic tissue and quantify the severity of the disease (colitis and colorectal tumors) using an established protocol (28). Briefly, mice were anesthetized with isoflurane to perform a detailed endoscopic examination in which the endoscope was gently inserted into the rectum and through the anus. Air was applied to slowly set apart the intestinal walls for examination. As the scope advanced, pictures were taken frequently and the following were meticulously assessed and scored by the blinded primary investigator using the well-established scoring system to integrate evaluation of intestinal inflammation [i.e., focal lesions (edematous areas of the mucosa, erosions/reddened areas, ulcers), perianal region findings (diarrhea, bloody anal discharge, or prolapse), transparency of the colonic wall (visualization of the intramural blood vessels), and presence of intestinal bleeding] and tumors (28). Scoring was performed as previously described (28) with no modifications. Upon completion of colonoscopies, mice were placed on a warm pad set at 37°C for 5 min.
Tissue Collection
After 12 wk of PA treatment, mice were euthanized by isoflurane overdose following a 4-h fast. Retro-orbital blood was collected for blood analysis. The colon was excised and carefully flushed with PBS to remove fecal material, cut longitudinally, and opened to be imaged on a dissection microscope in which all tumors were counted and measured based on the size as follows: small (≤1 mm), medium (1–2 mm), and large (>2 mm). After imaging was completed, the colons in the first cohort of animals (n = 5 or 6/group) were cut in half in which the proximal portion was snap frozen in liquid nitrogen for RT-qPCR gene expression analysis and the distal portion was Swiss rolled, fixed in 10% formalin, and paraffin-embedded for histopathology, immunohistochemistry, and immunofluorescence. Colons from a separate cohort (n = 5–8/group) were placed in ice-cold PBS until flow cytometry. In a third cohort, tumors were excised from the entire colon and snap frozen for RT-qPCR (n = 4 or 5 group). The colon (without tumors; n = 5–7/group) was then placed in ice-cold PBS until flow cytometry.
Blood Panel Analysis
A blood panel analysis was performed (n = 14–17/group for AOM/DSS groups and n = 10 for CF group) using the VetScan HMT (Abaxis) for determination of total white blood cells (WBC), lymphocytes (LYM), monocytes (MON), and neutrophils (NEU). The neutrophil-to-lymphocyte ratio (NLR) was calculated from the obtained values.
Lamina Propria Isolation
Lamina propria (LP) cells were isolated from colons to be used for flow cytometry to identify immune cell populations within the colonic LP using a previously published protocol (29) with slight modifications. Colons were rinsed in sterile ice-cold PBS and minced with scissors. Tissues were subjected to a cell dissociation solution (HBSS without Ca2+Mg2+ containing 5 mM EDTA and 1 mM DTT) in a shaking incubator for 30 min at 37°C. Tubes containing dissociated tissues were vortexed and passed through a 100-μm cell strainer; flow-through containing intestinal epithelial cells (IECs) was discarded. The remaining tissue was subjected to a cell digestion buffer (HBSS with Ca2+Mg2+ containing 5% FBS, 5 mg/mL collagenase D, 50 μg/mL DNase 1, and 1 U/mL Dispase) in a shaking incubator for 30 min at 37°C. Tubes were vortexed and passed through a 40-μm cell strainer. Ice-cold PBS was added to the filter to collect the remaining cells. Tubes were spun at 2,500 rpm for 15 min to pellet. Cells were passed through a Percoll gradient [40/80% (vol/vol) gradient] and spun at 2,500 rpm for 20 min without acceleration and brakes. Cells at the 40/80 interface (leukocytes) were collected, spun at 2,000 rpm at 4°C for 10 min, washed with PBS, and prepared for flow cytometry analysis.
Flow Cytometry
To identify macrophages, colonic LP cells were isolated as described earlier and first incubated with ZombieGreen (FITC; Bio-Rad) solution for 20 min at RT in dark to discriminate Live/Dead (n = 5–8/group). Cells were then washed with flow buffer [HBSS without Ca2+Mg2+ containing 0.5% FBS, 10 mM HEPES (Gibco), and 2 mM EDTA (Gibco)], blocked for nonspecific binding with FC block for 10 min at 4°C, and then incubated with fluorescently labeled antibodies (BioLegend) against macrophage cell-surface markers: CD45, CD11b, and CD68 for 20 min at 4°C, followed by two PBS washes, with the final resuspension in flow buffer. Colonic LP cells were gated for nondebris singlets and considered live immune cells with ZombieGreenNeg/Low and CD45+. From the Live CD45+ population, CD11b+CD68+ cells were identified as macrophages.
To identify neutrophils, colonic LP cells were isolated as described earlier and incubated with ZombieGreen (FITC; Bio-Rad) solution for 20 min at RT in dark to discriminate Live/Dead (n = 2 or 3/group). Cells were then washed with flow buffer and blocked for nonspecific binding with FC block for 10 min at 4°C, and then incubated with fluorescently labeled antibodies (BioLegend) against neutrophil cell-surface markers: CD45, CD11b, and Ly6g.
To identify T cell phenotypes, colonic LP cells were isolated as described earlier and incubated in 0.02% Brefeldin A in complete media (cDMEM) for 4 h (n = 5–7/group). Cells were stained with fluorescently labeled antibodies against T cell surface markers: CD45, CD4, and TCRβ. 1 time fix was used to fix the cell surface stains, and 1 time perm buffer was used to permeabilize cell membranes (BioLegend; Cat. No. 424401). Cells were then stained with fluorescently labeled antibodies against the intracellular marker FoxP3 to identity regulatory T-cells (T-regs). All cells were measured using a FACS Aria II (BD) and analyzed using FlowJo (BD Biosciences).
Real-Time Quantitative PCR
Proximal colons (n = 5–7/group) and colonic tumors (n = 4 or 5/group) were homogenized and RNA was extracted. RNA sample quality and quantities were verified using a Nanodrop One Microvolume UV-vis Spectrophotometer (Thermo Fisher Scientific) and determined to be of good quality based on A260/A280 and 260/230 values (>1.8) before cDNA synthesis using High-capacity Reverse Transcriptase kit (Applied Biosystems, Cat. No. 4368814). Quantitative reverse transcriptase polymerase chain reaction (PCR) analysis was carried out as per the manufacturer’s instructions, and all primers used were TaqMan Gene Expression Assays (Applied Biosystems). TaqMan reverse transcription reagents were used to reverse transcribe RNA to cDNA in the colon and tumor. Gene expression of the following markers: monocyte/macrophage [CD68, MRC1 (colon only), and MSR1 (colon only)], proinflammatory M1 macrophage markers [IL-1β (colon only) and IL-6], anti-inflammatory M2 macrophage markers [IL-10 (colon only), IL-13, and tumor growth factor β (TGF-β)1], neutrophils (Ly6G), T-regs (Foxp3), proapoptotic Bcl-2-associated X-protein (Bax), genes associated with intestinal barrier integrity and function [occludin (OCLN), tight junction 3 (TJP3), mucin 1 (Muc1), and Muc2] was performed as previously described (30). Briefly, quantitative RT-PCR analysis was carried out as per the manufacturer’s instructions (Applied Biosystems) using Taq-Man Gene Expression Assays on a Qiagen Rotor-Gene Q. Data were normalized to controls and compared with five reference targets (Hmbs, B2M, TBP, H2afv, and 18 s), which were evaluated for expression stability using GeNorm.
Immunohistochemistry
To examine cell proliferation, immunohistochemical analysis of Ki67 (Abcam, No. ab16667) was performed according to manufacturer’s instructions (Abcam IHC staining protocol for paraffin sections) with minor modifications, as previously described (31). Color was developed with diaminobenzidine (DAB) (Vector Laboratories, No. SK-4100) for 6 min at RT and counterstained using CAT hematoxylin and Tacha’s bluing for 30 s. Representative images were taken at ×20 using Keyence All-in-One Fluorescence Microscope BZ-X800. The percentage of Ki67 cells (DAB-positive nuclei) over total cells, relative to the area, was quantified using Material Image Processing and Automated Reconstruction (MIPAR) software (32). Five images were assessed for each mouse (n = 3/group). TUNEL staining was carried out as per the manufacturer’s instructions using ApopTag Peroxidase In Situ Apoptosis Detection Kit (Millipore, No. S7100), which is previously described in detail (31). Color was developed with DAB (Vector Laboratories, No. SK-4100) for 6 min at RT and counterstained using 1% methyl green (R&D systems, No. 4800-30-18) for 10 min at RT. Representative images were taken at ×20 using Keyence All-in-One Fluorescence Microscope BZ-X800. The percentage of apoptotic cells (TUNEL-positive nuclei) over total cells, relative to the area, was quantified using Material Image Processing and Automated Reconstruction (MIPAR) software (32). Five images were assessed for each mouse (n = 3/group).
Immunofluorescence
Immunofluorescence of tumors within colon tissues (n = 3/group) was performed as previously described (31). Briefly, sections were incubated with rodent decloaker (Biocare Medical, Cat. No. RD913M) for 30 min at 95°C for antigen retrieval, 10% goat serum in 5% BSA/Tris-buffered saline (TBS) for 1 h at RT to block nonspecific binding, and rat anti-mouse FitC-conjugated F4/80 antibody (Bio-Rad; Cat. No. MCA497F) in 5% BSA/TBS overnight at 4°C. Sections were then washed with TBS, counterstained with 4′,6-diamidino-2-phenylindole (DAPI, 1 μg/mL), washed with water, and mounted with a glycerol-based mounting media. Representative fluorescent images were taken at ×20 using Echo Revolution microscope.
Histopathology
The distal portion of the colon was Swiss rolled and fixed overnight in 10% formalin, dehydrated with alcohol, and embedded in paraffin wax. Paraffin sections were stained with hematoxylin and eosin (H&E; Fisher HealthCare), as previously described by our group (33) and stained separately for goblet cells with Alcian Blue (AB; Newcomer Supply; Cat. No. 9102 A) (n = 3/group).
Cell Culture
Bone marrow-derived macrophages (BMDMs) were isolated from healthy 10- to 14-wk-old C57BL/6 male mice using a pre-established protocol (34, 35). Briefly, mice were euthanized by isoflurane overdose. Femurs were cleared of muscle and debris. The epiphyses of the femurs were cut and placed knee-down and spun down in a 1.5-mL tube. Bone marrow was collected and resuspended in complete DMEM (cDMEM; 10% FBS, 1% penicillin-streptomycin) and passed through two 100-µm strainers. Cells were plated on an untreated 10-cm dish in cDMEM and allowed to incubate at 37°C for 4 h. Adherent/mature monocytes and dendritic cells were discarded while floating/immature monocytes were collected. Cells were subjected to RBC lysis and resuspended in bone marrow maintenance media (BMMM; 20% L929-conditioned media in cDMEM). Cells were then plated on surface-treated 6-well plates at a 250,000 cells/well seeding density. On day 3, fresh BMMM was added. On day 5, media was aspirated and fresh BMMM was added. For M2 macrophage polarization experiments, 6-day mature macrophages were given either cDMEM + VEH, M2 media (cDMEM with 10 ng/mL IL-4) + VEH, or M2 media + 1 μM PA. Cells were incubated for 24 h. For C26 colon tumor-conditioned media (C26 CM) experiments, 6-day mature macrophages were given either serum-free media (SFM) + VEH, 33% C26-conditioned media (C26 CM) + VEH, or 33% C26 CM + 1, 2.5, or 5 μM PA. Cells were incubated for 48 h. After incubation with these different treatments, cells were washed twice with PBS and incubated with 5 mM EDTA PBS at 4°C for 20 min. Cells were then gently scraped and transferred into flow tubes, spun at 1,600 rpm at 4°C for 5 min, and washed in PBS before antibody staining. Cells were stained and analyzed for macrophages via flow cytometry as described earlier with the addition of analyzing macrophage phenotypes. From the CD11b+CD68+ macrophage population, macrophage phenotypes were determined based on CD206 and CD11c expression. CD206−CD11c− cells were identified as M0 macrophages; CD206−CD11c+ as M1 macrophages; CD206+CD11c− cells as M2 macrophages; CD206+CD11c+ as M1-M2 transitional macrophages. All cells were measured using a FACS Aria II (BD) and analyzed using FlowJo (BD Biosciences). Three independent experiments were carried out for each in vitro assessment.
Cell Counting Kit-8
BMDMs were isolated as described earlier. On day 6 of maturation, BMDMs were subjected to seven concentrations of PA to assess cell death: 0.001, 0.01, 0.1, 1.0, 5.0, 10.0, and 100.0 µM. On day 7 (i.e., 24-h post-PA treatment), Cell Counting Kit-8 (CCK-8; Dojindo; Cat. No. CK04) assays were completed per manufacturer’s instructions. C26 CRC cells were also subjected to these seven concentrations of PA for 24 h to assess cell death using CCK-8. Three independent experiments were carried out.
Statistical Analyses
All data were analyzed using commercial software (GraphPad Software, Prism 7, La Jolla, CA). All in vivo outcomes were analyzed using a paired or unpaired Student’s t test, one-way ANOVA, or two-way ANOVA where appropriate. If a significant difference was observed for a one-way ANOVA, Tukey’s multiple comparisons test was performed to further define group differences. If a significant difference was observed for a two-way ANOVA, a Bonferroni’s or Benjamini, Krieger, and Yekutieli multiple comparisons test was performed to further define group differences. Survival curve analysis was conducted by log-rank (Mantel-Cox) test. All gene expression analyses were analyzed using a Student’s t test. Statistical significance was set at P ≤ 0.05. Data are presented as means ± SE. All figures were generated using GraphPad Prism.
RESULTS
Panaxynol Improves Clinical Symptoms and Reduces Inflammation in CRC
The experimental design is presented in Fig. 1A in which AOM/DSS was used to chemically induce CRC. Over the 12 wk of treatment, PA appears to improve survival, although nonsignificant (Fig. 1B; n = 20/group for AOM/DSS groups and n = 10 for CF). This was consistent with improved overall symptom scores with PA, which accounts for body weight loss, stool consistency, and rectal bleeding (P ≤ 0.05; Fig. 1C) (n = 20/group for AOM/DSS groups and n = 10 for CF). Specifically, PA significantly suppressed overall symptoms scores at weeks 1–3, 5–7, and 10–12 (Fig. 1C). A comprehensive blood analysis was performed at the end of the study (Fig. 1D) (n = 14–17/group for AOM/DSS groups and n = 10 for CF). As expected, circulating monocytes (precursors of macrophages) were significantly increased in VEH-treated AOM/DSS mice compared with CF (P ≤ 0.05; Fig. 1D), and this was rescued by PA (P ≤ 0.05; Fig. 1D). Similarly, PA was able to ameliorate the significant increase in neutrophils, important promoters of tumor initiation, evasion, and maintenance in CRC (36) with VEH (P ≤ 0.05; Fig. 1D). This was consistent with a PA-induced decrease in the neutrophil-to-lymphocyte ratio (NLR) (P ≤ 0.05; Fig. 1E), an important prognostic factor for CRC (37). There was no change in total WBCs across groups and although there was a decrease in lymphocytes with AOM/DSS (P ≤ 0.05; Fig. 1D), there was no difference between VEH- and PA-treated groups.
Panaxynol Suppresses AOM/DSS-Induced CRC
After 12 wk of treatment, colonoscopies were performed in a subset of mice (n = 3/group) to visualize (Fig. 2A) and quantify disease severity (Fig. 2B) using a pre-established protocol to score for inflammation (i.e., focal lesions, intestinal bleeding, perianal findings, and wall transparency) and tumors (28). As expected, colonoscopies of CF mice exhibited normal colonic architecture with visible small and large blood vessels (Fig. 2A). These blood vessels were less apparent and more so characterized by a thickened appearance of mucosa in VEH-treated AOM/DSS mice, which did not appear as severe for those treated with PA (Fig. 2A). This was supported by a significant reduction (i.e., improvement) in the transparency of the colonic wall, which accounts for the presence of intramural small and large blood vessels, in PA-treated AOM/DSS mice compared with that of VEH (P ≤ 0.05; Fig. 2B). In further support for PA’s beneficial effects on CRC clinical manifestations, PA-treated AOM/DSS mice exhibited significant reductions in intestinal bleeding (P ≤ 0.05) and inflammation (P ≤ 0.05) compared with VEH-treated AOM/DSS mice; however, no significant difference in focal lesions or perianal findings (P = 0.08) were detected (Fig. 2B). Furthermore, several small and large protruding tumors were observed in VEH-treated AOM/DSS mice, whereas fewer and smaller tumors were observed in those treated with PA (Fig. 2A). This difference was accounted for in the tumor score, which was significantly reduced by PA compared with VEH-treated AOM/DSS mice (P ≤ 0.05; Fig. 2B).
Figure 2.

Panaxynol (PA) suppresses azoxymethane-dextran sodium sulfate (AOM/DSS) colorectal cancer. C57BL/6 cancer-free (n = 10), AOM/DSS + vehicle (VEH) (n = 14), AOM/DSS + PA (n = 17) mice after 12 wk of treatment. A: representative colonoscopy images. B: colonoscopy scores (n = 3/group). Significance was determined using an ordinary two-way ANOVA with Benjamini, Krieger, and Yekutieli multiple comparisons test. C: representative images of tumors in the distal (top) and proximal (bottom) portion of colons using a dissection microscope. D–F: tumor count of total, small (≤1 mm), medium (1–2 mm), and large (>2 mm) tumors in AOM/DSS + VEH or AOM/DSS + PA female mice (D), male mice (E), and combined sexes (F). For tumor counts, significance was determined by multiple unpaired Student’s t tests. For all data: *P ≤ 0.05; **P ≤ 0.005; and ***P ≤ 0.0005.
After colonoscopies were completed, the mice (n = 14–17/group for AOM/DSS groups) were euthanized, and colon was excised, imaged, and tumors counted. Representative images of tumors in the distal and proximal colon were taken and tumors were counted using a dissection microscope (Fig. 2C). Compared with VEH, PA-treated AOM/DSS mice exhibited significant reductions in both the number and size of tumors in females (P ≤ 0.05; Fig. 2D), males (P ≤ 0.05; Fig. 2E), and sexes combined (P ≤ 0.05; Fig. 2F). More specifically, PA significantly reduced the total number of tumors and number of medium sized tumors (1–2 mm) in females, males, and sexes combined (P ≤ 0.05; Fig. 2, D–F). A significant reduction in large tumors (>2 mm) was exhibited in PA-treated females and sexes combined (P ≤ 0.05; Fig. 2, D and F), but not in males alone. A reduction in small tumors (≤1 mm) was also observed in PA-treated AOM/DSS mice when sexes were combined but this did not reach statistical significance (P = 0.08; Fig. 2, D–F). Given that PA appeared to benefit both sexes, data from females and males were combined in all further analyses.
Panaxynol Increases Apoptosis and Reduces Cell Proliferation in Colonic Tumors
Given the reduction in tumor number and size with PA, we evaluated its effects on apoptosis and proliferation in colonic tumors (n = 3/group). Sections were stained with TUNEL for detection of apoptotic cells (Fig. 3A, left) and Ki67 to examine proliferation (Fig. 3A, right). In support of PA’s anti-tumor effects, colonic tumors of PA-treated AOM/DSS mice exhibited a significant increase in the percentage of apoptotic cells compared with VEH (P ≤ 0.05; Fig. 3B). Furthermore, gene expression of proapoptotic marker Bax was increased, although nonsignificant, in colonic tumors of PA-treated AOM/DSS mice (n = 5/group) compared with that of VEH (P = 0.09; Fig. 3C). In addition, PA reduced cell proliferation in colonic tumors, indicated by a significant decreased percentage of Ki67-positive cells compared with VEH (P ≤ 0.05; Fig. 3D).
Figure 3.

Panaxynol (PA) increases apoptosis and reduces cell proliferation in colonic tumors. Immunohistochemistry of colonic tumors from azoxymethane-dextran sodium sulfate (AOM/DSS) + vehicle (VEH) and AOM/DSS + PA mice (n = 3/group) stained with TUNEL for detection of apoptotic cells and Ki67 to examine proliferation. A: representative ×20 images of colonic tumors stained with TUNEL (left) and Ki67 (right). Scale bar = 50 µm. B: percentage of apoptotic [positively stained TUNEL-diaminobenzidine (DAB)] cells relative to area (n = 3/group). C: gene expression analysis of Bax, a proapoptotic marker, within colonic tumors using qRT-PCR (n = 5/group). Data were normalized to AOM/DSS + VEH and compared with five reference targets (B2M, TBP, HPRT, HMBS, and H2AFV), which were evaluated for expression stability using GeNorm. D: percentage of Ki67 positive cells (positively stained Ki67-DAB) cells relative to area (n = 3/group). All significance was determined by unpaired Student’s t tests (***P ≤ 0.0005).
Panaxynol Rescues Intestinal Barrier Function
To investigate PA’s effects on intestinal barrier function, colons were stained for H&E and AB (n = 3/group), as well as processed for RT-qPCR gene expression analysis of vital markers of gut barrier functions (n = 5–7/group). Representative images of H&E-stained distal colons were taken to examine any differences in histopathology and crypt architecture. As expected, colons from CF mice exhibited normal crypt architecture with simple columnar epithelium (Fig. 4A). In the VEH-treated AOM/DSS mice, submucosal invasion and destruction of the crypts is present throughout the colon, which did not appear as severe in the PA-treated AOM/DSS mice (Fig. 4A). We next assessed PA’s effects on goblet cells, which are responsible for the production and maintenance of the mucus layer protecting the intestinal barrier (38). This protective mucus layer has been shown to be diminished in CRC (including in the AOM/DSS model), resulting in increased gut permeability and immune cell infiltration within the colon (39). To visualize these important goblet cell mucins, colons were stained with AB (Fig. 4B). CF colons exhibited many blue staining goblet cell mucins, indicative of normal mucin production, which were visibly reduced in VEH-treated AOM/DSS mice (Fig. 4B). This did not appear as severe in PA, indicated by more numerous blue staining goblet cell mucins compared with VEH (Fig. 4B). To confirm this observation, average goblet cells per crypt were quantified (Fig. 4C). The colons of VEH-treated AOM/DSS mice, but not those treated with PA, exhibited significantly reduced average of goblet cells per crypt compared with CF (P ≤ 0.05; Fig. 4C). In fact, goblet cells per crypt were completely rescued with PA treatment (i.e., there was no difference between CF and PA-treated AOM/DSS) (Fig. 4C).
Figure 4.

Panaxynol (PA) rescues intestinal barrier function. C57BL/6 cancer-free, azoxymethane-dextran sodium sulfate (AOM/DSS) + vehicle (VEH), AOM/DSS + PA mice after 12 wk of treatment. Representative images of hematoxylin and eosin (H&E; A) and alcian blue-stained (B) distal colons. C: average goblet cell count per crypt (n = 3/group). Significance determined using an ordinary one-way ANOVA with Tukey’s multiple comparisons test. D: RNA isolated from the proximal colons (n = 5–7/group) were used for gene analysis via qRT-PCR for tight junction permeability as indicated by occludin (OCLN), tight junction 3 (TJP3), mucin 1 (Muc1), and Muc2. Data were normalized to AOM/DSS + VEH and compared with five reference targets (B2M, TBP, HPRT, HMBS, and H2AFV) which were evaluated for expression stability using GeNorm. Significance was determined using unpaired Student’s t tests (P ≤ 0.05). For all data: *P ≤ 0.05; ***P ≤ 0.0005.
To further examine PA’s possible role in strengthening the gut barrier, we analyzed the expression of colonic genes associated with intestinal barrier integrity including occludin (OCLN) and tight junction protein 3 (TJP3, also known as zonula-occuldin-3), which were both upregulated in PA-treated AOM/DSS mice (P ≤ 0.05; Fig. 4D). We also examined goblet cell-specific genes in the colon including Muc1, associated with proinflammatory and tumor promoting processes, and Muc2, one of the major gel-forming mucins protecting the intestinal epithelial barrier (40, 41). Muc1 was slightly but nonsignificantly reduced in PA-treated AOM/DSS mice indicating reduced inflammation (P = 0.08 Fig. 4D). In contrast, Muc2 expression was significantly increased in PA-treated AOM/DSS mice, indicating reduced intestinal barrier permeability. Taken together, the aforementioned results suggest an improvement in the integrity and function of the intestinal barrier with PA treatment (P ≤ 0.05; Fig. 4D) (40).
Panaxynol Suppresses Macrophages in Colorectal Cancer
Our laboratory has previously established a role for macrophages contributing to tumorigenesis in the AOM/DSS CRC model (42). Given that PA reduced colitis through targeting macrophages (23), we next examined whether PA could modify macrophage behavior in CRC. We performed flow cytometry on colons (with tumors intact) and isolated colonic lamina propria (LP) cells that were gated for nondebris singlets and considered live immune cells with ZombieGreenNeg/Low and CD45+ (Fig. 5A). From the LiveCD45+ population, CD11b+CD68+ cells were identified as macrophages (Fig. 5A). As expected, AOM/DSS-treated VEH mice exhibited a significantly increased abundance of macrophages in the colon compared with CF (P ≤ 0.05; Fig. 5B), and this was significantly decreased with PA treatment (P ≤ 0.05; Fig. 5B) (n = 5–8/group).
Figure 5.

Panaxynol (PA) suppresses macrophages and improves the colonic environment in colorectal cancer. C57BL/6 cancer-free, azoxymethane-dextran sodium sulfate (AOM/DSS) + vehicle (VEH), AOM/DSS + PA mice were euthanized after 12 wk of treatment and distal colons were processed for flow analysis. A, B, F, and G: lamina propria (LP) cells were isolated from distal colons, gated for nondebris singlets, and considered live immune cells with ZombieGreenNeg/Low and CD45+. A: gating strategy of ZombieGreenNeg/Low and CD45+ immune cell population (top). From the LiveCD45+ population, CD11b+CD68+ cells were identified as macrophages (bottom). B: relative percentage of CD11b+CD68+ macrophages in the LP of colon (n = 5–8/group). Significance determined using an ordinary one-way ANOVA with Tukey’s multiple comparisons test. C–E: RNA isolated from the proximal colons of AOM/DSS-treated VEH and PA mice were used for gene analysis via qRT-PCR (n = 5 or 6/group) using pan macrophage markers (CD68, Mrc1, and MSR1) (C); proinflammatory markers associated with M1 macrophages (IL-1β and IL-6) (D); and protumoral markers associated with M2 macrophages [IL-10, IL-13, and tumor growth factor β (TGF-β1)] (E). F: gating strategy of ZombieGreenNeg/Low and CD45+ immune cell population (top) of colonic LP cells. From the LiveCD45+ population, CD4+Ly6g+ cells were identified as neutrophils and representative flow plots are shown (bottom) (n = 2 or 3/group). G: RNA isolated from the proximal colons of C57BL/6 AOM/DSS + VEH and AOM/DSS + PA (n = 5 or 6/group) mice after 12 wk of treatment were used for gene analysis via qRT-PCR using neutrophil marker Ly6G. For all qRT-PCR, data were normalized to AOM/DSS + VEH and compared with five reference targets (B2M, TBP, HPRT, HMBS, and H2AFV) which were evaluated for expression stability using GeNorm; significance was determined using Student’s t tests. For all data: *P ≤ 0.05 and **P ≤ 0.005.
To confirm our cellular findings of PA suppressing CD11b+CD68+ macrophages, we performed RT-qPCR on proximal colons (with tumors intact) of VEH- and PA-treated AOM/DSS mice (n = 5 or 6/group). We first examined the expression of genes associated with pan-macrophages which were all significantly suppressed in PA-treated AOM/DSS mice, including CD68, mannose receptor C type 1 (Mrc1), and mannose scavenger receptor 1 (MSR-1) compared with that of VEH (P ≤ 0.05; Fig. 5C). Moreover, colons of PA-treated AOM/DSS mice exhibited significant downregulation of proinflammatory genes IL-1β and IL-6, important contributors of clinical symptoms and intestinal inflammation in CRC that are associated with M1 macrophages and to lesser extent T-cells (P ≤ 0.05; Fig. 5D). More importantly, PA significantly downregulated protumoral genes IL-10, IL-13, and tumor growth factor β (TGF-β1), all of which are associated with tumorigenic M2 macrophages (P ≤ 0.05; Fig. 5E).
In addition to macrophages, we also assessed neutrophils that are important inflammatory immune cells whose increased abundance is strongly associated with more severe tumorigenesis and worse prognosis in CRC (36). A small subset of mice (n = 2 or 3/group) was used to grossly observe differences in neutrophils between groups. PA appeared to protect against the increased abundance of neutrophils in the colon (Fig. 5F); however, statistics were not performed given the small sample size. Nonetheless, this finding was confirmed using RT-qPCR where it was documented that PA significantly downregulated neutrophil marker Ly6g in the proximal colon compared with that of VEH (P ≤ 0.05; Fig. 5G).
To confirm that the suppression of macrophages by PA was not confounded by the fewer and smaller tumors in the colon of PA-treated mice, we repeated the assessment of macrophages in the colon following tumor removal (n = 5–7/group). Consistent with the aforementioned findings, the relative abundance of macrophages in colons were significantly increased in VEH-treated AOM/DSS mice compared with CF (P ≤ 0.05; Fig. 6, A and B) and this response was ameliorated by PA (P ≤ 0.05; Fig. 6, A and B). RT-PCR was performed on the removed tumors (n = 4 or 5/group) and consistent with the cellular data, we document that PA significantly suppressed pan-macrophage marker CD68 in tumors (P ≤ 0.05; Fig. 6C). Furthermore, PA suppressed select inflammatory mediator IL-6 (P ≤ 0.05) associated with M1 macrophages, as well as protumoral mediators IL-13 (P ≤ 0.05) and TGF-β1 (P = 0.08), which are tightly associated with M2 macrophages (Fig. 6C). The reduction in macrophages by PA was further confirmed by immunofluorescence staining for pan macrophage marker F4/80 (Fig. 6D) (n = 3/group).
Figure 6.

Panaxynol (PA) suppresses macrophages and improves the colonic environment in colon cancer. C57BL/6 cancer-free, azoxymethane-dextran sodium sulfate (AOM/DSS) + vehicle (VEH), AOM/DSS + PA mice were euthanized after 12 wk of treatment and colons following tumor removal were processed for flow analysis. A, B, E, and F: lamina propria (LP) cells were isolated from colons following tumor removal (n = 5–7/group), gated for nondebris singlets, and considered live immune cells with ZombieGreenNeg/Low and CD45+. A: gating strategy of ZombieGreenNeg/Low and CD45+ immune cell population (top). From the LiveCD45+ population, CD11b+CD68+ cells were identified as macrophages (bottom). B: relative percentage of CD11b+CD68+ macrophages in the LP of colon. Significance was determined using an ordinary one-way ANOVA with Tukey’s multiple comparisons test. C: RNA isolated from colonic tumors of AOM/DSS-treated VEH and PA mice were used for gene analysis via qRT-PCR (n = 4 or 5/group) using pan macrophage marker (CD68), proinflammatory marker associated with M1 macrophages (IL-6); and protumoral markers associated with M2 macrophages [IL-13 and tumor growth factor β (TGF-β1)]. D: representative ×20 images of immunofluorescence staining of pan macrophage marker F4/80 in colonic tumors of AOM/DSS+VEH and AOM/DSS+PA mice (n = 3/group). DAPI (blue) as an individual channel for visualization of nuclei (left), F4/80 (green) as an individual channel (middle) and merged (right). Scale bar = 100 µm. E: representative flow plots of TCRβ+FoxP3+ LP cells from colons following tumor removal in cancer-free, AOM/DSS +VEH, and AOM/DSS + PA mice were identified as regulatory T-cells (T-regs). F: relative percentage of TCRβ+FoxP3+ T-regs in the colonic LP. Significance was determined using an ordinary one-way ANOVA with Tukey’s multiple comparisons test. G: RNA isolated from colonic tumors of C57BL/6 AOM/DSS + VEH and AOM/DSS + PA (n = 4 or 5/group) mice after 12 wk of treatment were used for gene analysis via qRT-PCR using T-reg marker FoxP3. For all qRT-PCR, data were normalized to AOM/DSS + VEH and compared with five reference targets (B2M, TBP, HPRT, HMBS, and H2AFV), which were evaluated for expression stability using GeNorm; significance was determined using a Student’s t tests. For all data: *P ≤ 0.05 and **P ≤ 0.005.
In addition to macrophages, we assessed the effects of PA on regulatory-T cells (T-regs), important promoters of CRC development, inflammation, and intestinal damage (n = 5–7/group) (43). VEH but not PA-treated AOM/DSS mice exhibited significantly increased TCRβ+FoxP3+ T-regs in tumor-removed colons compared with CF (P ≤ 0.05; Fig. 6, E and F). Although there was no difference in colonic TCRβ+FoxP3+ T-regs between VEH and PA (Fig. 6, E and F), we do report a decrease in the expression of T cell marker Foxp3 in tumors (n = 4 or 5/group) from PA-treated mice compared with VEH (P ≤ 0.05; Fig. 6G).
Panaxynol Reduces Cell Survival of BMDMs and Colorectal Cancer Cells and Decreases Protumoral M2 Macrophages In Vitro
Our in vivo results of PA’s suppressive effects on macrophages were confirmed in vitro using bone marrow derived macrophages (BMDMs). Three independent experiments were carried out for each assessment. First, we used CCK-8 assays to evaluate the cell viability of BMDMs after treatment with various concentrations of PA for 24 h (Fig. 7A). PA inhibited cell survival in a concentration-dependent manner with an IC50 value of ∼7 μM for PA on BMDMs (Fig. 7A). The 1 μM concentration of PA was selected for additional in vitro studies. To further explore the effects of PA on macrophage polarization, we performed flow cytometry on PA-treated BMDMs incubated with IL-4 to polarize BMDMs toward M2-like macrophages (i.e., protumor macrophages) (Fig. 7, B and C). PA-treated BMDMs cultured with M2 media increased naïve M0 macrophages (P = 0.06), representing PA-treated BMDMs unaffected by this M2 stimulus, and nonsignificantly reduced transitional M1-M2 (P = 0.12) and M2 macrophages (P = 0.08) compared with VEH-treated BMDMs cultured with M2 media.
Figure 7.
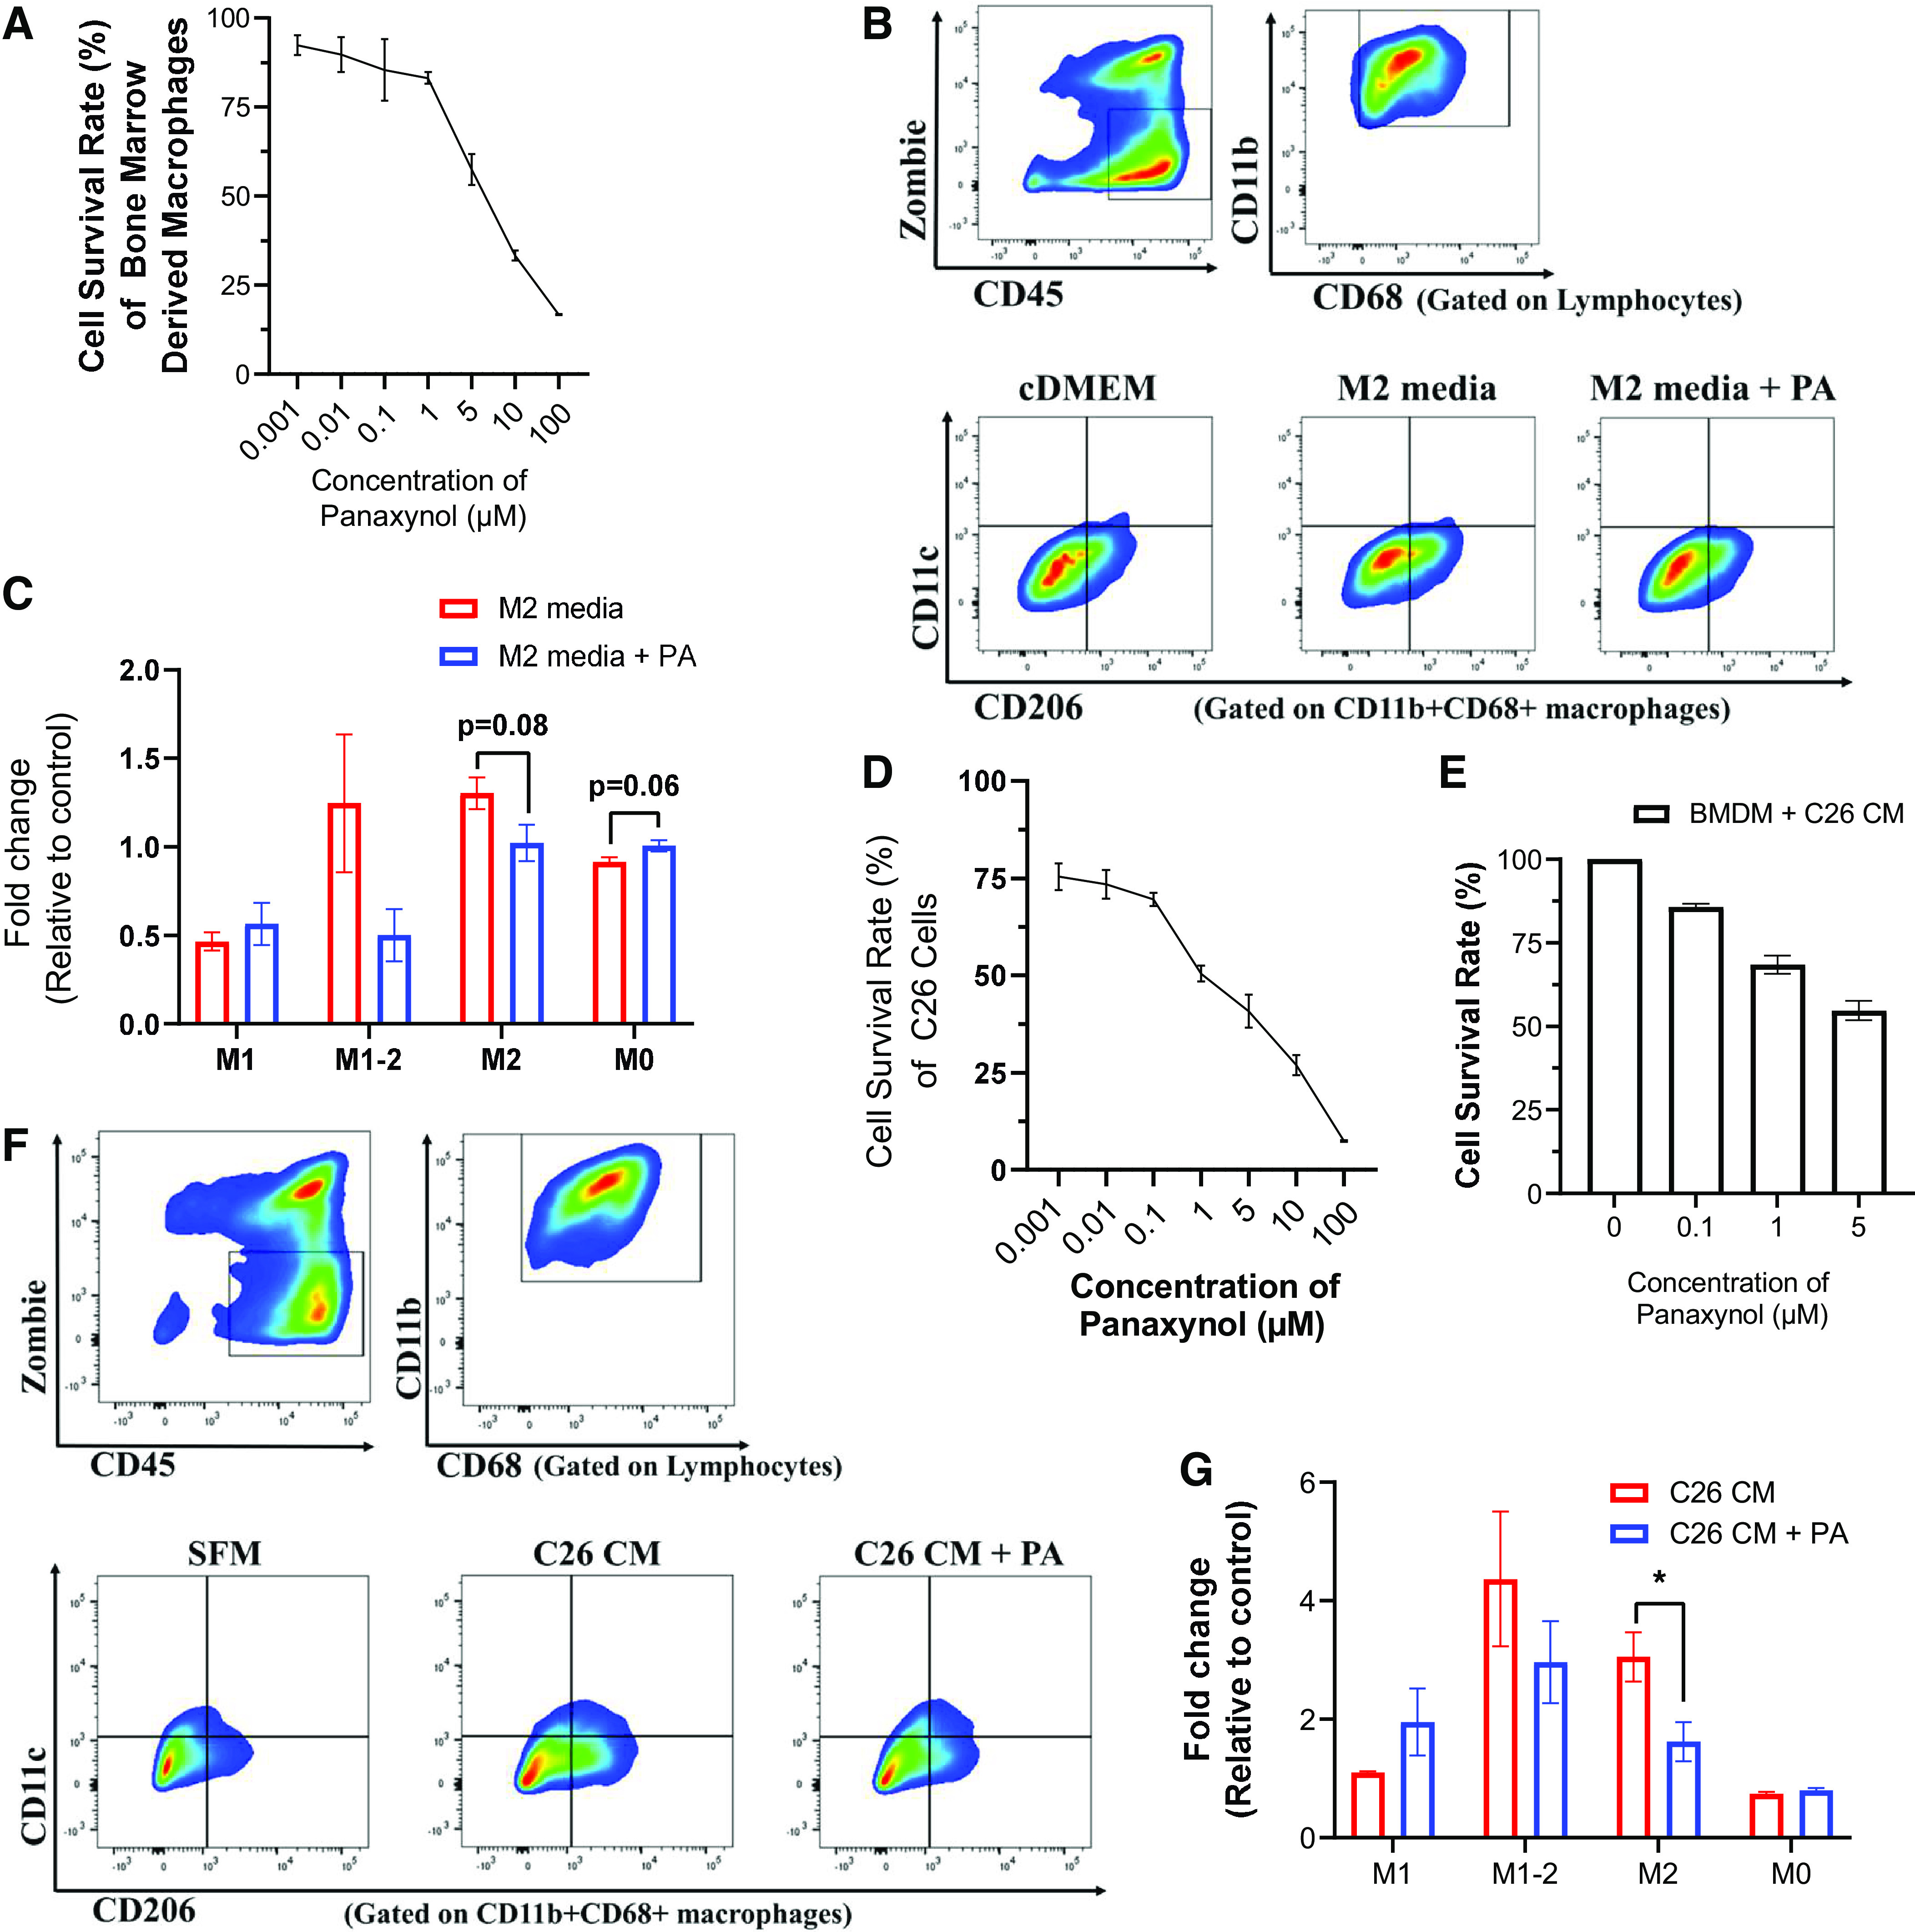
Panaxynol (PA) reduces cell survival of bone marrow-derived macrophages and colorectal cancer cells and decreases protumoral M2 macrophages in vitro. A: percent cell survival rate of bone marrow-derived macrophages (BMDMs) treated with various concentrations of panaxynol in vitro for 24 h via Cell Counting Kit-8 (CCK-8). B and C: BMDMs under different conditions were gated for nondebris singlets and considered live immune cells with ZombieGreenNeg/Low and CD45+. From the Live CD45+ population, CD11b+CD68+ cells were identified as macrophages. From the CD11b+CD68+ macrophage population, CD206−CD11c+ were identified as M1 macrophages; CD206+CD11c+ as M1-M2 transitional macrophages; CD206+CD11c− cells as M2 macrophages; and CD206−CD11c− cells as M0 macrophages. B and C: flow plots identifying gating strategy for ZombieGreenNeg/LowCD45+ immune cells (top) and macrophage phenotype (bottom) using CD11c and CD206 expression in BMDMs incubated with cDMEM or M2-like macrophage media (IL-4) with or without 1 μM PA. C: relative fold change in percentage of macrophage phenotypes in BMDMs treated with or without 1 μM PA in the presence of M2-marophage stimulating media. Significance was determined using multiple Student’s t test (P ≤ 0.05). Percent cell survival rate of C26 colorectal cancer cells (D) or bone marrow-derived macrophages (BMDMs) (E) incubated with C26 tumor-conditioned media (C26 CM) treated with various concentrations of panaxynol in vitro. F and G: BMDMs were gated for nondebris singlets and considered live immune cells with ZombieGreenNeg/Low and CD45+. From the Live CD45+ population, CD11b+CD68+ cells were identified as macrophages. From the CD11b+CD68+ macrophage population, CD206−CD11c+ were identified as M1 macrophages; CD206+CD11c+ as M1-M2 transitional macrophages; CD206+CD11c− cells as M2 macrophages; and CD206−CD11c− cells as M0 macrophages. F: flow plots identifying gating strategy for ZombieGreenNeg/LowCD45+ immune cells (top left), CD11b+CD68+ macrophages (top right), and macrophage phenotype (bottom) using CD11c and CD206 expression in BMDMs incubated with SFM, C26 CM, or C26 CM+PA. G: relative fold change in percentage of macrophage phenotypes in BMDMs incubated with C26 CM or C26 CM + PA. All in vitro data are representative of three independent experiments; significance was determined using multiple Student’s t tests (P ≤ 0.05).
Next, we performed in vitro experiments using C26 CRC cells to confirm our in vivo results of PA reducing CRC at least in part through its suppressive effects on macrophages. Three independent experiments were carried out for each assessment. We performed CCK-8 assays to evaluate PA’s effects on cell viability of C26 CRC cells (Fig. 7D). PA exhibited potent antiproliferative activity against C26 CRC cells in a concentration-dependent manner with an IC50 value of 1 μM (Fig. 7D). To further explore the anticancer activity of PA, we treated BMDMs cultured with C26 CM for 48 h with various concentrations of PA to assess its effects on macrophage survival (Fig. 7E). We found that 1 μM and 5 μM of PA reduced survival by 31.5% and 45.3%, respectively (Fig. 7E). Furthermore, the effects of PA on macrophage polarization in a CRC context were evaluated by culturing BMDMs with C26 CM for 48 h with PA (Fig. 7, F and G). No significant differences were detected in the relative abundance of M1, M1-M2, and M0 macrophages between VEH- and PA-treated BMDMs cultured with C26 CM (Fig. 7G). However, PA significantly reduced the relative abundance of protumoral M2 macrophages in BMDMs cultured with C26 CM (P ≤ 0.05; Fig. 7G).
DISCUSSION
New therapeutic agents to combat CRC are needed given the limited efficacy and off-target effects of current available therapies. Advances in our understanding of the cross talk between cancer cells and the host immune system have highlighted the importance of the tumor microenvironment (TME) in targeted cancer therapy. Tumor-associated macrophages present as promising targets for cancer therapeutics. PA, a bioactive component in the herb American ginseng (AG), has shown efficacy in suppressing colitis in mice that appears to be mediated by its ability to target macrophages (23, 24); however, PA’s effects on macrophages are largely limited to in vitro findings and its effectiveness in CRC is largely unknown. Because colitis is a predisposing factor of CRC, we sought to evaluate the therapeutic potential of PA in a murine model of CRC and investigate its associated actions on macrophages. Herein, for the first time, we highlight the ability of PA to mitigate CRC tumorigenesis in mice, mediated at least in part by its suppression of macrophages.
Natural products have been the most significant source of drugs and drug leads in history. Indeed, ∼74% of anticancer compounds are natural products or natural product-derived (44–47). With respect to the current study, there is a convincing body of literature that supports a beneficial effect of the natural product AG against CRC, including work from our group (21, 22). However, the specific bioactive component within AG that is mediating these beneficial effects has not been elucidated. Using the AOM/DSS model of CRC, we show for the first time that PA, the most abundant molecule in the HAG fraction of AG, at as low as 2.5 mg/kg, can improve clinical symptoms, reduce tumorigenesis, and enhance survival in mice. Furthermore, we demonstrate that PA improves crypt morphology, upregulates crucial tight junction and mucin genes, and promotes the abundance of mucin-producing goblet cells. Our findings are consistent with reports documenting that falcarinol (also referred to as PA), isolated from carrots, can prevent aberrant crypt foci in rats following AOM exposure without DSS (48, 49); however, there were no attempts to assess potential host mechanisms in the aforementioned studies. Thus, this present study provides novel insights into the potential of PA as a therapeutic agent to attenuate CRC tumorigenesis.
The AOM/DSS model presents similarities in both the morphological characteristics and clinical manifestations of human CRC, including disruptions to crypt architecture. In our study, PA appears to improve crypt morphology, specifically crypt shape/structure and distribution, throughout the colorectal epithelium. Another main feature of CRC exhibited in the AOM/DSS model is the dysfunction and breakdown of the intestinal epithelial barrier (50), which results in impaired cell renewal, increased gut permeability, and increased inflammation—all of which can promote tumorigenesis (39, 50). We show, for the first time, that PA upregulates essential tight junction genes, suggesting a protective effect against intestinal barrier dysfunction. This is relevant as impairment of the intestinal barrier has been associated with a reduction in the protective mucus layer, which constitutes a physical barrier between the intestinal epithelium and luminal contents (39). This layer is commonly diminished in CRC, resulting in increased gut permeability and translocation of pathogens (50). We demonstrate that PA enhances the abundance of goblet cells within the intestinal epithelium, which are the main source of mucins responsible for the production and preservation of the protective mucus layer (39). Furthermore, PA modulated genes associated with goblet cell mucin production. Specifically, PA upregulated mucin-2 (Muc2)—the only gel-forming mucin and the predominant component of the intestinal mucus layer that plays a major role in the protection of the gut barrier, regulation of microbiome homeostasis, and prevention of disease (40)—and downregulated Muc1, a well-known driver of CRC and marker of poor prognosis for CRC (41). Moreover, PA’s ability to significantly improve clinical symptoms commonly experienced in patients with CRC may be reflective of its restorative effect on intestinal barrier function.
The administration of DSS promotes chronic inflammation adding an inflammatory component to the AOM/DSS model as opposed to AOM alone. In support of PA’s anti-inflammatory effects, we demonstrate significant reductions in circulating monocytes, the precursors of macrophages, and important promoters of tumor initiation and evasion in CRC (51). Recruited inflammatory monocytes are converted to macrophages in the colonic environment and have been demonstrated to contribute to tumorigenesis in the AOM/DSS model (42). Indeed, high infiltration of macrophages is consistently related to poor prognosis and contributes to CRC tumor formation and progression (51). Furthermore, in support of a mechanistic role for macrophages in CRC, we have previously reported that the depletion of macrophages results in reduced tumorigenesis (42). In the current study, we show for the first time that PA reduces the relative abundance of macrophages within the LP of the colon. To confirm that these findings were not confounded by the fewer and smaller tumors in the colon following PA treatment, we repeated the assessment with tumors removed, and the reduction in the abundance of LP macrophages with PA remained. Furthermore, we performed gene expression analysis of both M1 and M2 macrophage markers in the colon and tumors and document that PA can decrease select M1 and M2 markers. The benefits of PA on macrophages were further supported by a reduction in pan macrophage marker F4/80 following immunofluorescence staining. Thus, our results support that PA alleviates CRC by decreasing the presence and activity of colonic macrophages.
To strengthen our in vivo findings, we used BMDMs to assess PA’s actions on macrophages in vitro. We demonstrate that PA suppresses protumor M2 macrophage polarization following an M2 stimulus. This decrease in M2 polarization with PA was consistent with an increase in M0 macrophages. Based on these findings, we next assessed the potential for PA to suppress M2 macrophages following stimulation with C26 CM. Indeed, PA was again effective at reducing M2 macrophage polarization but there were no effects on M1 macrophage polarization, further supporting PA’s potential to target protumoral macrophages in CRC. Interestingly however and inconsistent with this finding, we did document a decrease in gene expression of select M1 macrophage markers in the tumor environment with PA in vivo. This discrepancy between in vivo and in vitro findings in M1-related outcomes may be explained by the different models utilized, dosing of PA, and timing of assessments, among others. Of further importance, in vitro findings document that PA potently inhibited cell survival of C26 CRC cells compared with BMDMs with respective survival rates of 51% and 83% following 1 μM PA, documenting selectivity against the tumor cell line. It is important to note that the sensitivity of CRC cells to PA suggests that PA may have direct effects on CRC cells independent of its effects on macrophages. This is not surprising; indeed, the broad pleiotropic effects of natural compounds make them attractive antitumor agents given their ability to target many protumoral processes.
Although the primary focus of this study was PA’s effects on macrophages in CRC, we also examined neutrophils and T-regs given their documented role in promoting CRC. Neutrophils, the largest immune cell population in circulation, are important promoters of tumor initiation and evasion in CRC (36). We show that circulating neutrophils are increased with AOM/DSS and this increase is reduced by PA. This is consistent with a decrease in Ly6G positive cells in the colonic LP and Ly6G gene expression in the colon with PA. Similarly, T-regs are considered to play an important role in tumor immune escape by hampering effective antitumor immune responses (52). Our findings support an increase in the abundance of T-regs in the LP with AOM/DSS but there was no difference between VEH and PA groups. However, in the tumors we document a decrease in the expression of T-reg marker FoxP3 with PA. This inconsistency may be attributed to the tissues assessed (LP vs. tumor). Together with the macrophage findings, these data support a more favorable colonic immune profile with PA.
In the current study, we show for the first time that PA successfully improved symptomology and survival, and reduced tumorigenesis in a mouse model of CRC. This may be attributed to PA’s ability to significantly reduce proliferation and increase apoptosis in colonic tumors, which was demonstrated via immunohistochemistry using Ki67 and TUNEL, and RT-qPCR of proapoptotic Bax. In further support for its benefits in CRC, we demonstrate that PA improves crypt morphology, upregulates essential tight junction genes, and enhances the abundance and function of mucin-producing goblet cells. Moreover, we show that PA can target macrophages to improve the TME. In particular, our in vitro findings document PA’s ability to target M2, protumor macrophages. However, future studies are warranted to conclusively establish macrophages as a mechanism of PA’s actions in CRC.
Perspectives and Significance
Many of the current CRC therapies have limited efficacy and/or are associated with adverse side effects. Natural products, like PA, are attractive candidates for drug development given their broad pleiotropic effects (i.e., ability to target many protumoral processes). Indeed, in the current study, our findings support a benefit of PA on proliferation and apoptosis, on intestinal barrier function, on the immune profile, and on CRC cell survival, which was associated with reduced tumorigenesis and improved disease activity index. In summary, these findings show great promise for the development of PA as an agent to alleviate CRC and associated disease symptoms and improve the colonic and tumor environment.
DATA AVAILABILITY
The authors confirm that the data supporting the findings of this study are available within the article. Further information about the data is available upon reasonable request.
GRANTS
This research was supported by the National Institutes of Health (NIH) Grants No. NIH R01CA246809 (to E.A.M. and L.J.H.) and U01CA27297 (to E.A.M. and L.J.H.).
DISCLOSURES
No conflicts of interest, financial or otherwise, are declared by the authors.
AUTHOR CONTRIBUTIONS
S.J.M. and E.A.M. conceived and designed research; S.J.M., B.M.B., B.N.V., T.D.C., and A.R.H. performed experiments; S.J.M., B.M.B., B.N.V., T.D.C., A.R.H., and E.A.M. analyzed data; S.J.M. and E.A.M. interpreted results of experiments; S.J.M. prepared figures; S.J.M. and E.A.M. drafted manuscript; S.J.M., B.M.B., B.N.V., T.D.C., A.R.H., D.F., L.J.H., and E.A.M. edited and revised manuscript; S.J.M., B.M.B., B.N.V., T.D.C., A.R.H., D.F., L.J.H., and E.A.M. approved final version of manuscript.
REFERENCES
- 1. Sung H, Ferlay J, Siegel RL, Laversanne M, Soerjomataram I, Jemal A, Bray F. Global Cancer Statistics 2020: GLOBOCAN estimates of incidence and mortality worldwide for 36 cancers in 185 countries. CA Cancer J Clin 71: 209–249, 2021. doi: 10.3322/caac.21660. [DOI] [PubMed] [Google Scholar]
- 2. Chen C, Di Bartolomeo M, Corallo S, Strickler JH, Goyal L. Overcoming resistance to targeted therapies in gastrointestinal cancers: progress to date and progress to come. Am Soc Clin Oncol Educ Book 40: 161–173, 2020. doi: 10.1200/EDBK_280871. [DOI] [PubMed] [Google Scholar]
- 3.National Cancer Institute. SEER Stat Fact Sheets: Colon and Rectum Cancer (Online). National Cancer Institute, 2011. https://seer.cancer.gov/statfacts/html/colorect.html. [Google Scholar]
- 4. Taieb J, André T, Auclin E. Refining adjuvant therapy for non-metastatic colon cancer, new standards and perspectives. Cancer Treat Rev 75: 1–11, 2019. doi: 10.1016/j.ctrv.2019.02.002. [DOI] [PubMed] [Google Scholar]
- 5. Hale KE. Toxicities of chemotherapy. In: Principles of Critical Care (4th ed.), edited by Hall JB, Schmidt GA, Kress JP.. New York: McGraw-Hill Education, chapt. 95, 2015. [Google Scholar]
- 6. McCulloch M, Broffman M, van der Laan M, Hubbard A, Kushi L, Abrams DI, Gao J, Colford JM. Colon cancer survival with herbal medicine and vitamins combined with standard therapy in a whole-systems approach. Integr Cancer Ther 10: 240–259, 2011. doi: 10.1177/1534735411406539. [DOI] [PMC free article] [PubMed] [Google Scholar]
- 7. Islam MR, Akash S, Rahman MM, Nowrin FT, Akter T, Shohag S, Rauf A, Aljohani ASM, Simal-Gandara J. Colon cancer and colorectal cancer: prevention and treatment by potential natural products. Chem Biol Interact 368: 110170, 2022. doi: 10.1016/j.cbi.2022.110170. [DOI] [PubMed] [Google Scholar]
- 8. Huang X-M, Yang Z-J, Xie Q, Zhang Z-K, Zhang H, Ma J-Y. Natural products for treating colorectal cancer: a mechanistic review. Biomed Pharmacother 117: 109142, 2019. doi: 10.1016/j.biopha.2019.109142. [DOI] [PubMed] [Google Scholar]
- 9. Nielsen SR, Schmid MC. Macrophages as key drivers of cancer progression and metastasis. Mediators Inflamm 2017: 9624760, 2017. doi: 10.1155/2017/9624760. [DOI] [PMC free article] [PubMed] [Google Scholar]
- 10. Zhong X, Chen B, Yang Z. The role of tumor-associated macrophages in colorectal carcinoma progression. Cell Physiol Biochem 45: 356–365, 2018. [Erratum in Cell Physiol Biochem 48: 2659, 2018]. doi: 10.1159/000486816. [DOI] [PubMed] [Google Scholar]
- 11. Grigore A. Targeting Tumor-Associated Macrophages by Plant Compounds. IntechOpen, 2021. doi: 10.5772/intechopen.92298. [DOI] [Google Scholar]
- 12. Sougiannis AT, VanderVeen B, Chatzistamou I, Kubinak JL, Nagarkatti M, Fan D, Murphy EA. Emodin reduces tumor burden by diminishing M2-like macrophages in colorectal cancer. Am J Physiol Gastrointest Liver Physiol 322: G383–G395, 2022. doi: 10.1152/ajpgi.00303.2021. [DOI] [PMC free article] [PubMed] [Google Scholar]
- 13. Lu J-M, Yao Q, Chen C. Ginseng compounds: an update on their molecular mechanisms and medical applications. Curr Vasc Pharmacol 7: 293–302, 2009. doi: 10.2174/157016109788340767. [DOI] [PMC free article] [PubMed] [Google Scholar]
- 14. Szczuka D, Nowak A, Zakłos-Szyda M, Kochan E, Szymańska G, Motyl I, Blasiak J. American ginseng (Panax quinquefolium L.) as a source of bioactive phytochemicals with pro-health properties. Nutrients 11: 1041, 2019. doi: 10.3390/nu11051041. [DOI] [PMC free article] [PubMed] [Google Scholar]
- 15. Majeed F, Malik FZ, Ahmed Z, Afreen A, Afzal MN, Khalid N. Ginseng phytochemicals as therapeutics in oncology: recent perspectives. Biomed Pharmacother 100: 52–63, 2018. doi: 10.1016/j.biopha.2018.01.155. [DOI] [PubMed] [Google Scholar]
- 16. Li W, Zhao T, Wu D, Li J, Wang M, Sun Y, Hou S. Colorectal cancer in ulcerative colitis: mechanisms, surveillance and chemoprevention. Curr Oncol 29: 6091–6114, 2022. doi: 10.3390/curroncol29090479. [DOI] [PMC free article] [PubMed] [Google Scholar]
- 17. Cui X, Jin Y, Poudyal D, Chumanevich AA, Davis T, Windust A, Hofseth A, Wu W, Habiger J, Pena E, Wood P, Nagarkatti M, Nagarkatti PS, Hofseth L. Mechanistic insight into the ability of American ginseng to suppress colon cancer associated with colitis. Carcinogenesis 31: 1734–1741, 2010. doi: 10.1093/carcin/bgq163. [DOI] [PMC free article] [PubMed] [Google Scholar]
- 18. Jin Y, Hofseth AB, Cui X, Windust AJ, Poudyal D, Chumanevich AA, Matesic LE, Singh NP, Nagarkatti M, Nagarkatti PS, Hofseth LJ. American ginseng suppresses colitis through p53-mediated apoptosis of inflammatory cells. Cancer Prev Res (Phila) 3: 339–347, 2010. doi: 10.1158/1940-6207.CAPR-09-0116. [DOI] [PMC free article] [PubMed] [Google Scholar]
- 19. Jin Y, Kotakadi VS, Ying L, Hofseth AB, Cui X, Wood PA, Windust A, Matesic LE, Pena EA, Chiuzan C, Singh NP, Nagarkatti M, Nagarkatti PS, Wargovich MJ, Hofseth LJ. American ginseng suppresses inflammation and DNA damage associated with mouse colitis. Carcinogenesis 29: 2351–2359, 2008. doi: 10.1093/carcin/bgn211. [DOI] [PMC free article] [PubMed] [Google Scholar]
- 20. Poudyal D, Cui X, Mai Le P, Davis T, Hofseth AB, Jin Y, Chumanevich AA, Wargovich MJ, Nagarkatti M, Nagarkatti PS, Windust A, Hofseth LJ. A limited role of p53 on the ability of a hexane fraction of american ginseng to suppress mouse colitis. J Biomed Biotechnol 2012: 785739, 2012. doi: 10.1155/2012/785739. [DOI] [PMC free article] [PubMed] [Google Scholar]
- 21. Poudyal D, Le PM, Davis T, Hofseth AB, Chumanevich A, Chumanevich AA, Wargovich MJ, Nagarkatti M, Nagarkatti PS, Windust A, Hofseth LJ. A hexane fraction of american ginseng suppresses mouse colitis and associated colon cancer: anti-inflammatory and proapoptotic mechanisms. Cancer Prev Res (Phila) 5: 685–696, 2012. doi: 10.1158/1940-6207.CAPR-11-0421. [DOI] [PMC free article] [PubMed] [Google Scholar]
- 22. Poudyal D, Cui X, Le PM, Hofseth AB, Windust A, Nagarkatti M, Nagarkatti PS, Schetter AJ, Harris CC, Hofseth LJ. A key role of microrna-29b for the suppression of colon cancer cell migration by American ginseng. PLoS One 8: e75034, 2013. doi: 10.1371/journal.pone.0075034. [DOI] [PMC free article] [PubMed] [Google Scholar]
- 23. Chaparala A, Poudyal D, Tashkandi H, Witalison EE, Chumanevich AA, Hofseth JL, Nguyen I, Hardy O, Pittman DL, Wyatt MD, Windust A, Murphy EA, Nagarkatti M, Nagarkatti P, Hofseth LJ. Panaxynol, a bioactive component of American ginseng, targets macrophages and suppresses colitis in mice. Oncotarget 11: 2026–2036, 2020. doi: 10.18632/oncotarget.27592. [DOI] [PMC free article] [PubMed] [Google Scholar]
- 24. Chaparala A, Tashkandi H, Chumanevich AA, Witalison EE, Windust A, Cui T, Nagarkatti M, Nagarkatti P, Hofseth LJ. Molecules from American ginseng suppress colitis through nuclear factor erythroid-2-related factor 2. Nutrients 12: 1850, 2020. doi: 10.3390/nu12061850. [DOI] [PMC free article] [PubMed] [Google Scholar]
- 25. Grotto D, Zied E. The standard American Diet and its relationship to the health status of Americans. Nutr Clin Pract 25: 603–612, 2010. doi: 10.1177/0884533610386234. [DOI] [PubMed] [Google Scholar]
- 26. Enos RT, Davis JM, Velázquez KT, McClellan JL, Day SD, Carnevale KA, Murphy EA. Influence of dietary saturated fat content on adiposity, macrophage behavior, inflammation, and metabolism: composition matters. J Lipid Res 54: 152–163, 2013. doi: 10.1194/jlr.M030700. [DOI] [PMC free article] [PubMed] [Google Scholar]
- 27. Warden CH, Fisler JS. Comparisons of diets used in animal models of high-fat feeding. Cell Metab 7: 277, 2008. doi: 10.1016/j.cmet.2008.03.014. [DOI] [PMC free article] [PubMed] [Google Scholar]
- 28. Kodani T, Rodriguez-Palacios A, Corridoni D, Lopetuso L, Di Martino L, Marks B, Pizarro J, Pizarro T, Chak A, Cominelli F. Flexible colonoscopy in mice to evaluate the severity of colitis and colorectal tumors using a validated endoscopic scoring system. J Vis Exp 80: e50843, 2013. doi: 10.3791/50843. [DOI] [PMC free article] [PubMed] [Google Scholar]
- 29. Kubinak JL, Petersen C, Stephens WZ, Soto R, Bake E, O'Connell RM, Round JL. MyD88 signaling in T cells directs IgA-mediated control of the microbiota to promote health. Cell Host Microbe 17: 153–163, 2015. doi: 10.1016/j.chom.2014.12.009. [DOI] [PMC free article] [PubMed] [Google Scholar]
- 30. Enos RT, Velázquez KT, McClellan JL, Cranford TL, Walla MD, Murphy EA. Lowering the dietary omega-6: omega-3 does not hinder nonalcoholic fatty-liver disease development in a murine model. Nutr Res 35: 449–459, 2015. doi: 10.1016/j.nutres.2015.04.003. [DOI] [PMC free article] [PubMed] [Google Scholar]
- 31. McDonald SJ, VanderVeen BN, Bullard BM, Cardaci TD, Madero SS, Chatzistamou I, Fan D, Murphy EA. Surgical wounding enhances protumor macrophage responses and accelerates tumor growth and lung metastasis in a triple negative breast cancer mouse model. Physiol Rep 10: e15497, 2022. doi: 10.14814/phy2.15497. [DOI] [PMC free article] [PubMed] [Google Scholar]
- 32. Rizzardi AE, Johnson AT, Vogel RI, Pambuccian SE, Henriksen J, Skubitz AP, Metzger GJ, Schmechel SC. Quantitative comparison of immunohistochemical staining measured by digital image analysis versus pathologist visual scoring. Diagn Pathol 7: 42, 2012. doi: 10.1186/1746-1596-7-42. [DOI] [PMC free article] [PubMed] [Google Scholar]
- 33. Cranford TL, Velázquez KT, Enos RT, Sougiannis AT, Bader JE, Carson MS, Bellone RR, Chatzistamou I, Nagarkatti M, Murphy EA. Effects of high fat diet-induced obesity on mammary tumorigenesis in the PyMT/MMTV murine model. Cancer Biol Ther 20: 487–496, 2019. doi: 10.1080/15384047.2018.1537574. [DOI] [PMC free article] [PubMed] [Google Scholar]
- 34. Amend SR, Valkenburg KC, Pienta KJ. Murine hind limb long bone dissection and bone marrow isolation. J Vis Exp 110: 53936, 2016. doi: 10.3791/53936. [DOI] [PMC free article] [PubMed] [Google Scholar]
- 35. Ying W, Cheruku PS, Bazer FW, Safe SH, Zhou B. Investigation of macrophage polarization using bone marrow derived macrophages. J Vis Exp 76: 50323, 2013. doi: 10.3791/50323. [DOI] [PMC free article] [PubMed] [Google Scholar]
- 36. Mizuno R, Kawada K, Itatani Y, Ogawa R, Kiyasu Y, Sakai Y. The role of tumor-associated neutrophils in colorectal cancer. Int J Mol Sci 20: 529, 2019. doi: 10.3390/ijms20030529. [DOI] [PMC free article] [PubMed] [Google Scholar]
- 37. Mazaki J, Katsumata K, Kasahara K, Tago T, Wada T, Kuwabara H, Enomoto M, Ishizaki T, Nagakawa Y, Tsuchida A. Neutrophil-to-lymphocyte ratio is a prognostic factor for colon cancer: a propensity score analysis. BMC Cancer 20: 922, 2020. doi: 10.1186/s12885-020-07429-5. [DOI] [PMC free article] [PubMed] [Google Scholar]
- 38. Grondin JA, Kwon YH, Far PM, Haq S, Khan WI. Mucins in intestinal mucosal defense and inflammation: learning from clinical and experimental studies. Front Immunol 11: 2054, 2020. doi: 10.3389/fimmu.2020.02054. [DOI] [PMC free article] [PubMed] [Google Scholar]
- 39. Chelakkot C, Ghim J, Ryu SH. Mechanisms regulating intestinal barrier integrity and its pathological implications. Exp Mol Med 50: 1–9, 2018. doi: 10.1038/s12276-018-0126-x. [DOI] [PMC free article] [PubMed] [Google Scholar]
- 40. Liu Y, Yu X, Zhao J, Zhang H, Zhai Q, Chen W. The role of MUC2 mucin in intestinal homeostasis and the impact of dietary components on MUC2 expression. Int J Biol Macromol 164: 884–891, 2020. doi: 10.1016/j.ijbiomac.2020.07.191. [DOI] [PubMed] [Google Scholar]
- 41. Li C, Liu T, Yin L, Zuo D, Lin Y, Wang L. Prognostic and clinicopathological value of MUC1 expression in colorectal cancer: a meta-analysis. Medicine (Baltimore) 98: e14659, 2019. doi: 10.1097/MD.0000000000014659. [DOI] [PMC free article] [PubMed] [Google Scholar]
- 42. Bader JE, Enos RT, Velázquez KT, Carson MS, Nagarkatti M, Nagarkatti PS, Chatzistamou I, Davis JM, Carson JA, Robinson CM, Murphy EA. Macrophage depletion using clodronate liposomes decreases tumorigenesis and alters gut microbiota in the AOM/DSS mouse model of colon cancer. Am J Physiol Gastrointest Liver Physiol 314: G22–G31, 2018. doi: 10.1152/ajpgi.00229.2017. [DOI] [PMC free article] [PubMed] [Google Scholar]
- 43. Olguín JE, Medina-Andrade I, Rodríguez T, Rodríguez-Sosa M, Terrazas LI. Relevance of regulatory T cells during colorectal cancer development. Cancers 12: 1888, 2020. doi: 10.3390/cancers12071888. [DOI] [PMC free article] [PubMed] [Google Scholar]
- 44. Tan G, Gyllenhaal C, Soejarto DD. Biodiversity as a source of anticancer drugs. Curr Drug Targets 7: 265–277, 2006. doi: 10.2174/138945006776054942. [DOI] [PubMed] [Google Scholar]
- 45. Coseri S. Natural products and their analogues as efficient anticancer drugs. Mini Rev Med Chem 9: 560–571, 2009. doi: 10.2174/138955709788167592. [DOI] [PubMed] [Google Scholar]
- 46. Deng L-J, Qi M, Li N, Lei Y-H, Zhang D-M, Chen J-X. Natural products and their derivatives: Promising modulators of tumor immunotherapy. J Leukoc Biol 108: 493–508, 2020. doi: 10.1002/JLB.3MR0320-444R. [DOI] [PMC free article] [PubMed] [Google Scholar]
- 47. Seca AML, Pinto D. Plant secondary metabolites as anticancer agents: successes in clinical trials and therapeutic application. Int J Mol Sci 19: 263, 2018. doi: 10.3390/ijms19010263. [DOI] [PMC free article] [PubMed] [Google Scholar]
- 48. Kobaek-Larsen M, El-Houri RB, Christensen LP, Al-Najami I, Fretté X, Baatrup G. Dietary polyacetylenes, falcarinol and falcarindiol, isolated from carrots prevents the formation of neoplastic lesions in the colon of azoxymethane-induced rats. Food Funct 8: 964–974, 2017. doi: 10.1039/C7FO00110J. [DOI] [PubMed] [Google Scholar]
- 49. Kobaek-Larsen M, Nielsen DS, Kot W, Krych Ł, Christensen LP, Baatrup G. Effect of the dietary polyacetylenes falcarinol and falcarindiol on the gut microbiota composition in a rat model of colorectal cancer. BMC Res Notes 11: 411, 2018. doi: 10.1186/s13104-018-3527-y. [DOI] [PMC free article] [PubMed] [Google Scholar]
- 50. Yu LC-H. Microbiota dysbiosis and barrier dysfunction in inflammatory bowel disease and colorectal cancers: exploring a common ground hypothesis. J Biomed Sci 25: 79, 2018. doi: 10.1186/s12929-018-0483-8. [DOI] [PMC free article] [PubMed] [Google Scholar]
- 51. Wang H, Tian T, Zhang J. Tumor-associated macrophages (TAMs) in colorectal cancer (CRC): from mechanism to therapy and prognosis. Int J Mol Sci 22: 8470, 2021. doi: 10.3390/ijms22168470. [DOI] [PMC free article] [PubMed] [Google Scholar]
- 52. Aristin Revilla S, Kranenburg O, Coffer PJ. Colorectal cancer-infiltrating regulatory T cells: functional heterogeneity, metabolic adaptation, and therapeutic targeting. Front Immunol 13: 903564, 2022. doi: 10.3389/fimmu.2022.903564. [DOI] [PMC free article] [PubMed] [Google Scholar]
Associated Data
This section collects any data citations, data availability statements, or supplementary materials included in this article.
Data Availability Statement
The authors confirm that the data supporting the findings of this study are available within the article. Further information about the data is available upon reasonable request.