Abstract
The liver, as a crucial metabolic organ, undergoes significant pathological changes during the aging process, which can have a profound impact on overall health. To gain a comprehensive understanding of these alterations, we employed data-driven approaches, along with biochemical methods, histology, and immunohistochemistry techniques, to systematically investigate the effects of aging on the liver. Our study utilized a well-established rat aging model provided by the National Institute of Aging. Systems biology approaches were used to analyze genome-wide transcriptomics data from liver samples obtained from young (4–5 months old) and aging (20–21 months old) Fischer 344 rats. Our findings revealed pathological changes occurring in various essential biological processes in aging livers. These included mitochondrial dysfunction, increased oxidative/nitrative stress, decreased NAD + content, impaired amino acid and protein synthesis, heightened inflammation, disrupted lipid metabolism, enhanced apoptosis, senescence, and fibrosis. These results were validated using independent datasets from both human and rat aging studies. Furthermore, by employing co-expression network analysis, we identified novel driver genes responsible for liver aging, confirmed our findings in human aging subjects, and pointed out the cellular localization of the driver genes using single-cell RNA-sequencing human data. Our study led to the discovery and validation of a liver-specific gene, proprotein convertase subtilisin/kexin type 9 (PCSK9), as a potential therapeutic target for mitigating the pathological processes associated with aging in the liver. This finding envisions new possibilities for developing interventions aimed to improve liver health during the aging process.
Supplementary Information
The online version contains supplementary material available at 10.1007/s11357-023-00928-w.
Keywords: Systems biology, Network biology, Transcriptomics, PCSK9, Liver, Metabolism, Aging, Rat model
Introduction
The global aging population is on the rise, with the United Nations estimating that there were 727 million individuals aged over 65 years old in 2020, a number projected to double by 2030 [1]. This increase in life expectancy can be attributed to improved living conditions and advancements in medical technologies. However, aging remains a significant risk factor for numerous diseases, placing a strain on healthcare systems [2]. Aging is characterized by declining functions of organs, metabolism, and other bodily functions [3], including the liver [4]. Liver is a key metabolic organ and its pathological alterations during aging may profoundly affect overall health and other organ systems [5]. Furthermore, the aging population is more susceptible to acute liver injuries and chronic diseases [6] such as fatty liver diseases and fibrosis. Consequently, identifying therapeutic targets to attenuate or reverse the aging process remains a challenging task.
Data-driven and systems biology approaches have emerged as powerful tools for unraveling complex biological phenomena. These approaches have been successfully employed to elucidate the molecular profiles of aging using various omics data, including transcriptomics [7, 8], metabolomics [9, 10], and proteomics [11], from various tissues and blood samples. They have also facilitated the discovery of new therapeutic targets for complex diseases such as non-alcoholic fatty liver diseases [12] and various types of cancer [13, 14]. Specifically, co-expression network analysis [15] has been proven to be a robust method for identifying driver key analytes in systemic diseases [16, 17].
In this study, we capitalized on the versatility of data-driven approaches to systematically identify novel biomarkers and treatment targets for liver aging. We performed a comprehensive transcriptomics analysis combined with histology and biochemical approaches to uncover the underlying processes associated with liver aging, utilizing an established rat aging model provided by the National Institute of Aging (NIA). We validated our model using two independent, rat and human, public datasets. Furthermore, we employed co-expression network analysis to identify key processes and genes that hold potential as candidate therapeutic targets for liver aging. Finally, we assessed the proposed target using population-based transcriptomics data from the aging group. By leveraging these sophisticated approaches, we aim to enhance our understanding of liver aging and contribute to the development of targeted interventions that can alleviate the detrimental effects of aging on liver health.
Results
Differential expression analysis shows significant gene expression changes associated with aging in the liver
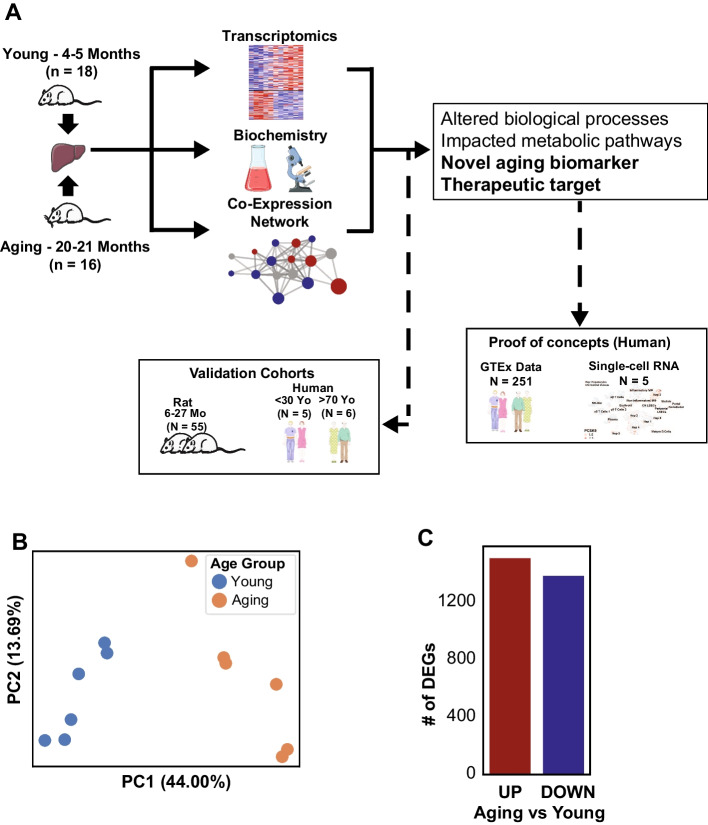
We generated transcriptomics data from liver tissue from a total of 12 Fischer F344 rats, with 6 rats from each young (4–5 months) and aged (20–21 months) group (Fig. 1A). Principal component analysis (PCA) showed a close clustering within each group and significant separation between both groups along the X-axis, which explained the highest variation of the data (Fig. 1B). This confirmed our hypothesis that there were significant changes in the transcriptomics landscape in the liver during the aging process. Subsequently, we identified differentially expressed genes (DEGs) in the aging rats compared to the young group. We found 1514 up-regulated and 1390 down-regulated DEGs in the aging group (Fig. 1C, Supplementary Table 1).
Fig. 1.
A Study design. B Principal component analysis (PCA) showed distinct separation between the young and aging populations based on the transcriptomic profiles. C Number of differentially expressed genes (DEGs, FDR < 0.05) confirmed the significant differences between the population groups, with 1514 up- and 1390 down-regulated genes in aging compared to young. The figure was partly generated using Servier Medical Art, provided by Servier, licensed under a Creative Commons Attribution 3.0 unported license
Functional analysis reveals down-regulation of mitochondrial-related functions and up-regulation of cell death, senescence, and oxidative stress
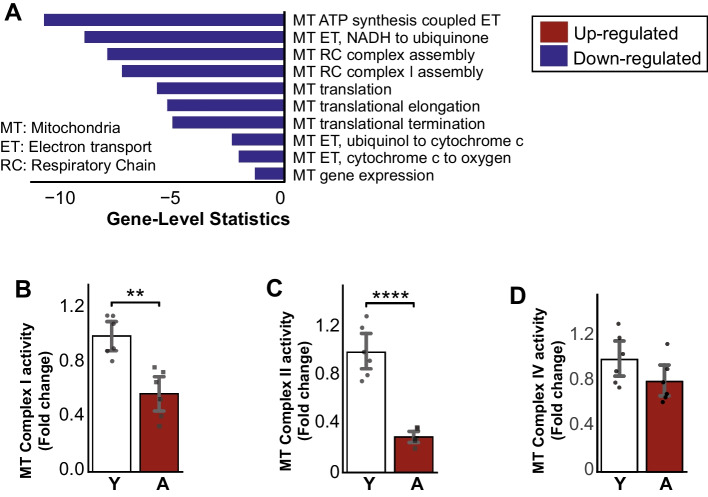
Subsequently, we performed a functional analysis with gene-set enrichment analysis (GSEA) to reveal the related altered functions based on changes in the transcriptome (Supplementary Table 1) with gene ontology biological processes (GO-BP) [18, 19] and KEGG Pathways [20–22]. We identified mitochondrial-related functions, including mitochondrial ATP synthesis electron transport, respiratory chain complex assembly, mitochondrial gene expression, and oxidative phosphorylation significantly decreased in the aged group compared to the young (Fig. 2A, Supplementary Table 1). Several down-regulated genes (Sdha, Igf1, and Bco2) related to mitochondria based on GO-BP were among the top 5% of most significant DEGs (Supplementary Table 1). To confirm these findings, we measured mitochondrial activity for complex I, II, and IV in the liver from the validation cohort (12 rats) and found significant decreases in all measured mitochondrial complex activities (Fig. 2B–D).
Fig. 2.
A Enrichment analysis of known aging-related processes showing down-regulation of mitochondrial-related processes in aging populations. B, C Mitochondrial complex I and II decreased significantly in the aging liver, D where complex IV showed a decreasing trend (n = 6 males/group). Data is represented as mean ± SEM. *0.01 < P-value ≤ 0.05, **0.001 < P-value ≤ 0.01, ***0.0001 < P-value ≤ 0.001, ****P-value ≤ 0.0001
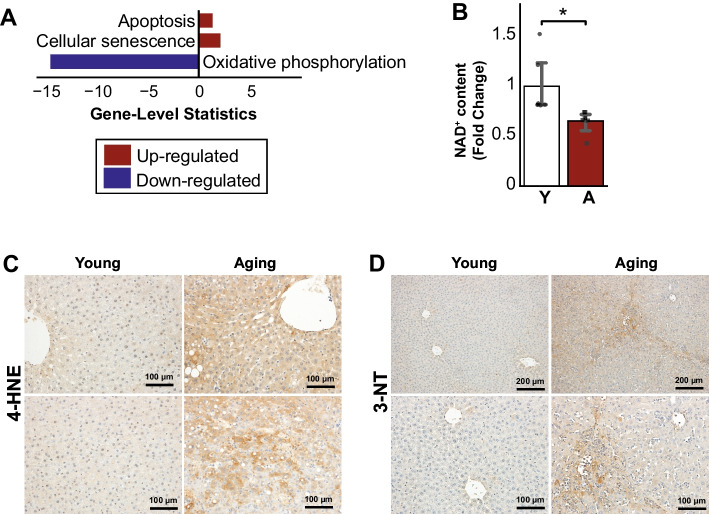
Furthermore, we found down-regulation of oxidative phosphorylation and up-regulation of processes associated with programmed cell death and senescence in the aged group (Fig. 3A). Similarly, functions related to oxidative stress, such as positive regulation of reactive oxygen species (ROS) and nitric oxide (NO) biosynthesis and metabolic process, were also up-regulated in aging (Supplementary Table 1). Among others, the top 5% of DEGs related to those were up-regulated, including Bmp7, Cd36, Hmox1, and Sirpa (Supplementary Table 1). We measured the liver NAD+ content and found that it was significantly decreased in aging rats compared to young (Fig. 3B). Consistently with the increased oxidative stress in the aging livers, we observed an increase of 4-hydroxynonenal (4-HNE, a stable byproduct of lipid peroxidation and a well-established marker of oxidative stress) and 3-Nitrotyrosine (3-NT, an oxidative/nitrative stress marker) staining in the liver of aging rats compared to young ones (Fig. 3C, D).
Fig. 3.
A Enrichment analysis of known aging-related processes showing down-regulation of oxidative phosphorylation and up-regulation of apoptosis, senescence, and angiogenesis in aging populations. B NAD+ decreased significantly in the aging liver (n = 6 males/group). C Liver histology showed an increased formation of 4-hydroxynonenal (4-HNE, a stable byproduct of lipid peroxidation) and D 3-Nitrotyrosine (3-NT, an oxidative/nitrative stress of proteins marker) in aging compared to young. Data is represented as mean ± SEM. *0.01 < P-value ≤ 0.05, **0.001 < P-value ≤ 0.01, ***0.0001 < P-value ≤ 0.001, ****P-value ≤ 0.0001
Aging increases inflammation, immune responses, and fibrosis, and alters metabolic functions in the liver
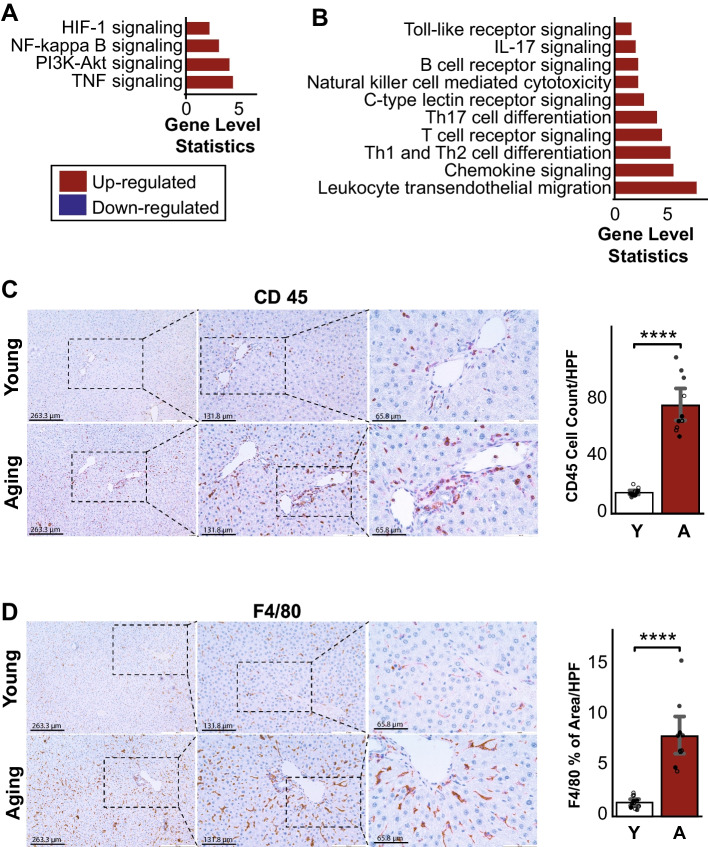
We found significantly enhanced inflammatory responses in the aging livers, including TNF and NF-Kappaβ signaling pathways and response and regulation of neutrophils and cytokines (Fig. 4A, Supplementary Table 1). We also observed up-regulation of immune system-related pathways, such as B- and T-cell receptor signaling, Th1 and Th2 cell differentiation, chemokine signaling, and leukocyte transendothelial migration (Fig. 4B, Supplementary Table 1). IL-17 signaling pathway was also up-regulated in the aged group. In line with this, we observed the increase of CD45 and F4/80 positive inflammatory cell infiltration in the livers of aged rats compared to young ones (Fig. 4C, D). Furthermore, we observed that molecular functions that were known to contribute to the fibrosis process [23], including cell adhesion and extracellular matrix receptor and disassembly, increased during the aging process in the liver (Fig. 5A). This was confirmed by increased Sirius red and Masson’s trichrome staining (markers of collagen deposition) in livers from aging compared to young rats (Fig. 5B, C).
Fig. 4.
A Enrichment analysis with KEGG pathways showed up-regulation of pathways associated with the inflammation response, B immune systems, and signaling in aging. C Histology of the inflammatory markers, CD45 and D F4/80, showed significantly higher inflammation in aging mice compared to young (n young = 6 males and 6 females, n aging = 6 males and 4 females). Data is represented as mean ± SEM. *0.01 < P-value ≤ 0.05, **0.001 < P-value ≤ 0.01, ***0.0001 < P-value ≤ 0.001, ****P-value ≤ 0.0001
Fig. 5.
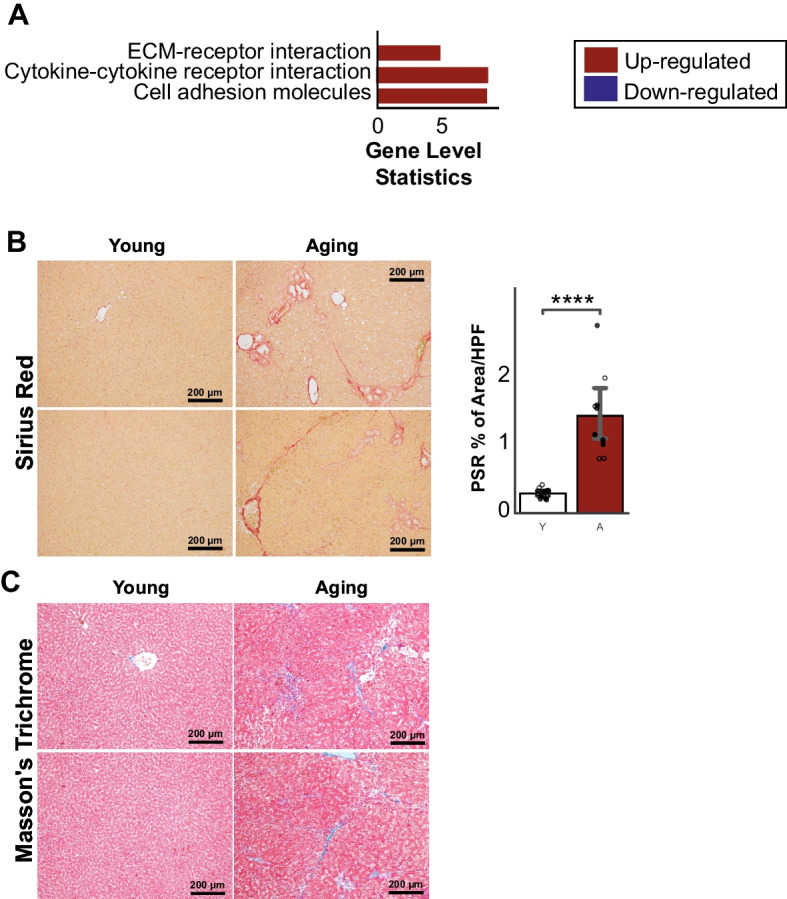
A KEGG pathways associated with fibroproliferative processes were up-regulated in aging rats. B Sirius red and C Masson’s trichrome histology validated the significant increase of fibrosis in aging rats compared to young (n young = 6 males and 6 females, n aging = 6 males and 4 females). Data is represented as mean ± SEM. *0.01 < P-value ≤ 0.05, **0.001 < P-value ≤ 0.01, ***0.0001 < P-value ≤ 0.001, ****P-value ≤ 0.0001. HPF: High-Field Power
Alteration of metabolic activities in aging livers
Functional analysis also identified that pathways and processes related to several important metabolic functions in the liver were significantly down-regulated (Supplementary Table 1). The activity of amino acid metabolism pathways, such as branched-chain amino acid (valine, leucine, and isoleucine degradation), aromatic amino acid (tryptophan, phenylalanine, and tyrosine), and other essential amino acid (histidine, methionine, and arginine) metabolic pathways, decreased in the aged group compared to young. Other amino acid pathways, such as cysteine and serine, glycine, and threonine metabolic pathways, were also shown to be down-regulated. We also observed significant down-regulation in the gene level for other important metabolic pathways, such as glyoxylate and dicarboxylate metabolism, ascorbate and aldarate metabolism, and the TCA cycle (Supplementary Table 1).
To deeper study the metabolic changes in the aging process, we performed reporter metabolite analysis to understand the effect of the transcriptome landscape changes on the metabolite level. To do this, we extracted the metabolite-gene relationship from the rat genome-scale metabolic model, specifically Rat-GEM 1.2.0 from the Metabolic Atlas website (https://metabolicatlas.org/) [24], by parsing it using CobraPy [25], and we found 204 altered metabolites (down-regulated) (Supplementary Table 1). Among the top down-regulated reporter metabolites (Supplementary Table 1), we observed several metabolites related to mitochondria (such as ubiquinol, ubiquinone, ferricytochrome C, and ferrocytochrome C) and NAD+. Moreover, on top of metabolites related to amino acid metabolism, we also discovered many altered metabolites related to glutathione metabolism, including GSH and several 5-S-glutathionyl metabolite forms. This supports our finding functional analysis results with KEGG, where we found the amino acid and glutathione metabolism pathways, important players in the aging process [26], to be down-regulated.
Aging increases lipid and cholesterol accumulation in the liver
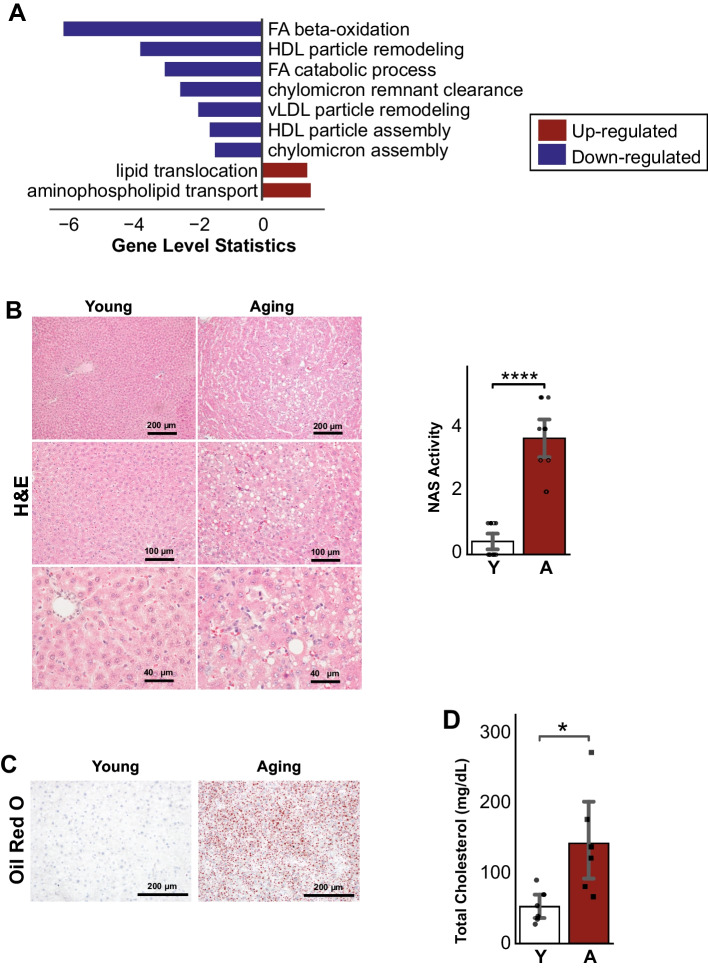
Interestingly, the functional analysis showed up-regulation in fructose and mannose metabolic pathways and also processes related to retinol metabolism (Supplementary Table 1). The increased level of fructose has been linked to the increase in lipogenesis in the liver [27, 28]. Furthermore, we observed that biological processes related to fatty acid beta-oxidation (including peroxisome) and catabolic process and lipoprotein (HDL, LDL, TRL) particle remodeling were found to be down-regulated (Fig. 6A, Supplementary Table 1). In our reporter metabolite analysis, we also found several alterations of metabolites related to lipid and fatty acid metabolism and oxidation, such as NAD, NADH, NADP, NADPH, FAD, FADH2, and metabolites from the fatty-acyls family (Supplementary Table 1). The hepatic hematoxylin-eosin (H&E), NAS Score, and Oil Red O staining indicated increased inflammation and accumulation of lipid deposits in the aging livers compared to young (Fig. 6B, C), which is in line with impaired lipid and cholesterol metabolism in the aging liver. Finally, to confirm the increase of cholesterol in aging populations, we measured the serum cholesterol level of the young and aging rats from the validation cohort and found a significant increase in the aging rats (Fig. 6D).
Fig. 6.
A Lipid and cholesterol-related pathways showed decreased activity for fatty-acid beta-oxidation, cholesterol catabolism, and lipoproteins particle remodeling and assembly and up-regulation of processes related to lipid translocation. B Hematoxylin-eosin (H&E) staining revealed structural changes and C Oil Red O staining showed increased lipid deposits in aged liver sections when compared to young (n young = 6 males and 6 females, n aging = 6 males and 4 females). D Serum total cholesterol also increased significantly in aging rats (n = 6 males/group). Data is represented as mean ± SEM. *0.01 < P-value ≤ 0.05, **0.001 < P-value ≤ 0.01, ***0.0001 < P-value ≤ 0.001, ****P-value ≤ 0.0001
Validation with public datasets
To confirm our findings, we collected RNA-seq data from two cohorts of independent publicly available data. The first cohort was from a multi-tissue aging study in 6–27-month Sprague-Dawley rats [7]. We selected their liver data and calculated the DEGs (FDR < 0.05, Supplementary Table 2) between the aged rat (24 and 27 months, independently) with the youngest group (6 months). We found that 1474 (~ 50%) of our DEGs were validated in at least 24 or 27 months, with 983 DEGs of them being in both (Fig. 7A). Moreover, we checked the trend of expression of those 1474 DEGs in all samples in the study and found that the genes followed up- or down-regulation patterns throughout their lifetime (Fig. 7B). Furthermore, to check the relevance of our model in humans, we used the second validation cohort from human subjects [29]. We selected the samples with no hepatosteatosis and aged below 30 years old (young) and above 70 years old (aging) and calculated their DEGs (P-value < 0.05, Supplementary Table 2). We found an intersection of 292 DEGs between this and our data (Fig. 7C). Like the rat cohort, we checked the validated DEGs in their expression level and found that they consistently follow the up- or down-regulation pattern across subjects (Fig. 7D). We also checked the functions of the up- and down-regulation genes in humans and found that they are associated with important functions that we highlighted in the previous section, including the up-regulation of pathways related to inflammatory response and down-regulated of amino acid metabolism and oxidative phosphorylation (Fig. 7E, F). This proved that our aging model was able to capture the important aging genes and translatable to humans.
Fig. 7.
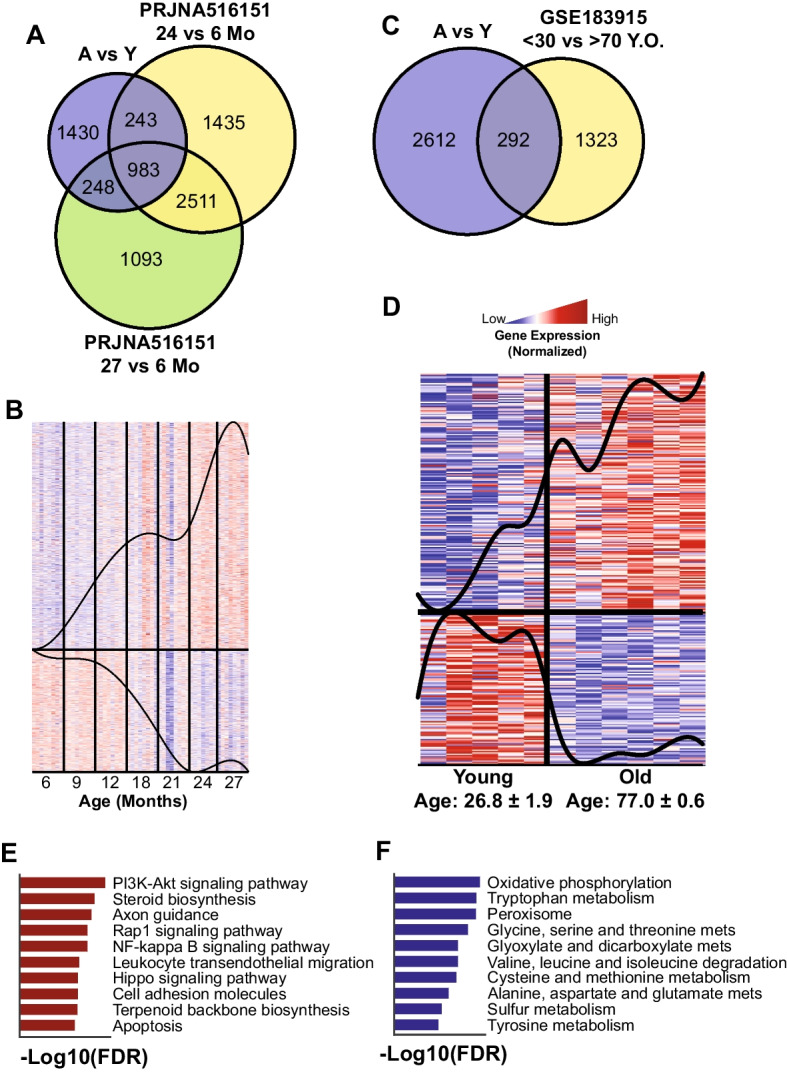
Validation with independent cohorts (rat and human). A Venn diagram showed significant intersections of our DEGs with independent rat liver aging data (PRJNA516151). B Expression of the 1474 intersected genes in PRJNA516151 revealed their trends in the aging process. C Venn diagram showed a significant intersection of our DEGs with independent human liver aging data (GSE183915). D Expression of the 235 intersected genes in GSE183915 revealed their trends in the aging process. E, F Top 10 enriched functions of the up-regulated and down-regulated genes in GSE183915
Co-expression network analysis reveals important clusters and mechanisms in the aging process
Co-expression network (CN) analysis has been used widely to study the functional relationship between genes in both healthy and disease states [30]. Here, we generate a liver aging CN to reveal the gene-gene functional relationships during the aging process in the liver. We filtered genes with the lowest 25% varying genes based on the FPKM (fragments per kilobase of exon per million mapped fragments) values and generated the network using the same method as described in previously published articles [15]. The full network can be found in Supplementary Table 3. For the downstream analysis, we selected the top 1% positively correlated gene pairs with FDR < 0.05 [17]. Furthermore, to better understand the network structure, we split the network into 16 clusters (with > 30 genes in each cluster, Fig. 8A, Supplementary Table 3) by maximizing their modularity scores using the Leiden clustering algorithm [31]. Moreover, we identified the GO-BP and KEGG pathways associated with each cluster to understand their role at the functional level (Supplementary Table 3).
Fig. 8.
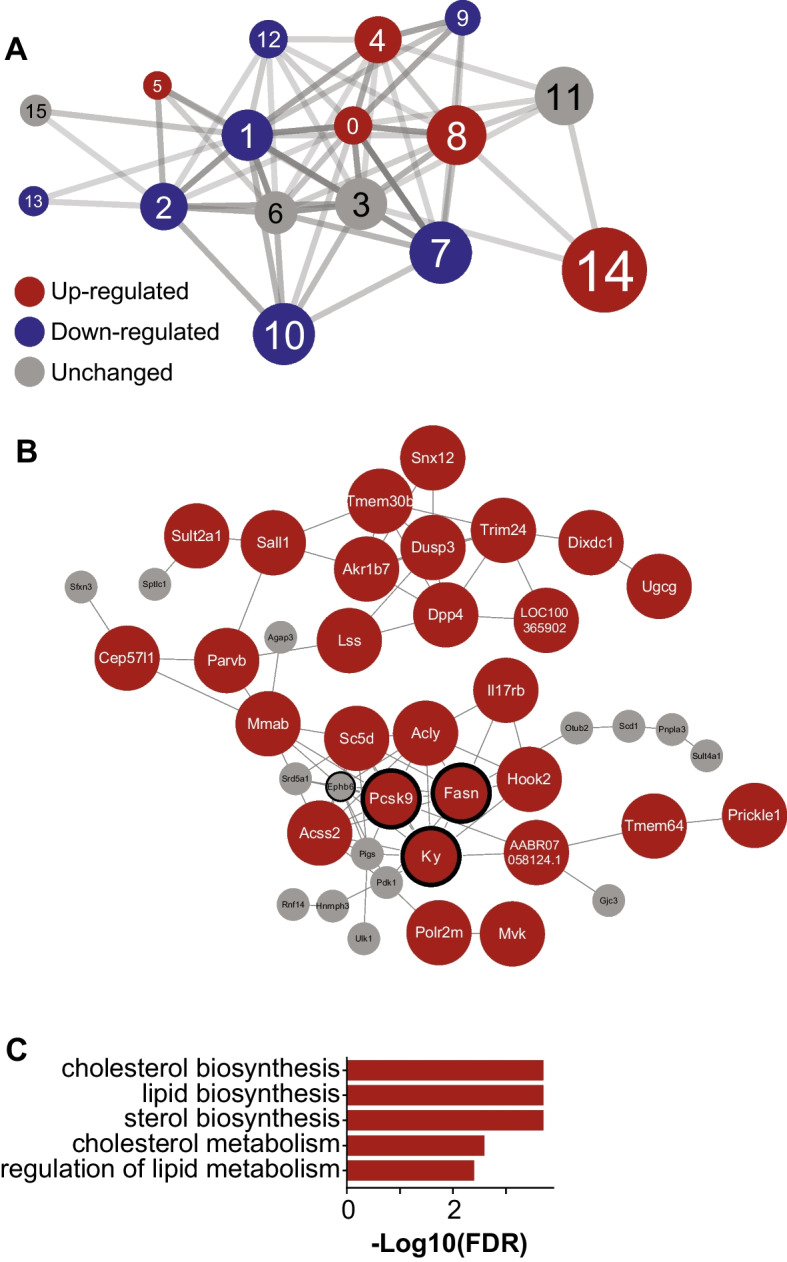
Gene co-expression network analysis in the liver. A Sixteen clusters were detected with 10 down-regulated clusters (blue) and 6 up-regulated clusters (red). The size of the clusters denoted their centrality (average clustering coefficient) in the network. B Genes in cluster 14, the most central cluster in the network, with Pcsk9, Ky, Fasn, and Ephb6 as the central genes in the cluster (bold ring) (red: up-regulated, white: unchanged). C Top 5 enriched functions of cluster 14 revealed their role in cholesterol and lipid metabolism
Among 16 clusters, we identified cluster 14 as the most central cluster because it has the highest average clustering coefficient [32] (Supplementary Table 3). Cluster 14 consisted of 43 genes including 29 significantly up-regulated genes in the aged group (Fig. 8B). The majority of the genes in this cluster were associated with cholesterol and lipid metabolism (Fig. 8C), and the biosynthesis of acyl, acetyl, and fatty-acyl-CoA (Supplementary Table 3). Furthermore, based on the degree centrality analysis, we found Pcsk9, Ky, Fasn, and Ephb6 as the central genes in this cluster and the network. All those genes were significantly up-regulated in aging, except Ephb6 (up-regulated, but not significant). The CN analysis and serum measurement strengthened our findings from functional and reporter metabolite analysis, where we found that metabolites and metabolic pathways and processes related to lipid and cholesterol metabolism played important roles in the aging process in the liver.
Higher PCSK9 levels intensify the adverse effect of liver aging in human
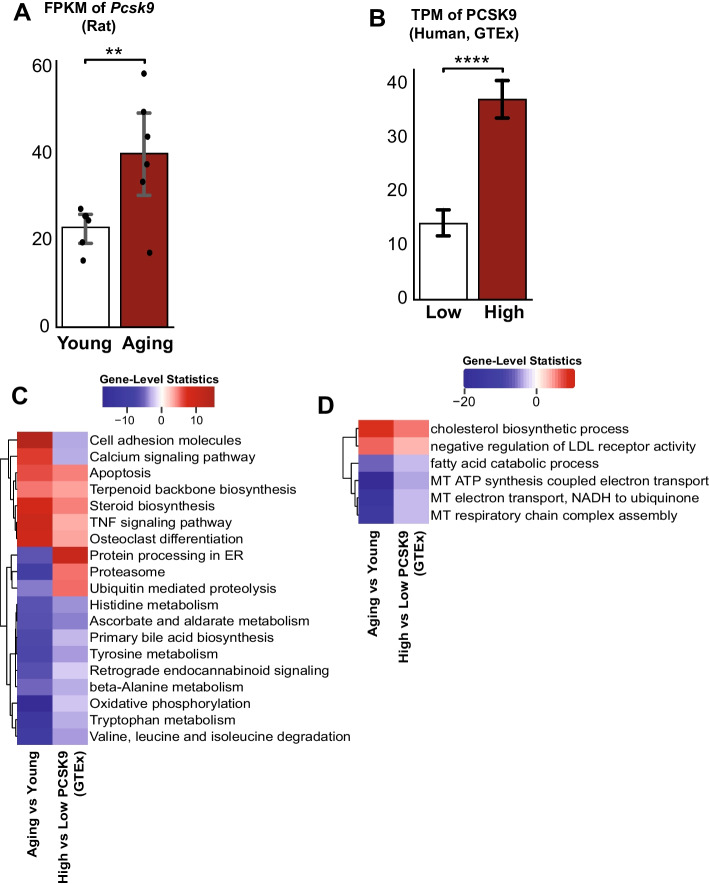
To find novel biomarkers for liver aging, we decided to focus on the genes in the most central cluster in the network, cluster 14 (Supplementary Table 4). Out of 29 DEGs in the cluster, we found 6 validated DEGs (Table 1) in both human and rat validation cohorts: PCSK9, ACLY, DPP4, SC5D, TMEM30B, and TMEM64. We decided to explore PCSK9, up-regulated in aging (Fig. 9A) based on our data and the validation cohorts (Supplementary Fig. 1), as a potential biomarker and therapeutic target for liver aging, as it is classified as liver-enriched and FDA-approved drug target in the Human Protein Atlas [33]. To test our hypothesis in humans, we selected aging subjects (> 65 years old) from healthy liver GTEx (Supplementary Fig. 2, Supplementary Table 4) data with high and low PCSK9 levels (Fig. 9B). The high group consisted of 4 male and 6 female subjects with the age of 68 ± 0.45 (mean ± standard error) years old and PCSK9 TPM value of 37.22 ± 1.90. Meanwhile, the low group consisted of 6 male and 3 female subjects with the age of 67.4 ± 0.44 years old and PCSK9 TPM value of 14.15 ± 1.31.
Table 1.
Validated genes from the driver cluster 14
| Gene | Differential expression analysis | ||||
|---|---|---|---|---|---|
| Own data | GSE183915 (human) | PRJNA516151 (rat) | Human protein atlas (https://proteinatlas.org/) | ||
| A vs Y | A vs Y | 24 vs 6 | Tissue specificity | FDA approved? | |
| PCSK9 | UP | UP | UP | Tissue enriched (liver) | Yes |
| DPP4 | UP | UP | UP | Tissue enhanced (not liver) | Yes |
| ACLY | UP | UP | UP | Low tissue specificity | Yes |
| SC5D | UP | UP | UP | Tissue enhanced (liver) | No |
| TMEM30B | UP | UP | UP | Low tissue specificity | No |
| TMEM64 | UP | UP | UP | Tissue enhanced (not liver) | No |
Fig. 9.
A FPKM of Pcsk9 from our data showed a significantly higher value in the aged group. B TPM of PCSK9 from the selected GTEx samples. C, D Enrichment analysis with KEGG pathways and GO Biological processes showed that subjects with higher PCSK9 levels were more vulnerable to adverse aging effects. Expression data is represented as mean ± SEM. *0.01 < P-value ≤ 0.05, **0.001 < P-value ≤ 0.01, ***0.0001 < P-value ≤ 0.001, ****P-value ≤ 0.0001
We found that most of the affected pathways and biological processes by aging were worsened in the high PCSK9 group compared to the low group (Supplementary Table 4). We observed that apoptosis, TNF signaling pathway, cholesterol biosynthesis, and negative regulation of LDL receptors were up-regulated in the high group (Fig. 9C, D). On the other hand, oxidative phosphorylation, mitochondrial processes, fatty acid catabolism, and amino acid metabolism were found to be down-regulated in the high group compared to the low-aged group. The analysis result shows the role of PCSK9 as an important regulator and key biomarker in liver aging process.
Single-cell RNA-seq analysis reveals PCSK9 expression in cell levels
To further investigate PCSK9 as a candidate biomarker and therapeutic target, we explored its expression in different cell types in the liver by using published single-cell RNA-seq (scRNA) data [34]. Here, we downloaded the gene expression, cell cluster type, and SEURAT processed data to retrieve the T-SNE coordinates to reproduce the cell clustering figure and the expression of PCSK9 (Fig. 10A). We observed that PCSK9 expressions were found in hepatocytes with the highest expression in hepatocyte 3 (Fig. 10B). Hepatocyte 3 was identified as a subtype that was exclusive to the oldest subject (65 years old) and enriched by genes associated with lipid and cholesterol metabolism and active immune pathways. We also observed that PCSK9 expressions were detected in hepatocytes 1, 2, 4, and 5 which belong to younger subjects (21–44 years old) with lower expression. This supported our hypothesis that PCSK9, localized in hepatocytes, is correlated with the aging process.
Fig. 10.
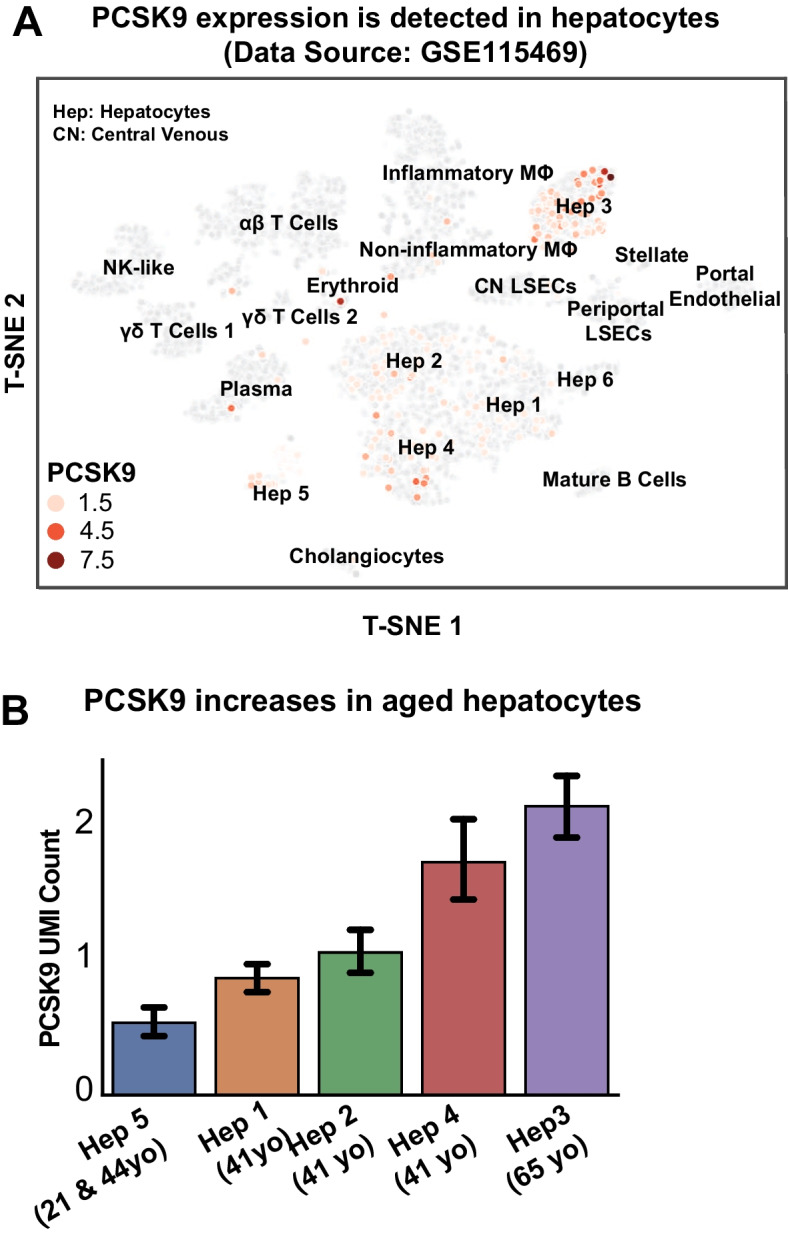
A Single-cell RNA-seq (scRNA-seq) of the healthy human liver (GSE115469) showed that PCSK9 was expressed in hepatocytes and B the expression increased in hepatocytes of older subjects
Discussion
Aging is an inevitable process that leads to the gradual decline of multiple organs and metabolic processes within the body. In this study, we employed the next-generation RNA-sequencing technology and applied extensive systems biology approaches combined with histopathology and biochemical methods to thoroughly explore the molecular changes occurring in our metabolic system as a result of aging. Given the liver’s pivotal role as a key metabolic organ involved in maintaining immune and endocrine homeostasis, we focused our study on generating liver RNA-seq data collected from young (4–5 months) and aged (20–21 months) F344 rats. We performed differential expression, functional, and reporter metabolite analysis to reveal the system-level and metabolic alteration due to the aging process in the liver. Crucially, we validated key signatures of our findings through various assays and confirmed our results using two independent publicly available aging cohorts, encompassing both rat and human data. To gain further insight into the functional relationships between genes and identify important gene clusters in the aging process, we constructed and analyzed a gene-gene co-expression network. Through this network analysis, we identified PCSK9 as a key gene in liver aging. To underscore the functional relevance of PCSK9, we compared low and high PCSK9 expression groups using aging human liver transcriptomics data from the GTEx dataset. Additionally, we confirmed the cellular localization and age dependency of PCSK9 through the analysis of publicly available single-cell RNA-sequencing data.
Consistent with the mitochondrial theory of aging [35–37], our study revealed significant down-regulation of mitochondrial ATP synthesis, electron transport, and respiratory chain complex assembly processes in the livers of aging animals. We also observed decreased activities of mitochondrial complexes and an increase in reactive oxygen species (ROS) generation, corroborating previous findings [3, 7, 38] and providing further validity to our model. These processes were accompanied by increased apoptosis, senescence, and reduced hepatic NAD + levels, all of which are important characteristics of the aging process [3, 7, 38].
We also found significant up-regulation of immune and inflammatory signaling pathways and processes, including NF-κB, TNF, IL-17, chemokine, cytokine receptor, and interferon-gamma, in our aging model. This finding supports the established role of chronic inflammation in liver aging. Moreover, we observed a substantial impairment of metabolic functions in the aging liver, with the majority of metabolic pathways, including amino acid metabolism, exhibiting significant down-regulation. These findings have implications for protein synthesis and degradation processes within the aging liver [39]. Importantly, to ensure the robustness of our findings, we validated our results using publicly available liver aging datasets from independent studies, further strengthening the reliability of our analyses.
One key outcome of our unsupervised network analysis was the identification of crucial clusters and genes driving the liver aging process. Notably, we discovered a cluster of up-regulated genes associated with lipid and cholesterol metabolism as the main driver of the network. Within this cluster, PCSK9 (Proprotein convertase subtilisin/kexin type 9) and SCD5 emerged as the only liver-enriched/enhanced genes that were validated in both rat and human cohorts. Given its prominence within the cluster and the availability of several FDA-approved PCSK9 inhibitors [40], we selected PCSK9 as our focus. PCSK9 plays a pivotal role in maintaining cholesterol homeostasis by binding to low-density lipoprotein (LDL) receptors and stimulating the LDL receptor degradation in liver, hence elevating the level of LDL cholesterol circulating in the blood [41]. The role of PCSK9 has also been implicated in various liver diseases, including alcoholic [42–44] and non-alcoholic liver diseases [32, 45].
The significance of PCSK9 in both liver function and cholesterol metabolism is extensively documented. Furthermore, the utilization of PCSK9 inhibition as a therapeutic approach for cardiometabolic-related conditions is widely recognized. Over the past decade, the FDA has granted approval for several monoclonal antibodies inhibiting PCSK9 (e.g., Alirocumab) [46], and recently a small interfering RNA (Inclisiran) [47] that inhibits PCSK9 synthesis in the liver for the treatment of hypercholesterolemia and reduction of related cardiovascular morbidity and mortality. Furthermore, oral macrocyclic peptide inhibitors of PCSK9 such as MK-0616 are also in clinical development [48]. While the expression of PCSK9 in the heart is minuscule compared to liver, PCSK9 may exert both direct and indirect effects on the cardiovascular system as suggested by a recent study [49]. This study described a positive correlation between serum PCSK9 levels and cardiac dysfunction in aging human subjects and rats [49]. It also showed that PCSK9 inhibition improved age-related cardiovascular dysfunction [49]. Despite these advances in cardiovascular research, the specific role of PCSK9 in the context of liver aging remains predominantly unexplored.
To shed light on this aspect, we conducted systematic analyses on aging populations (> 65 years old) using human population data from the GTEx dataset. Our observations revealed that mitochondrial-related functions, such as ATP synthesis, electron transport, and respiratory chain complex assembly, were further down-regulated in subjects with high PCSK9 expression in the liver. Conversely, apoptosis, the TNF-α signaling pathway, cholesterol biosynthesis, and negative regulation of LDL receptors were up-regulated. Additionally, we observed significant down-regulation in amino acid metabolism pathways. Overall, our findings demonstrated that many critical processes and pathways affected by the aging process in the liver were exacerbated in aging subjects with high PCSK9 expression compared to those with low PCSK9 expression. This suggests that PCSK9 could serve as a new therapeutic target for mitigating the effects of aging.
To further support our observations, we utilized publicly available single-cell RNA-sequencing data, which revealed that PCSK9 expression was primarily localized in hepatocytes and exhibited a positive correlation with aging. Specifically, the highest expression of PCSK9 was found in the hepatocyte cluster from the oldest subject, which exhibited enrichment of lipid and cholesterol-associated genes and active immune pathways [34]. This strengthened our observation of PCSK9’s association with aging in the liver. Moreover, our results suggest potential additional benefits of clinically approved PCSK9 inhibitors for the aging population, beyond their established beneficial effects on serum cholesterol levels and cardiovascular morbidity/mortality.
While our study provides valuable insights, there are several limitations to consider. First, our analysis largely relied on transcriptomics data, which may limit the sensitivity of our findings. Second, our analyses focused solely on protein-coding genes, while non-coding genes have also been shown to be significantly affected by aging [7]. Future research holds great promise in expanding this study to include non-coding genes.
In conclusion, our data-driven analysis systematically highlighted the changes occurring in important biological processes and metabolic pathways as a result of liver aging, leveraging transcriptomics data analyses. Furthermore, through liver-specific co-expression network analysis, we unveiled key clusters and genes. Notably, we identified PCSK9 as a promising candidate target gene for mitigating the effects of aging, emphasizing its critical role in liver aging. Further studies are warranted to evaluate PCSK9 as a potential therapeutic target for anti-aging interventions and to elucidate its effects on aging individuals.
Materials and methods
Experimental model and subject details
All the animal protocols conformed to the National Institutes of Health (NIH) guidelines and were approved by the Institutional Animal Care and Use Committee of the National Institute on Alcohol Abuse and Alcoholism (Bethesda, MD). Eighteen 3-month-old (young) and 16 19–20-month-old (aging) Fischer rats were obtained from the National Institute of Aging/NIH and used for the studies described. Six mice from each group were used from transcriptomics analysis and the rest for histology and immunohistochemistry.
RNA extraction, sequencing, and quantification
Liver tissues were homogenized in Trizol (Invitrogen, Carlsbad, CA, USA), and total RNA was isolated with Direct-zol RNA Miniprep kit (Zymo Research, Irvine, CA, USA) according to the manufacturer’s instructions. RNA concentrations were measured with a NanoPhotometer® (Implen, Westlake Village, CA, USA). Equal amounts of RNA were reverse-transcribed (High-Capacity cDNA Reverse Transcription Kit, Applied Biosystems, Foster City, CA, USA). Sample preparation, RNA library preparation, sequencing, data quality control, and quantification were performed by Novogene (Sacramento, CA) using Illumina NovaSeq 6000.
Transcriptomics data analysis
We filtered the raw counts and FPKM data by selecting only protein-coding genes and transcript type. The FPKM data was used to perform data exploration, by using the PCA function from the sklearn [50] package in Python. After confirming the data distribution, we performed differential expression analysis using the DESeq2 [51] package in R. To define the differentially expressed genes, we filter the results by selecting genes with FDR < 5%. Subsequently, we used the output of the differential expression analysis to perform functional analysis using the PIANO [52] package in R. The fold change and p-value information were used as the input. For the gene-set collections, we retrieved the Gene Ontology Biological Process from the Enrichr [53, 54] website, KEGG Pathways from Novogene, and metabolites from the rat genome-scale metabolic model from the Metabolic Atlas [24] website. We used FDR < 5% as the significance cut-off and gene-level statistics for the visualization.
Liver histology and immunohistochemistry
Rat liver samples were fixed in 10% neutral buffered formalin before embedding. After sectioning of tissue blocks into 4 μm slices, all sections were deparaffinized and stained with the conventional Hematoxylin/eosin, Sirius Red, and Masson Trichrome (Richard-Allan Scientific, Kalamazoo, MI) staining. The severity of liver injury (steatosis, lobular injury, and ballooning) in rats was evaluated histologically on H&E-stained sections using the NAFLD activity score (NAS) in a blinded fashion, in which the pathologists were unaware of the age or gender of the rat groups. For F4/80, CD45, 4-HNE, and 3-NT immunostaining, liver tissue sections were deparaffinized and rehydrated in descending grades of ethanol, followed by a heat-mediated antigen retrieval procedure (pH = 6 citrate buffer or pH = 9 Tris/EDTA at 95 °C for 15 min). Sections were incubated in BlOXALL solution (Vector Laboratories, Burlingame, CA, USA) to block endogenous peroxidase activity according to the manufacturer’s instructions. Sections were then incubated with anti-F4/80 antibody (1:5000 dilution; ab 300421, Abcam, Cambridge, MA, USA); or anti-CD45 antibody (1:1000 dilution; #ab10558, Abcam, Cambridge, MA, USA); or anti-CD45 antibody (1:1000 dilution; #ab10558, Abcam, Cambridge, MA, USA); or anti-3-nitrotyrosine (1:100 dilution; #10189540 Cayman, Ann Arbor, MI, USA); or anti-4-HNE antibody (1/200 dilution; #MHN-100P Institute for the Control of Aging, Nikken SEIL Co, Fukuroi, Shizuoka, Japan) overnight at 4 °C in a humidified chambers. Day after, sections were incubated with an anti-rabbit or anti-mouse IgG conjugated with a horseradish-peroxidase polymer (ImmPress reagents, Vector Laboratories) according to the kit’s instructions. Color development was induced by incubation with a DAB reagent (Vector Laboratories) for 30–180 s, and the sections were counter-stained with hematoxylin. Finally, the sections were dehydrated in ethanol, cleared in xylene, and mounted. For Sirius Red staining, rat liver sections were stained with Sirius Red to visualize hepatic fibrosis. Briefly, the sections were stained in picrosirius red solution for 2 h. After washing with 15% glacial acetic acid, the sections were dehydrated through 3 changes of 100% ethanol and xylene, then mounted in a resinous medium. All images were captured using an Olympus BX-43 microscope set (Olympus, Center Valley, PA), and 7–10 random HPF (High-Power-Field, 20 × , per HPF:0.23 mm2) areas were taken. CD45-positive cell count and both areas of F4/80 and Sirius red coverage were quantified by ImageJ software (NIH, Bethesda, MD, USA). Liver Mitochondrial Activity Assay Mitochondrial activities were assayed by using a colorimetric kit (Abcam, Waltham, MA, USA), and measurements were performed according to the manufacturer’s instructions. Kit with catalog numbers #ab109721, #ab109908, and #ab109911 were used to measure the mitochondrial complex I and NAD content, mitochondrial complex II, and mitochondrial complex IV, respectively as previously described [55].
Serum total cholesterol measurement
Serum levels of total cholesterol were assayed by using a colorimetric kit (Abcam, Waltham, MA, USA), and measurements were performed according to the manufacturer’s instructions. Kit with catalog number #ab65390 was used to measure the total cholesterol level in the serum.
Validations of the results
We downloaded the raw fastq files from PRJNA516151 [7] and GSE183915 [29] using the SRA toolkit and generate the estimated count and TPM data using Kallisto [56]. Differential expression analyses for each cohort were performed as described in the previous section. Functional analysis of the intersecting DEGs with GSE183915 was performed using the Enrichr [53, 54] method using the GSEAPY package in Python 3.7.
GTEx data analysis
Human RNA-seq data (raw counts and TPM) were obtained from The Genotype-Tissue Expression (GTEx) Project Portal on 02/08/2022 and dbGaP accession number phs000424.v8.p2 on 02/08/2022. We filtered the data by selecting > 65-year-old subjects, with the cause of death unrelated to liver problems, and no identified liver-related diseases, including diabetes, liver failure, fatty liver, liver abscess, inherited liver insufficiency, acute/chronic hepatic insufficiency, necrobacillosis, and rupture. Differential expression and functional analysis were performed with similar methods as described in the “Transcriptomics Data Analysis” section.
Data availability
All RNA-sequencing data generated from this study are available under the accession number GSE210371 on Gene Expression Omnibus (GEO) website. Datasets used for validations and single-cell data analysis are available under the accession PRJNA516151, GSE183915, and GSE115469. The GTEx data can be accessed via dbGAP with accession number phs000424. Codes used to analyze the data and generate the figures are available at https://doi.org/10.5281/zenodo.8193694. Raw images from the histology are available at https://doi.org/10.5281/zenodo.8193135. Source data for the histology and assay analysis figures can be found in Supplementary Table 5.
Supplementary Information
Below is the link to the electronic supplementary material.
Acknowledgements
This work utilized the computational resources of the NIH HPC Biowulf cluster (http://hpc.nih.gov).
Author contribution
Conceptualization: M.A., C.M., P.P.; methodology: M.A., C.M., E.T., S.Z.; software: M.A.; formal analysis: M.A., C.M.; investigation: M.A, C.M., P.P.; validation: B.Y., P.M., J.P., B.P.L.; data curation: M.A.; writing—original draft: M.A, P.P.; writing—review and editing: M.A, C.M., P.M, B.Y., E.T., J.P., B.P.L., F.W.L, G.H., P.P; visualization: M.A.; supervision: P.P.; project administration: C.M, P.M.; funding acquisition: P.P.
Funding
The Genotype-Tissue Expression (GTEx) Project was supported by the Common Fund of the Office of the Director of the National Institutes of Health, and by NCI, NHGRI, NHLBI, NIDA, NIMH, and NINDS. The research was funded by Intramural Program of the Intramural Program of the National Institute on Alcohol Abuse and Alcoholism, National Institutes of Health to P.P.
Declarations
Conflict of interest
The authors declare no competing interests.
Footnotes
Publisher's Note
Springer Nature remains neutral with regard to jurisdictional claims in published maps and institutional affiliations.
Muhammad Arif and Csaba Matyas contributed equally to this work
References
- 1.United Nations. World Population Ageing 2020 Highlights. 2020. https://www.un.org/development/desa/pd/sites/www.un.org.development.desa.pd/files/files/documents/2020/Sep/un_pop_2020_pf_ageing_10_key_messages.pdf. Accessed 10 Nov 2022.
- 2.WHO. Ageing and health. 2021. https://www.who.int/news-room/fact-sheets/detail/ageing-and-health. Accessed 10 Nov 2022.
- 3.Lopez-Otin C, Blasco MA, Partridge L, Serrano M, Kroemer G. The hallmarks of aging. Cell. 2013;153:1194–1217. doi: 10.1016/j.cell.2013.05.039. [DOI] [PMC free article] [PubMed] [Google Scholar]
- 4.Schmucker DL. Age-related changes in liver structure and function: Implications for disease? Exp Gerontol. 2005;40:650–659. doi: 10.1016/j.exger.2005.06.009. [DOI] [PubMed] [Google Scholar]
- 5.Matyas C, Hasko G, Liaudet L, Trojnar E, Pacher P. Interplay of cardiovascular mediators, oxidative stress and inflammation in liver disease and its complications. Nat Rev Cardiol. 2021;18:117–135. doi: 10.1038/s41569-020-0433-5. [DOI] [PubMed] [Google Scholar]
- 6.Kim IH, Kisseleva T, Brenner DA. Aging and liver disease. Curr Opin Gastroenterol. 2015;31:184–191. doi: 10.1097/MOG.0000000000000176. [DOI] [PMC free article] [PubMed] [Google Scholar]
- 7.Shavlakadze T, Morris M, Fang J, Wang SX, Zhu J, Zhou W, Tse HW, Mondragon-Gonzalez R, Roma G, Glass DJ. Age-related gene expression signature in rats demonstrate early, late, and linear transcriptional changes from multiple tissues. Cell Rep. 2019;28:3263-3273 e3263. [DOI] [PubMed]
- 8.Shavlakadze T, Zhu J, Wang S, Zhou W, Morin B, Egerman MA, Fan L, Wang Y, Iartchouk O, Meyer A, Valdez RA, Mannick JB, Klickstein LB, Glass DJ. Short-term low-dose mTORC1 inhibition in aged rats counter-regulates age-related gene changes and blocks age-related kidney pathology. J Gerontol A Biol Sci Med Sci. 2018;73:845–852. doi: 10.1093/gerona/glx249. [DOI] [PMC free article] [PubMed] [Google Scholar]
- 9.Ding J, Ji J, Rabow Z, Shen T, Folz J, Brydges CR, Fan S, Lu X, Mehta S, Showalter MR, Zhang Y, Araiza R, Bower LR, Lloyd KCK, Fiehn O. A metabolome atlas of the aging mouse brain. Nat Commun. 2021;12:6021. doi: 10.1038/s41467-021-26310-y. [DOI] [PMC free article] [PubMed] [Google Scholar]
- 10.Xie K, Qin Q, Long Z, Yang Y, Peng C, Xi C, Li L, Wu Z, Daria V, Zhao Y, Wang F, Wang M. High-throughput metabolomics for discovering potential biomarkers and identifying metabolic mechanisms in aging and Alzheimer’s Disease. Front Cell Dev Biol. 2021;9:602887. doi: 10.3389/fcell.2021.602887. [DOI] [PMC free article] [PubMed] [Google Scholar]
- 11.Tanaka T, Basisty N, Fantoni G, Candia J, Moore AZ, Biancotto A, Schilling B, Bandinelli S, Ferrucci L. Plasma proteomic biomarker signature of age predicts health and life span. Elife. 2020;9:e61073. [DOI] [PMC free article] [PubMed]
- 12.Zhang C, Bjornson E, Arif M, Tebani A, Lovric A, Benfeitas R, Ozcan M, Juszczak K, Kim W, Kim JT, Bidkhori G, Stahlman M, Bergh PO, Adiels M, Turkez H, Taskinen MR, Bosley J, Marschall HU, Nielsen J, Uhlen M, Boren J, Mardinoglu A. The acute effect of metabolic cofactor supplementation: a potential therapeutic strategy against non-alcoholic fatty liver disease. Mol Syst Biol. 2020;16:e9495. doi: 10.15252/msb.209495. [DOI] [PMC free article] [PubMed] [Google Scholar]
- 13.Turanli B, Zhang C, Kim W, Benfeitas R, Uhlen M, Arga KY, Mardinoglu A. Discovery of therapeutic agents for prostate cancer using genome-scale metabolic modeling and drug repositioning. EBioMedicine. 2019;42:386–396. doi: 10.1016/j.ebiom.2019.03.009. [DOI] [PMC free article] [PubMed] [Google Scholar]
- 14.Benfeitas R, Bidkhori G, Mukhopadhyay B, Klevstig M, Arif M, Zhang C, Lee S, Cinar R, Nielsen J, Uhlen M, Boren J, Kunos G, Mardinoglu A. Characterization of heterogeneous redox responses in hepatocellular carcinoma patients using network analysis. EBioMedicine. 2019;40:471–487. doi: 10.1016/j.ebiom.2018.12.057. [DOI] [PMC free article] [PubMed] [Google Scholar]
- 15.Arif M, Zhang C, Li X, Gungor C, Cakmak B, Arslanturk M, Tebani A, Ozcan B, Subas O, Zhou W, Piening B, Turkez H, Fagerberg L, Price N, Hood L, Snyder M, Nielsen J, Uhlen M, Mardinoglu A. iNetModels 2.0: an interactive visualization and database of multi-omics data. Nucleic Acids Res. 2021;49:W271–W276. doi: 10.1093/nar/gkab254. [DOI] [PMC free article] [PubMed] [Google Scholar]
- 16.Zeybel M, Arif M, Li X, Altay O, Yang H, Shi M, Akyildiz M, Saglam B, Gonenli MG, Yigit B, Ulukan B, Ural D, Shoaie S, Turkez H, Nielsen J, Zhang C, Uhlen M, Boren J, Mardinoglu A. Multiomics analysis reveals the impact of microbiota on host metabolism in hepatic steatosis. Adv Sci (Weinh) 2022;9:e2104373. doi: 10.1002/advs.202104373. [DOI] [PMC free article] [PubMed] [Google Scholar]
- 17.Arif M, Klevstig M, Benfeitas R, Doran S, Turkez H, Uhlen M, Clausen M, Wikstrom J, Etal D, Zhang C, Levin M, Mardinoglu A, Boren J. Integrative transcriptomic analysis of tissue-specific metabolic crosstalk after myocardial infarction. Elife. 2021;10. [DOI] [PMC free article] [PubMed]
- 18.Gene Ontology C. The gene ontology resource: enriching a GOld mine. Nucleic Acids Res. 2021;49:D325–D334. doi: 10.1093/nar/gkaa1113. [DOI] [PMC free article] [PubMed] [Google Scholar]
- 19.Ashburner M, Ball CA, Blake JA, Botstein D, Butler H, Cherry JM, Davis AP, Dolinski K, Dwight SS, Eppig JT, Harris MA, Hill DP, Issel-Tarver L, Kasarskis A, Lewis S, Matese JC, Richardson JE, Ringwald M, Rubin GM, Sherlock G. Gene ontology: tool for the unification of biology. The Gene Ontology Consortium. Nat Genet. 2000;25:25–29. doi: 10.1038/75556. [DOI] [PMC free article] [PubMed] [Google Scholar]
- 20.Kanehisa M, Furumichi M, Sato Y, Ishiguro-Watanabe M, Tanabe M. KEGG: integrating viruses and cellular organisms. Nucleic Acids Res. 2021;49:D545–D551. doi: 10.1093/nar/gkaa970. [DOI] [PMC free article] [PubMed] [Google Scholar]
- 21.Kanehisa M. Toward understanding the origin and evolution of cellular organisms. Protein Sci. 2019;28:1947–1951. doi: 10.1002/pro.3715. [DOI] [PMC free article] [PubMed] [Google Scholar]
- 22.Kanehisa M, Goto S. KEGG: kyoto encyclopedia of genes and genomes. Nucleic Acids Res. 2000;28:27–30. doi: 10.1093/nar/28.1.27. [DOI] [PMC free article] [PubMed] [Google Scholar]
- 23.Herrera J, Henke CA, Bitterman PB. Extracellular matrix as a driver of progressive fibrosis. J Clin Invest. 2018;128:45–53. doi: 10.1172/JCI93557. [DOI] [PMC free article] [PubMed] [Google Scholar]
- 24.Wang H, Robinson JL, Kocabas P, Gustafsson J, Anton M, Cholley PE, Huang S, Gobom J, Svensson T, Uhlen M, Zetterberg H, Nielsen J. Genome-scale metabolic network reconstruction of model animals as a platform for translational research. Proc Natl Acad Sci U S A. 2021;118(30):e2102344118. [DOI] [PMC free article] [PubMed]
- 25.Ebrahim A, Lerman JA, Palsson BO, Hyduke DR. COBRApy: COnstraints-based reconstruction and analysis for python. BMC Syst Biol. 2013;7:74. doi: 10.1186/1752-0509-7-74. [DOI] [PMC free article] [PubMed] [Google Scholar]
- 26.Maher P. The effects of stress and aging on glutathione metabolism. Ageing Res Rev. 2005;4:288–314. doi: 10.1016/j.arr.2005.02.005. [DOI] [PubMed] [Google Scholar]
- 27.You M, Arteel GE. Effect of ethanol on lipid metabolism. J Hepatol. 2019;70:237–248. doi: 10.1016/j.jhep.2018.10.037. [DOI] [PMC free article] [PubMed] [Google Scholar]
- 28.Softic S, Cohen DE, Kahn CR. Role of dietary fructose and hepatic de novo lipogenesis in fatty liver disease. Dig Dis Sci. 2016;61:1282–1293. doi: 10.1007/s10620-016-4054-0. [DOI] [PMC free article] [PubMed] [Google Scholar]
- 29.Schreiter T, Gieseler RK, Vilchez-Vargas R, Jauregui R, Sowa JP, Klein-Scory S, Broering R, Croner RS, Treckmann JW, Link A, Canbay A. Transcriptome-wide analysis of human liver reveals age-related differences in the expression of select functional gene clusters and evidence for a PPP1R10-Governed ‘Aging Cascade’. Pharmaceutics. 2021;13(12):2009. [DOI] [PMC free article] [PubMed]
- 30.Karczewski KJ, Snyder MP. Integrative omics for health and disease. Nat Rev Genet. 2018;19:299–310. doi: 10.1038/nrg.2018.4. [DOI] [PMC free article] [PubMed] [Google Scholar]
- 31.Traag VA, Waltman L, van Eck NJ. From Louvain to Leiden: guaranteeing well-connected communities. Sci Rep. 2019;9:5233. doi: 10.1038/s41598-019-41695-z. [DOI] [PMC free article] [PubMed] [Google Scholar]
- 32.Lee S, Zhang C, Liu Z, Klevstig M, Mukhopadhyay B, Bergentall M, Cinar R, Stahlman M, Sikanic N, Park JK, Deshmukh S, Harzandi AM, Kuijpers T, Grotli M, Elsasser SJ, Piening BD, Snyder M, Smith U, Nielsen J, Backhed F, Kunos G, Uhlen M, Boren J, Mardinoglu A. Network analyses identify liver-specific targets for treating liver diseases. Mol Syst Biol. 2017;13:938. doi: 10.15252/msb.20177703. [DOI] [PMC free article] [PubMed] [Google Scholar]
- 33.Uhlen M, Fagerberg L, Hallstrom BM, Lindskog C, Oksvold P, Mardinoglu A, Sivertsson A, Kampf C, Sjostedt E, Asplund A, Olsson I, Edlund K, Lundberg E, Navani S, Szigyarto CA, Odeberg J, Djureinovic D, Takanen JO, Hober S, Alm T, Edqvist PH, Berling H, Tegel H, Mulder J, Rockberg J, Nilsson P, Schwenk JM, Hamsten M, von Feilitzen K, Forsberg M, Persson L, Johansson F, Zwahlen M, von Heijne G, Nielsen J, Ponten F. Proteomics. Tissue-based map of the human proteome. Science. 2015;347:1260419. [DOI] [PubMed]
- 34.MacParland SA, Liu JC, Ma XZ, Innes BT, Bartczak AM, Gage BK, Manuel J, Khuu N, Echeverri J, Linares I, Gupta R, Cheng ML, Liu LY, Camat D, Chung SW, Seliga RK, Shao Z, Lee E, Ogawa S, Ogawa M, Wilson MD, Fish JE, Selzner M, Ghanekar A, Grant D, Greig P, Sapisochin G, Selzner N, Winegarden N, Adeyi O, Keller G, Bader GD, McGilvray ID. Single cell RNA sequencing of human liver reveals distinct intrahepatic macrophage populations. Nat Commun. 2018;9:4383. doi: 10.1038/s41467-018-06318-7. [DOI] [PMC free article] [PubMed] [Google Scholar]
- 35.Ungvari Z, Tarantini S, Donato AJ, Galvan V, Csiszar A. Mechanisms of vascular aging. Circ Res. 2018;123:849–867. doi: 10.1161/CIRCRESAHA.118.311378. [DOI] [PMC free article] [PubMed] [Google Scholar]
- 36.Dai DF, Rabinovitch PS, Ungvari Z. Mitochondria and cardiovascular aging. Circ Res. 2012;110:1109–1124. doi: 10.1161/CIRCRESAHA.111.246140. [DOI] [PMC free article] [PubMed] [Google Scholar]
- 37.Balaban RS, Nemoto S, Finkel T. Mitochondria, oxidants, and aging. Cell. 2005;120:483–495. doi: 10.1016/j.cell.2005.02.001. [DOI] [PubMed] [Google Scholar]
- 38.Hunt NJ, Kang SWS, Lockwood GP, Le Couteur DG, Cogger VC. Hallmarks of aging in the liver. Comput Struct Biotechnol J. 2019;17:1151–1161. doi: 10.1016/j.csbj.2019.07.021. [DOI] [PMC free article] [PubMed] [Google Scholar]
- 39.Ward W, Richardson A. Effect of age on liver protein synthesis and degradation. Hepatology. 1991;14:935–948. doi: 10.1002/hep.1840140529. [DOI] [PubMed] [Google Scholar]
- 40.Katzmann JL, Gouni-Berthold I, Laufs U. PCSK9 inhibition: insights from clinical trials and future prospects. Front Physiol. 2020;11:595819. doi: 10.3389/fphys.2020.595819. [DOI] [PMC free article] [PubMed] [Google Scholar]
- 41.Spolitu S, Dai W, Zadroga JA, Ozcan L. Proprotein convertase subtilisin/kexin type 9 and lipid metabolism. Curr Opin Lipidol. 2019;30:186–191. doi: 10.1097/MOL.0000000000000601. [DOI] [PMC free article] [PubMed] [Google Scholar]
- 42.Lee JS, O'Connell EM, Pacher P, Lohoff FW. PCSK9 and the gut-liver-brain axis: a novel therapeutic target for immune regulation in alcohol use disorder. J Clin Med. 2021;10(8):1758. [DOI] [PMC free article] [PubMed]
- 43.Lee JS, Mukhopadhyay P, Matyas C, Trojnar E, Paloczi J, Yang YR, Blank BA, Savage C, Sorokin AV, Mehta NN, Vendruscolo JCM, Koob GF, Vendruscolo LF, Pacher P, Lohoff FW. PCSK9 inhibition as a novel therapeutic target for alcoholic liver disease. Sci Rep. 2019;9:17167. doi: 10.1038/s41598-019-53603-6. [DOI] [PMC free article] [PubMed] [Google Scholar]
- 44.Lohoff FW, Sorcher JL, Rosen AD, Mauro KL, Fanelli RR, Momenan R, Hodgkinson CA, Vendruscolo LF, Koob GF, Schwandt M, George DT, Jones IS, Holmes A, Zhou Z, Xu MJ, Gao B, Sun H, Phillips MJ, Muench C, Kaminsky ZA. Methylomic profiling and replication implicates deregulation of PCSK9 in alcohol use disorder. Mol Psychiatry. 2018;23:1900–1910. doi: 10.1038/mp.2017.168. [DOI] [PMC free article] [PubMed] [Google Scholar]
- 45.He Y, Rodrigues RM, Wang X, Seo W, Ma J, Hwang S, Fu Y, Trojnar E, Matyas C, Zhao S, Ren R, Feng D, Pacher P, Kunos G, Gao B. Neutrophil-to-hepatocyte communication via LDLR-dependent miR-223-enriched extracellular vesicle transfer ameliorates nonalcoholic steatohepatitis. J Clin Invest. 2021;131(3):e141513. [DOI] [PMC free article] [PubMed]
- 46.Schwartz GG, Steg PG, Szarek M, Bhatt DL, Bittner VA, Diaz R, Edelberg JM, Goodman SG, Hanotin C, Harrington RA, Jukema JW, Lecorps G, Mahaffey KW, Moryusef A, Pordy R, Quintero K, Roe MT, Sasiela WJ, Tamby JF, Tricoci P, White HD, Zeiher AM, Committees OO, Investigators, Alirocumab and cardiovascular outcomes after acute coronary syndrome. N Engl J Med. 2018;379:2097–2107. doi: 10.1056/NEJMoa1801174. [DOI] [PubMed] [Google Scholar]
- 47.Ray KK, Wright RS, Kallend D, Koenig W, Leiter LA, Raal FJ, Bisch JA, Richardson T, Jaros M, Wijngaard PLJ, Kastelein JJP, Orion & Investigators O Two phase 3 trials of inclisiran in patients with elevated LDL cholesterol. N Engl J Med. 2020;382:1507–1519. doi: 10.1056/NEJMoa1912387. [DOI] [PubMed] [Google Scholar]
- 48.Ballantyne CM, Banka P, Mendez G, Garcia R, Rosenstock J, Rodgers A, Mendizabal G, Mitchel Y, Catapano AL. Phase 2b randomized trial of the oral PCSK9 inhibitor MK-0616. J Am Coll Cardiol. 2023;81:1553–1564. doi: 10.1016/j.jacc.2023.02.018. [DOI] [PubMed] [Google Scholar]
- 49.Matyas C, Trojnar E, Zhao S, Arif M, Mukhopadhyay P, Kovacs A, Fabian A, Tokodi M, Bagyura Z, Merkely B, Kohidai L, Lajko E, Takacs A, He Y, Gao B, Paloczi J, Lohoff FW, Haskó G, Ding WX, Pacher P. PCSK9, a promising novel target for age-related cardiovascular dysfunction. J Am Coll Cardiol Basic Trans Science. 2023. 10.1016/j.jacbts.2023.06.005. [DOI] [PMC free article] [PubMed]
- 50.Pedregosa F, Varoquaux G, Gramfort A, Michel V, Thirion B, Grisel O, Blondel M, Prettenhofer P, Weiss R, Dubourg V, Vanderplas J, Passos A, Cournapeau D, Brucher M, Perrot M, Duchesnay E. Scikit-learn: Machine learning in python. J Mach Learn Res. 2011;12:2825–2830. [Google Scholar]
- 51.Love MI, Huber W, Anders S. Moderated estimation of fold change and dispersion for RNA-seq data with DESeq2. Genome Biol. 2014;15:550. doi: 10.1186/s13059-014-0550-8. [DOI] [PMC free article] [PubMed] [Google Scholar]
- 52.Varemo L, Nielsen J, Nookaew I. Enriching the gene set analysis of genome-wide data by incorporating directionality of gene expression and combining statistical hypotheses and methods. Nucleic Acids Res. 2013;41:4378–4391. doi: 10.1093/nar/gkt111. [DOI] [PMC free article] [PubMed] [Google Scholar]
- 53.Kuleshov MV, Jones MR, Rouillard AD, Fernandez NF, Duan Q, Wang Z, Koplev S, Jenkins SL, Jagodnik KM, Lachmann A, McDermott MG, Monteiro CD, Gundersen GW, Ma'ayan A. Enrichr: a comprehensive gene set enrichment analysis web server 2016 update. Nucleic Acids Res. 2016;44:W90–97. doi: 10.1093/nar/gkw377. [DOI] [PMC free article] [PubMed] [Google Scholar]
- 54.Chen EY, Tan CM, Kou Y, Duan Q, Wang Z, Meirelles GV, Clark NR, Ma'ayan A. Enrichr: interactive and collaborative HTML5 gene list enrichment analysis tool. BMC Bioinformatics. 2013;14:128. doi: 10.1186/1471-2105-14-128. [DOI] [PMC free article] [PubMed] [Google Scholar]
- 55.Mukhopadhyay P, Rajesh M, Cao Z, Horvath B, Park O, Wang H, Erdelyi K, Holovac E, Wang Y, Liaudet L, Hamdaoui N, Lafdil F, Hasko G, Szabo C, Boulares AH, Gao B, Pacher P. Poly (ADP-ribose) polymerase-1 is a key mediator of liver inflammation and fibrosis. Hepatology. 2014;59:1998–2009. doi: 10.1002/hep.26763. [DOI] [PMC free article] [PubMed] [Google Scholar]
- 56.Bray NL, Pimentel H, Melsted P, Pachter L. Near-optimal probabilistic RNA-seq quantification. Nat Biotechnol. 2016;34:525–527. doi: 10.1038/nbt.3519. [DOI] [PubMed] [Google Scholar]
Associated Data
This section collects any data citations, data availability statements, or supplementary materials included in this article.
Supplementary Materials
Data Availability Statement
All RNA-sequencing data generated from this study are available under the accession number GSE210371 on Gene Expression Omnibus (GEO) website. Datasets used for validations and single-cell data analysis are available under the accession PRJNA516151, GSE183915, and GSE115469. The GTEx data can be accessed via dbGAP with accession number phs000424. Codes used to analyze the data and generate the figures are available at https://doi.org/10.5281/zenodo.8193694. Raw images from the histology are available at https://doi.org/10.5281/zenodo.8193135. Source data for the histology and assay analysis figures can be found in Supplementary Table 5.


