

Summary
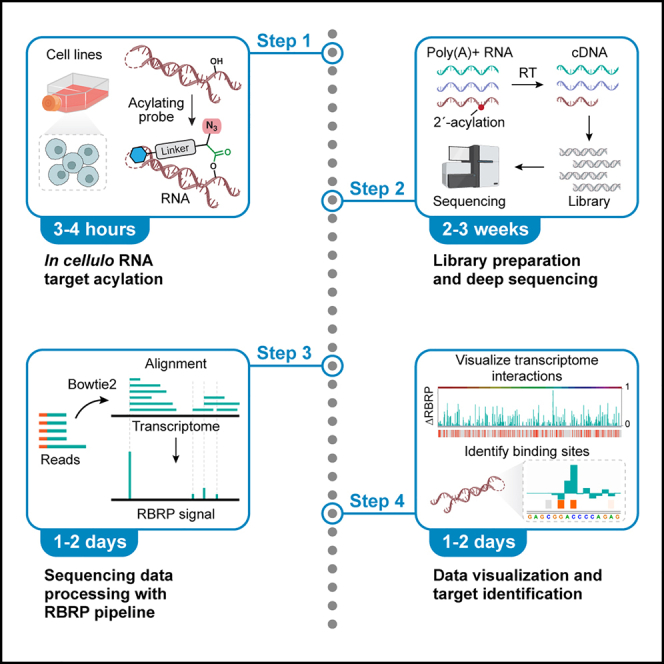
Protein-targeted small-molecule drugs may unintentionally bind intracellular RNA, contributing to drug toxicity. Moreover, new drugs are actively sought for intentionally targeting RNA. Here, we present a protocol to globally profile RNA-drug interactions in human cells using acylating probes and next-generation sequencing. We describe steps for cell culture, target acylation, library preparation, and sequencing. Detailed bioinformatic analyses identify drug-binding RNA loci in ∼16,000 poly(A)+ human transcripts. This streamlined workflow identifies RNA-drug interactions at single-nucleotide resolution, revealing widespread transcriptome interactions of drugs.
For complete details on the use and execution of this protocol, please refer to Fang et al.1
Subject areas: Bioinformatics, RNAseq, Chemistry
Graphical abstract
Highlights
-
•
Profiling 2′-hydroxyl reactivity to uncover small-molecule-RNA interactions
-
•
Steps described for using acylation probes to identify RNA-small-molecule interactions
-
•
Unveiling small-molecule-RNA binding sequence at single-nucleotide resolution
Publisher’s note: Undertaking any experimental protocol requires adherence to local institutional guidelines for laboratory safety and ethics.
Protein-targeted small-molecule drugs may unintentionally bind intracellular RNA, contributing to drug toxicity. Moreover, new drugs are actively sought for intentionally targeting RNA. Here, we present a protocol to globally profile RNA-drug interactions in human cells using acylating probes and next-generation sequencing. We describe steps for cell culture, target acylation, library preparation, and sequencing. Detailed bioinformatic analyses identify drug-binding RNA loci in ∼16,000 poly(A)+ human transcripts. This streamlined workflow identifies RNA-drug interactions at single-nucleotide resolution, revealing widespread transcriptome interactions of drugs.
Before you begin
Before starting the protocol, it is essential to have two chemical compounds at hand: the unmodified small-molecule drug to be analyzed (compound 1) and an acylating probe version of the drug (compound 2) derivatized from 1 (Figure 1A). The underlying principle of this protocol is that by preserving the key chemical features of 1 responsible for binding to an unknown RNA target,2,3 acylating probe 2 can exhibit comparable binding capability to the RNA target in live cells. The attachment of an acylimidazole moiety distal to the drug should not interfere with binding to the RNA targets, and facilitates the targeted acylation of 2′-hydroxyl (2′-OH) groups primarily in the neighboring unpaired RNA nucleotides1 (Figure 1B). Additionally, probe 2 contains an azide group that can be utilized for strain-promoted azide-alkyne cycloaddition (SPAAC) reaction, enabling the conjugation of a biotin group for downstream target enrichment via click chemistry (Figure 1C). Below, we describe the design and chemical synthesis of the acylating probe. For complete details on the acylating probe, please refer to Fang et al.1
Figure 1.

Overview of Reactivity-Based RNA Profiling (RBRP)
(A) Chemical structure of the parent small molecule 1 to profile for its transcriptome interactions in human cells (left) and the acylating probe 2 (right). Acylating probe 2 contains an RNA-reactive group (acylimidazole) and an azide group as a “click” handle.
(B) Acylating probe leads to targeted 2′-acylation of 2′-OH groups in the neighboring RNA nucleotides within the drug-binding loci.
(C) Experimental protocol of RBRP. Cultured cell lines are treated with acylating probe 2 with or without pretreatment by the parent small molecule 1. This leads to RNA target acylation in cells. Poly(A)+ RNAs are isolated and the acylated RNAs are conjugated to a biotin moiety via click chemistry. After reverse transcription, 2′-acylation causes premature truncation of cDNA products, which are isolated and sequenced. Deep sequencing reads are analyzed using the RBRP bioinformatics pipeline to calculate RBRP scores for nucleotides across the identified transcripts.
In this protocol, we describe RNA target deconvolution in adhesive HEK293 cells. However, it can be modified for use with different types of cultured cells and tissue-derived cells. Adaptions to other cell types may involve optimizing the total number of input cells and culturing medium, given their unique RNA abundance and nutrient requirements. Furthermore, this protocol can be adapted to many other small-molecule ligands. It should be noted that modifications to the design of acylating probes are anticipated, especially for parent ligands that possess distinct physicochemical characteristics.
Design and synthesis of probe 2
Timing: 2–4 weeks
-
1.The design and synthesis of acylating probes rely heavily on the structural features of the parent drug. The parent drug should have a chemical moiety (e.g., carboxylic acid, primary and secondary amine, thiol, and alcohol) that allows for facile attachment of the acylimidazole-containing linker. For acylating probe 2, there are several important considerations for probe design:
-
a.Probe 2 must contain an RNA-reactive group, such as acylimidazole, to allow selective covalent modification of 2′-OH groups within drug-binding RNA loci. The choice of the linker connecting the parent drug and acylimidazole depends on factors such as synthetic accessibility and minimal disruption to the core drug structure and charge status. Positive charges (from amine basic groups) should be maintained.
-
b.Probe 2 should not contain nucleophilic functional groups that react and quench the acylimidazole warhead. The final probe structure should avoid containing the following functional groups: primary and secondary amines, alcohol, alkoxyamine, hydrazine, and thiol groups.
-
c.Probe 2 must contain an azido group to facilitate strain-promoted azide-alkyne cycloaddition. This allows the installation of a biotin group for the enrichment of acylated target RNAs via streptavidin-biotin pulldown.
-
a.
Note: It is essential to note that probe 2 can still retain ability to bind to the RNA target, although its chemical modification may alter its affinity.1 For example, parent drug 1 has an EC50 of 1.6 μM towards YBX1 mRNA, as compared to >10 μM for probe 2. However, probe 2 can be competed for acylating YBX1 mRNA by parent drug 1, demonstrating that binding is driven by the structural characteristics of 1. For further details on the synthetic protocol to access probe 2, please refer to Fang et al.1
CRITICAL: Acylating probes can be freshly prepared as a concentrated stock (typically 200 mM) by a one-step reaction of the carboxylic acid precursor and 1,1′-carbonyldiimidazole in anhydrous dimethyl sulfoxide (DMSO). Acylimdazoles are relatively unstable in aqueous solutions (half-lives range from minutes to hours). Thus, the reaction must be performed under anhydrous conditions. The concentrated stocks can also be stored for up to one week under argon at -80°C. Dilute the concentrated stock with anhydrous DMSO to generate a 50 mM working stock solution immediately before use. When handling these reagents, wear personal protection equipment, including gloves, goggles, and lab coats.
Culturing of human embryonic kidney cells (HEK293)
-
2.Seed human embryonic kidney cells (HEK293) into a T75 flask:
-
a.Thaw a cryogenic vial containing 1 mL of 1 × 10⁶ human embryonic kidney cells (HEK293) at 37°C for less than 5 min.
-
b.Once thawed, immediately transfer the cell suspension to 9 mL of DMEM supplemented with 10% v/v fetal bovine serum (FBS).
-
c.Centrifuge at 110 × g for 3 min at 20°C.
-
d.Aspirate supernatant. Suspend cells with 10 mL of DMEM supplemented with 10% v/v fetal bovine serum (FBS) and seed cells into a T75 flask.
-
e.Maintain cells at 37°C with 5% CO2 until the cells reach 90% confluency.
-
a.
Note: Change medium with fresh pre-warmed (37°C) DMEM supplemented with 10% v/v FBS every two days.
Note: A cryogenic vial of human embryonic kidney cells typically contains 1 × 10⁶ total cells in 1 mL DMEM containing 50% v/v FBS and 10% v/v DMSO and is prepared from cultured cells that are approximately 90% confluent. Warm all reagents in a water bath at 37°C. Sterilize the cell culture hood, supplies, and equipment with 70% ethanol. The DMSO in the thawed cryogenic medium is toxic for the cells; thus, step 2b must be conducted rapidly.
-
3.Passage human embryonic kidney cells (HEK293) into a T75 flask:
-
a.Once the cells reach 90% confluency, remove the medium and wash the cells with 8 mL of DPBS.
-
b.Add 1 mL of 0.05% Trypsin-EDTA to detach cells from the flask.
-
c.Incubate for 3 min at 37°C with 5% CO2.
-
d.Add 8 mL of DMEM supplemented with 10% v/v FBS and transfer cells to a 15-mL falcon tube.
-
e.Pellet cells by centrifuging at 110 × g for 3 min at 20°C and aspirate the supernatant.
-
f.Suspend cells with 10 mL of DMEM supplemented with 10% v/v FBS.
-
g.Seed 2 mL of cell suspension into a T75 flask and add 8 mL of DMEM supplemented with 10% v/v FBS.
-
h.Maintain cells at 37°C with 5% CO2 until the cells reach 90% of confluency.
-
a.
Note: Passage cells at least three times before treatment with chemical probes.
-
4.Seed human embryonic kidney cells (HEK293) into a 150-mm Petri dish:
-
a.Once the cells reach 90% confluency, remove the medium and wash the cells with 8 mL of DPBS.
-
b.Add 1 mL of 0.05% Trypsin-EDTA to detach cells from the flask.
-
c.Incubate for 3 min at 37°C with 5% CO2.
-
d.Add 8 mL of DMEM supplemented with 10% v/v FBS and transfer cells to a 15-mL falcon tube.
-
e.Pellet cells by centrifuging at 110 × g for 3 min at 20°C and aspirate the supernatant.
-
f.Suspend cells with 10 mL of DMEM supplemented with 10% v/v FBS.
-
g.Seed 5.0 × 10⁶ of cell suspension into a 150-mm Petri dish and add DMEM supplemented with 10% v/v FBS to 20 mL.
-
h.Maintain cells at 37°C with 5% CO2 until the cells reach a total number 20 × 106 per biological replicate (∼80%–90% confluency).
-
a.
Note: In principle, other adhesive and suspension mammalian cell lines and primary cells can be used in this protocol. Adaptation to other cells should depend on cell-specific growth conditions and cell characteristics.
Prepare the software and computing environment
This section describes the software and packages required for this protocol. The protocol needs to be executed on a Linux operating system. Ensure that your operating system can support the installation and use of Python (version = 3.6.6) and Perl (version = v5.26.2) languages, and ensure that your computing hardware or computing clusters/servers have enough space (on average, 200 GB per sample) to store the related files and results. The bioinformatics pipeline for Reactivity-Based RNA Profiling (RBRP) is built based on icSHAPE pipeline.4,5 RBRP pipeline quantifies drug-promoted 2′-OH acylation in RBRP experiments.
-
5.
Install and configure the icSHAPE pipeline following the instructions from the github site of icSHAPE.
-
6.
Copy three scripts <normalizeRTfileScaleFactor1.pl>, <calcRBRPminusCtrl.pl>, and <filterRTstopBD.pl> from the github site of RBRP to /icSHAPE/scripts/ to complete full installation.
-
7.Generate Bowtie2 transcriptome index.
-
a.Generate a transcriptome FASTQ file with gffread function. ‘genome.fa’ is the primary assembly file of the human genome sequence downloaded from Ensembl website. ‘genome.size’ is a tab-delimited text file consisted of two columns, with the first column listing the name of chromosomes and the second column presenting the length of each chromosome. ‘Genome.gtf’ is the human genome annotation GTF file downloaded from Ensemble website.> gffread -g genome.fa -s genome.size -W -M -F -G -A -O -w transcriptome.fa -d transcriptome.collapsed.info Genome.gtf
-
b.Generate Bowtie 2 transcriptome index file. ‘transcriptome.fa’ is the transcriptome FASTQ file generated from the previous step. ‘transcriptome’ is the output that contains six individual files, including ‘transcriptome.1.bt2’, ‘transcriptome.2.bt2’, ‘transcriptome.3.bt2’, ‘transcriptome.3.bt2’, ‘transcriptome.4.bt2’, ‘transcriptome.rev.1.bt2’, and ‘transcriptome.rev.2.bt2’.> bowtie2-build transcriptome.fa transcriptome
-
a.
Key resources table
| REAGENT or RESOURCE | SOURCE | IDENTIFIER |
|---|---|---|
| Chemicals, peptides, and recombinant proteins | ||
| 1,1′-Carbonyldiimidazole (CDI) | Sigma | Cat#115533-5G |
| Dimethylsulfoxide (DMSO) [used for cell culture and probe treatment] | ATCC (American Type Culture Collection) | Cat#4-X |
| Dimethylsulfoxide (DMSO), anhydrous [used for synthesis of acylating probe 2] | Sigma | Cat#276855 |
| Compound 1 (Levofloxacin) | TCI | Cat#L0193 |
| Acylating probe 2 | Customized synthesis in lab | N/A |
| N,N,N′,N′-Tetramethyl ethylenediamine (TEMED) | Millipore Sigma | Cat#T9281 |
| Critical commercial assays | ||
| Zymo Quick-RNA Midiprep kit | Zymo | Cat#R1056 |
| Agilent RNA 6000 Pico kit | Agilent | Cat#5067-1513 |
| Poly(A)Purist MAG kit | Thermo Fisher Scientific | Cat#AM1922 |
| RNeasy Mini Kit | QIAGEN | Cat#74104 |
| Zymo RNA Cleanup and Concentrator Column-5 | Zymo | Cat#R1013 |
| Zymo DNA cleanup & concentrator column-5 kit | Zymo | Cat#D4014 |
| QIAGEN MinElute Gel Extraction kit | QIAGEN | Cat#28604 |
| High Sensitivity DNA Analysis kit | Agilent | Cat#5067-4626 |
| Qubit dsDNA HS Assay kit | Thermo Fisher Scientific | Cat#Q32851 |
| Deposited data | ||
| Raw next-generation sequencing datasets | Gene Expression Omnibus (GEO); BioRxiv preprint | GEO: GSE229331; Original publication: https://doi.org/10.1038/s41557-023-01309-8 |
| Experimental models: cell lines | ||
| Human embryonic kidney cells (HEK293) | ATCC (American Type Culture Collection) | Cat#CRL-1573 |
| Oligonucleotides | ||
| 3′-ddC adapter (DNA oligo) | IDT | /5rApp/AGATCGGAAGAGCGGTTCAG/3ddC/ |
| 3′-Biotin adapter (DNA oligo) | IDT | /5rApp/AGATCGGAAGAGCGGTTCAG/3biotin/ |
| PE1 primer (DNA oligo) | IDT | AATGATACGGCGACCACCGAGATCTACACTC TTTCCCTACACGACGCTCTTCCGATCT |
| PE2 primer (DNA oligo) | IDT | CAAGCAGAAGACGGCATACGAGATCGGTC TCGGCATTCCTGCTGAACCGCTCTTCCGATCT |
| RT primer-1 (DNA oligo) | IDT | /5phos/DDDNNAACCNNNNAGATCGGAA GAGCGTCGTGGA/iSp18/GGATCC/iSp18/TACTGAACCGC |
| RT primer-2 (DNA oligo) | IDT | /5phos/DDDNNACAANNNNAGATCGGAAGA GCGTCGTGGA/iSp18/GGATCC/iSp18/TACT GAACCGC |
| RT primer-3 (DNA oligo) | IDT | /5phos/DDDNNAGGTNNNNAGATCGGAAGA GCGTCGTGGA/iSp18/GGATCC/iSp18/TACT GAACCGC |
| RT primer-4 (DNA oligo) | IDT | /5phos/DDDNNATTGNNNNAGATCGGAAGA GCGTCGTGGA/iSp18/GGATCC/iSp18/TACT GAACCGC |
| RT primer-5 (DNA oligo) | IDT | /5phos/DDDNNGCCANNNNAGATCGGAAGA GCGTCGTGGA/iSp18/GGATCC/iSp18/TACT GAACCGC |
| RT primer-6 (DNA oligo) | IDT | /5phos/DDDNNGACCNNNNAGATCGGAAG AGCGTCGTGGA/iSp18/GGATCC/iSp18/TACT GAACCGC |
| RT primer-7 (DNA oligo) | IDT | /5phos/DDDNNGATTNNNNAGATCGGAAGA GCGTCGTGGA/iSp18/GGATCC/iSp18/TACT GAACCGC |
| RT primer-8 (DNA oligo) | IDT | /5phos/DDDNNTTGANNNNAGATCGGAAGA GCGTCGTGGA/iSp18/GGATCC/iSp18/TACT GAACCGC |
| RT primer-9 (DNA oligo) | IDT | /5phos/DDDNNCTGGNNNNAGATCGGAAG AGCGTCGTGGA/iSp18/GGATCC/iSp18/TACT GAACCGC |
| RT primer-10 (DNA oligo) | IDT | /5phos/DDDNNTCCTNNNNAGATCGGAAG AGCGTCGTGGA/iSp18/GGATCC/iSp18/TAC TGAACCGC |
| RT primer-11 (DNA oligo) | IDT | /5phos/DDDNNGGAANNNNAGATCGGAAG AGCGTCGTGGA/iSp18/GGATCC/iSp18/TAC TGAACCGC |
| RT primer-12 (DNA oligo) | IDT | /5phos/DDDNNCAAGNNNNAGATCGGAAGA GCGTCGTGGA/iSp18/GGATCC/iSp18/TACT GAACCGC |
| RT primer-13 (DNA oligo) | IDT | /5phos/DDDNNTAGTNNNNAGATCGGAAGA GCGTCGTGGA/iSp18/GGATCC/iSp18/TAC TGAACCGC |
| RT primer-14 (DNA oligo) | IDT | /5phos/DDDNNCCAGNNNNAGATCGGAAG AGCGTCGTGGA/iSp18/GGATCC/iSp18/TACT GAACCGC |
| Software and algorithms | ||
| Prism 9.5.1 (528) | GraphPad | https://www.graphpad.com/ |
| icSHAPE pipeline | GitHub | https://github.com/qczhang/icSHAPE |
| RBRP pipeline | GitHub | https://github.com/linglanfang/RBRP |
| Bowtie2 | John Hopkins University | https://bowtie-bio.sourceforge.net/bowtie2/index.shtml |
| Cufflinks | GitHub | http://cole-trapnell-lab.github.io/cufflinks/ |
| FastQC | Babraham Institute | https://www.bioinformatics.babraham.ac.uk/projects/fastqc/ |
| Trimmomatic | THE USADEL LAB | http://www.usadellab.org/cms/index.php?page=trimmomatic |
| ucsc_tools | UCSC Genomics Institute | https://genome.ucsc.edu/util.html |
| WiggleTools | GitHub | https://github.com/Ensembl/WiggleTools |
| Python 3.6.6 | Python | https://www.python.org/ |
| Perl 5.26.2 | Perl | https://www.perl.org/ |
| RStudio 2022.12.0 + 353 | RStudio | https://www.rstudio.com/ |
| Integrative Genomics Viewer (IGV) | Broad Institute | https://software.broadinstitute.org/software/igv/ |
| Other | ||
| Nunc EasYFlask Cell Culture Flasks (T-75 flask) | Thermo Fisher Scientific | Cat#156499 |
| DMEM (high glucose, pyruvate) | Thermo Fisher Scientific | Cat#11995040 |
| Fetal bovine serum | Thermo Fisher Scientific | Cat#16000044 |
| DPBS | Thermo Fisher Scientific | Cat#14190144 |
| Trypsin-EDTA (0.05%), phenol red | Thermo Fisher Scientific | Cat#25300062 |
| Nunc 15 mL Conical Sterile Polypropylene Centrifuge Tubes | Thermo Fisher Scientific | Cat#339651 |
| Nunc Cell Culture/Petri Dishes (150 mm) | Thermo Fisher Scientific | Cat#150288 |
| UltraPure TBE Buffer, 10× | Thermo Fisher Scientific | Cat#15581044 |
| NERL High Purity Water | Thermo Fisher Scientific | Cat#9805 |
| SYBR Gold Nucleic Acid Gel Stain (10,000× Concentrate in DMSO) | Thermo Fisher Scientific | Cat#S11494 |
| RNase-free water | Thermo Fisher Scientific | Cat#J70783.AE |
| RNase AWAY Surface Decontaminant | Thermo Fisher Scientific | Cat#7002PK |
| T4 Polynucleotide Kinase (T4 PNK) | New England Biolabs | Cat#M0201L |
| FastAP Thermosensitive Alkaline Phosphatase (1 U/μL) | Thermo Fisher Scientific | Cat#EF0651 |
| RiboLock RNase Inhibitor (40 U/μL) | Thermo Fisher Scientific | Cat#EO0381 |
| Dithiothreitol (DTT) | Thermo Fisher Scientific | Cat#D1532 |
| T4 RNA Ligase 1 (ssRNA Ligase) | New England Biolabs | Cat#M0204L |
| Deoxynucleotide (dNTP) Solution Mix (10 mM each) | New England Biolabs | Cat#N0447L |
| SuperScript III Reverse Transcriptase | Thermo Fisher Scientific | Cat#18080093 |
| Tris (1 M), pH 7.0, RNase-free | Thermo Fisher Scientific | Cat#AM9850G |
| NaCl (5 M), RNase-free | Thermo Fisher Scientific | Cat#AM9759 |
| EDTA (0.5 M), pH 8.0, RNase-free | Thermo Fisher Scientific | Cat#AM9260G |
| Tween 20 | Sigma | Cat#P9416 |
| DIBO-Biotin | Millipore Sigma | Cat#760749 |
| D-Biotin | Thermo Fisher Scientific | Cat#B20656 |
| RNase H (5,000 U/mL) | New England Biolabs | Cat#M0297L |
| RNase Cocktail Enzyme Mix | Thermo Fisher Scientific | Cat#AM2286 |
| Phusion High-Fidelity PCR Master Mix with HF Buffer | New England Biolabs | Cat#M0531S |
| SYBR Green I Nucleic Acid Gel Stain - 10,000× concentrate in DMSO | Thermo Fisher Scientific | Cat#S7563 |
| Thermo IEC Centra CL3R centrifuge | Thermo Electron | N/A |
| Falcon Pipet Controller | Corning | Cat#357469 |
| Precision General Purpose Water Baths | Thermo Fisher Scientific | Cat#TSGP05 |
| NanoDrop One Spectrophotometer | Thermo Fisher Scientific | Cat#ND-ONE-W |
| FreeZone 4.5 L -84C Benchtop Freeze Dryer | LABCONCO | Cat#710401000 |
| MiniAmp Plus Thermal Cycler | Thermo Fisher Scientific | Cat#A37835 |
| StepOnePlus Real-Time PCR System | Thermo Fisher Scientific | Cat#4376600 |
| Qubit 3 Fluorometer | Thermo Fisher Scientific | Q33216 |
| Qubit Assay Tubes | Thermo Fisher Scientific | Cat#Q32856 |
| 1.5 mL Snaplock Microcentrifuge Tube | Corning | Cat#MCT-150-C-S |
| TempAssure 0.2 mL PCR 8-Tube Strips, Att. Dome Caps | USA Scientific | Cat#1402-2900 |
| 10 mL serological pipette | Thermo Fisher Scientific | Cat#170356N |
| Low Range ssRNA Ladder | New England Biolabs | Cat#N0364S |
| 10 bp DNA Ladder | Invitrogen | Cat#10821-015 |
| 10 μL XL Graduated Filter Tips | USA Scientific | Cat#1120-3810 |
| AmpliPur Expert Tips (1–20 μL) | AmpliPur | Cat#F174201 |
| 200 μL Graduated Filter Tips | USA Scientific | Cat#1120-8810 |
| 1000 μL XL Graduated Filter Tips | USA Scientific | Cat#1122-1830 |
| P10 pipette | Eppendorf | Cat#3123000020 |
| P20 pipette | Gilson | Cat#F144056M |
| P200 pipette | Gilson | Cat#F144058M |
| P1000 pipette | Eppendorf | Cat#3123000063 |
| Razor blades | Fisher Scientific | Cat#12-640 |
| ReadyProbes Solvent-Resistant Permanent Marking Pen | Thermo Fisher Scientific | Cat#R37623 |
| RNA Gel Loading Dye (2×) | Thermo Fisher Scientific | Cat#R0641 |
| RNA Fragmentation Reagents | Thermo Fisher Scientific | Cat#AM8740 |
| SequaGel UreaGel 19:1 Denaturing Gel System | national diagnostics | Cat#EC-833-2.2literkit |
| PrecisionGlide 20-gauge needle | Fisher Scientific | Cat#BD 305176 |
| RNase-free microfuge tubes, 2.0 mL | Thermo Fisher Scientific | Cat#AM12425 |
| Nonstick, RNase-free microfuge tubes, 0.5 mL | Thermo Fisher Scientific | Cat#AM12350 |
| Corning Costar Spin-X centrifuge tube filters | Millipore Sigma | Cat#CLS8162-96EA |
| Amicon Ultra-0.5 Centrifugal Filter Unit (10 kDa NMWCO) | Millipore Sigma | Cat#UFC5010 |
| Dynabeads MyOne Streptavidin C1 | Thermo Fisher Scientific | Cat#65001 |
| 6-Tube Magnetic Separation Rack | New England Biolabs | Cat#S1506S |
| Tube Revolver Rotator | Thermo Fisher Scientific | Cat#88881001 |
| CircLigase II ssDNA Ligase | VWR | Cat#CL9021K |
| TopVision Agarose | Thermo Fisher Scientific | Cat#R0491 |
| Promega Blue/Orange Loading Dye, 6× | Promega | Cat#PR-G1881 |
Materials and equipment
Recipes for solutions used in this protocol
Short recipes:
-
•
1xTBE buffer: Mix 100 mL of UltraPure TBE Buffer (10×) with 900 mL of NERL High Purity Water.
Store at 20°C for up to six months.
-
•
1xSYBR Gold staining solution: Add 5 μL 1xSYBR Gold staining solution in 50 mL 1xTBE buffer.
Prepare freshly before use. Store at 20°C and prevent light exposure by covering with aluminum foil.
-
•
DMEM medium supplemented with 10% v/v FBS: Add 50 mL of fetal bovine serum (FBS) to 450 mL of DMEM medium.
Store at 4°C for up to three months.
-
•
25xSYBR Green I solution: Dilute 2 μL 10,000xSYBR Green I Nucleic Acid Gel Stain with 798 μL of DMSO. Mix thoroughly by vortexing. Cover with aluminum foil.
Store at −20°C for up to six months.
Recipes with ≥ 3 ingredients
Repair Mix
| Reagent | Final concentration | Amount |
|---|---|---|
| 10xT4 PNK buffer | 1× | 1 μL |
| RNase-free water | N/A | 5 μL |
| RiboLock RNase inhibitor | 4 U/μL | 1 μL |
| T4 PNK (10,000 U/mL) | 2 U/μL | 2 μL |
| FastAP 1 U/μL | 0.1 U/μL | 1 μL |
| Total | N/A | 10 μL |
Note: This Repair Mix should be prepared freshly before use.
Ligation Mix-ddC
| Reagent | Final concentration | Amount |
|---|---|---|
| 10xRNA Ligase Buffer | 0.94× | 1.5 μL |
| 50% v/v PEG8000 | 24% | 7.5 μL |
| 10 μM 3′-ddC adapter oligo | 1.57 μM | 2.5 μL |
| 200 mM DTT | 7.9 mM | 0.625 μL |
| T4 RNA ligase 1 (10,000 U/mL) | 2.36 U/μL | 3.75 μL |
| Total | N/A | 15.875 μL |
Note: This Ligation Mix should be prepared freshly before use. The final concentration refers to the concentration of each reagent after adding the Ligation Mix to the 10 μL end-repair reaction. Sequence of 3′-ddC adapter oligo: /5rApp/AGATCGGAAGAGCGGTTCAG/3ddC/. The reagent kit “T4 RNA ligase 1” includes the 50% v/v PEG8000 reagent.
6% denaturing Urea PAGE gel (8 mm × 10 mm × 1 mm)
| Reagent | Final concentration | Amount |
|---|---|---|
| UreaGel Concentrate | 6% monomer | 7.2 mL |
| UreaGel System Diluent | N/A | 19.8 mL |
| UreaGel System Buffer | N/A | 3 mL |
| 10% w/v APS solution | 0.08% w/v | 240 μL |
| TEMED | 0.0004% v/v | 12 μL |
| Total | N/A | 30.3 mL |
Note: The gel solution must be prepared freshly before each use.
Ligation Mix-biotin
| Reagent | Final concentration | Amount |
|---|---|---|
| 10xRNA Ligase Buffer | 0.94× | 1.5 μL |
| 50% v/v PEG8000 | 24% | 7.5 μL |
| 10 μM 3′-biotin adaptor oligo | 1.57 μM | 2.5 μL |
| 200 mM DTT | 7.9 mM | 0.625 μL |
| T4 RNA ligase 1 (10,000 U/mL) | 2.36 U/μL | 3.75 μL |
| Total | N/A | 15.875 μL |
Note: This Ligation Mix should be prepared freshly before use. The final concentration refers to the concentration of each reagent after adding the Ligation Mix to the 10 μL end-repair reaction. Sequence of 3′-biotin adaptor oligo: /5rApp/AGATCGGAAGAGCGGTTCAG/3biotin/. The reagent kit “T4 RNA ligase 1” includes the 50% v/v PEG8000 reagent.
RT Mix
| Reagent | Final concentration | Amount |
|---|---|---|
| 5xFirst Strand Buffer | 1× | 4 μL |
| 10 mM dNTPs | 0.5 mM (each dNTP) | 1 μL |
| 100 mM DTT | 5 mM | 1 μL |
| RiboLock RNase inhibitor | 1.5 U/μL | 0.75 μL |
| SuperScript III reverse transcriptase | 12.5 U/μL | 1.25 μL |
| Total | N/A | 8 μL |
Note: This RT Mix should be prepared freshly before use. Add SuperScript III reverse transcriptase at last.
cDNA Binding Buffer
| Reagent | Final concentration | Amount |
|---|---|---|
| 1 M Tris, pH 7.0 | 100 mM | 10 mL |
| 5 M NaCl | 1 M | 20 mL |
| 500 mM EDTA | 10 mM | 2 mL |
| Tween-20 | 0.2% v/v | 200 μL |
| Nuclease-free water | N/A | 67.8 mL |
| Total | N/A | 100 mL |
Note: The cDNA Binding Buffer can be stored at 4°C for up to one month. Do not use this buffer if you observe precipitation of salts.
cDNA Washing Buffer
| Reagent | Final concentration | Amount |
|---|---|---|
| 1 M Tris, pH 7.0 | 100 mM | 10 mL |
| 5 M NaCl | 4 M | 80 mL |
| 500 mM EDTA | 10 mM | 2 mL |
| Tween-20 | 0.2% v/v | 200 μL |
| Nuclease-free water | N/A | 7.8 mL |
| Total | N/A | 100 mL |
Note: The cDNA Washing Buffer can be stored at 4°C for up to one month. Do not use this buffer if you observe precipitation of salts.
cDNA Elution Mix
| Reagent | Final concentration | Amount |
|---|---|---|
| 10× RNase H Buffer | 1× | 5 μL |
| 1 μM PE2 primer | 20 nM | 1 μL |
| 50 mM D-biotin | 12.5 mM | 12.5 μL |
| RNase H (5,000 U/mL) | 0.1 U/μL | 1 μL |
| RNase cocktail enzyme mix | N/A | 1 μL |
| Nuclease-free water | N/A | 29.5 μL |
| Total | N/A | 50 μL |
Note: The cDNA Elution Mix must be prepared freshly before use.
qPCR Mix
| Reagent | Final concentration | Amount |
|---|---|---|
| 2× Phusion HF PCR master mix | 1.87× | 20 μL |
| 20 μM PE1 primer | 0.5 μM | 0.5 μL |
| 20 μM PE2 primer | 0.5 μM | 0.5 μL |
| 25× SYBR Green I | 0.47× | 0.4 μL |
| Total | N/A | 21.4 μL |
Note: The qPCR Mix must be prepared freshly before use.
3% low melting-point agarose gel
| Reagent | Final concentration | Amount |
|---|---|---|
| Topvision agarose | 3% w/v | 3 g |
| 1xTBE | 1× | 100 mL |
| Total | N/A | 100 mL |
Note: This gel solution must be prepared freshly before each use. Heat in a microwave with 15-sec pulses until the solution becomes fully homogeneous.
Step-by-step method details
The timing for each step is calculated for the preparation of ten sequencing samples.
In cellulo RNA target acylation
This step outlines treatment with competing parent drug, detachment of the cells, and target acylation with acylating probe in the relevant cell line. Pre-treatment with the parent drug 1 competes for acylation labeling of probe 2 for RNA targets, for identification of drug-specific sites (Figure 1C). Treatments with parent drug or vehicle control (DMSO) are performed to correct for random site acylation, random RNA breaks, and non-specific RNA binding events by biotin-mediated pulldown.
-
1.Pre-treatment with competing parent drug. Troubleshooting 1.
-
a.Add 200 μL of 15 mM (50×) stock of compound 1 in DMSO to 10 mL pre-warmed (37°C) DMEM medium supplemented with 10% v/v FBS.Note: The final concentration of 1 reaches 300 μM (2.0% DMSO).
-
b.Once the cells reach ∼80%–90% of confluency, replenish the medium with 10 mL fresh DMEM medium generated in step 1a.
-
c.Incubate cells at 37°C for 30 min with 5% CO2.CRITICAL: Potential effects of drug treatment on transcript abundance will be corrected with the next-generation sequencing as described later. The drug concentration of compound 1 is determined so that the stoichiometry of compound 1: probe 2 is 5:1 for effective competition. The concentrations should be adapted and tested for other drugs. In our experience, the optimal drug concentration can range from low to high micromolar depending on the biologically relevant concentration of drug and its solubility in water.Note: We find that performing RBRP with two biological replicates is sufficient for target identification. Bioinformatics analysis is performed for RNA regions with high concordance in transcript abundance and RT stop counts between biological replicates. The RBRP pipeline is compatible with any number of replicates. Optionally, users can add an additional biological replicate to enhance the statistical significance for target identification.
-
a.
-
2.Detachment of compound 1-treated cells. Troubleshooting 1.
-
a.Aspirate the medium and wash cells with 10 mL of PBS supplemented with 300 μM of compound 1 (2.0% DMSO).
-
b.Remove PBS and scrape the cells into 4 mL PBS supplemented with 300 μM of compound 1 (2.0% DMSO).
-
c.Count the cells and aliquot 20 million cells into a 15-mL falcon tube.
-
d.Centrifuge at 110 × g for 2 min at 20°C and aspirate the supernatant.
-
e.Use a cut-tip p1000 pipette tip to suspend the cell pellet in 1 mL of PBS supplemented with 1 (300 μM, 2.0% v/v DMSO).
-
f.Transfer the cell suspension to a 1.5 mL conical vial.
-
a.
Note: Warm all reagents in a water bath at 37°C to minimize perturbation to cells.
-
3.Live cell RNA target acylation. Troubleshooting 2.
-
a.After suspending cells, in the same suspension, add 1 μL of 50 mM probe 2 to both 1-treated and DMSO-treated cells.Note: The final concentration of probe 2 is 50 μM (0.1% v/v DMSO).
-
b.Incubate for 30 min at 37°C on a sample revolver with continuous rotation (20 rpm).
-
c.Stop the reaction by centrifuging the cells at 2,500 × g for 1 min at 4°C.
-
d.Aspirate the supernatant. Immediately proceed to step 7.
-
a.
-
4.Pre-treatment for bystander controls (treatment with DMSO or only compound 1). Troubleshooting 1.
-
a.(For DMSO-treated samples) Once the cells reach ∼80%–90% of confluency, remove the medium and add 10 mL fresh DMEM medium supplemented with 10% v/v FBS and 2% v/v DMSO.
-
b.(For samples only treated with compound 1) Once the cells reach ∼80%–90% of confluency, remove the medium and add 10 mL fresh DMEM medium supplemented with 10% v/v FBS and 300 μM of compound 1 (2% v/v DMSO).
-
c.Incubate cells at 37°C for 30 min with 5% CO2. Move to step 5.
-
a.
-
5.Detachment of cells in bystander controls.
-
a.Aspirate the medium and wash cells with 10 mL of PBS supplemented with 2.0% v/v DMSO.
-
b.Remove PBS and scrap the cells into 4 mL PBS supplemented with 2.0% v/v DMSO.
-
c.Count the cells and aliquot 20 million cells into a 15-mL falcon tube.
-
d.Centrifuge at 110 × g for 2 min at 20°C and aspirate the supernatant.
-
e.Use a cut-tip p1000 pipet tip to suspend the cell pellet in 1 mL of PBS supplemented with 2.0% v/v DMSO.
-
f.Transfer the cell suspension to a 1.5 mL conical vial and proceed to step 6.
-
a.
-
6.Live cell RNA target acylation. Troubleshooting 2.
-
a.After suspending cells, in the same suspension, add 1 μL of 50 mM probe 2 (final concentration of probe 2: 50 μM, 0.1% v/v DMSO) to both 1-treated and DMSO-treated cells.
-
b.Incubate for 30 min at 37°C on a sample revolver with continuous rotation (20 rpm).
-
c.Stop the reaction by centrifuging the cells at 2,500 × g for 1 min at 4°C.
-
d.Aspirate the supernatant. Immediately proceed to step 7.
-
a.
Isolation of total cellular RNAs and quality control
This following method describes the steps of RNA isolation after the acylation reaction. This methodology is based on the instructions from the Trizol LS reagent (Thermo Scientific, Cat# 10296028) and Zymo QuickRNA midiprep kit (Zymo, Cat# R1056; Binding capacity: 1 mg of RNA). For more details and troubleshooting, please refer to the manuals on Thermo website and Zymo website.
-
7.Cell lysis with Trizol LS reagent.
-
a.Suspend the cell pellet with 500 μL PBS and transfer cells to a 15-mL conical vial containing 6 mL of Trizol LS reagent.
-
b.Vortex for 15 s to homogenize the samples.CRITICAL: Trizol LS reagent is toxic when in contact with skin and if swallowed. Trizol LS reagent should be handled in a chemical fume hood. Be sure to wear a lab coat, disposable gloves, and safety googles when working with Trizol LS reagent. If in contact with skin, wash immediately with soap and water.
-
c.Add 1.2 mL of chloroform and vortex for 15 s at 20°C.
-
d.Incubate the sample at 20°C for 5 min.
-
e.Centrifuge at 2,500 × g for 15 min at 4°C.
-
f.Transfer the aqueous layer on the top to a new 15 mL conical vial.Note: The top aqueous layer should be collected carefully using a pipette. Avoid making contact or disturbing the organic layer. It’s preferred to tilt the vial to maximize the recovery of the aqueous layer during the collection.
-
g.Add 1× volume of 96%–100% of ethanol and vortex to mix thoroughly.
-
a.
-
8.Extraction of total cellular RNA.
-
a.Transfer the mixture to a Zymo-Spin V-E Column (binding capacity: 1 mg of RNA) from Zymo Quick-RNA Midiprep kit (Zymo, Cat#R1056) with reservoir on a vacuum manifold.Note: The vacuum manifold should be attached to a vacuum pump that is ideally capable of producing at least 400 mm Hg pressure. This step can also be performed on a centrifuge as an alternative, but it is not recommended as it requires extensive rounds of centrifugation. Steps 8b-f are performed with a microcentrifuge at 20°C.
-
b.Digest genomic DNAs.
-
i.Add 400 μL of RNA Wash Buffer to the Zymo-Spin V-E Column. Centrifuge at 10,000 × g for 30 s at 20°C.
-
ii.Add 80 μL of DNA Digestion Buffer containing 5 μL of DNase I (1 U/μL) and incubate for 15 min at 20°C. Centrifuge at 10,000 × g for 30 s at 20°C.
-
i.
-
c.Add 400 μL RNA Prep Buffer to the column and centrifuge. Discard the flow-through.
-
d.Add 400 μL RNA Wash Buffer to the column and centrifuge. Discard the flow-through.
-
e.Add 400 μL RNA Wash Buffer and centrifuge for 2 min for complete removal of the wash buffer.
-
f.Transfer the column to a 1.5 mL RNase-free conical tube. Elute RNA from the column twice with 200 μL of water per elution (final ∼400 μL).
-
g.Use 2 μL of the eluted sample to determine the RNA concentration with Nanodrop UV-Vis Spectrophotometer.
 Pause point: RNA samples can be stored at −80°C for up to one month.Note: The Zymo QuickRNA Midiprep kit contains all reagents required for step 8. The expected RNA output is about 300–400 μg per sample.
-
a.
-
9.RNA Quality control.
-
a.Determine RNA quality using capillary electrophoresis (CE) with an Agilent RNA 6000 Pico kit (Agilent, Cat#5067-1513) on a 2100 BioAnalyzer (or similar instrument) following the manufacturer’s protocol from Agilent website. RNA Integrity Number (RIN) should be > 0.90 before being used in the sequencing library preparation.
-
a.
Extraction of poly(A)+ RNA
The following method describes the steps of extracting poly(A)+ RNA. This methodology is based on the instructions from the Poly(A)Purist MAG kit (Thermo Fisher Scientific, Cat#AM1922). For more details and troubleshooting, please refer to the manuals on the Thermo website.
Alternatives: Other poly(A)+ RNA selection kits are commercially available and can be used in this protocol, although they have not been explicitly tested. These kits are NEB Next Poly(A) mRNA Magnetic Isolation Module (New England Biolabs, Cat#E7490L), Poly(A) RNA Selection Kit V1.5 (Lexogen, Cat#157.96), PolyATtract mRNA Isolation Systems (Promega, Cat#Z5210), Seq-Star poly(A) mRNA Isolation Kit (Arraystar, Cat#AS-MB-006-01), RNeasy Pure mRNA Bead Kit (QIAGEN, Cat#180244).
-
10.Prepare the total RNA sample.
-
a.Dilute 250 μg of total RNA from step 8 into 400 μL with RNA Storage Solution.
-
b.Add 400 μL of 2× Binding Solution and vortex to mix thoroughly.
-
a.
-
11.Prepare the Oligo(dT) MagBeads.
-
a.For each biological replicate, transfer 25 μL of the Oligo(dT) MagBeads suspension (contains 250 mg of beads) to a 1.5-mL conical vial.
-
b.Place the vial on a magnetic rack for 1 min and carefully aspirate the supernatant with a p1000 pipette tip.Note: Handle with caution. Avoid contacting and disturbing the beads.
-
c.Wash the beads with 125 μL Wash Buffer 1 off the rack by inverting the vial ten times.
-
d.Place the vial on a magnetic rack for 1 min and carefully aspirate the supernatant with a p200 pipette tip.Note: Handle with caution. Avoid contacting and disturbing the beads.
-
e.Repeat steps11c-d for one time.
-
a.
-
12.Capture poly(A)+ RNA with Oligo(dT) MagBeads.
-
a.Add 400 μL of total RNA sample to the Oligo(dT) MagBeads pellet.
-
b.Mix by inverting the conical vial ten times.
-
c.Heat the sample at 70°C for 5 min and then incubate at 20°C for 60 min on a revolver (20 rpm).
-
d.Place the vial on a magnetic rack for 1 min and carefully aspirate the supernatant.
-
e.Add 400 μL of Wash Solution 1 and mix by inverting the conical vial ten times.
-
f.Place the vial on a magnetic rack for 1 min and carefully aspirate the supernatant.
-
g.Repeat steps 12e-f.
-
a.
-
13.Elute poly(A)+ RNA.
-
a.Preheat RNA Storage Solution at 70°C.
-
b.Add 200 μL of RNA Storage Solution (70°C) to the bead pellet and mix thoroughly by vortexing for 5 s.
-
c.Immediately place the vial on a magnetic rack for 1 min.
-
d.Transfer the supernatant to a new 1.5 mL RNase-free collection tube.
-
e.Repeat steps 13b-d to yield approximately 390 μL of RNA sample in total.
-
a.
-
14.Desalt and concentrate poly(A)+ RNA samples with QIAGEN RNeasy Mini kit (QIAGEN, Cat#74104).
-
a.Lyophilize the RNA samples from step 13e and redissolve in 100 μL of RNase-free water.Note: Alternatively, RNA samples can also be dried on a SpeedVac vacuum concentrator at 4°C.
-
b.Add 350 μL of buffer RLT (QIAGEN) and 900 μL of 96%–100% ethanol and vortex thoroughly to mix.
-
c.Transfer the sample to a QIAGEN RNeasy mini column (binding capacity: 100 μg of RNA).
-
d.Centrifuge for 30 s at 10,000 × g and discard flow-through.
-
e.Add 500 μL of Buffer RPE (QIAGEN) to the column.
-
f.Centrifuge for 60 s at 10,000 × g and discard flow-through. Repeat once.
-
g.Add 50 μL of RNase-free water to the column.
-
h.Incubate for 3 min at 20°C and then centrifuge for 30 s at 10,000 × g to elute RNA samples. Repeat once.
-
i.Use 2 μL of the eluted sample to determine the RNA concentration with Nanodrop UV-Vis Spectrophotometer.Pause point: Frozen RNA samples can be stored at −80°C for up to one month.Note: Expect to recover about 4 μg–5 μg of poly(A)+ RNA. Freeze poly(A)+ RNA samples as 500 ng aliquots at −80°C for storage. Buffer RLT and buffer RPE are included in the QIAGEN RNeasy Mini kit.Alternative: Another RNA desalting and concentrating kit in the market is Zymo RNA Cleanup and Concentrator Column-5 (Zymo, Cat#R1013). This kit can be used in step 14 without decreasing the integrity of RNA, although it has not been explicitly tested.
-
a.
Preparation of next-generation sequencing libraries
The following method describes the steps of biotin click reaction, RNA fragmentation, RNA end repair, RNA 3′-end ligation, cDNA synthesis and enrichment, cDNA circularization, and library amplification (Figure 2). The following steps are established by modifying a previously published protocol of next-generation sequencing library preparation for RNA structural analysis.4,5
-
15.Click reaction to install biotin to probe-labeled RNA.
-
a.Dilute 500 ng of poly(A)+ RNA from step 14 with RNase-free water to 16 μL.
-
b.Add 1 μL of RiboLock RNase inhibitor and 2 μL of 1.85 mM solution of DIBO-biotin in DMSO.Alternatives: In principle, other biotin-containing alkynes (for example, Click-iT sDIBO Biotin-alkyne. ThermoFisher, Cat#C20023) for copper-free click chemistry can also be used in this step.
-
c.Incubate samples at 37°C for 2 h on an orbital shaker.
-
d.After the reaction, purify RNA samples with Zymo RNA cleanup & concentration column-5 kit following the manufacturer’s protocol from the Zymo website.
-
e.Elute RNA with 20 μL of water for two times (final ∼39 μL). Lyophilize the RNA sample.Pause point: Biotinylated RNA samples can be stored at −80°C for up to one month.
-
a.
-
16.RNA fragmentation.
-
a.Dissolve free-dried RNA from step 15e in 9 μL of RNase-free water and transfer the sample to a 200-μL PCR tube.
-
b.Heat the sample at 95°C for 60 s on a thermal cycler (lid temperature: 105°C).
-
c.Add 1 μL of 10 x Fragmentation Reagent.
-
d.Incubate at 95°C for 50 s to yield a desired medium length of RNA fragments at ∼100 nucleotides.Note: The fragmentation pattern and the length of RNA fragments can be confirmed by electrophoresis on a 6% denaturing Urea PAGE gel as shown in Figure 3. We recommend optimizing the fragmentation conditions for different thermocyclers by varying the duration of fragmentation to yield RNA fragments with desired length. An example of RNA fragmentation under varied conditions is shown in Figure 3.
-
e.Immediately quench the reaction by adding 1 μL of 10 x Stop Solution. Flick to mix three times and immediately transfer onto ice.
-
f.Purify RNA samples with Zymo RNA cleanup & concentration column-5 kit following manufacturer’s protocol from Zymo website.
-
g.Elute RNA with 20 μL of water twice (final ∼39 μL). Lyophilize the RNA sample.Pause point: The RNA samples from step 16g can be stored at −80°C for up to one month.
-
a.
-
17.RNA end repair and ligation.
-
a.Dissolve the freeze-dried RNA from step 16g in 10 μL of Repair Mix.
-
b.Transfer samples to a 200-μL PCR tube.
-
c.Incubate at 37°C for 1 h on a thermal cycler.
-
d.3′-End ligation reaction:
-
i.For samples treated with probe 2: After 3′-end repair reaction, in the same tube, add 15.875 μL of Ligation Mix-ddC.Note: please see materials and equipment - Recipes with ≥ 3 ingredients for detailed recipe.
-
ii.For samples treated with vehicle control (DMSO): After 3′-end repair reaction, in the same tube, add 15.875 μL of Ligation Mix-ddBiotin.Note: Please see materials and equipment - Recipes with ≥ 3 ingredients for detailed recipe.To quantify and locate the probe-promoted 2′-acylation, it is crucial to characterize the basal level of RT-stop frequencies transcriptome-wide. For samples treated only with the vehicle control (DMSO) or drug, it is necessary to conjugate a biotin moiety to the fragmented RNAs via 3′-end ligation using an adaptor oligo containing a Biotin group (ddBiotin). Its purpose is to allow enrichment of the fragmented RNAs, which serves as the background sample to locate and quantify the basal level of RNA breaks due to RNA fragmentation. In contrast, probe 2-treated samples already contain a biotin moiety for enrichment with streptavidin beads. Thus, probe 2-treated samples do not require a biotin-containing adaptor oligo.
-
i.
-
e.Incubate at 25°C for 4 h in a thermocycler.
-
f.Purify RNA samples with Zymo RNA cleanup & concentration column-5 kit following manufacturer’s protocol from the Zymo website.
-
g.Elute RNA with 20 μL of water twice.
-
h.Lyophilize the RNA sample.
-
i.Size selection of ligated RNA products:
-
i.Dissolve RNA pellet with 7 μL of RNA loading dye (2×). Mix by flicking.
-
ii.Load 7 μL sample onto a 6% denaturing Urea PAGE gel.
-
iii.Run electrophoresis in 1× TBE buffer at 17 W until the bromophenol blue band travels for 2.5–3.0 cm.
-
iv.Stain the gel with 1xSYBR Gold staining solution for 3 min at 20°C.
-
v.Transfer the Urea PAGE gel onto a blue-light gel imager to record gel images.Note: The RNA loading buffer contains two dyes. Bromophenol blue migrates faster than the xylene cyan band. Thus, the band of bromophenol blue is at the bottom; the band of xylene cyan is on the top. Protective equipment for visual protection must be used (e.g., organge filter safety googles).CRITICAL: Add a lane of 7 μL of Low Range ssRNA Ladder (New England Biolabs, Cat#N0364S) to identify the location of ligated RNA product. Dilute 1 μL of Low Range ssRNA Ladder with 6 μL of RNA loading dye (2×). Mix by flicking.Note: As shown in Figure 4, the RNA adapter bands exhibit higher electrophoretic mobility than the ligated RNA fragments. The distribution of ligated RNAs should match the unmodified RNA fragments in step 16.
-
vi.Excise and collect the gel bands between 50 nt to 500 nt.
-
vii.Transfer the gel slices to a 600-μL PCR tube with a 20-gauge needle-hole.
-
viii.Place the 600-μL PCR tube into a 2-mL conical vial.
-
ix.Centrifuge at 16,000 × g for 5 min at 20°C to crush the gel slices into smaller particles.
-
x.Add 250 μL of RNase-free water.
-
xi.Transfer the resulting gel slurry into a 1.5-mL conical vial with a cut-tip p1000 pipette tip.Note: Use a pair of sterilized scissors to cut the tip of p1000 pipette tip. The scissors must be cleaned with RNase AWAY Surface Decontaminant.
-
xii.Transfer the gel slurry onto an orbital shaker.
-
xiii.Heat samples at 67°C for 15 min at∼700 rpm.
-
xiv.Transfer the gel slurry to a Spin-X column with a cut-tip p1000 pipette tip.
-
xv.Centrifuge at 7,000 × g for 1 min at 20°C and collect and transfer the eluent to a new 1.5-mL conical vial.
-
xvi.Add 250 μL of RNase-free water to the drained gel slurry and transfer the gel slurry back to a 1.5-mL conical vial.
-
xvii.Transfer the gel slurry onto an orbital shaker and heat at 67°C for 15 min at ∼700 rpm.
-
xviii.Transfer the gel slurry to the same Spin-X column from 17h(vii) and centrifuge at 7,000 × g for 1 min at 20°C.
-
xix.Collect and combine the eluent with the eluent from 17h(xv).
-
xx.Transfer 500 μL eluent to a 0.5-mL 10K Amicon filter. Centrifuge at 13,500 × g for 5 min at 4°C.Note: The volume of RNA sample should be reduced to ∼100 μL.
-
xxi.Purify RNA samples with Zymo RNA cleanup & concentration column-5 kit following manufacturer’s protocol from Zymo website. Elute RNA with 20 μL of water twice and lyophilize the eluted RNA sample.Pause point: 3′-Ligated RNA samples can be stored at −80°C for up to one month.
-
i.
-
a.
-
18.Reverse transcription and enrichment of biotinylated RNAs via streptavidin-mediated pulldown.
-
a.Reverse transcription:
-
i.Dissolve RNA from step 17 in 11 μL of RNase-free water.
-
ii.Add 1 μL of a uniquely barcoded RT primer and mix thoroughly by flicking.CRITICAL: Each RT primer contains a unique 4-nt long barcoded index. The sequence of the RT primer is /5phos/DDDNNXXXXNNNNAGATCGGAAGAGCGTCGTGGA/iSp18/GGATCC/iSp18/TACTGAACCGC (D = A/G/T and N = A/T/G/C are used to discriminate PCR duplicates. ‘XXXX’ is the specific experimental barcode. Please see the key resources table for the validated RT primer sequences). For a given 3′-ligated RNA sample, the choice of barcoded RT primer should not influence cDNA synthesis. Thus, users can assign one RT primer to each sample, as long as the barcodes of RT primers are different among samples. Sequencing reads of each sample will be demultiplexed later based on the 4-nt barcoded index sequence.Note: The barcoded RT primer anneals to the adaptor sequence, which was ligated to the RNAs at step 17. Users can expand the number of multiplexes by generating more uniquely barcoded RT primers with different index sequence “XXXX” in /5phos/DDDNNXXXXNNNNAGATCGGAAGAGCGTCGTGGA/iSp18/GGATCC/iSp18/TACTGAACCGC. The change of the barcoded index should not affect cDNA synthesis.
-
iii.Heat samples at 70°C for 5 min, then ramp down to 25°C by 0.3°C/s.
-
iv.Add 8 μL of RT Mix.
-
v.Heat reactions at 25°C for 3 min, 42°C for 5 min, 52°C for 30 min.
-
vi.After the reaction, proceed immediately to step 18b.
-
i.
-
b.Enrichment of biotinylated RNAs.
-
i.Prepare 20 μL of Dynabeads MyOne streptavidin C1 beads for each sample in a 1.5 mL conical tube.
-
ii.Add 1 mL of cDNA Binding Buffer and incubate for 15 min at 20°C to pre-equilibrate the beads.
-
iii.Place the beads on a magnetic rack for 1 min and remove the supernatant.
-
iv.Add 10 μL of cDNA Binding Buffer.
-
v.Transfer samples from 18a to 20 μL of pre-equilibrated beads.
-
vi.Incubate for 1 h at 20°C on a sample revolver (20 rpm).
-
vii.Place samples in a magnetic rack for 1 min at 20°C.
-
viii.Aspirate the supernatant carefully.
-
ix.Add 500 μL cDNA Washing Buffer and mix by inverting 5 times.
-
x.Place samples on a magnetic rack for 1 min at 20°C.
-
xi.Aspirate the supernatant carefully.
-
xii.Repeat 18b(ix-xi) for four times.
-
xiii.Add 500 μL of PBS and mix by inverting 5 times.
-
xiv.Place samples in a magnetic rack for 1 min at 20°C.
-
xv.Aspirate the supernatant carefully.
-
xvi.Repeat 18b(xiii-xv) once.CRITICAL: During step 18b, users must ensure the sample temperature stays at or below 37°C. Handle samples with fingers on the rim of the lid. Avoid heating the sample by touching the bottom of the sample tube with fingers.
-
i.
-
c.Elution of cDNA.
-
i.Suspend drained beads with 50 μL of cDNA Elution Mix.
-
ii.Incubate at 37°C for 30 min on an orbital shaker (∼700 rpm).Note: cDNA Elution Mix contains RNase H, RNase A, and RNase T1. cDNA is released from the streptavidin beads upon digestion of the RNAs. The beads do not need to be air-dried before elution.
-
iii.Add 1 μL DMSO and incubate at 95°C for 5 min.
-
iv.Place the samples immediately on a magnetic rack for 1 min at 20°C.
-
v.Transfer and collect the supernatant in a new 1.5-mL conical vial.
-
vi.Purify the eluted samples with Zymo DNA cleanup & concentrator column-5 kit (Zymo, Cat# D4014) as follows.
-
vii.Add 350 μL (7× volume) of DNA Binding Buffer and 350 μL of 96%–100% ethanol. Vortex to mix.
-
viii.Transfer the sample to the Zymo-Spin Column (binding capacity: 5 μg of DNA).
-
ix.Centrifuge at 10,000 × g for 30 s at 20°C. Discard the flow-through.
-
x.Add 200 μL of DNA washing buffer.
-
xi.Centrifuge at 10,000 × g for 30 s at 20°C. Discard the flow-through. Repeat the washing step once.
-
xii.Elute cDNA with 20 μL of water twice and lyophilize the eluted cDNA sample.Note: The cDNA can be stored at −80°C for up to 3 months.
-
i.
-
d.Size selection of cDNA:
-
i.Dissolve the cDNA pellet with 7 μL of RNA loading dye (2×). Mix by flicking.
-
ii.Load 7 μL sample onto a 6% denaturing Urea PAGE gel.
-
iii.Run electrophoresis with 1× TBE buffer at 17 W until the bromophenol blue band travels for 2.5–3.0 cm.
-
iv.Stain the gel with 1xSYBR Gold staining solution for 3 min at 20°C.
-
v.Transfer the Urea PAGE gel onto a blue-light gel imager.Note: The RNA loading buffer contains two dyes. Bromophenol blue migrates faster than the xylene cyan band. Thus, the band of bromophenol blue is at the bottom; the band of xylene cyan is at the top. Protective equipment for visual protection must be used (e.g., orange filter safety goggles). Urea PAGE gels are toxic. When handling urea PAGE gels, wear personal protection equipment, including gloves, goggles, and lab coats. Note: As shown in Figure 5, The abundance of cDNA is typically low. Add a lane of 10 bp DNA Ladder (Invitrogen, Cat#10821-015) to locate cDNA products within the gel. To generate the ladder solution, dilute 1 μL of 10 bp DNA ladder to 6 μL of RNA loading dye (2×), and heat denature at 70°C for 3 min. Place the ladder solution on ice for > 2 min.Note: cDNAs incorporate sequences from the barcoded RT primers, seemingly longer than the ligated RNAs on the denaturing PAGE gel. The cDNA generated from the probe-treated samples is less abundant and visually unrecognizable on denaturing PAGE gel due to RNA targets making up only a small portion of the extracted cellular RNAs. RT primers migrate faster than the cDNA at ∼70 nt. The cDNAs generated from the bystander controls (DMSO- or drug-treated samples) are more abundant, since in principle all RNA fragments are conjugated to biotin-containing adapters (Figure 5).
-
vi.Excise and collect the gel above 80 nt.
-
vii.Transfer the gel slices to a 0.5-mL PCR tube with a 20-gauge needle-hole using a single-sided carbon steel razor blade.
-
viii.Place this 0.5-mL PCR tube onto a 2-mL conical vial.
-
ix.Centrifuge at 16,000 × g for 5 min at 20°C.
-
x.Add 250 μL of nuclease-free water.
-
xi.Transfer the crushed gel with a cut-tip p1000 pipette tip into a 1.5-mL conical vial.Note: Use a pair of sterilized scissors to cut the tip of the p1000 pipette tip. The scissors must be cleaned with RNase AWAY Surface Decontaminant.
-
xii.Heat at 67°C for 15 min on an orbital shaker (∼700 rpm).
-
xiii.Transfer the gel slurry to a Spin-X column with a cut-tip p1000 pipette tip.
-
xiv.Centrifuge at 7,000 × g for 1 min at 20°C.
-
xv.Collect and transfer the eluent to a new 1.5-mL conical vial.
-
xvi.Add 250 μL of water to the drained gel slurry and transfer to a 1.5 mL conical vial with a cut-tip p1000 pipette tip.
-
xvii.Heat at 67°C for 15 min on an orbital shaker (∼700 rpm).
-
xviii.Transfer the gel slurry to a Spin-X column with a cut-tip p1000 pipette tip.
-
xix.Centrifuge at 7,000 × g for 1 min at 20°C.
-
xx.Collect and combine with the eluent from step 18d(xv).
-
xxi.Transfer 500 μL eluent to a 0.5-mL 10K Amicon filter.
-
xxii.Centrifuge at 13,500 × g for 5 min at 20°C.
-
xxiii.Place the Amicon filter upside down in a clean microcentrifuge tube.
-
xxiv.Centrifuge at 1,000 × g for 2 min at 20°C and collect the eluent (∼100 μL).
-
xxv.Purify eluted samples with Zymo DNA cleanup & concentrator column-5 kit (Zymo, Cat#D4014) as follows.
-
xxvi.Add 700 μL (7× volume) of DNA Binding Buffer and 700 μL of 96%–100% ethanol. Vortex to mix.
-
xxvii.Transfer the sample to the Zymo-Spin Column (binding capacity: 5 μg of DNA).
-
xxviii.Centrifuge at 10,000 × g for 30 s at 20°C. Discard the flow-through.
-
xxix.Add 200 μL of DNA washing buffer.
-
xxx.Centrifuge at 10,000 × g for 30 s at 20°C. Discard the flow-through.
-
xxxi.Repeat the washing step once.
-
xxxii.Elute cDNA with 8.5 μL of water twice to yield ∼16 μL of the final cDNA sample.Pause point: cDNA samples can be stored at −80°C for up to one month.
-
i.
-
a.
-
19.cDNA circularization, library amplification, and next-generation sequencing.
-
a.cDNA circularization:
-
i.Mix 16 μL of cDNA sample from step 18 with 2 μL of 10×CircLigase II Buffer, 1 μL of 50 mM MnCl2, and 1 μL of CircLigase II.
-
ii.Flick to mix reaction thoroughly.
-
iii.Incubate at 60°C for 3 h in a thermocycler.
-
iv.Purify the circularized cDNA samples with Zymo DNA cleanup & concentrator column-5 kit (Zymo, Cat# D4014) as follows.
-
v.Add 140 μL (7×) of DNA Binding Buffer and 140 μL of 96%–100% ethanol. Vortex to mix.
-
vi.Transfer the sample to the Zymo-Spin Column (binding capacity: 5 μg of DNA).
-
vii.Centrifuge at 10,000 × g for 30 s at 20°C and discard the flow-through.
-
viii.Add 200 μL of DNA washing buffer.
-
ix.Centrifuge at 10,000 × g for 30 s at 20°C and discard the flow-through.
-
x.Repeat this washing step once.
-
xi.Elute circularized cDNA with 10 μL of water twice (final ∼19 μL sample).
-
i.
-
b.Library amplification with qPCR. Troubleshooting 3.
-
i.Assemble qPCR reaction as follows:qPCR reaction mixture
Reagent Amount DNA template 19 μL from step 19a(xi) 20 μM PE1 primer 0.5 μL (final 0.5 μM) 20 μM PE2 primer 0.5 μL (final 0.5 μM) 2× Phusion HF PCR mastermix 20 μL (final 1×) 25× SYBR Green I 0.4 μL (final 0.25×) CRITICAL: The qPCR reaction mixture should be assembled on ice freshly before qPCR amplification.Note: The PE1 and PE2 primers are not barcoded, as the sample-specific barcodes were introduced during cDNA synthesis. Each barcoded RT primer in step 18a contains two universal sequences that anneal to the PE1 and PE2 primers. Thus, PE1 and PE2 primers are universal PCR primers to amplify the circularized cDNAs. In addition, PE1 and PE2 primers already contain Illumina P5 and P7 adapters and should anneal to their complementary oligos on the flowcell surface in the Illumina sequencing platforms.Note: Each barcoded RT primer in step 18a contains a unique 4-nt index. Users should assign one uniquely barcoded RT primer to each sample (see the key resources table for 14 validated sequences of barcoded RT primers). The experiment can be further multiplexed by using a uniquely barcoded RT primer for each additional sample (see Note in step 18a for guidance on designing RT primers). Importantly, the choice of barcoded RT primers should not influence the qPCR amplification. The design of the final sequencing library is as follows: 5′- AATGATACGGCGACCACCGAGATCT (P5 adapter) - ACACTCTTTCCCTACACGACGCTCTTCCGATCT (PE1 annealing sequence) - NNNNGGTTNNDDD - insert sequence - AGATCGGAAGAGCGGTTCAGCAGGAATGCCGAGACCG (PE2 annealing sequence)-ATCTCGTATGCCGTCTTCTGCTTG (P7 adapter)-3′ -
ii.Perform qPCR using the following PCR cycling conditions:PCR cycling conditions
Steps Temperature Time Cycles Initial Denaturation 98°C 45 s 1 Denaturation 98°C 15 s Varied Annealing 65°C 20 s Extension 72°C 60 s Hold 4°C hold CRITICAL: Avoid overamplification of the sequencing library. We recommend conducting a qPCR experiment with 1 μL of circularized cDNA product from step 19a for each experiment. Dilute 1 μL of circularized cDNA product with 18 μL of nuclease-free water and proceed to step 19b for qPCR amplification. Each sample’s optimal number of qPCR amplification cycles is defined as the number of qPCR cycles that provide 50% of the maximum fluorescence signals. In our experience, PCR amplification with final fluorescence intensity above 20,000 a.u. is sufficient on an Applied Biosystems StepOnePlus Real-Time PCR System. Probe-treated samples usually require ∼16–22 cycles for sufficient amplification on the Applied Biosystems StepOnePlus, while DMSO-treated samples usually require ∼8–12 cycles. Troubleshooting 4. -
iii.Purify the PCR product with Zymo DNA cleanup & concentrator column-5 kit (Zymo, Cat#D4014) as follows.
-
iv.Add 202 μL (5× volume) of DNA Binding Buffer and vortex to mix.
-
v.Transfer the sample to the Zymo-Spin Column (binding capacity: 5 μg of DNA).
-
vi.Centrifuge at 10,000 × g for 30 s at 20°C and discard the flow-through.
-
vii.Add 200 μL of DNA washing buffer.
-
viii.Centrifuge at 10,000 × g for 30 s at 20°C and discard the flow-through.
-
ix.Repeat the washing step once.
-
x.Elute the PCR product with 20 μL of water twice and freeze-dry.
-
i.
-
c.Size selection of qPCR products. Troubleshooting 5.
-
i.Prepare a 3% (w/v) low-melting point agarose gel (Topvision agarose) in 1× TBE buffer containing 1× SYBR Gold stain.Note: Do not vigorously swirl the dissolved agarose gel to avoid introducing bubbles into the gel. Bubbles can be trapped and skew the shape of DNA bands during electrophoresis.
-
ii.Dissolve the DNA pellet with 7 μL of 6× Blue/Orange Loading Dye (Promega, Cat#PR-G1881).
-
iii.Perform the electrophoresis at 110 v until the primer dimer (if observed; characteristically runs at 130–150 nt) is fully separated from the main PCR product (>150 nt).Note: Specifically, image the gel on a blue-light transilluminator every 25–30 min to check if the separation has occurred. Continue running the gel if the primer dimer band has not separated from the PCR product band. If full separation has taken place, proceed to the next step.Note: Samples with low amplification cycles may not contain detectable primer dimer bands after running the gel for 2 h. In this case, stop the electrophoresis and proceed to the next step.
-
iv.Transfer the agarose gel to a blue-light gel imager.
-
v.Excise and collect the gel bands between 150 nt to 300 nt to remove the unreacted primers and primer dimers (Figure 6A).
-
vi.Extract PCR products with a QIAGEN MinElute Gel Extraction kit (QIAGEN, Cat#28604) following the manufacturer’s protocol from QIAGEN website.
-
vii.Elute with 10 μL of nuclease-free water twice.
-
i.
-
d.Quality control and pooling strategy of the final sequencing library
-
i.Characterize 1 μL of sample by BioAnalyzer with a High Sensitivity DNA Analysis kit (Agilent, Cat#5067-4626). Troubleshooting 5.CRITICAL: High-quality libraries exhibit a bell-like capillary electrophoresis trace, with a peak at ∼200 nt and the absence of primer dimer at 130–150 nt (Figure 6B).
-
ii.Determine the DNA concentration of each sample with a Qubit dsDNA HS Assay kit (Thermo Fisher Scientific, Cat#Q32851) following the manufacturer’s protocol from the Thermo Scientific website.
-
iii.Prepare 50 μL of a pooled library (≥ 0.5 ng/μL) by mixing an equal mass quantity (determined by Qubit assay in the previous step) of each sample.Pause point: The sequencing library can be stored at −20°C until sequencing.
-
iv.Perform next-generation sequencing of the pooled DNA library using the Illumina HiSeq X-ten or an equivalent platform: 2 × 150 bp read (read 1/read 2 sequencing reads) without demultiplexing.CRITICAL: We strongly recommend spiking 20%–25% of PhiX into the final sequencing library to increase the library complexity.Note: The minimum sequencing depth for a sample mainly depends on the complexity of the sequencing library. In our experience, we recommend a sequencing depth of at least 20 million reads for probe-treated samples and at least 80 million reads for bystander controls.
-
i.
-
a.
Figure 2.

Workflow of sequencing library preparation
Schematic illustration of biotin click reaction, RNA fragmentation, RNA end repair, RNA 3′-end ligation, cDNA synthesis and enrichment, cDNA circularization, and library amplification.
Figure 3.

Denaturing urea PAGE analysis of fragmented RNA
Poly(A)+ RNAs are incubated with RNA fragmentation reagents for varied duration in step 16. The time (in seconds) denotes the duration of RNA fragmentation at 95°C.
Figure 4.

Denaturing urea PAGE analysis of ligated RNA
The ligated RNA products are generated in step 18. The regions of gel to excise and collect are highlighted with the red dashed box. Unligated 3′-ddC and 3′-ddBiotin adapters are labeled. For probe-treated samples: 1—treatment with only probe 2; 2—treatment with probe 2 + drug 1. For bystander controls: 1—treatment with only DMSO; 2—treatment with only drug 1.
Figure 5.

Denaturing urea PAGE analysis of cDNA products
The cDNA products are generated in step 18. The regions of gel to excise and collect are highlighted with the red dashed box. The unreacted adapters are labeled. For probe-treated samples: 1—treatment with only probe 2; 2—treatment with probe 2 + drug 1. For bystander controls: 1—treatment with only DMSO; 2—treatment with only drug 1.
Figure 6.

Agarose gel and capillary electrophoresis analyses of qPCR amplification products
(A) 3% Agarose gel analysis of qPCR amplification products in step 19. The regions of gel to excise and collect are highlighted with the red dashed box. For probe-treated samples: 1—treatment with only probe 2; 2—treatment with probe 2 + drug 1. For bystander controls: 1—treatment with only DMSO; 2—treatment with only drug 1.
(B) DNA quality analysis of qPCR amplification products with capillary electrophoresis (CE) on a 2100 BioAnalyzer with HS DNA kits. The CE trace should characteristically resemble a natural distribution curve, with a peak at ∼200 nt and the absence of primer dimer around 130 nt.
Sequencing data processing
The alignment and quantification methods used herein are based on the icSHAPE pipeline5 and RBRP pipeline1 with custom modifications.
-
20.
Obtain paired-end FASTQ files from the sequencer.
Note: Each sample should have one Read 1 and one Read 2 FASTQ files. Depending on the sequencer or data delivery platform used, it may be necessary to change the file format to ‘.fastq’. Only Read 1 file will be used in the downstream analysis.
-
21.
Demultiplex the sequencing data based on the barcoded index of each sub-library.
>splitFastq.pl -U Read1.fastq -l GGTT:LIB_1::TTGT:LIB_2::ACCT:LIB_3::CAAT:LIB_4::TGGC:LIB_5::GGTC:LIB_6::AATC:LIB_7::TCAA:LIB_8::CCAG:LIB_9::AGGA:LIB_10::others:unknown -b 5:4 -d /out_directory/ -s Summary_barcode.stat
Note: Use a unique RT primer with a unique barcoded index for each sample. ‘Read1.fastq’ is the raw Read 1 FASTQ file. The 4-digit nucleotides are the barcoded indices determined by the sequences of barcoded RT primers. ‘LIB_x’ (e.g., ‘LIB_1’, ‘LIB_2’) is the name to be given to the demultiplexed FASTQ file for each sample. ‘Summary_barcode.stat’ lists the number of reads with each barcode.
-
22.
Run FastQC on the demultiplexed FASTQ files to evaluate their quality.
>fastqc -o /out_directory/ LIB.fastq
Note: “out_directory” is the pathway to output the results of FastQC.
-
23.
Remove PCR duplicates. Troubleshooting 8.
>readCollapse.pl -U LIB.fastq -o LIB.rmdup.fastq -f LIB.fa
Note: PCR duplicates are defined as reads coming from the same DNA amplicon via qPCR. ‘LIB.fastq’ is the output of step 21.
-
24.
Trim the adapter sequence and barcoded index sequence from all reads.
>trimming.pl -U LIB.rmdup.fastq -o LIB.trimmed.fastq -l 13 -t 0 -c phred33 -a adapter.fa -m 25
Note: If the trailing nucleotides have poor sequencing quality (with an average Phred score < 30 or an average mismatch rate > 0.01) based on the FastQC results of step 22, trim these nucleotides using the -t option. Use -t to specify the number of trailing nucleotides to trim from the reads. ‘LIB.trimmed.fastq’ is the name to be given to the trimmed FASTQ file. ‘LIB.rmdup.fastq’ is the output of the previous step. ‘adapter.fa’ is a FASTQ file containing the sequences of the adapters. “-m 25” defined the minimal length of reads to retain for accurate alignment to the human transcriptome
-
25.
Align amplicons to the human transcriptome using bowtie2. Troubleshooting 6.
>bowtie2 -U LIB.trimmed.fastq -S LIB.sam -x /index/transcriptome --non-deterministic --time
Note: ‘LIB.sam’ is the name to be given to the alignment SAM file. /index/ is the path to the bowtie2 transcriptome index generated in the “prepare the software and computing environment” section of “before you begin.” Bowtie2 transcriptome index should contain six files, including ‘transcriptome.1.bt2’, ‘transcriptome.2.bt2’, ‘transcriptome.3.bt2’, ‘transcriptome.3.bt2’, ‘transcriptome.4.bt2’, ‘transcriptome.rev.1.bt2’, and ‘transcriptome.rev.2.bt2’.
-
26.
Calculate transcript abundance (RPKM).
>estimateRPKM.pl -i LIB_x.sam -o LIB_x.rpkm
-
27.
Count the number of reverse transcriptase stops (RTstops) in each identified transcript.
>calcRT.pl -i LIB.sam -o LIB.rt -r LIB.rpkm -c 1
Note: Only count RTstop frequency for transcripts with an RPKM value ≥ 1 (-c 1). ‘LIB.rt’ is the output RTstop file. ‘LIB.sam’ and ‘LIB.rpkm’ are the SAM alignment file and transcript abundance file.
-
28.Merge background RTstop files of two biological replicates.
-
a.Merge background RTstop files of DMSO-treated samples separately.>combineRTreplicates.pl -i Background_DMSO-1.rt:Background_DMSO-2.rt -o Background_DMSO.rtNote: DMSO-treated samples provide background RTstop files to correct for random RNA breaks and non-specific RNA binding for samples that are treated with Probe 2 only.
-
b.Merge background RTstop files of drug-treated samples separately.>combineRTreplicates.pl -i Background_Drug-1.rt:Background_Drug-2.rt -o Background_Drug.rtNote: Drug-treated samples provide background RTstop files to correct for random RNA breaks and non-specific RNA binding for samples that are treated with Probe 2 and parent drug 1.Note: ‘Background_x-1.rt’ and ‘Background_x-2.rt’ are RTstop files of two biological replicates from step 27. ‘Background_x.rt’ is the name to be given to the merged background RTstop files.
-
a.
-
29.
Normalize the format of each RTstop file for all samples and combined RTstop files from step 28.
>normalizeRTfileScaleFactor1.pl -i LIB.rt -o LIB.normalized.rt -d 32 -l 32
Note: ‘LIB.rt’ is the input RTstop file. ‘LIB.normalized.rt’ is the output file with normalized format. The first 32 nt (“-d 32”) and the tailing 32 nt (“-l 32”) will be excluded for normalization.
-
30.Calculate the RBRP score at each nucleotide for all identified transcripts.
-
a.Calculate RBRP score of samples with only probe 2:>calcRBRPminusCtrl.pl -f LIB.normalized.rt -b Background_DMSO.normalized.rt -o LIB.tmp.out -e dividing -y 0.5
-
b.Calculate RBRP score of samples with probe 2 and competing compound 1:>calcRBRPminusCtrl.pl -f LIB.normalized.rt -b background_Drug.normalized.rt -o LIB.tmp.out -e dividing -y 0.5Note: ‘LIB.normalized.rt’ is the format normalized file of the probe-treated sample. ‘Background_x.normalized.rt’ is the format normalized file of the background samples. ‘LIB.tmp.out’ is the output RBRP score file. This step quantifies the level of acylation as the acylation ratio = RTstops/base_density of each nucleotide in the identified transcripts. Setting “-e dividing -y 0.5” computes RBRP score of each nucleotide as [acylation ratio (probe-treated sample)] - [acylation ratio (background sample)]/2.Note: RTstop sites are identified as the first base of the trimmed Read 1. These sites are due to RTstops caused by drug-promoted acylation, random RNA breaks, random acylation, and non-specific RNA binding. As acylation prematurely stops the reverse transcriptase at the neighboring 3′-nucleotide, we shift the RTstop counts of each nucleotide one nucleotide toward its 5′-end. To quantify the acylation signal, we divide the RTstop count for each nucleotide by its sequencing depth (base density), resulting in a ratiometric value. This ratiometric value represents acylation signal (acylation signal = RTstop count/base density). Next, we adjust the acylation signal value of each nucleotide in the probe-treated samples subtracting the corresponding background acylation signal value:The RBRP score is then calculated for each identified transcript in probe-treated samples to account for the effects of random RNA breaks, random acylation, and non-specific RNA binding. Since the probe-treated and background libraries undergo sequencing at different depths, the strength of removing background acylation signal is optimized at 0.5 for human HEK293 cells and acylimidazole-conjugated acylating probes. This factor was trained with probe 2 to maximize the correlation between RBRP score and the level of 2′-acylation determined by RT-qPCR for identified RNA targets. To enhance the confidence in target identification, the nucleotides are further filtered based on RTstop counts and base densities.
-
a.
-
31.
Filter out low-quality RBRP scores for regions that do not meet the stringency requirements.
> filterRTstopBD.pl -i LIB.tmp.out -o LIB.out -t 200 -s 5 -e 30
Note: The threshold of sequencing depth (“-t”) is the minimal sequencing depth of a nucleotide required to provide sufficient correlation of RTstop files between the two biological replicates. ‘LIB.tmp.out’ is the input RBRP score file from the previous step. ‘LIB.out’ is the output RBRP score file that contains only the high-quality RBRP scores from regions that pass the stringency filter. Setting “-t 200” requires the valid RBRP score must come from nucleotides with a sequencing depth (base density) ≥ 200. Setting “-s 5 -e 30” skip the first 5 nt and the tailing 32 nt for calculation.
The correlation of RTstop files is evaluated with the following command.
> correlationRT.pl -1 LIB-1.rt -2 LIB-2.rt -t X > Correlation.txt
‘LIB-1.rt’ and ‘LIB-2.rt’ are input RTstop files of two biological replicates. ‘Correlation.txt’ outputs the correlation coefficient of each nucleotide across the entire identified transcripts. ‘X’ is the numeric threshold of sequencing depth for the correlation analysis. ‘Correlation.txt’ can be visualized by ggplot in the R program. An optimal “-t” threshold value should be the smallest numeric value that provides relatively high concordance in RTstop files between two biological replicates. Troubleshooting 7.
Optional: To enhance the stringency of this step, users can filter out nucleotides with RTstop counts below a certain threshold by “-R” option. For example, “-R 15” requires the valid RBRP score must come from nucleotides with RTstop counts ≥ 15.
-
32.
Generate bedgraph files for downstream data visualization.
> enrich2Bedgraph.pl -i LIB.out -o LIB.bedgraph -g Genome.gtf -a transcriptome.fa
Note: ‘LIB.out’ is the input RBRP score file. ‘LIB.bedgraph’ is the output bedgraph file. ‘Genome.gtf’ is the human GRCh38 genome annotation file downloaded from Ensembl website in gtf format. ‘transcriptome.fa’ is the human transcript sequence file generated from “before you begin”.
-
33.
Generate bigwig file.
>sort -k1,1 -k2,3n LIB.bedgraph -o LIB.sorted.bedgraph
> uniqueTrack.pl LIB.sorted.bedgraph LIB.sorted.uniq.bedgraph
> cut -f1-4 LIB.sorted.uniq.bedgraph | grep -v NULL > LIB.sim.bedgraph
> bedGraphToBigWig LIB.sim.bedgraph genome.size LIB.sim.bw
Note: The ‘genome.size’ file is a tab-delimited text file consisting of two columns, with the first column listing the name of chromosomes and the second column presenting the length of each chromosome.
-
34.
Calculate the negative log-transformed p-value “-log10(p-value)” as the confidence score.
> write p-value.wig ttest LIB(probe-only)-1.sim.bw LIB(probe-only)-2.sim.bw : LIB(probe + compound 1)-1.sim.bw LIB(probe + compound 1)-2.sim.bw
> write logP-value.wig log 10 p-value.wig
> write neglog10P-value.wig scale -1 logP-value.wig
> wigToBigWig neglog10P-value.wig genome.size neglog10P-value.sim.bw
Note: A p-value is calculated for every nucleotide in the identified transcript by Welch t-test using WiggleTool 1.2. ‘LIB(probe-only)-1.sim.bw’ and ‘LIB(probe-only)-2.sim.bw’ are input bigwig files of probe-treated samples from two biological replicates. ‘LIB(probe + compound 1)-1.sim.bw’ and ‘LIB(probe + compound 1)-2.sim.bw’ are input bigwig files of samples treated with probe 2 and competing compound 1 from two biological replicates.
-
35.
Generate bigwig files to represent differential RBRP score. To determine the regions of each transcript targeted by probe 2, we compute a parameter called “differential RBRP score,” which represents the difference in RBRP scores between probe-only and competition samples. The differential-RBRP parameter is a numeric value ranging from -1 to 1, with RNA-binding sequences having a value close to 1.
> wiggletools write mean.LIB(probe-only).wig mean LIB(probe-only)-1.sim.bw LIB(probe-only)-2.sim.bw
> wiggletools write mean.LIB(probe + compound 1).wig mean LIB(probe + compound 1)-1.sim.bw LIB(probe + compound 1)-2.sim.bw
> wigToBigWig mean.LIB(probe-only).wig genome.size mean_LIB(probe-only).sim.bw
> wigToBigWig mean.LIB(probe + compound 1).wig genome.size mean_LIB(probe + compound 1).sim.bw
> wiggletools write diff_RBRP.wig diff mean.LIB(probe-only).sim.bw mean.LIB(probe + compound 1).sim.bw
> wigToBigWig diff_RBRP.wig genome.size diff_RBRP.sim.bw
Identify RNA binding sites of small molecules
-
36.
In IGV (version 2.15.4), select ‘Human (GRCh38/hg38)’ as the host genome.
-
37.Load the ‘diff_RBRP.sim.bw’ and ‘neglog10P-value.sim.bw’ into IGV as track files.
-
a.For ‘diff_RBRP’ IGV track, select “Bar Chart” as the Type of Graph, “Mean” as the Windowing Function, and “Autoscale.”
-
b.For ‘neglog10P-value’ IGV track, select “Heatmap” as the Type of Graph, “Max” as the Windowing Function, and “Autoscale.”
-
a.
-
38.
Zoom into the transcriptome loci with high confidence scores (-log10P-value) to the single-nucleotide level.
-
39.
Putative drug-binding RNA loci are defined as nucleotides with RBRP scores ≥ 0.12 and P-values ≤ 0.05 (Figure 6).
Expected outcomes
The current protocol is expected to enrich and quantify RNA targets from over ∼16,000 transcripts in a single sequencing experiment. Employing the Illumina HiSeq X-ten platform, it is anticipated that the sequencing run will produce on average 80 million reads per experimental condition in an 8-plex pooled library. In our experience, we recommend a sequencing depth of at least 20 million reads for probe-treated samples and at least 80 million reads for bystander controls. This level of coverage of the human transcriptome enables global characterization of RNA-small molecule interactions across the human transcriptome. It is possible to identify RNA targets with a lower average number of sequencing reads per experimental condition. However, it would be necessary to increase the stringency of data filtering in step 31 (specifically, use “-t” prompt to require the valid RBRP score to come from nucleotides with a higher cut-off sequencing depth). 20 × 106 cultured cells should yield sufficient poly(A)+ RNAs for library preparation. To ensure adequate transcriptome coverage, we recommend a minimum input of 500 ng poly(A)+ RNAs for library preparation. It is important to note that the protocol in its current form is unable to detect RNA targets with relatively low abundance in the sequencing library (e.g., rpkm < 1). To identify low-abundance RNA targets, a higher mass quantity of poly(A)+ RNA is required.
In a single next-generation sequencing run on the Illumina HiSeq X-ten platform (paired-end read 150 bp), a 14-plex pooled library is expected to profile up to 2 different drugs with the respective controls. However, we suggest generating an 8-plex pooled library for each drug individually, along with the controls for practical purposes. This approach allows for greater sequencing depths allocation to each condition, facilitating the bioinformatics data analysis. The bioinformatics analysis will be performed at the regions with sufficient sequencing depth to ensure strong concordance of RTstop files among replicates.
The output results consist of two bigwig track files: a bigwig file of differential RBRP score and another bigwig file of Log-transformed p-value for Welch t-tests (Figure 7). These bigwig files are visualized with Integrative Genomics Viewer (IGV). In IGV, each nucleotide passing the stringency criteria will have a differential RBRP score ranging from −1 to 1. This value quantifies the effectiveness of the parent drug in competing with the acylating probe for target acylation. Specifically for compound 1, nucleotides meeting the criteria of high sequencing depth (≥ 200), high differential RBRP scores (≥ 0.12), and high confidence (p-value ≤ 0.05) are identified as potential drug-binding sites.
Figure 7.

RBRP sequencing data analysis
(A) RBRP scores across the entire human transcriptome are shown in the GRCh38/hg38 build of the human genome.
(B) RBRP results of YBX1 (Y-box binding protein 1) mRNA. A 68-bp region centered on the YBX1 locus is shown in the GRCh38/hg38 build of the human genome. For A-B, the differential RBRP (teal) ‘diff_RBRP_Lev.sim.bw’ is represented as an IGV track ranging from -1 to 1. The confidence score (-log10P-value of Welch’s t-test) ‘neglog10P-value_Lev.sim.bw’ is represented as a heatmap track.
RBRP is anticipated to facilitate the identification of minimal RNA binding sequences for small molecules at single-nucleotide resolution. By integrating information from CLIP-seq and RNA structure analysis, RBRP results can provide insights into the mechanism of action of drugs that exhibit severe dose-limiting toxicity or other side effects. In essence, this protocol can also be extended to other small molecules to identify their interactions with the human transcriptome and determine the corresponding RNA binding loci. In addition, it is possible to apply this protocol to study small molecule binding with other types of RNAs (e.g., rRNA and small RNAs), but such applications would require further optimizations to this protocol.
Limitations
First, the design and synthesis of acylating probes are contingent on the chemical characteristics of the parent drug. Currently, the design of the acylating probe is incompatible with parent small molecules that possess acylimidazole-reacting strong nucleophiles, such as primary and secondary amines, thiols, and phenols, or small molecules that possess more than one carboxylic acid group. Second, acylating probes, such as acylimidazole-conjugates, exhibit a relatively short half-life in aqueous environments (less than a few hours) and likely undergo hydrolysis over the course of experiments. Consequently, any delays may lead to a reduction in the effective concentration of acylating probe and target labeling. Third, the protocol deploys bystander control (DMSO-treated or drug-treated) and competition by parent drug to enrich drug-promoted 2′-OH acylation events. However, this protocol does not entirely remove RBRP noise signals from random RNA breaks, random acylation, and non-specific RNA binding by streptavidin beads. Fourth, the RBRP protocol in its current form uses isolated poly(A)+ transcripts for analysis, thereby incapable of identifying RNA targets lacking a poly(A)-tail. Fifth, the accuracy of identifying RNA targets by RBRP depends on the sequencing depth of next-generation sequencing. More accurate quantification would necessitate higher sequencing depths, particularly for RNA targets with lower copy numbers.
Troubleshooting
Problem 1
The parent small molecule is not fully soluble in the DMEM medium and PBS (related to steps 1, 2, and 4).
Potential solution
The working concentration of the parent small molecule exceeds its solubility limit in aqueous solutions. Use a lower working concentration, while keeping the stoichiometry between acylating probe:parent drug = 1:6.
Problem 2
The acylating probe cannot freely permeabilize the cell membrane and shows no acylation of RNA targets within live cells (related to steps 3 and 6).
Potential solution
Execute RBRP protocol with cell lysate supplemented with RNase inhibitors.
Problem 3
qPCR amplification of probe-treated samples is poor, requiring > approximately 25 cycles (related to step 19b).
Potential solution
The initial amount of input poly(A)+ RNA was insufficient. We suggest preparing the identical sample in multiple (≥2) technical replicates and pooling the cDNA product for qPCR amplification. By doubling the input poly(A)+ RNA, it is possible to reduce the required qPCR cycles by approximately 1.
Problem 4
The yield of qPCR amplification is low (step 19b).
Potential solution
For optimal qPCR amplification, we recommend increasing the number of qPCR amplification cycles within an appropriate range. Excessive amplification cycles can lead to overamplification of the library, decreasing the number of unique reads. Additionally, it is crucial to accurately measure the concentrations of input poly(A)+ RNAs. This ensures an adequate supply of probe-labeled RNA for the library preparation.
Problem 5
The insert size of the sequencing library is too short (related to step 19c).
Potential solution
Excessive RNA fragmentation in step 16 causes short insert size. The duration for RNA fragmentation in step 15 should be reduced to yield longer RNA fragments, yielding longer amplicons on average.
Problem 6
Reads alignment rate of Bowtie2 is low (related to step 25).
Potential solution
Inspect the quality of reads by examining the FASTQC file. If the reads contain tailing nucleotides with poor quality, trim these low-quality nucleotides from the reads using trimming.pl command. Verify the accurate adapter sequences are used for trimming. Confirm the use of appropriate transcriptome index files when performing Bowtie2 alignment.
Problem 7
The correlation of RTstop counts for most transcripts among replicates are low (related to step 31).
Potential solution
Apply more stringent filter in step 31. For example, use “-t” option to restrict analysis to regions with higher sequencing depths. Use “-R” option to limit the analysis within regions that pass a certain threshold of RTstop counts. If the correlation remains poor with higher stringency filters, re-do the experiment to ensure consistency among replicates. Consider adding at least one more biological replicate.
Problem 8
The number of unique sequencing reads is low (related to step 23).
Potential solution
Perform an additional next-generation sequencing. Sequencing reads from two sequencing runs can be concatenated for downstream bioinformatics analysis.
Resource availability
Lead contact
Further information and requests for resources and reagents should be directed to and will be fulfilled by the lead contact, Eric T. Kool (kool@stanford.edu).
Materials availability
All unique/stable reagents generated in this study are available from the lead contact upon reasonable request with a completed Materials Transfer Agreement.
Acknowledgments
We acknowledge the U.S. National Institutes of Health (GM130704 and GM145357) for support of this work. This work was also supported in part by NIH P30 CA124435 utilizing the Stanford Cancer Institute Proteomics/Mass Spectrometry Shared Resource and NIH High End Instrumentation grant (1 S10 OD028697-01).
Author contributions
E.T.K. conceived the project. L.F. performed the experiments and data analysis. L.F. and E.T.K. drafted the manuscript.
Declaration of interests
The authors declare no competing interests.
Data and code availability
-
•
The raw next-generation sequencing datasets are deposited to Gene Expression Omnibus (GEO) under accession GEO: GSE229331. Processed RBRP sequencing datasets are provided in Fang et al.1
-
•
Any code required to perform RBRP is available in the manuscript and on Github: https://github.com/linglanfang/RBRP and https://github.com/qczhang/icSHAPE. The example reference RBRP dataset from Fang et al.1 is available on figshare: https://figshare.com/articles/dataset/RBRP_reactivity/20326824. All additional information required to reanalyze the data reported in this paper is available from the lead contact upon request.
References
- 1.Fang L., Velema W.A., Lee Y., Xiao L., Mohsen M.G., Kietrys A.M., Kool E.T. Pervasive transcriptome interactions of protein-targeted drugs. Nat. Chem. 2023;15:1374–1383. doi: 10.1038/s41557-023-01309-8. [DOI] [PubMed] [Google Scholar]
- 2.Cai Z., Zafferani M., Akande O.M., Hargrove A.E. Quantitative Structure-Activity Relationship (QSAR) Study Predicts Small-Molecule Binding to RNA Structure. J. Med. Chem. 2022;65:7262–7277. doi: 10.1021/acs.jmedchem.2c00254. [DOI] [PMC free article] [PubMed] [Google Scholar]
- 3.Yazdani K., Jordan D., Yang M., Fullenkamp C.R., Calabrese D.R., Boer R., Hilimire T., Allen T.E.H., Khan R.T., Schneekloth J.S., Jr. Machine Learning Informs RNA-Binding Chemical Space. Angew. Chem. Int. Ed. Engl. 2023;62 doi: 10.1002/anie.202211358. [DOI] [PMC free article] [PubMed] [Google Scholar]
- 4.Spitale R.C., Flynn R.A., Zhang Q.C., Crisalli P., Lee B., Jung J.W., Kuchelmeister H.Y., Batista P.J., Torre E.A., Kool E.T., Chang H.Y. Structural imprints in vivo decode RNA regulatory mechanisms. Nature. 2015;519:486–490. doi: 10.1038/nature14263. [DOI] [PMC free article] [PubMed] [Google Scholar]
- 5.Flynn R.A., Zhang Q.C., Spitale R.C., Lee B., Mumbach M.R., Chang H.Y. Transcriptome-wide interrogation of RNA secondary structure in living cells with icSHAPE. Nat. Protoc. 2016;11:273–290. doi: 10.1038/nprot.2016.011. [DOI] [PMC free article] [PubMed] [Google Scholar]
Associated Data
This section collects any data citations, data availability statements, or supplementary materials included in this article.
Data Availability Statement
-
•
The raw next-generation sequencing datasets are deposited to Gene Expression Omnibus (GEO) under accession GEO: GSE229331. Processed RBRP sequencing datasets are provided in Fang et al.1
-
•
Any code required to perform RBRP is available in the manuscript and on Github: https://github.com/linglanfang/RBRP and https://github.com/qczhang/icSHAPE. The example reference RBRP dataset from Fang et al.1 is available on figshare: https://figshare.com/articles/dataset/RBRP_reactivity/20326824. All additional information required to reanalyze the data reported in this paper is available from the lead contact upon request.