Figure 3.
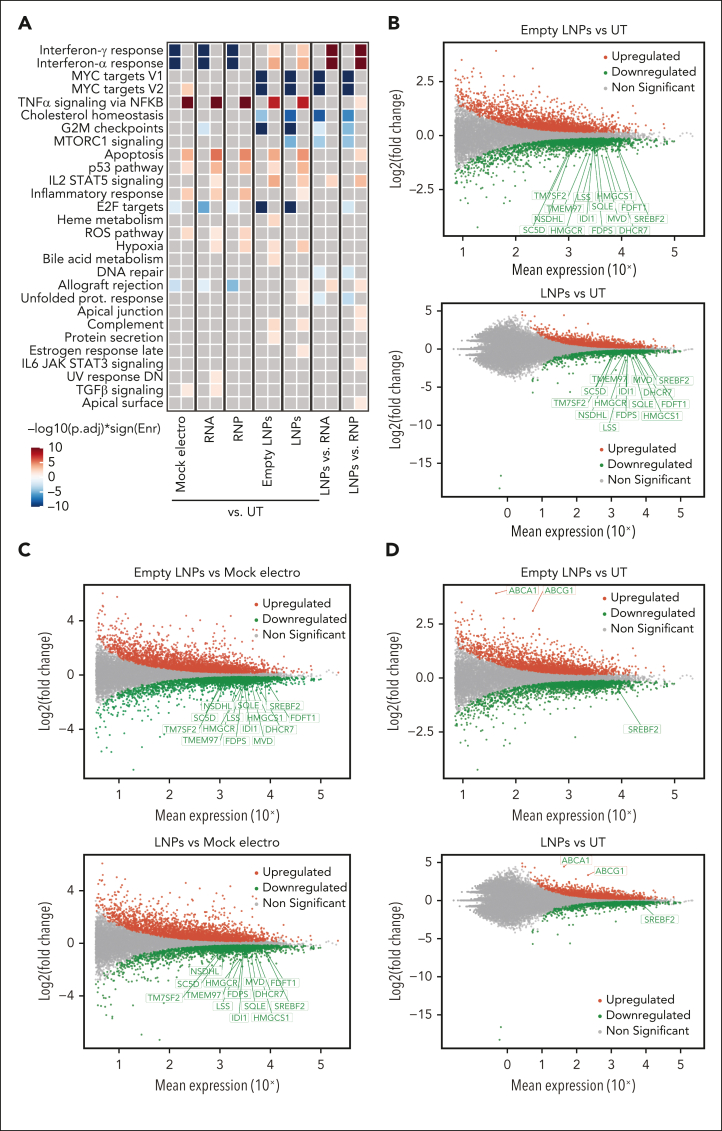
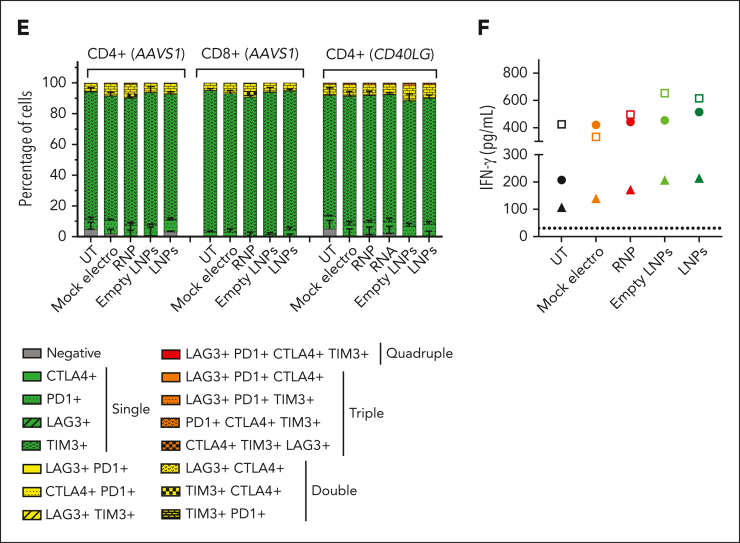
LNPs induce pervasive transcriptomic changes without affecting T-cell functionality. (A) Heatmap showing enrichment results from all comparisons between conditions between conditions from supplemental Figure 5A on the hallmark gene set (Molecular Signatures Database). Color intensity reflects statistical significance of the test (adjusted P values), whereas signs (positive or negative) correspond to the set of DEGs used in the statistical test (upregulated or downregulated, respectively). (B-D) MA plot showing significant DEGs in (B) empty LNPs vs UTs (top) or LNPs vs UTs (bottom); (C) empty LNPs vs mock electros (top) or LNPs vs mock electros (bottom); (D) empty LNPs vs UTs (top) or LNPs vs UTs (bottom) comparisons. Labels highlight DEGs from panels B-C belonging to the core enrichment of cholesterol homeostasis category, and (D) SREBF2, ABCA1, and ABCG1. (E) Percentage of T cells negative and single-, double-, triple-, and quadruple-positive for exhaustion markers 14 days after treatments (n = 3). Mean ± SEM. (F) IFN-γ secretion 3 days after anti-CD3 polyclonal stimulation, ie, 14 days after treatments (n = 3). Each symbol represents a different T-cell donor.


