

Abstract
GSK3640254 (GSK'254) is a novel HIV‐1 maturation inhibitor with pharmacokinetics supporting once‐daily (QD) therapy for HIV‐1 treatment. This thorough QT/corrected QT (QTc) study evaluated the effect of GSK'254 on cardiac repolarization. In this two‐part, randomized study, healthy participants received GSK'254 or placebo QD for 7 days (part 1) to determine safety and pharmacokinetics of a 500‐mg supratherapeutic dose. Four sequential treatment periods composed the main QTc study (part 2): GSK'254 100 mg, GSK'254 500 mg, placebo QD for 7 days, or placebo QD for 6 days with a 400‐mg moxifloxacin dose on Day 7 (all with a moderate‐fat meal). Concentration‐QTc analyses modeled the relationship between GSK'254 plasma concentrations and placebo‐adjusted change from baseline in QT interval corrected with Fridericia's formula (ΔΔQTcF). Of 50 participants enrolled, 48 completed the study (part 1, 8/8; part 2, 40/42). Least‐squares (LS) mean change from baseline in QTcF for GSK'254 100 mg followed the placebo pattern across time points (maximum LS mean ΔΔQTcF, 1.7 ms); the upper bound of the 90% CI remained <10 ms. Maximum LS mean ΔΔQTcF for GSK'254 500 mg exceeded the 10‐ms threshold: 10.6 ms (90% CI 7.75–13.38). Neither GSK'254 dose had clinically relevant effects on heart rate or cardiac conduction. By concentration‐QTc analysis, no effect on ΔΔQTcF >10 ms is expected up to GSK'254 concentrations of ~3070 ng mL−1. No clinically relevant effects on cardiac parameters were seen in healthy participants with GSK'254 at the 100‐mg dose.
Keywords: antiretrovirals, drug safety, phase I, QT prolongation
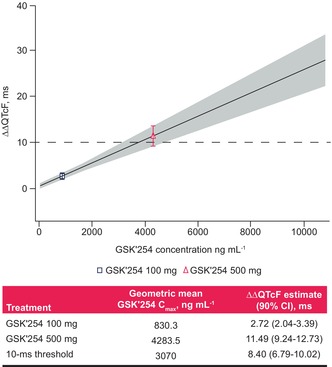
Model‐predicted ΔΔQTc interval at geometric mean GSK'254 concentrations associated with 100‐ and 500‐mg doses.
Abbreviations
- AE
adverse event
- AUC
area under the plasma concentration‐time curve
- AUC0–τ
AUC from zero to the end of the dosing interval at steady state
- bpm
beats per minute
- Cmax
maximum observed concentration
- Cτ
plasma concentration at the end of the dosing interval
- ECG
electrocardiogram
- GSK'254
GSK3640254
- HR
heart rate
- LS
least‐squares
- PK
pharmacokinetics
- QD
once‐daily
- QTc
corrected QT
- QTcF
QT interval corrected using Fridericia's formula
- SAE
serious adverse event
- t max
time to Cmax
- ΔHR
change from baseline in heart rate
- ΔPR
change from baseline in PR interval
- ΔQRS
change from baseline in QRS interval
- ΔQTc
change from baseline in corrected QT
- ΔQTcF
change from baseline in QT interval corrected using Fridericia's formula
- ΔΔHR
placebo‐corrected change from baseline in heart rate
- ΔΔQTcF
placebo‐adjusted change from baseline in QT interval corrected with Fridericia's formula
1. INTRODUCTION
GSK3640254 (GSK'254) is a novel HIV‐1 maturation inhibitor that targets viral maturation, one of the last steps in the HIV‐1 life cycle. 1 , 2 , 3 , 4 GSK'254 binds near a key structural element of the Gag protein that is required for virion maturation and assembly. By interfering with the protease‐mediated processing of Gag proteins, GSK'254 binding results in the release of immature particles and non‐infectious virions. 1 , 2 , 3
Previous phase I clinical studies of GSK'254 have demonstrated pharmacokinetics (PK) supportive of once‐daily (QD) therapy and a desirable drug–drug interaction profile, with no relevant interactions with common antiretroviral agents, including dolutegravir and tenofovir alafenamide/emtricitabine, or common drug‐metabolizing enzymes (such as cytochrome P450 enzymes and organic anion transporting polypeptide transporters). 3 , 5 , 6 , 7 Under short‐term administration, GSK'254 was generally well tolerated in healthy participants and people living with HIV‐1. 1 , 2 , 3 , 5 , 6 , 8 Moreover, QD administration of GSK'254 200 mg in treatment‐naive people living with HIV‐1 demonstrated a mean reduction from baseline in HIV‐1 RNA of 2 log10 copies/mL in a phase IIa, proof‐of‐concept study. 8
In a pre‐clinical study of telemetry in dogs, minimal QT interval effects were observed in one dog administered a single dose of GSK'254 17 mg kg−1 up to a maximum concentration of 7960 ng mL−1. Based on this rare cardiac abnormality observed with GSK'254 administration, we elected to evaluate the effect of GSK'254 on QT interval prolongation via a thorough QT/corrected QT (QTc) study according to International Council for Harmonization E14 guidance.
2. METHODS
2.1. Study design
This was an adaptative, two‐part, randomized trial to evaluate the effect of GSK'254 on cardiac repolarization in healthy participants. Part 1 was designed as a sentinel cohort study to determine the supratherapeutic dose of GSK'254 for part 2, which was the main QTc study.
In part 1, the study consisted of a screening period (≤28 days) and a 7‐day treatment period in which participants (n = 8) were randomized 3:1 to receive GSK'254 500 mg or placebo QD; participants were discharged on Day 9 (Figure 1). All doses were administered with a moderate‐fat meal (~600 calories, 30% from fat) 30 min before dosing. A second cohort to evaluate twice‐daily dosing of GSK'254 was planned if GSK'254 PK, safety, or tolerability results from the first cohort showed that an alternative supratherapeutic dose was needed; based on PK results from the first cohort, GSK'254 500 mg QD for 7 days was determined as the supratherapeutic dose and this second cohort was not needed.
FIGURE 1.

Study design. Treatment T: potential therapeutic dose of GSK'254 100 mg QD. Treatment ST: supratherapeutic dose of GSK'254 500 mg QD. Treatment P: placebo QD. Treatment M: placebo QD on Days 1–6 and a single dose of moxifloxacin 400 mg on Day 7. GSK'254, GSK3640254; QD, once daily; QTc, corrected QT. aWashout was ≥7 days minus 4 h to allow for scheduling flexibility in the clinic.
In part 2, the study consisted of a screening period (≤29 days), a check‐in visit (Day −2), a baseline visit (Day −1), and four sequential 7‐day treatment periods, each followed by a 7‐day washout, except for the fourth treatment period (Figure 1). Participants were confined to the clinic from Day −2 of the first treatment period until discharge on Day 9 of the fourth treatment period. Participants (n = 42) were randomized 1:1:1:1 to 12 treatment sequences, each composed of four sequential 7‐day treatment periods of GSK'254 100 mg QD (potential therapeutic dose), GSK'254 500 mg QD (supratherapeutic dose), placebo QD, or placebo QD through Day 6 and a single dose of moxifloxacin 400 mg on Day 7, which was included as a positive control. All doses were administered with a moderate‐fat meal 30 min before dosing.
This was a partially double‐blind study (moxifloxacin was open‐label in part 2). Each participant was dispensed blinded study intervention (open‐label for moxifloxacin) labeled with their unique randomization number throughout the study. Investigators remained blinded to each participant's assigned study intervention (GSK'254 or placebo) throughout the course of the study. To maintain this blind, an unblinded pharmacist was responsible for reconstitution and preparation of GSK'254 or placebo and endeavored to ensure there were no differences in time taken to dispense study intervention after randomization.
This study was conducted in accordance with International Council for Harmonization of Technical Requirements for Registration of Pharmaceuticals for Human Use Good Clinical Practice and followed the Declaration of Helsinki principles. The protocol was reviewed and approved by IntegReview IRB (Columbia, MD). All participants provided written informed consent and could withdraw from the study at any time.
2.2. Eligibility criteria
Eligible participants were aged 18–50 years, had a body weight of ≥50 kg for men and ≥45 kg for women, had a body mass index of 18.5–31 kg m−2, and were determined to be healthy by the investigator or medically qualified designee based on a medical evaluation, including medical history, physical examination, laboratory tests, and cardiac monitoring. Key exclusion criteria included medical conditions (e.g., history of cardiac arrythmias or cardiac disease, current or chronic history of liver disease, pre‐existing condition interfering with normal gastrointestinal anatomy or motility, clinically significant illness, psychiatric disorder); positive laboratory tests for hepatitis B, hepatitis C, or HIV‐1 and ‐2 viruses; any acute or grade 2 to 4 laboratory abnormality; and prior exposure to GSK'254 or intolerance to moxifloxacin. Participants with any uninterpretable electrocardiogram (ECG) or any significant arrhythmia or ECG findings that, in the opinion of the investigator, would interfere with the safety of the participant were excluded.
2.3. Endpoints
Primary endpoints for part 1 were area under the plasma concentration‐time curve (AUC) from time zero to the last quantifiable time point, AUC from zero to the end of the dosing interval at steady state (AUC0–τ ), maximum observed concentration (Cmax), plasma concentration at the end of the dosing interval (C τ ), and time to Cmax (t max) of GSK'254 in plasma; adverse events (AEs) and serious AEs (SAEs); and change from baseline in clinical laboratory assessments, ECGs, and vital sign measurements.
The primary endpoint for part 2 was placebo‐adjusted change from baseline in QT interval corrected using Fridericia's formula (ΔΔQTcF) for GSK'254 using concentration‐QTc analysis. Secondary endpoints for part 2 included change from baseline in heart rate (HR) and QT interval corrected using Fridericia's formula (QTcF; ΔHR and ΔQTcF, respectively), as well as change from baseline in PR and QRS intervals using by‐time point analysis; placebo‐adjusted change from baseline in HR and QTcF (ΔΔHR and ΔΔQTcF, respectively), as well as placebo‐corrected change from baseline in PR and QRS using by‐time point analysis; ΔΔQTcF for moxifloxacin; AUC from time zero to the last quantifiable time point, AUC0–τ , Cmax, C τ , and t max for GSK'254 in plasma; Cmax and t max of moxifloxacin in plasma; AEs and SAEs; and change from baseline in clinical laboratory assessments, ECGs, and vital sign measurements.
2.4. Assessments
2.4.1. Continuous Holter ECGs
In part 2, 12‐lead ECGs were extracted from continuous Holter ECG recordings at baseline (Day −1) and on Days 1 and 7 of each treatment period. Holter ECG readings were extracted −45, −30, and −15 min before dosing on Day 1 and pre‐dose and 0.5, 1, 2, 3, 3.5, 4, 4.5, 5, 6, 8, 10, 12, and 24 h after dosing on Day 7. Heart rate, PR interval, QTcF, and QRS interval were measured and calculated.
2.4.2. Pharmacokinetics
Blood samples were collected within 40 min before the morning dose on Days 1, 5, 6, and 7 for GSK'254 analysis in parts 1 and 2, post‐dose on Day 7 at 0.5, 1, 2, 3, 3.5, 4, 4.5, 5, 6, 12, 24, and 48 h for GSK'254 analysis in part 1, within 40 min before dosing on Day 7 for moxifloxacin analysis in part 2, and post‐dose on Day 7 at 0.5, 1, 2, 3, 3.5, 4, 4.5, 5, 6, 8, 10, 12, and 24 h for GSK'254 and moxifloxacin analyses in part 2. When time points for ECG extractions and PK sampling coincided, ECG extraction occurred before PK blood collection. As previously described, 3 plasma GSK'254 concentrations were determined using a validated ultra‐high‐performance liquid chromatography method with tandem mass spectrometry, with an assay range of 3.00–1000 ng mL−1.
2.4.3. Safety assessments
Adverse events, safety 12‐lead ECG results, clinical laboratory results, physical examination findings, and vital sign measurements were monitored throughout the study to assess safety and tolerability. Duration, severity, causality, and outcomes of AEs were recorded.
2.5. Statistical analysis
In part 1, sample size was determined using feasibility rather than statistical considerations as no formal hypothesis was being tested. In part 2, it was determined that a sample size of 34 participants provided >90% power to exclude that active drug caused a >10‐ms QTc effect at clinically relevant plasma concentrations, as shown by the upper bound of the 2‐sided 90% CI of the model‐predicted QTc effect (ΔΔQTc: primary endpoint) at the observed geometric mean Cmax of active drug in the study. This power was approximated using a paired t test. The calculation assumed a 1‐sided 5% significance level, an underlying effect of GSK'254 of 4 ms, and an SD of the ΔQTc of 8.5 ms for both active drug and placebo. With a dropout rate of 20%, approximately 42 participants were planned for enrollment to obtain 34 evaluable participants.
In the concentration‐QTc analysis, the relationship between GSK'254 plasma concentration and ΔQTcF was quantified using a mixed‐effects model, with ΔQTcF as the dependent variable, GSK'254 plasma concentration as the exploratory variate, centered baseline QTcF as an additional covariate, treatment and time (i.e., post‐baseline time point on Day 7 in each period) as fixed effects, and slope per participant and intercept as random effects. An unstructured covariance matrix was specified for the random effects. If convergence could not be achieved even after appropriate rescaling of the concentrations, the random effect on the slope and intercept were dropped, in this order, until convergence was achieved. The degrees of freedom of estimates were determined by the Kenward‐Roger method. From this model, the slope and the treatment effect‐specific intercept were estimated together with the 2‐sided 90% CI. The estimates for the time effect were reported with degrees of freedom and SE. The geometric mean of the individual Cmax values for participants in each of the active dose groups was determined.
The by‐time point analysis for QTcF was based on a linear mixed‐effects model with ΔQTcF as the dependent variable; period, sequence, time (i.e., post‐baseline time point on Day 7 in each period [categorical]), treatment, and time‐by‐treatment interaction as fixed effects; and baseline QTc as a covariate. An unstructured covariance matrix was specified for the repeated measures at post‐baseline time points for participants within treatment period. If the model with an unstructured covariance matrix failed to converge, other covariance matrices, such as autoregressive and compound symmetry, were considered. The model also included a participant‐specific random effect. If the fixed effects for period and/or sequence were not significant (p > .1), these effects may have been removed from the model and the analysis was repeated without those covariates. From this analysis, the LS mean, SE, and 2‐sided 90% CI was calculated for the contrast “GSK'254 versus placebo” for each dose of GSK'254 at each post‐baseline time point separately. For HR, PR interval, QRS interval, and QTc with the methods not selected as primary, the analysis was based on the change from baseline post‐dosing (ΔHR, ΔPR, ΔQRS, and ΔQTc). The same by‐time point analysis model was used as described for QTcF. All continuous ECG parameters (i.e., HR, PR, QRS, and QTcF) were summarized using descriptive statistics.
Statistical analysis for cardiodynamic analyses were performed using SAS® software for Windows (version 9.4; SAS Institute, Cary, NC). Pharmacokinetic parameters were calculated by standard non‐compartmental analysis using Phoenix WinNonlin™ software (Certara, Princeton, NJ) and summarized by treatment. All calculations of non‐compartmental parameters were based on actual sampling times. Safety results were summarized descriptively.
3. RESULTS
3.1. Participants
Overall, eight (100%) of eight participants in part 1 and 40 (95%) of 42 participants in part 2 completed the study. Two participants in part 2 withdrew from the study, one due to an AE (coronavirus infection) and one due to pregnancy. In parts 1 and 2, 35 (70%) participants were male, 21 (42%) identified as White/Caucasian/European heritage, and 20 (40%) identified as Black/African American; mean age was approximately 34 years in both parts of the study (Table 1).
TABLE 1.
Demographics and baseline characteristics.
| Parameter | Part 1 (n = 8) | Part 2 (n = 42) |
|---|---|---|
| Age, mean (range), years | 33.6 (24–43) | 34.0 (19–50) |
| Female, n (%) | 4 (50) | 11 (26) |
| Race, n (%) | ||
| White—White/Caucasian/European heritage | 4 (50) | 17 (40) |
| White—Arabic/North African heritage | 1 (13) | 6 (14) |
| Black/African American | 3 (38) | 17 (40) |
| Asian—Japanese heritage | 0 | 1 (2) |
| Native Hawaiian/Other Pacific Islander | 0 | 1 (2) |
| Ethnicity, n (%) | ||
| Not Hispanic or Latino | 5 (63) | 32 (76) |
| Hispanic or Latino | 3 (38) | 10 (24) |
| Body mass index, mean (range), kg m−2 | 26.2 (21.6–29.9) | 25.4 (19.9–30.8) |
| Weight, mean (SD), kg | 73.1 (14.6) | 73.8 (10.6) |
| Height, mean (SD), cm | 166.3 (11.0) | 170.5 (8.6) |
3.2. Part 1: Sentinel cohort
3.2.1. Pharmacokinetics
Preliminary PK data from part 1 were used to select the supratherapeutic dose and dosing interval for part 2. Following 7 days of GSK'254 500 mg QD, geometric mean AUC0–τ , Cmax, and C τ for GSK'254 were 68 800 h∙ng mL−1, 4440 ng mL−1, and 2080 ng mL−1, respectively (Table 2). Median (range) t max was 4.5 (2.0–4.5) hours. As steady‐state Cmax values approximated the target of 4400 ng mL−1, it was determined that GSK'254 500 mg QD was sufficient to achieve targeted supratherapeutic exposures in part 2.
TABLE 2.
Summary of GSK'254 plasma PK parameters on Day 7 in parts 1 and 2.
| Parameter | Part 1 | Part 2 | |
|---|---|---|---|
| GSK'254 500 mg (n = 6) | GSK'254 100 mg (n = 40) | GSK'254 500 mg (n = 40) | |
| AUC0–t , h∙ng mL−1 | |||
| Geometric mean (%CVb) | 102 000 (25.3) | 13 800 (37.2) | 67 500 (42.9) |
| 95% CI | 78 900–133 000 | 12 300–15 500 | 59 200–77 000 |
| AUC0–τ , h∙ng mL−1 | |||
| Geometric mean (%CVb) | 68 800 (25.1) | 13 800 (37.2) | 67 500 (42.9) |
| 95% CI | 53 100–89 100 | 12 300–15 500 | 59 200–77 000 |
| Cmax, ng mL−1 | |||
| Geometric mean (%CVb) | 4440 (22.7) | 830 (37.9) | 4260 (41.8) |
| 95% CI | 3510–5620 | 738–934 | 3750–4840 |
| C τ , ng mL−1 | |||
| Geometric mean (%CVb) | 2080 (32.4) | 460 (40.3) | 2140 (46.6) |
| 95% CI | 1500–2900 | 406–521 | 1850–2460 |
| t max, h | |||
| Median (range) | 4.5 (2.0–4.5) | 5.0 (2.1–12.0) | 5.0 (2.0–12.0) |
Abbreviations: AUC0–t , area under the plasma concentration‐time curve from time zero to the last quantifiable time point; AUC0–τ , area under the plasma concentration‐time curve from zero to the end of the dosing interval at steady state; Cmax, maximum observed concentration; C τ , plasma concentration at the end of the dosing interval; GSK'254, GSK3640254; PK, pharmacokinetics; t max, time to Cmax.
3.2.2. Safety
In part 1, three (38%) participants reported AEs, with all individual AEs reported by one participant each (Table S1). All AEs were maximum grade 1, and no drug‐related AEs, SAEs, or deaths were reported. No clinically relevant changes from baseline in laboratory assessments, vital sign measurements, or ECGs were observed in part 1.
3.3. Part 2: Main QTc study
3.3.1. Cardiodynamics
At baseline, ECG parameters were within expected ranges for a healthy population, with mean HR ranging from 61.9 to 63.0 beats per minute (bpm), mean QTcF from 399.4 to 401.1 ms, mean PR from 145.6 to 147.1 ms, and mean QRS from 103.3 to 103.7 ms across the four dosing groups.
On Day 7, geometric mean (95% CI) Cmax for GSK'254 was observed at 5 h post‐dose for both doses (100 mg: 830 [738–934] ng mL−1; 500 mg: 4260 [3750–4840] ng mL−1; Table 2). In the concentration‐QTc analysis, a linear model with a treatment effect–specific intercept was fitted for GSK'254 plasma concentrations using a goodness‐of‐fit plot (Figure 2). The estimated population slope of the concentration‐QTc model was 0.0025 ms per ng mL−1 (90% CI 0.00200–0.00308; p < .0001), with a treatment effect–specific intercept of 0.61 ms (90% CI −0.0038–1.253; p = .1216). The effect on ΔΔQTcF at the geometric mean GSK'254 Cmax was predicted to be 2.72 ms (90% CI 2.04–3.39) and 11.49 ms (90% CI 9.24–13.73) for GSK'254 100 and 500 mg, respectively (Figure 3). The predicted upper bound of the 90% CI remained <10 ms at GSK'254 plasma concentrations <3070 ng mL−1.
FIGURE 2.

Goodness‐of‐fit plot of the QTc model. The solid black line and gray shaded region denote the model‐predicted mean (90% CI) ΔΔQTcF, which is calculated from the equation ΔΔQTcF ≈ 0.61 + 0.0025 × GSK'254 concentration. The red filled circles with error bars denote the estimated mean ΔΔQTcF with 90% CI at the associated median plasma concentration within each GSK'254 concentration decile. The blue open circle with error bars denotes the mean ΔΔQTcF with 90% CI for placebo. The horizontal red line with notches shows the range of GSK'254 concentrations divided into deciles. The black dashed line denotes the 10‐ms threshold. QTc, corrected QT; ΔΔQTcF, placebo‐adjusted change from baseline in QT interval corrected using Fridericia's formula.
FIGURE 3.
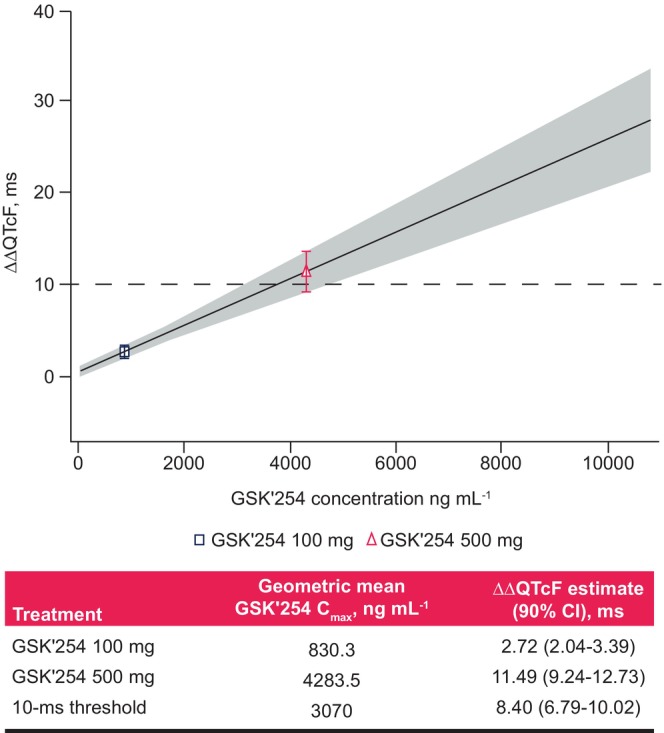
Model‐predicted ΔΔQTc interval at geometric mean GSK'254 concentrations associated with 100‐ and 500‐mg doses. The solid black line and gray shaded region denote the model‐predicted mean (90%) ΔΔQTcF, which is calculated from the equation ΔΔQTcF ≈ 0.61 + 0.0025 × GSK'254 concentration. The points plotted denote the estimated mean (90%) ΔΔQTcF at geometric mean GSK'254 Cmax. The black dashed line denotes the 10‐ms threshold. Cmax, maximum concentration; ΔΔQTcF, placebo‐adjusted change from baseline in QT interval corrected using Fridericia's formula.
With GSK'254 100 mg, LS mean ΔHR followed the pattern observed with placebo, and LS mean (90% CI) ΔΔHR across time points ranged from −0.2 (−2.17–1.67) bpm at 0.5 h post‐dose to 2.6 (0.70–4.53) bpm at 24 h post‐dose. With GSK'254 500 mg, a small increase in LS mean ΔHR was observed, with the largest LS mean ΔΔHR of 5.1 bpm (90% CI 3.30–6.97) occurring at 10 h post‐dose on Day 7. There were no outliers in terms of HR changes, except for one participant at one time point each with GSK'254 100 and 500 mg (HR >100 bpm with a >25% increase in ΔHR).
With both GSK'254 doses, LS mean change from baseline in PR generally followed the pattern observed with placebo, with LS mean (90% CI) placebo‐corrected change from baseline in PR across post‐dose time points ranging from −1.8 (−4.00–0.36) ms at 24 h post‐dose to 3.2 (0.86–5.57) ms at 3.5 h post‐dose, both with GSK'254 500 mg. Similarly, LS mean change from baseline in QRS was small and LS mean placebo‐corrected change from baseline in QRS was <1 ms across all post‐dose time points with both GSK'254 doses, except for a maximum value of 1.4 ms (90% CI 0.43–2.30) at 24 h post‐dose with GSK'254 500 mg.
In the by‐time point analysis, least‐squares (LS) mean ΔQTcF for GSK'254 100 mg followed the placebo pattern across time points, with a maximum LS mean ΔΔQTcF of 1.7 ms at 2 and 6 h post‐dose on Day 7 (Table 3). The upper bound of the 90% CI remained <10 ms through 24 h post‐dose GSK'254 100 mg administration. In contrast, QT prolongation was observed for GSK'254 500 mg, with a maximum LS mean (90% CI) ΔΔQTcF of 10.6 (7.75–13.38) ms at 4.5 h post‐dose, exceeding the 10‐ms threshold. For moxifloxacin, an increase in LS mean (90% CI) ΔΔQTcF was observed, with a maximum value of 8.9 (6.15–11.60) ms at 3.5 h post‐dose.
TABLE 3.
Summary of ΔΔQTcF at each time point on Day 7.
| Time, h | ΔΔQTcF, LS mean (90% CI), ms | ||
|---|---|---|---|
| GSK'254 100 mg | GSK'254 500 mg | Moxifloxacin 400 mg | |
| Pre‐dose | 1.4 (−0.88, 3.77) | 7.1 (4.74, 9.46) | 0.6 (−1.74, 2.90) |
| 0.5 | 1.0 (−1.60, 3.59) | 7.2 (4.59, 9.83) | −0.2 (−2.82, 2.37) |
| 1 | 0.6 (−2.06, 3.33) | 4.1 (1.34, 6.79) | −0.8 (−3.50, 1.88) |
| 2 | 1.7 (−1.27, 4.73) | 6.5 (3.46, 9.55) | 5.6 (2.57, 8.61) |
| 3 | 1.5 (−1.45, 4.51) | 8.1 (5.06, 11.09) | 7.9 (4.94, 10.92) |
| 3.5 | 1.4 (−1.30, 4.13) | 9.2 (6.44, 11.93) | 8.9 (6.15, 11.60) |
| 4 | 1.0 (−1.59, 3.54) | 8.6 (6.03, 11.22) | 8.6 (6.07, 11.21) |
| 4.5 | 1.0 (−1.73, 3.82) | 10.6 (7.75, 13.38) | 8.4 (5.62, 11.18) |
| 5 | 0.2 (−2.44, 2.80) | 9.6 (6.92, 12.24) | 8.2 (5.53, 10.79) |
| 6 | 1.7 (−1.58, 4.97) | 8.6 (5.27, 11.89) | 8.2 (4.94, 11.50) |
| 8 | −0.8 (−3.54, 1.90) | 8.1 (5.34, 10.85) | 6.9 (4.19, 9.66) |
| 10 | 0.2 (−2.30, 2.65) | 8.6 (6.14, 11.15) | 6.8 (4.30, 9.28) |
| 12 | 0.5 (−2.43, 3.35) | 6.0 (3.07, 8.89) | 5.3 (2.38, 8.17) |
| 24 | 0.1 (−2.66, 2.76) | 7.7 (4.94, 10.45) | 6.8 (4.13, 9.54) |
Abbreviations: GSK'254, GSK3640254; LS, least‐squares; QTcF, QT interval corrected using Fridericia's formula; ΔΔQTcF, placebo‐adjusted change from baseline in QTcF.
No participants had QTcF >480 ms or ΔQTcF >60 ms. Reports of QTcF >450 to ≤480 ms occurred in one participant (one time point) with GSK'254 100 mg, one participant (one time point) with GSK'254 500 mg, and two participants (nine time points) with moxifloxacin. Observations of ΔQTcF >30 ms occurred in two participants (three time points) with GSK'254 500 mg and no participants with GSK'254 100 mg, moxifloxacin, or placebo.
3.3.2. Pharmacokinetics
Following 7 days of GSK'254 100 or 500 mg QD, geometric mean (95% CI) GSK'254 exposure values were 13 800 (12 300–15 500) and 67 500 (59 200–77 000) h ng mL−1 for AUC0–τ , 830 (738–934) and 4260 (3750–4840) ng mL−1 for Cmax, and 460 (406–521) and 2140 (1850–2460) ng mL−1 for C τ , respectively (Table 2). Geometric mean steady‐state exposure values with GSK'254 500 mg were ~5‐fold higher than those with GSK'254 100 mg. Median t max was 5.0 h for both GSK'254 doses. Following a single dose of moxifloxacin 400 mg on Day 7, the geometric mean (95% CI) Cmax value was 1960 (1840–2090) ng mL−1, and median (range) t max was 4.0 (2.0–6.0) hours.
3.3.3. Safety
In part 2, 18 (43%) participants reported AEs (Table 4), all of which were of maximum grade 1 severity. The most common AE was diarrhea, reported in seven participants (n = 1 during treatment with placebo; n = 6 during treatment with GSK'254 500 mg). Abdominal pain, nausea, medical device site dermatitis, vessel puncture site pain, acne, and maculopapular rash were reported by two participants each in part 2 (5%); all other AEs were reported by one participant each. Eleven (26%) participants reported drug‐related AEs (n = 1 during treatment with placebo; n = 2 each during treatment with GSK'254 100 mg and moxifloxacin; n = 7 during treatment with GSK'254 500 mg). The most common drug‐related AE was diarrhea, reported in six participants during treatment with GSK'254 500 mg. No SAEs, deaths, or clinically relevant changes from baseline in laboratory assessments, vital sign measurements, or ECGs were reported.
TABLE 4.
Summary of AEs by system organ class in part 2.
| System organ class/preferred term, n (%) a | GSK'254 100 mg (N = 40) | GSK'254 500 mg (N = 40) | Moxifloxacin 400 mg (N = 40) | Placebo (N = 42) | Total (N = 42) |
|---|---|---|---|---|---|
| Any AE b | 5 (13) | 10 (25) | 4 (10) | 7 (17) | 18 (43) |
| Gastrointestinal disorders | 1 (3) | 7 (18) | 2 (5) | 2 (5) | 9 (21) |
| Diarrhea | 0 | 6 (15) | 0 | 1 (2) | 7 (17) |
| Abdominal pain | 0 | 1 (3) | 1 (3) | 1 (2) | 2 (5) |
| Nausea | 0 | 2 (5) | 0 | 0 | 2 (5) |
| General disorders and administration site conditions | 0 | 3 (8) | 1 (3) | 2 (5) | 6 (14) |
| Medical device site dermatitis | 0 | 2 (5) | 0 | 0 | 2 (5) |
| Vessel puncture site pain | 0 | 0 | 1 (3) | 1 (2) | 2 (5) |
| Skin and subcutaneous tissue disorders | 3 (8) | 2 (5) | 0 | 1 (2) | 6 (14) |
| Acne | 2 (5) | 0 | 0 | 0 | 2 (5) |
| Maculopapular rash | 1 (3) | 1 (3) | 0 | 0 | 2 (5) |
| Infections and infestations | 0 | 1 (3) | 0 | 2 (5) | 3 (7) |
| Nervous system disorders | 0 | 1 (3) | 2 (5) | 0 | 3 (7) |
| Immune system disorders | 0 | 0 | 1 (3) | 0 | 1 (2) |
| Renal and urinary disorders | 0 | 0 | 1 (3) | 0 | 1 (2) |
| Reproductive system and breast disorders | 0 | 0 | 0 | 1 (2) | 1 (2) |
| Respiratory, thoracic, and mediastinal disorders | 1 (3) | 0 | 0 | 0 | 1 (2) |
| Any drug‐related AE c | 2 (5) | 7 (18) | 2 (5) | 1 (2) | 11 (26) |
| Gastrointestinal disorders | 0 | 6 (15) | 1 (3) | 0 | 7 (17) |
| Diarrhea | 0 | 6 (15) | 0 | 0 | 6 (14) |
| Abdominal pain | 0 | 1 (3) | 1 (3) | 0 | 2 (5) |
| Nausea | 0 | 2 (5) | 0 | 0 | 2 (5) |
| Skin and subcutaneous tissue disorders | 2 (5) | 1 (3) | 0 | 0 | 3 (7) |
| Acne | 2 (5) | 0 | 0 | 0 | 2 (5) |
| Pruritus | 1 (3) | 0 | 0 | 0 | 1 (2) |
| Maculopapular rash | 0 | 1 (3) | 0 | 0 | 1 (2) |
| General disorders and administration site conditions | 0 | 0 | 0 | 1 (2) | 1 (2) |
| Fatigue | 0 | 0 | 0 | 1 (2) | 1 (2) |
| Renal and urinary disorders | 0 | 0 | 1 (3) | 0 | 1 (2) |
| Urinary hesitation | 0 | 0 | 1 (3) | 0 | 1 (2) |
Abbreviation: AE, adverse event.
At each level of participant summarization, a participant was counted once if the participant reported ≥1 events.
Individual AEs reported in ≥2 participants are shown.
All drug‐related AEs are shown.
4. DISCUSSION
In this randomized thorough QT/QTc study, the effect of GSK'254 on cardiac repolarization was evaluated in healthy participants. No clinically relevant effects on QTc prolongation, HR, or cardiac conduction were seen in healthy participants at the dose of GSK'254 100 mg. With the supratherapeutic dose of GSK'254 500 mg, mild QT prolongation of 10.6 ms was observed. The findings from this study indicate that cardiac abnormalities with GSK'254 dosing, such as that previously observed in one dog in pre‐clinical studies, are rare events. Both GSK'254 doses were generally well tolerated over short‐term administration, with all AEs being mild in intensity and no new safety concerns identified.
In the concentration‐QTc analysis, a linear model with a treatment effect–specific intercept was fitted for GSK'254 plasma concentrations, which represented the data in an acceptable way. This model predicted that the GSK'254 plasma concentration below which the upper bound of the 90% CI would remain <10 ms was 3070 ng mL−1. This concentration is above the geometric mean Cmax observed with GSK'254 200 mg QD in previous studies of healthy participants (1040–1780 ng mL−1) 1 , 3 , 5 , 6 , 7 , 9 , 10 and treatment‐naive people living with HIV‐1 (1860 ng mL−1). 8 As GSK'254 200 mg is the highest dose being evaluated in phase IIa and IIb studies of people living with HIV‐1, 8 , 11 , 12 the predicted mean Cmax for the 200 mg dose would not be associated with QT prolongation. Therefore, results from the concentration‐QTc analysis and previous studies suggest that GSK'254 plasma concentrations associated with QT prolongation above the clinically important threshold of 10 ms (>3070 ng mL−1) are unlikely to occur at the clinically relevant 100‐ or 200‐mg doses of GSK'254.
According to International Conference on Harmonization E14 guidance for thorough QTc studies, a QT interval threshold of 10 ms reasonably ensures that the mean effect of a drug remains below ~5 ms, a threshold that does not appear to be associated with Torsades de pointes. 13 With the dose of GSK'254 100 mg, the largest mean ΔΔQTcF reached 1.7 ms and the upper bound of the 90% CI remained well below the 10‐ms threshold at all post‐dose time points. Therefore, a clinically relevant effect on cardiac repolarization with the 100‐mg dose can be excluded. In contrast, mild QT prolongation was observed with the 500‐mg supratherapeutic dose, with the largest LS mean ΔΔQTcF reaching 10.6 ms at 4.5 h post‐dose. Observations of QT prolongation with supratherapeutic doses but not therapeutic doses have previously been shown for other approved antiretroviral agents, including fostemsavir, rilpivirine, and ritonavir‐boosted lopinavir. 14 , 15 , 16 Additionally, neither GSK'254 dose had a clinically relevant effect on cardiac conduction (PR and QRS intervals) or HR, with the largest mean ΔΔHR of 5.1 bpm remaining well below the 10‐bpm threshold for a substantial HR effect. Overall, these results indicate that there is no expected effect on cardiac parameters, including QT interval, HR, and cardiac conduction, with a 100‐mg dose of GSK'254.
This study had some limitations. Sample sizes were relatively small, and most participants were men (70%) and identified as either White (42%) or Black race (40%), which may limit the generalizability of these findings.
5. CONCLUSION
GSK'254 had no clinically relevant effects on QTc prolongation, HR, or cardiac conduction at plasma concentrations associated with GSK'254 100 mg, and no major safety or tolerability findings were noted.
AUTHOR CONTRIBUTIONS
Ying Zhang, Parto Yazdani, Joyce Zhan, Bo Wen, Veronica Bainbridge, Samit Joshi, and Max Lataillade contributed to the conception of the study. Ying Zhang, Parto Yazdani, Joyce Zhan, Bo Wen, Veronica Bainbridge, and Samit Joshi contributed to the design of the study. Ying Zhang, Mark Bush, Parto Yazdani, Joyce Zhan, and Samit Joshi contributed to the acquisition of data. Ying Zhang, Mark Bush, Veronica Bainbridge, Brian R. Wynne, and Samit Joshi contributed to the analysis of data. Ying Zhang, Mark Bush, Joyce Zhan, Bo Wen, Veronica Bainbridge, Brian R. Wynne, Samit Joshi, and Max Lataillade contributed to the interpretation of data. Ying Zhang and Mark Bush contributed to the drafting of the manuscript. Ying Zhang, Mark Bush, and Samit Joshi contributed to critically revising the manuscript for important intellectual content. All authors provided final approval of the manuscript for publication.
FUNDING INFORMATION
This study was sponsored by ViiV Healthcare.
CONFLICT OF INTEREST STATEMENT
YZ, MB, PY, JZ, BW, VB, BRW, SJ, and ML are or were employees of GSK or ViiV Healthcare at the time of the study and may hold stock in GSK.
ETHICS STATEMENT
This study was conducted in accordance with International Council for Harmonization of Technical Requirements for Registration of Pharmaceuticals for Human Use Good Clinical Practice and followed the Declaration of Helsinki principles. The protocol was reviewed and approved by IntegReview IRB (Columbia, MD).
PRINCIPAL INVESTIGATOR STATEMENT
The authors confirm that the principal investigator for this paper is Rebecca N. Wood‐Horrall, MD, and that she had direct clinical responsibility for participants. Dr Wood‐Horrall has not been included as an author on this manuscript as she does not meet the requirements for authorship. As an employee of PPD, a contract research organization, Dr Wood‐Horrall was contracted by ViiV Healthcare to serve as principal investigator.
PATIENT CONSENT STATEMENT
All participants provided written informed consent and could withdraw from the study at any time.
Supporting information
Table S1
ACKNOWLEDGMENTS
This study was funded by ViiV Healthcare. The authors thank Teodora Pene Dumitrescu and Jianfeng Xu, GSK; and Michelle DeGrosky, Mark Johnson, and Martin Gartland, ViiV Healthcare for their contributions. Editorial assistance was provided under the direction of the authors by Deborah Lew, PhD, and Lauren Bragg, ELS, MedThink SciCom, and was funded by ViiV Healthcare.
Zhang Y, Bush M, Yazdani P, et al. Effects of the HIV‐1 maturation inhibitor GSK3640254 on QT interval in healthy participants. Pharmacol Res Perspect. 2023;11:e01151. doi: 10.1002/prp2.1151
Joyce Zhan was an employee of GSK at the time of the study.
Clinical trial registration: ClinicalTrials.gov, NCT04563845.
DATA AVAILABILITY STATEMENT
Anonymized individual participant data and study documents can be requested for further research from www.clinicalstudydatarequest.com.
REFERENCES
- 1. Joshi SR, Fernando D, Igwe S, et al. Phase I evaluation of the safety, tolerability, and pharmacokinetics of GSK3640254, a next‐generation HIV‐1 maturation inhibitor. Pharmacol Res Perspect. 2020;8(6):e00671. [DOI] [PMC free article] [PubMed] [Google Scholar]
- 2. Joshi SR, Fernando D, Igwe S, et al. The initial phase I evaluation of the safety, tolerability, and pharmacokinetics of GSK3640254, a next‐generation HIV maturation inhibitor, as assessed in healthy subjects. Abstract presented at: EACS 2019; May 14–16, 2019; Noordwijk, the Netherlands.
- 3. Pene Dumitrescu T, Joshi SR, Xu J, et al. A phase I evaluation of the pharmacokinetics and tolerability of the HIV‐1 maturation inhibitor GSK3640254 and tenofovir alafenamide/emtricitabine in healthy participants. Antimicrob Agents Chemother. 2021;65(6):e02173‐20. [DOI] [PMC free article] [PubMed] [Google Scholar]
- 4. Wang D, Lu W, Li F. Pharmacological intervention of HIV‐1 maturation. Acta Pharm Sin B. 2015;5(6):493‐499. [DOI] [PMC free article] [PubMed] [Google Scholar]
- 5. Pene Dumitrescu T, Greene TJ, Joshi SR, et al. Lack of pharmacokinetic interaction between the HIV‐1 maturation inhibitor GSK3640254 and combination oral contraceptives in healthy women. Br J Clin Pharmacol. 2022;88(4):1704‐1712. [DOI] [PMC free article] [PubMed] [Google Scholar]
- 6. Pene Dumitrescu T, Joshi SR, Xu J, et al. Phase I evaluation of pharmacokinetics and tolerability of the HIV‐1 maturation inhibitor GSK3640254 and dolutegravir in healthy adults. Br J Clin Pharmacol. 2021;87(9):3501‐3507. [DOI] [PMC free article] [PubMed] [Google Scholar]
- 7. Zhang Y, Johnson M, Joshi S, et al. Open‐label, drug‐drug interaction study between the HIV‐1 maturation inhibitor GSK3640254 and a metabolic probe cocktail in healthy participants. Br J Clin Pharmacol. 2023;23:2236‐2245. doi: 10.1111/bcp.15699 [DOI] [PubMed] [Google Scholar]
- 8. Spinner CD, Felizarta F, Rizzardini G, et al. Phase IIa proof‐of‐concept evaluation of the antiviral efficacy, safety, tolerability, and pharmacokinetics of the next‐generation maturation inhibitor GSK3640254. Clin Infect Dis. 2022;75(5):786‐794. [DOI] [PMC free article] [PubMed] [Google Scholar]
- 9. Johnson M, Pene Dumitrescu T, Joshi SR, et al. Relative bioavailability and food effect of GSK3640254 tablet and capsule formulations in healthy participants. Clin Pharmacol Drug Dev. 2022;11(5):632‐639. [DOI] [PMC free article] [PubMed] [Google Scholar]
- 10. Wen B, Zhang Y, Young GC, et al. Investigation of clinical absorption, distribution, metabolism, and excretion and pharmacokinetics of the HIV‐1 maturation inhibitor GSK3640254 using an intravenous microtracer combined with EnteroTracker for biliary sampling. Drug Metab Dispos. 2022;50(11):1442‐1453. [DOI] [PubMed] [Google Scholar]
- 11. U.S. National Library of Medicine . A dose‐range finding clinical trial study in human immunodeficiency virus (HIV‐1) infected treatment‐naive adults (DOMINO). ClinTrials.gov. Published July 30, 2020. Updated January 18, 2023. Accessed August 4, 2023. https://classic.clinicaltrials.gov/ct2/show/NCT04493216?term=GSK3640254&phase=1&draw=2&rank=3
- 12. U.S. National Library of Medicine . A clinical trial of GSK3640254 + dolutegravir (DTG) in human immunodeficiency virus‐1 infected treatment‐naive adults (DYNAMIC). ClinTrials.gov. Published May 25, 2021. Updated January 2–5, 2023. Accessed August 4, 2023.
- 13. International Conference on Harmonisation of Technical Requirements for Registration of Pharmaceuticals for Human Use . ICH Harmonised Tripartite Guideline E14: The Clinical Evaluation of QT/QTc Interval Prolongation and Proarrhythmic Potential for Non‐Antiarrhythmic Drugs. Accessed January 6, 2023. https://www.ich.org/fileadmin/Public_Web_Site/ICH_Products/Guidelines/Efficacy/E14/E14_Guideline.pdf
- 14. Lagishetty C, Moore K, Ackerman P, Llamoso C, Magee M. Effects of temsavir, active moiety of antiretroviral agent fostemsavir, on QT interval: results from a phase I study and an exposure‐response analysis. Clin Transl Sci. 2020;13(4):769‐776. [DOI] [PMC free article] [PubMed] [Google Scholar]
- 15. Edurant . Package insert. Janssen Therapeutics; 2022. [Google Scholar]
- 16. Klein CE, Chiu YL, Da Silva BA, et al. Evaluation of the impact of lopinavir/ritonavir (LPV/r) and ritonavir (RTV) on QTcF: results of a thorough QT study. J Int AIDS Soc. 2008;11(Suppl 1):P95. [Google Scholar]
Associated Data
This section collects any data citations, data availability statements, or supplementary materials included in this article.
Supplementary Materials
Table S1
Data Availability Statement
Anonymized individual participant data and study documents can be requested for further research from www.clinicalstudydatarequest.com.