

Whether virologic rebound in SARS-CoV-2 infection occurs with greater frequency in patients treated with nirmatrelvir–ritonavir than in untreated patients is currently a question of clinical interest. This observational study in a multicenter health care system compared the occurrence of virologic rebound in treated patients versus untreated patients. Differences in symptoms, viral shedding, and occurrence of viral resistance mutations between the groups were also assessed.
Visual Abstract. SARS-CoV-2 Virologic Rebound With Nirmatrelvir–Ritonavir Therapy.
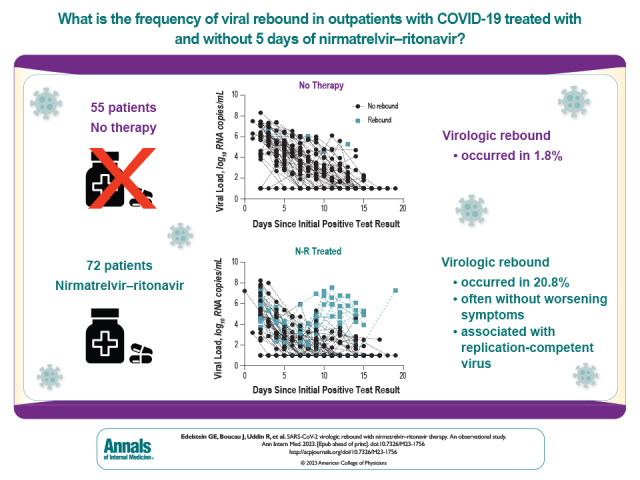
Whether virologic rebound in SARS-CoV-2 infection occurs with greater frequency in patients treated with nirmatrelvir–ritonavir than in untreated patients is currently a question of clinical interest. This observational study in a multicenter health care system compared the occurrence of virologic rebound in treated patients versus untreated patients. Differences in symptoms, viral shedding, and occurrence of viral resistance mutations between the groups were also assessed.
Abstract
Background:
Data are conflicting regarding an association between treatment of acute COVID-19 with nirmatrelvir–ritonavir (N-R) and virologic rebound (VR).
Objective:
To compare the frequency of VR in patients with and without N-R treatment for acute COVID-19.
Design:
Observational cohort study.
Setting:
Multicenter health care system in Boston, Massachusetts.
Participants:
Ambulatory adults with acute COVID-19 with and without use of N-R.
Intervention:
Receipt of 5 days of N-R treatment versus no COVID-19 therapy.
Measurements:
The primary outcome was VR, defined as either a positive SARS-CoV-2 viral culture result after a prior negative result or 2 consecutive viral loads above 4.0 log10 copies/mL that were also at least 1.0 log10 copies/mL higher than a prior viral load below 4.0 log10 copies/mL.
Results:
Compared with untreated persons (n = 55), those taking N-R (n = 72) were older, received more COVID-19 vaccinations, and more commonly had immunosuppression. Fifteen participants (20.8%) taking N-R had VR versus 1 (1.8%) who was untreated (absolute difference, 19.0 percentage points [95% CI, 9.0 to 29.0 percentage points]; P = 0.001). All persons with VR had a positive viral culture result after a prior negative result. In multivariable models, only N-R use was associated with VR (adjusted odds ratio, 10.02 [CI, 1.13 to 88.74]; P = 0.038). Virologic rebound was more common among those who started therapy within 2 days of symptom onset (26.3%) than among those who started 2 or more days after symptom onset (0%) (P = 0.030). Among participants receiving N-R, those who had VR had prolonged shedding of replication-competent virus compared with those who did not have VR (median, 14 vs. 3 days). Eight of 16 participants (50% [CI, 25% to 75%]) with VR also reported symptom rebound; 2 were completely asymptomatic. No post-VR resistance mutations were detected.
Limitations:
Observational study design with differences between the treated and untreated groups; positive viral culture result was used as a surrogate marker for risk for ongoing viral transmission.
Conclusion:
Virologic rebound occurred in approximately 1 in 5 people taking N-R, often without symptom rebound, and was associated with shedding of replication-competent virus.
Primary Funding Source:
National Institutes of Health.
Nirmatrelvir–ritonavir (N-R) is an oral antiviral that inhibits the main protease of SARS-CoV-2. It reduces incidence of hospitalization and death among persons with mild to moderate COVID-19 (1–3) and is now widely used in the United States (4, 5). However, soon after its adoption in clinical care, a virologic rebound (VR) phenomenon was reported, characterized by recurrence of symptoms and reversion to SARS-CoV-2 test positivity after initial recovery with treatment (6, 7).
The frequency and epidemiology of COVID-19 VR remain poorly characterized, in part because of a lack of consensus around how to define VR. Retrospective analyses from a phase 3 clinical trial as well as health system data have estimated the frequency of VR after N-R to be 1% to 2% (8–10). The VR phenomenon has been reported at similar frequencies among persons with COVID-19 in the absence of treatment (11). A single prospective study of a home-based testing program estimated higher rates of VR both in persons taking N-R (14%) and in an untreated comparator group (9%) (12). However, precise estimation of the effect of N-R use on VR incidence has been limited by infrequent and short-term sampling, symptom reporting, and absence of culture data. No studies have used routine, prospective testing with viral cultures to estimate the frequency and duration of shedding of replication-competent virus.
In this study, we estimated the effect of N-R use on the frequency and duration of VR in ambulatory persons. Secondary aims included estimating the validity of symptom reporting to detect VR and exploring the emergence of drug resistance mutations after VR.
Methods
Parent Study Design
Participants and data for this analysis were drawn from POSITIVES (Post-vaccination Viral Characteristics Study), a prospective observational cohort study that enrolls persons with acute COVID-19 for longitudinal assessment of quantitative viral load, viral culture, and symptom data collection (7, 13). The parent study provides data for the study of COVID-19 variants, host immunity, vaccination, therapeutics, and viral dynamics. Persons who are potentially eligible for recruitment into the POSITIVES cohort are identified from an automated list of persons with a positive test result and/or a prescription for a COVID-19 therapeutic in the Mass General Brigham health care system in Boston, Massachusetts. Participants may also self-refer from online study information sheets or be referred by health care providers. The medical charts of consenting participants are reviewed by study physicians to determine COVID-19 vaccination status, treatment history, and medical history. Persons with a diagnosis of leukemia or lymphoma; those with a history of solid organ or bone marrow transplant; and those receiving immunosuppressive therapies, including corticosteroids, interferon-γ inhibitors, or cytotoxic therapies (for example, anticytokine therapies), are classified as having immunosuppression (Supplement Table 1).
Eligibility Criteria
We restricted this analysis to participants enrolled in the POSITIVES parent study who met the following criteria at the time of their first positive result on a COVID-19 diagnostic test: 1) ambulatory (because N-R therapy is recommended for mild to moderate COVID-19); 2) had enrolled in the POSITIVES parent study on or after 1 March 2022, when we began enrolling persons at the time of N-R initiation; 3) had not used antiviral therapies other than N-R (that is, remdesivir or molnupiravir) in the previous 14 days or monoclonal antibodies in the previous 90 days; 4) were enrolled within 5 days of their initial diagnostic test for COVID-19 (to ensure all persons were within the treatment window for N-R initiation) (4); and 5) had not already completed a course of N-R therapy at the time of enrollment (to avoid inclusion of persons who were already experiencing rebound at the time of enrollment).
Treatment Strategies
The 2 strategies of interest were receipt of 5 days of N-R therapy and no receipt of therapy for COVID-19. We assigned eligible participants to the N-R group if they initiated N-R within 5 days of their first positive result on a COVID-19 diagnostic test and to the no-therapy group if they did not initiate any COVID-19 therapy within 5 days of their first positive result.
Outcomes
Our primary outcome of interest was VR within 20 days of the participant's initial positive test result, which we defined as either 1) a positive SARS-CoV-2 viral culture result after a prior negative result, or 2) sustained elevated viral load, characterized by the combination of a nadir viral load below 4.0 log10 copies/mL followed by an increase in viral load that was at least 1.0 log10 copies/mL above the nadir, and 2 consecutive viral load results of 4.0 log10 copies/mL or higher. We selected this primary outcome as a surrogate for putative transmission risk, based on prior data relating transmission risk and replication-competent virus with viral loads of 4.0 log10 copies/mL or higher (14, 15). For the secondary outcome, we restricted viral load measurements to days 5, 10, and 14 (all ±1 day) and defined VR as a viral load at days 10 and 14 of at least 2.7 log10 copies/mL and at least 0.5 log10 copies/mL greater than the result at day 5, as was done in the secondary analysis of the EPIC-HR (Evaluation of Protease Inhibition for Covid-19 in High-Risk Patients) phase 3 trial of N-R (9). If viral load data from only day 10 or day 14 were available, a single measurement on that day that was 2.7 log10 copies/mL or higher and was at least 0.5 log10 copies/mL greater than the result at day 5 also met the criteria. We selected this outcome to enable comparison of our results with those of prior studies and to determine whether the additional sampling (that is, more frequent sampling and use of viral culture methods as another measurement) done in our study enabled increased detection of VR events.
Specimen Collection
To ascertain the study outcomes, nasal swabs and collection tubes were delivered to participants' homes with instructions to self-collect anterior nasal swabs. Swabs were collected by participants and picked up by a study courier approximately 3 times a week for 2 weeks and weekly thereafter until SARS-CoV-2 viral load test results were persistently undetectable. Specimens were analyzed for SARS-CoV-2 viral load and viral culture, and whole-genome sequencing was performed (full details of laboratory testing are provided in the Supplement Methods). On each date of swab collection, participants completed a 10-item survey on acute COVID-19 symptoms, with each symptom graded as absent (0 points), mild (1 point), moderate (2 points), or severe (3 points), for a maximum total symptom score of 30 points.
Follow-up
Eligible participants were followed for at least 2 weeks and until the occurrence of either 2 consecutive negative polymerase chain reaction (PCR) results or detection of VR. To avoid misclassifying persons who would potentially experience VR, we excluded persons from our primary analysis who did not have a nasal swab collected 12 or more days from their initial diagnostic test because approximately 90% of rebound phenomena occur by this time (7).
Statistical Analysis
For our primary outcome, we compared risk for VR by N-R group. We next assessed VR among N-R users and nonusers, with the cohort stratified by presence or absence of immunosuppression, age (<50 vs. ≥50 years), sex, and number of prior COVID-19 vaccinations (<4 vs. ≥4) using 2-sided Fisher exact tests. We also compared VR frequency by timing of N-R initiation after the initial diagnostic test using a Wilcoxon nonparametric test for trend and by timing of N-R initiation after symptom onset using a 2-sided Fisher exact test. In sensitivity analyses, we examined the rate of VR when persons with nonstandard courses of N-R, those who started alternate COVID-19 therapies during observation, or those who dropped out before 12 days of observation were included. To assess for confounding, we fit exploratory logistic regression models with VR as the dependent variable and each of the aforementioned demographic and clinical characteristics, both alone and in a fully adjusted multivariable model.
In secondary analyses, we used the Kaplan–Meier survival estimator to depict the time to both the initial and final negative viral culture results, stratified by N-R use and presence versus absence of VR. In the survival models, persons were observed from the date of their initial COVID-19 diagnostic test until final culture conversion or the end of follow-up. We defined the date of culture conversion as the first swab date in participants with no positive culture results during observation, the midpoint between the final positive culture result and the next negative culture result in those who had a culture conversion during observation, or the date of the last study specimen for those with a positive culture result on the last study specimen. We assessed the validity of symptom rebound, defined as an increase of 3 or more points in the total symptom score from any prior date, to detect VR (11). Finally, we evaluated the proportion of sequenced viruses before and after the occurrence of VR with mutations in the NSP5 gene encoding the main protease of SARS-CoV-2, the molecular target of N-R. Statistical analyses and figure production were done with Stata, version 16.1 (StataCorp), and GraphPad Prism, version 9.5.
Ethical Considerations
All study participants provided verbal informed consent. Written consent was waived by the review committee because the study was deemed to have minimal risk and the risk of in-person consent during acute COVID-19 infection was believed to outweigh its benefit. The study procedures were approved by the Institutional Review Board and the Institutional Biosafety Committee at Mass General Brigham.
Role of the Funding Source
This work was funded by the National Institutes of Health (U19 AI110818 and R01 AI176287), the Massachusetts Consortium on Pathogen Readiness SARS-CoV-2 Variants Program, and the Massachusetts General Hospital Department of Medicine. The funders had no role in the design of the study; collection, analysis, or interpretation of the data; writing of the manuscript; or the decision to submit the manuscript for publication. The contents of this article are solely the responsibility of the authors and do not necessarily represent the official views of the funding sources.
Results
A total of 173 ambulatory persons with acute COVID-19 were enrolled into the POSITIVES cohort from March 2022 to May 2023 (Appendix Figure). Of these, 31 were excluded due to completion of N-R therapy (n = 19) or receipt of another COVID-19 therapy (n = 12) before enrollment, leaving 142 persons in the eligible cohort. We also excluded from our primary analytic cohort 2 persons who initiated non–N-R therapies after enrollment, 2 who completed less or more than 5 days of N-R therapy, and 11 without at least 1 nasal swab collected on or after day 12 from their first positive COVID-19 test result (Appendix Figure). A comparison of demographic and clinical criteria between our analytic cohort and those who were excluded is provided in Supplement Table 2.
Appendix Figure. Study flow diagram.

N-R = nirmatrelvir–ritonavir.
Compared with untreated persons (n = 55), those taking N-R (n = 72) were older (median age, 57 vs. 39 years; P < 0.001), had received more COVID-19 vaccinations (median, 4 vs. 3; P < 0.001), and more often had immunosuppression (32% vs. 9%; P < 0.001) (Appendix Figure; Table 1). No person in either group died during observation. Fifteen persons (20.8%) taking N-R had VR versus 1 (1.8%) untreated person (Figure 1, A to D; Figure 2) (absolute difference, 19.0 percentage points [95% CI, 9.0 to 29.0 percentage points]; P = 0.001). All 16 VR events (100%) met the viral culture rebound definition, and 12 of 16 (75%) met the viral load criteria. When we restricted analyses to viral load measurements at 3 time points, as was done in the EPIC-HR study (9), after exclusion of 3 participants who were missing viral load measurements either on day 5 or on both day 10 and day 14, only 3 of 124 (2.4%) had VR detected, and 13 of 16 (81.2%) rebound events were not captured (Figure 1, E and F). In subgroup analyses, VR was numerically more frequent in all demographic and clinical subgroups (Figure 2, A). The difference in the VR rate remained similar with inclusion of persons who took more or less than 5 days of N-R (total n = 129; absolute difference, 18.5 percentage points [CI, 8.6 to 28.3 percentage points]; P = 0.002) and inclusion of all eligible persons regardless of use of a secondary COVID-19 therapy after enrollment or failure to collect specimens at least 12 days after their initial positive test result (total n = 142; absolute difference, 16.7 percentage points [CI, 6.8 to 26.6 percentage points]; P = 0.002) (Supplement Table 3).
Table 1.
Cohort Characteristics
| Characteristic | Nirmatrelvir–Ritonavir (n = 72) | No COVID-19 Therapy (n = 55) | Standardized Difference |
|---|---|---|---|
| Median age (IQR), y | 57 (46 to 71) | 39 (31 to 57) | −0.83 |
| Gender, n (%) | 0.03 | ||
| Female | 54 (75) | 42 (76) | |
| Male | 18 (25) | 13 (24) | |
| Race, n (%) | 0.21 | ||
| White | 57 (79) | 40 (73) | |
| Black/African American | 7 (10) | 5 (9) | |
| Asian | 2 (3) | 3 (5) | |
| Other | 3 (4) | 4 (7) | |
| Unknown/missing | 3 (4) | 3 (6) | |
| Ethnicity, n (%) | 0.40 | ||
| Hispanic/Latino | 6 (8) | 4 (7) | |
| Not Hispanic/Latino | 62 (86) | 41 (75) | |
| Other/unknown/missing | 4 (6) | 10 (18) | |
| Median number of COVID-19 vaccines (IQR) | 4 (3 to 5) | 3 (3 to 4) | −0.64 |
| Median time since last vaccine (IQR), d | 132 (75 to 228) | 185 (133 to 315) | 0.47 |
| Immunosuppression, n (%)* | 0.59 | ||
| Absent | 49 (68) | 50 (91) | |
| Present | 23 (32) | 5 (9) | |
| COVID-19 variant, n (%) | 0.29 | ||
| BA.2† | 10 (14) | 10 (18) | |
| BA.5‡ | 19 (26) | 20 (36) | |
| XBB§ | 15 (21) | 9 (16) | |
| Other | 3 (4) | 2 (4) | |
| Incomplete‖ | 25 (35) | 14 (26) | |
| Reason for baseline test, n (%)¶ | 0.22 | ||
| Symptoms | 65 (90) | 45 (82) | |
| Exposure | 6 (8) | 7 (13) | |
| Screening | 1 (2) | 2 (4) | |
| Other | 0 (0) | 1 (1) | |
| Baseline test type, n (%) | 0.44 | ||
| PCR | 39 (54) | 41 (75) | |
| Rapid antigen | 33 (46) | 14 (25) | |
| Median Ct value on baseline test (IQR)** | 21.9 (17.2 to 26.4) | 23.2 (19.7 to 31.4) | 0.32 |
| Median first study viral load (IQR), log10 copies/mL | 4.5 (2.7 to 6.0) | 5.8 (4.4 to 6.6) | 0.39 |
| Median time from index PCR to enrollment (IQR), d | 1 (1 to 2) | 1 (1 to 2) | 0.09 |
| Median time from index PCR to first study viral load measurement (IQR), d | 2 (2 to 3) | 2 (2 to 3) | −0.01 |
| Median time from symptom onset to baseline test (IQR), d†† | 1 (1 to 2) | 2 (1 to 3) | 0.28 |
Ct = cycle threshold; PCR = polymerase chain reaction.
*Defined as the presence of an immunosuppressing condition or use of an immunosuppressing medication, as determined by physician chart review. Full details on these conditions are provided in Supplement Table 1.
†Includes BA.2 subvariants.
‡Includes BA.5 subvariants.
§Includes XBB subvariants.
‖Only genomes with ≥24 000 base pair sequence lengths were considered complete.
¶Participants could select multiple reasons for testing. We categorized them such that symptoms took precedence, followed by exposure and then screening.
**Data were missing for 48 participants (66%) in the nirmatrelvir–ritonavir group and 23 (42%) in the no-therapy group.
†† Seven participants (10%) in the nirmatrelvir–ritonavir group and 10 (18%) in the no-therapy group were asymptomatic or had missing data.
Figure 1. Virologic decay curves with semiquantitative viral cultures and quantitative viral load among persons with acute COVID-19 taking no therapy or N-R.

Black circles and dotted lines indicate persons without rebound, and green squares and dashed lines indicate persons with virologic rebound. Panels A (viral load) and B (viral culture) depict decay curves for those not receiving therapy. Panels C (viral load) and D (viral culture) depict persons who received N-R. Panels E and F are restricted to the 16 persons who had the primary outcome. Panel E shows viral load results with all available study time points, whereas panel F is restricted to viral load results at days 5, 10, and 14, as was done in prior studies (9). Using only these 3 time points to detect rebound resulted in detection of only 3 of 16 (19% [green squares]) of the total primary virologic rebound events with replication-competent virus. N-R = nirmatrelvir–ritonavir; TCID50 = median (50%) tissue culture infectious dose.
Figure 2. Comparative frequency of virologic rebound by N-R use, stratified by demographic and clinical characteristics (A), the number of days between the first positive SARS-CoV-2 test result and N-R initiation (B), and the number of days between symptom onset and N-R initiation (C).

For the subgroup comparisons, the bottom P values represent Fisher exact tests comparing rebound rates between those taking N-R versus no therapy. The upper P values represent Fisher exact tests comparing rebound rates among those taking N-R across the subgroups (e.g., those with immunosuppression who were taking N-R vs. those without immunosuppression who were taking N-R). N-R = nirmatrelvir–ritonavir.
In multivariable logistic regression models that included demographic and clinical characteristics, only N-R use remained associated with VR (adjusted odds ratio, 10.02 [CI, 1.13 to 88.74]; P = 0.038) (Table 2). There was a trend toward higher rates of VR with earlier N-R initiation after the index positive test result (29.3%, 16.7%, and 0%, respectively, when initiated on days 0, 1, and ≥2 after diagnosis; P = 0.089) (Figure 2, B) and with earlier N-R initiation after onset of symptoms (26.3% and 0%, respectively, when initiated ≤2 days and >2 days after symptom onset; P = 0.030) (Figure 2, C). We detected no post–N-R drug resistance mutations in the NSP5 protease gene (Supplement Figure 1).
Table 2.
Logistic Regression Model of Correlates of Virologic Rebound With Acute COVID-19
| Characteristic | Univariable Models |
Multivariable Models |
||
|---|---|---|---|---|
| Odds Ratio (95% CI) | P Value | Adjusted Odds Ratio (95% CI) | P Value | |
| Age | ||||
| <50 y | Reference | Reference | ||
| ≥50 y | 4.10 (1.11–15.21) | 0.035 | 1.50 (0.34–6.62) | 0.59 |
| Sex | ||||
| Male | Reference | Reference | ||
| Female | 0.48 (0.16–1.46) | 0.199 | 0.51 (0.15–1.72) | 0.28 |
| Vaccinations | ||||
| <3 | Reference | Reference | ||
| ≥3 | 6.40 (1.39–29.47) | 0.017 | 3.05 (0.61–15.37) | 0.176 |
| Immunosuppression | ||||
| Absent | Reference | Reference | ||
| Present | 0.79 (0.21–3.01) | 0.73 | 0.55 (0.13–2.33) | 0.42 |
| Treatment | ||||
| No COVID-19 therapy | Reference | Reference | ||
| Nirmatrelvir–ritonavir | 14.21 (1.81–111.29) | 0.011 | 10.02 (1.13–88.74) | 0.038 |
Recipients of N-R achieved initial culture conversion sooner than those who were not treated (P < 0.001) (Figure 3, A to C; Supplement Table 4). Days to final culture conversion differed between those taking N-R who had VR (median, 14 days [IQR, 13 to 20 days]) and those taking N-R who did not have VR (median, 3 days [IQR, 2 to 4 days]) (Figure 3, E and F; Supplement Tables 4 and 5). However, the number of days to final culture conversion was similar by N-R treatment use (Figure 3, D) because of the bimodal pattern of shedding experienced by those who had VR. Eight of 16 (50% [CI, 25% to 75%]) participants with VR reported symptom rebound; 2 were completely asymptomatic. Eight of 27 (30% [CI, 14% to 50%]) with symptom rebound had VR (Supplement Figures 2 and 3 and Supplement Table 6A). The diagnostic validity of symptom rebound was similarly poor in the entire cohort (Supplement Table 6A) and among N-R users (Supplement Table 6B).
Figure 3. Kaplan–Meier survival curves showing time from initial positive SARS-CoV-2 test result until initial negative viral culture result (panels A to C) and final negative culture result (panels D to F).

Panel A shows that there is a shorter time to the first negative culture result in those receiving N-R versus no therapy. Panels B and C show similar patterns in time to the initial negative culture result with the N-R group divided into those who had rebound (panel B) and those who did not (panel C). However, as shown in panel D, there was no difference in time to the final negative culture result between the N-R and no-therapy groups. This seems to be due to the prolonged time to the final negative culture result among N-R users who had rebound (panel E) because the time to the final negative culture result remained shorter in N-R users who did not have rebound compared with the no-therapy group (panel F). N-R = nirmatrelvir–ritonavir.
Discussion
Frequent monitoring by both PCR and viral culture during the acute stages of COVID-19 showed that VR with shedding of replication-competent virus occurred in approximately 20% of persons taking N-R and 2% of those who were not using therapy. Virologic rebound remained more common with N-R use after stratification by demographic and clinical characteristics, such as vaccination and immunosuppression status. Moreover, the VR phenomenon was associated with a substantial prolongation of shedding of replication-competent virus (median, 14 vs. 3 days). For patients with COVID-19 at low risk for severe disease, the possibility of prolonged shedding should be factored into the consideration of potential risks and benefits of treatment. Importantly, for moderate- to high-risk patients, the clinical benefits associated with N-R use, including protection from hospitalization and death, are well established (8–10). These data support the possibility of an N-R–specific VR phenomenon, which substantially increases the duration of shedding of replication-competent virus and has implications for post–N-R monitoring and isolation recommendations.
Strategies to prevent or mitigate the potential risk for rebound-associated transmission should be considered. Notably, in our cohort, 100% (57 of 57) of people who did not experience VR after N-R use had a negative culture result 5 days after completion of therapy. By contrast, most persons (14 of 15) who experienced VR after N-R use had a positive culture result at or around that same time point, including 2 who were asymptomatic. Rapid antigen testing 5 days after completion of therapy might help identify VR and might help determine who would benefit from prolonged isolation after N-R treatment (16).
We found a higher incidence of VR with N-R use than prior studies. When we restricted our analysis to 3 time points based on viral load, as was done in prior trials (9), we detected a 2.4% rate of VR, which is similar to the rate in prior studies, but notably missed 80% of VR events. This suggests that the discrepancy between the incidence of VR found in our study and that described in prior studies may result from differences in frequency of sampling and use of culture methods to detect VR.
Symptoms should not be relied on to detect or exclude VR. Two persons with VR had a complete absence of symptoms during the VR period, and fewer than half with VR had symptom rebound. Conversely, the majority of those who did have symptom rebound did not experience VR. Thus, strategies that use antigen testing to identify persons treated with N-R who develop VR and consequent prolonged shedding of viable virus would be most effective if they were deployed independent of symptom rebound.
The biological drivers of VR are unknown. Although subgroup analyses were limited by small samples, in this study, VR seemed to be less common among those who delayed therapy by 1 or 2 days after their first positive test result and among those who started therapy more than 2 days after symptom onset. This finding, in conjunction with the lack of drug resistance–associated mutations after VR events, raises the question of whether VR might result from incomplete viral eradication in some persons during the currently recommended 5 days of treatment (17). To test this hypothesis, future studies could compare the effect of longer durations of N-R therapy on rebound incidence. This finding would also be consistent with the hypothesis that early treatment blunts the development of a robust immune response, which is necessary for sustained viral clearance. Studies of immune responses in treated and untreated persons and studies evaluating longer durations of N-R therapy would help distinguish between these possible causes of VR (18).
Our study was limited by its observational design, with expected differences between those taking N-R and untreated persons based on treatment guidelines for N-R (4), and its relatively small sample size. Between-group imbalance and the relatively small number of outcomes, particularly in the untreated group (n = 1 in our cohort), among whom VR seems to be extremely rare, limited our ability to use other inferential methods (such as propensity score matching) or to make definitive causal inferences about N-R use and VR. We attempted to partially mitigate these concerns through stratification and adjustment for potential confounders. In these analyses, VR remained associated with N-R. Nonetheless, larger samples, preferably with more balanced groups, will be needed to more thoroughly assess the causal relationship. Finally, we used viral culture as a surrogate for transmission risk but did not measure contagiousness or transmission events directly.
These data support a relationship between N-R use and VR. Future work should elucidate the mechanistic pathways of VR, determine whether delays in initiation of N-R or longer courses of N-R may prevent VR among high-risk persons, explore relationships between VR and long COVID-19, and evaluate larger samples to identify the risk factors for VR that are associated with N-R.
Supplementary Material
Footnotes
This article was published at Annals.org on 14 November 2023.
Mr. Edelstein and Dr. Boucau contributed equally to this work.
Drs. Barczak, Lemieux, Li, and Siedner contributed equally to this work.
References
- 1. Hammond J, Leister-Tebbe H, Gardner A, et al.; EPIC-HR Investigators. Oral nirmatrelvir for high-risk, nonhospitalized adults with Covid-19. N Engl J Med. 2022;386:1397-1408. [PMID: ] doi: 10.1056/NEJMoa2118542 [DOI] [PMC free article] [PubMed] [Google Scholar]
- 2. Dryden-Peterson S, Kim A, Kim AY, et al. Nirmatrelvir plus ritonavir for early COVID-19 in a large U.S. health system: a population-based cohort study. Ann Intern Med. 2023;176:77-84. [PMID: ] doi: 10.7326/M22-2141 [DOI] [PMC free article] [PubMed] [Google Scholar]
- 3. Ganatra S, Dani SS, Ahmad J, et al. Oral nirmatrelvir and ritonavir in nonhospitalized vaccinated patients with coronavirus disease 2019. Clin Infect Dis. 2023;76:563-572. [PMID: ] doi: 10.1093/cid/ciac673 [DOI] [PMC free article] [PubMed] [Google Scholar]
- 4. National Institutes of Health. COVID-19 Treatment Guidelines: Therapeutic Management of Nonhospitalized Adults With COVID-19. Updated 21 July 2023. Accessed at www.covid19treatmentguidelines.nih.gov/management/clinical-management-of-adults/nonhospitalized-adults--therapeutic-management on 18 October 2023.
- 5. Gold JAW, Kelleher J, Magid J, et al. Dispensing of oral antiviral drugs for treatment of COVID-19 by zip code-level social vulnerability - United States, December 23, 2021–May 21, 2022. MMWR Morb Mortal Wkly Rep. 2022;71:825-829. [PMID: ] doi: 10.15585/mmwr.mm7125e1 [DOI] [PubMed] [Google Scholar]
- 6. Charness ME, Gupta K, Stack G, et al. Rebound of SARS-CoV-2 infection after nirmatrelvir-ritonavir treatment. N Engl J Med. 2022;387:1045-1047. [PMID: ] doi: 10.1056/NEJMc2206449 [DOI] [PMC free article] [PubMed] [Google Scholar]
- 7. Boucau J, Uddin R, Marino C, et al. Characterization of virologic rebound following nirmatrelvir-ritonavir treatment for coronavirus disease 2019 (COVID-19). Clin Infect Dis. 2023;76:e526-e529. [PMID: ] doi: 10.1093/cid/ciac512 [DOI] [PMC free article] [PubMed] [Google Scholar]
- 8. Ranganath N, O'Horo JC, Challener DW, et al. Rebound phenomenon after nirmatrelvir/ritonavir treatment of coronavirus disease 2019 (COVID-19) in high-risk persons. Clin Infect Dis. 2023;76:e537-e539. [PMID: ] doi: 10.1093/cid/ciac481 [DOI] [PMC free article] [PubMed] [Google Scholar]
- 9. Anderson AS, Caubel P, Rusnak JM; EPIC-HR Trial Investigators. Nirmatrelvir-ritonavir and viral load rebound in Covid-19. N Engl J Med. 2022;387:1047-1049. [PMID: ] doi: 10.1056/NEJMc2205944 [DOI] [PMC free article] [PubMed] [Google Scholar]
- 10. Wong GLH, Yip TCF, Lai MSM, et al. Incidence of viral rebound after treatment with nirmatrelvir-ritonavir and molnupiravir. JAMA Netw Open. 2022;5:e2245086. [PMID: ] doi: 10.1001/jamanetworkopen.2022.45086 [DOI] [PMC free article] [PubMed] [Google Scholar]
- 11. Deo R, Choudhary MC, Moser C, et al.; ACTIV-2/A5401 Study Team. Symptom and viral rebound in untreated SARS-CoV-2 infection. Ann Intern Med. 2023;176:348-354. [PMID: ] doi: 10.7326/M22-2381 [DOI] [PMC free article] [PubMed] [Google Scholar]
- 12. Pandit JA, Radin JM, Chiang DC, et al. The Coronavirus Disease 2019 Rebound Study: a prospective cohort study to evaluate viral and symptom rebound differences in participants treated with nirmatrelvir plus ritonavir versus untreated controls. Clin Infect Dis. 2023;77:25-31. [PMID: ] doi: 10.1093/cid/ciad102 [DOI] [PMC free article] [PubMed] [Google Scholar]
- 13. Boucau J, Marino C, Regan J, et al. Duration of shedding of culturable virus in SARS-CoV-2 Omicron (BA.1) infection. N Engl J Med. 2022;387:275-277. [PMID: ] doi: 10.1056/NEJMc2202092 [DOI] [PMC free article] [PubMed] [Google Scholar]
- 14. Goyal A, Reeves DB, Cardozo-Ojeda EF, et al. Viral load and contact heterogeneity predict SARS-CoV-2 transmission and super-spreading events. Elife. 2021;10. [PMID: ] doi: 10.7554/eLife.63537 [DOI] [PMC free article] [PubMed] [Google Scholar]
- 15. Wölfel R, Corman VM, Guggemos W, et al. Virological assessment of hospitalized patients with COVID-2019. Nature. 2020;581:465-469. [PMID: ] doi: 10.1038/s41586-020-2196-x [DOI] [PubMed] [Google Scholar]
- 16. Kirby JE, Riedel S, Dutta S, et al. SARS-CoV-2 antigen tests predict infectivity based on viral culture: comparison of antigen, PCR viral load, and viral culture testing on a large sample cohort. Clin Microbiol Infect. 2023;29:94-100. [PMID: ] doi: 10.1016/j.cmi.2022.07.010 [DOI] [PMC free article] [PubMed] [Google Scholar]
- 17. Perelson AS, Ribeiro RM, Phan T. An explanation for SARS-CoV-2 rebound after Paxlovid treatment. medRxiv. Preprint posted online 1 June 2023. doi: 10.1101/2023.05.30.23290747 [DOI]
- 18.A Study to Learn About the Study Medicines (Nirmatrelvir Plus Ritonavir) in People Aged 12 Years or Older With COVID-19 and a Compromised Immune System [clinical trial]. Accessed at https://clinicaltrials.gov/study/NCT05438602 on 20 April 2023.
Associated Data
This section collects any data citations, data availability statements, or supplementary materials included in this article.